1
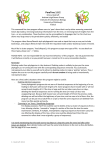
PART III
ADVANCED
FEATURES
9
GROUPS
Introduction
The feature group is an essential concept in the Melanie II software. When
several gels have been matched with a given reference gel, the latter provides a
unique numbering scheme for features across all gels. Each paired feature in a
gel image may then be associated to the corresponding feature ID in the reference gel. The set of features that are paired to one given feature in the reference gel forms a feature group. The group ID is the ID of the corresponding
feature in the reference gel.
The group is the basic element for exporting data as tables (see Exporting data
on page 10-1) and for producing reports and histograms of feature values
across a series of gel images.
Groups are automatically created when matching a set of gels with a reference
gel, but they may also be created and modified manually (see Editing groups on
page 11-5).
If you have matched your gels with multiple pairs, you may then obtain very
large groups, because a given feature may be paired to several features in the
reference gel. You should therefore use multiple pairs with care.
The Melanie II User Manual
9-1
9
GROUPS
Selecting groups
The main reasons to consider groups are to produce reports or histograms, to
analyze sets of gels and to export data to external programs. In such cases,
you first have to select the groups of interest. To select and display all groups,
choose Select → Groups → All Groups. To select one specific group, take
Select → Groups → By Group ID and specify the group ID when requested.
To select the groups one or more features belong to, select features using the
Feature tool, then Select → Groups → For Features. To get all features in a
given region, define a region with the Region tool and choose Select → Groups
→ In Region.
To select the groups that have features in at least a certain number of visible
gels, choose Select → Groups → In n Gels. In the pop-up window, specify the
minimum number of gels using the sliders1.
Reports on groups
Once you have selected a given number of groups (possibly all), you may display a report on them. Choose Show → Groups → Report On Groups. MelView will ask you to pick out the reference gel. If a master gel has already been
set, the latter is taken as the reference gel (see Master gels on page 14-2). You
then have to select one of the feature value types for the report (OD, Count,
VOL, AREA, %OD, %VOL, %Count).
The report shows information on each selected group, such as group ID and
value of each feature in the group. You may save or print the report.
Histograms on groups
A more visual way to look at groups is to display a histogram. To get histograms
on groups, choose Show → Groups → Histograms On Groups. Figure 9-1
1. In Unix, you can also use the arrow keys.
9-2
The Melanie II User Manual
GROUPS
shows histograms for two selected feature groups. The group IDs of the
selected groups are shown on the reference gel.
Figure 9-1. Histograms for two feature groups.
Release 2.2 note: you can display and print up to 200 groups at a time.
Groups with synthetic gels
One of the best ways to study the variation in protein expression among a
series of gels is to produce a synthetic gel by merging features from the studied
gels, then to match all gels with the synthetic one, and finally to produce reports
or histograms on groups (see Creating synthetic gels on page 12-4).
The Melanie II User Manual
9-3
9
9-4
GROUPS
The Melanie II User Manual
10
EXPORTING DATA
Groups of features are automatically created when you match a series of gels
with a reference gel. A group clusters features corresponding to the same protein across a set of gels. Groups may therefore be used to study the variations
in protein expression among a series of gels (see Data analysis on page 13-1).
They may be analyzed in reports or histograms (see Groups on page 9-1) or
they may be exported as tables in order to be used in external programs such
as Excel or other statistical packages.
MelView provides three export options. You may produce Outgroups tables and
standard ASCII tables for group data, or export ASCII lists with feature data
from selected gels.
Exporting to Outgroups
Outgroups is the table format used by the Melanie 1 heuristic and statistical
classification programs. To export feature values for selected feature groups,
follow these steps:
1 Select groups (see Selecting groups on page 9-2).
2 Choose File → Export.
3 Specify Outgroups.
4 Pick the reference gel for the groups.
5 Decide if you want to include data from the reference gel, or only from the other
gels.
6 Specify the names of the directory and file to export your data to.
7 Click OK.
The Melanie II User Manual
10-1
EXPORTING DATA
10
Exporting to ASCII tables
You may export the selected feature groups to ASCII tables. A table contains
tabulator separated columns. Each column represents one gel. The lines contain feature data, one group per line. You have to choose one feature value type
(OD, Count, VOL, AREA, %OD, %VOL, %Count). Perform the following steps:
1 Select groups (see Selecting groups on page 9-2).
2 Choose File → Export.
Specify Excel Table.
Pick the reference gel for the groups.
Pick one value type.
Decide if you want to include data from the reference gel, or only from the other
gels.
7 Specify the names of the directory and file for the ASCII table.
8 Click OK.
3
4
5
6
Exporting to ASCII lists
You may export the selected features of any number of gels. A list differs from a
table in that it does not contain feature group data, but feature data from individual gel images. Each list contains the quantification values for selected features, one gel after the other. Perform the following steps:
1 Select gel.
2 Select features in the selected gels.
3 Choose File → Export.
4 Specify Excel List.
5 Specify the file and directory names.
6 Click OK.
10-2
The Melanie II User Manual
11
EDITING
This chapter details some editing capabilities of the MelView program that have
not yet been addressed in the previous chapters.
Editing landmarks
We have already described how to create, modify and delete landmarks (See
Landmarks on page 4-1). Some other convenient options of MelView are the
copy / paste and match / paste facilities.
Copying / pasting landmarks
You may select landmarks in a given gel image, then copy them to another gel.
This is a simple means of creating a series of similar landmarks in a set of gels.
Perform the following steps:
1 Select landmarks using the Landmark tool or one of the Select
options.
→ Landmarks
2 Choose Edit → Landmarks → Copy Landmarks. This will copy the selected
landmarks into memory.
3 Select one or more gels you want to copy the landmarks to.
4 Choose Edit → Landmarks → Paste Landmarks. The copied landmarks will be
pasted into each of the selected gels.
5 Adjust the landmarks using the Landmark tool or the Edit
Modify Landmarks option.
→ Landmarks →
The Melanie II User Manual
11-1
11
EDITING
This option copies landmarks from one gel to the same absolute positions in
the other gels.
Matching / pasting landmarks
You may also copy some or all landmarks from spots in a reference gel to the
corresponding spots in a set of gels, without prior gel matching. This is an automatic means of creating a series of similar landmarks in a set of gels, by doing
a local matching of the detected features. Perform the following steps:
1 Select one or more gels you want to copy the landmarks to and the reference
gel.
2 Choose Edit → Landmarks → Match/Paste Landmarks. In the pop-up window,
select the reference gel. The copied landmarks will be pasted into each of the
selected gels.
3 If necessary, adjust the landmarks using the Landmark tool or the Edit → Landmarks → Modify Landmarks option.
Note that unlike the “copy” option, this option first performs a local matching in
order to copy landmarks to the best possible locations.
Note that a mismatch of the pasted landmarks is possible. You should verify the
obtained results.
Note also that this operation may take time due to the matching process.
Editing features
The usual way to create features is to detect them using Melanie’s powerful feature detection algorithm (see Detecting features on page 5-1). Nevertheless,
you may manually create, modify or delete selected features.
Adding features
You may add a feature as an ellipse that is inscribed in a pre-selected region:
1 Define a small region using the Region tool.
2 Choose Edit → Features → Add Feature. This creates an elliptic feature within
the selected region and displays a pop-up window with an enlarged representation of the new feature (Fig. 11-1).
3 Modify the new feature if necessary. To this purpose, use the left mouse button
to add pixels to the feature, the right mouse button1 to remove pixels, and the
middle mouse button2 to fill in holes.
1. On the Macintosh, hold down the Command key(
11-2
The Melanie II User Manual
) and the mouse button.
EDITING
4 Click OK. The new feature will be added to the gel.
Adding features from gel
You may add features from one specific gel to other gels, provided that they
were previously matched. Perform the following steps:
1 Select features in one gel using the Features tool or one of the Select
tures options.
2 Select one or more gels you want to copy the features to.
→ Fea-
3 Choose Edit → Features → Add Features From Gel.
4 In the pop-up window, select whether you want to add features shape only or
features shape and images. If the latter is chosen, another pop-up window lets
you specify the new file names. You may also add an extension or replace the
extensions of the original image files.
5 Click OK. The new features will be added to the gel.
Note that pairs will be automatically created between the selected features and
the newly created features. In this case, all gels must be in the same directory.
Modifying features
You may modify a feature’s shape:
1 Select a feature with the Feature tool.
2. On the PC mouse with 2 buttons, hold down the Control key and the right mouse button. On the Macintosh, hold down the Option key (
) and the mouse button.
The Melanie II User Manual
11-3
11
EDITING
2 Choose Edit → Features → Modify Features. This displays a pop-up window
with an enlarged representation of the selected feature (Fig. 11-1).
Figure 11-1. The feature modification window
3 Use the left mouse button to add pixels to the feature, the right mouse button1
to remove pixels, and the middle mouse button2 to fill in holes.
4 Click OK. The feature will be modified accordingly.
Deleting features
To delete selected features:
1 Select one or more features with the Feature tool.
2 Choose Edit → Features → Delete Features.
Editing labels
We have previously described how to create, modify and delete labels (See
Labels on page 6-1). As for landmarks, you may also copy / paste labels. You
may select labels in a given gel image, then copy them to another gel. This is a
simple means of creating a series of similar labels in a set of gels. Perform the
following steps:
1. On the Macintosh, hold down the Command key( ) and the mouse button.
2. On the PC mouse with 2 buttons, hold down the Control key and the right mouse button. On the Macintosh, hold down the Option key (
) and the mouse button.
11-4
The Melanie II User Manual
EDITING
1 Select labels using the Label tool or one of the Select → Labels options.
2 Choose Edit → Labels → Copy Labels. This will copy the selected labels into
memory.
3 Select one or more gels you want to copy the labels to.
4 Within these gels, select one or more features.
5 Choose Edit → Labels → Paste Labels. The copied labels will be pasted into
each of the selected features.
Editing pairs
Manually creating and deleting pairs has already been explained in Creating
starting pairs on page 8-3.
Editing groups
A convenient way to add pairs between a set of gels and a reference gel is to
create groups. You first have to set a master (See Master gels on page 14-2).
Choose DataBase → Set → Master and choose your reference gel as the
master. Select one feature in the reference gel and features in the other
selected gels. Choosing Edit → Groups → Group Features adds pairs
between the selected features and the selected feature in the reference gel.
To remove features that are all part of a given group, select a number of such
features. Choose Edit → Groups → Ungroup Features. This removes the
selected features from the group.
To completely remove groups, select groups (see Selecting groups on page 92) and take Edit → Groups → Delete Group.
Editing / showing comments
You can associate a textual comment to individual gels. To add a new comment
or modify an existing one, select one gel, then Edit → Comments. Write your
comment and click OK.
To display the comments for a gel, select one gel, then Show → Gels → Show
Comments.
The Melanie II User Manual
11-5
11
11-6
EDITING
The Melanie II User Manual
12
CREATING IMAGES
The image menu
This a special menu in the MelView program that processes existing 2-DE gel
images on the screen, but affects image files on disk. From this menu you may
create new gel images from the selected ones. You can duplicate, crop and filter gels, create new synthetic or Gaussian gels, and flip or scale as well as
erase gels. Except for the Erase option, all options in the Image menu create
new gels that are automatically opened and displayed in the MelView window.
Duplicating gels
You can create copies of selected gels and include existing objects such as features, labels or landmarks.
Select the gels you want to duplicate. Choose Image → Duplicate Gels. A popup window allows you to select the objects you want to duplicate with the gels.
Click OK. The Duplicate Gel window then lets you specify the new file names.
You may also add an extension or replace the extensions of the original image
files. Click OK. The gel image files will be copied to disk. They will then be
opened and displayed in the MelView window.
The Melanie II User Manual
12-1
12
CREATING IMAGES
Erasing gels
To delete existing gels, select them, then Image → Erase Gels. All selected
gels will be removed from the screen as well as from the disk. Associated feature pairs are deleted as well.
Cropping gels
Define regions in selected gels using the Region tool. Choose Image → Crop
Gels. The Crop Gels window asks you to choose what objects you want to keep
with the cropped image, such as features, landmarks, or labels. You may also
decide to keep the image alignment. Another pop-up window then lets you
specify the new file names. You may also add an extension or replace the
extensions of the original image files. Click OK. New gels will be created containing only the parts of the gels that lie within the specified regions, plus the
specified objects.
Filtering gels
MelView has been optimized for analyzing 2-DE gel images without prior image
processing or enhancement. If you analyze low quality images, MelView provides image processing filters that may help you to enhance the quality of your
images.
Nevertheless, keep in mind that after filtering images, feature quantification values will change and will be hard to interpret.
Select the gels you want to filter, then pick a filter in the Image → Filter Gels
options. This will create copies of the gels after they have been filtered, leaving
the original images unaffected. The following filters are available:
1 Smoothing - Smoothes the raw gel image. You have the choice between the
following four smoothing algorithms:
•
•
•
•
Gaussian smoothing
Diffusion smoothing
Polynomial smoothing
Adaptive smoothing
You will also be asked to choose how many times you wish the smooth filter to
be applied.
2 Histogram Equalization - Performs histogram equalization on the selected
gels. Various options are available, and the following five equalization algorithms are provided:
• Uniform
12-2
The Melanie II User Manual
CREATING IMAGES
•
•
•
•
Exponential
Rayleigh
Cube Root
Logarithmic
3 Remap Grey Levels - Creates copies of the selected gels with modified grey
level mapping (see Adjusting colors on page 3-8). This is especially useful if
you analyze images with a very low grey level range. For example, the
Melanie II feature detection algorithm may not work properly on an image with
only 25 grey levels. You can therefore remap it to an image with 4096 shades of
grey so that features may be correctly detected.
4 Contrast Enhancement - Applies a contrast enhancing algorithm to the
images in order to highlight small spots (Fig. 12-1). The following three contrast
enhancement algorithms are available:
• Quadratic
• Sigmoid
• Wallis
Figure 12-1. The original image (left) and the same image after contrast
enhancement (right).
5 Filter Background - Applies one of the two following background filtering algorithms to the selected gels, in order to eliminate gel background (Fig. 12-2):
• Subtraction of global image minimum
• Background subtraction by polynomial transformation
Figure 12-2. The original image (left) and the same image after
background subtraction (right).
The Melanie II User Manual
12-3
12
CREATING IMAGES
Creating synthetic gels
One of the best ways to study the variation in protein expression among a
series of gels is to produce a synthetic gel by merging features from the studied gels, then to match all gels with the synthetic one, and finally to produce
reports or histograms (see Reports on groups on page 9-2 and Histograms on
groups on page 9-2).
To create a synthetic gel, perform the following steps:
1 Decide what gels will be used for creating the synthetic gel. Select them using
the Select tool. The synthetic gel will contain features from these gels.
2 From these gels pick one out as reference gel. The synthetic gel will be based
on it. This means that features will first be taken from the reference gel, then
missing features will be extracted from the other gels. The resulting synthetic
gel will most likely look similar to the reference gel. You should therefore
choose a good quality gel image for the reference gel.
3 Perform pairwise matches of all gels chosen in step 1. For example, if you
chose the three gels GelA, GelB and GelC, and pick GelA as reference gel, you
will have to match GelA with GelB, GelA with GelC, and GelB with GelC.
4 Choose Image → Create Gels → Create Synthetic Gels.
5 When requested to do so, pick the reference gel and click OK.
6 A pop-up window lets you choose among 3 options. If you choose to Inherit
landmarks from reference gel, the landmarks from the reference gel will be
automatically copied to the synthetic gel. In the same way, if you choose to
Inherit labels from gels, the labels will be copied. Inherit pairs from gels will
copy the existent pairs between the reference gel and the matched gels. If the
last option is chosen, the synthetic gel will be necessarily saved in the same
directory as the matched gels.
7 Choose the group inheritance criteria by selecting the minimal number of gels
to which the groups must belong and by selecting only strongly connected
groups or not.
8 A pop-up window lets you create a report on groups and you have to select one
of the feature value types for the report (VOL, %VOL, AREA, %OD, OD).
The report gives basic information about the groups such as the feature values
in each original gel, their mean values and their standard deviations1. You may
save or print the report.
9 The Create Synthetic Gel window then lets you specify the new file name. Click
OK.
Note that the values assigned to the features in the synthetic gel are the mean
values of the features in their original gels.
1. On Unix, you have the possibility to discard the features with a standard deviation bigger then a certain value.
12-4
The Melanie II User Manual
CREATING IMAGES
The resulting synthetic gel will be created and displayed (Fig. 12-3).
Figure 12-3. A synthetic gel and its three contributing gels. The reference
gel is ECOLI.
You may now match your gel images with the synthetic one and perform a
quantitative study on their features, using feature groups (see Groups on page
9-1).
Creating Gaussian gels
MelView’s feature detection program lets you model features as Gaussian functions (see Detecting features on page 5-1). You may also create copies of gel
images, where spots have been replaced by the Gaussian models of the
detected features.
Select the gels you want to create Gaussian images from. Features need to be
already detected. Choose Image → Create Gels → Create Gaussian Gels.
The Create Gaussian Gels window lets you specify the new file names. You
The Melanie II User Manual
12-5
12
CREATING IMAGES
may also add an extension or replace the extensions of the original image files.
Click OK. Gaussian images will be created and displayed (Fig. 12-4).
Figure 12-4. Part of a gel and its Gaussian transform.
Flipping gels
If you have scanned images in the wrong direction, you may correct this by
applying the Flip Gels options. Select gels, then Image → Flip Gels and choose
one of the flipping options (Horizontally, Vertically or Both Directions). As for
other options in the Image menu, you will have to specify file names.
Scaling gels
The Image menu lets you create larger or smaller copies of selected gels.
Select gels, then Image → Scale Gels and pick one of the possible scaling factors (1/4, 1/2, 2 or 4). You may also choose Image → Scale Gels → Factor and
specify any custom scaling factor. As for other options in the Image menu, you
will have to specify file names.
Rotating gels
If you have scanned images in the wrong position, you can correct this by
applying the Rotate Gels. Select gels, then Image → Rotate Gels. A pop-up
window lets you specify the rotation angle with the sliders1. As for other options
in the Image menu, you will have to specify file names.
1. On Unix, you can also use the arrow keys.
12-6
The Melanie II User Manual
CREATING IMAGES
Inverting grey levels
The last option in the Image menu lets you change the grey levels of selected
gels by inverting them (reverse video). Select gels, then Image → Invert Grey
Levels On Gels. As for other options in the Image menu, you will have to specify
file names.
The Melanie II User Manual
12-7
12
12-8
CREATING IMAGES
The Melanie II User Manual
13
DATA ANALYSIS
Introduction
The analyze menu is a very useful function in Melanie II to compare sets of
gels. When several gels have been matched with a given reference gel, feature
groups are formed corresponding to the same proteins across the gels. This
menu allows to perform data analysis on sets of gels, in order to compute variations, similarities and differences within groups and among gels using statistical
methods.
One may perform Differential Analysis or Correspondence Analysis on one set
of gels, or alternatively define two classes of gels and analyze them by Differential Analysis or Student T Test.
Reports and histograms on groups
The simplest way to analyze features within groups still remains the use of
reports and histograms on groups. Once you have selected a given number of
groups, you may display a report on them. Choose Show → Groups → Report
On Groups (see Reports on groups on page 9-2). You may also visualize the
histograms on groups by choosing Show → Groups → Histograms On Groups
(see Histograms on groups on page 9-2).
The Melanie II User Manual
13-1
13
DATA ANALYSIS
Specifying classes
To identify variations between two populations of gels, you need to specify
which gels belong to which population by creating classes.
To create one specific class, select the gels that belong to it using the Select
tool or one of the Select → Gels menu options. Choose Analyze → Set Class.
A pop-up window asks you to enter a name for the class (for example, class A).
Repeat the same actions to create the second class.
If you want to cancel the class of one or many gels, select the gels and then
choose Analyze → Unset Class. To unset all classes at a time, choose Analyze
→ Unset All Classes.
Differential analysis with classes set
MelView lets you analyze variations in proteins through the simple method of
differential analysis. You must define two classes prior to performing this option.
Select a given number of groups among the gels (see Selecting groups on
page 9-2). Choose Analyze → With Classes Set → Differential Analysis. MelView will ask you to pick out the reference gel. If a master gel has already been
set, the latter is taken as the reference gel (see Master gels on page 14-2). You
then have to select one of the feature value types for the analysis (OD, VOL,
AREA, %OD, %VOL).
The Differential Analysis Options window lets you choose the minimum ratio to
be considered between the mean value of one class for a given group and the
mean value of the other class for the same group. Groups whose ratio is larger
than the chosen ratio remain selected, the others are unselected.
For example, considering the ratio default value (200), groups will be selected
where the mean value of one class is at least twice the mean value of the other
class. With ratio 100, the differential analysis will detect any variation within
classes. Choosing ratio 1000, groups will be selected where the mean value of
one class is at least 10 times larger than the mean value of the other class.
13-2
The Melanie II User Manual
DATA ANALYSIS
You may display a report on differential analysis results. Choose Show → Analysis → Report On Analysis. The report shows information on each selected
group, such as group ID and value of each feature in the group. It also shows
the ratio between the mean values of classes for the selected groups. The class
each gel belongs to is given in parentheses in the table heading (Fig. 13-1).
Figure 13-1. Report on Analysis
Student T Test with classes set
Once you have created two classes, representing differently expressed proteins
in two populations, you may also statistically analyze their significant differences with the Student T Test, see [reference 4].
Select a given number of groups among the gels (see Selecting groups on
page 9-2). Choose Analyze → With Classes Set → Student T Test. MelView
will ask you to choose the reference gel. If a master gel has already been set,
the latter is taken as the reference gel (see Master gels on page 14-2). You then
have to select one of the feature value types for the analysis (OD, VOL, AREA,
%OD, %VOL).
The T Test Options window lets you choose the T Test value to be considered in
a range between the mean value of one class for a given group and the mean
value for the other class on the same group. Groups whose T values for one
class are larger than the chosen threshold remain selected, the other ones are
unselected. This means that the remaining features allow to separate the two
classes with T value percent of confidence.
You may display a report on Student T Test results. Choose Show → Analysis
→ Report On Analysis. The report shows information on each selected group,
such as group ID and value of each feature in the group. It also shows the T
value for each group.
Note that the Student T Test is useful when dealing with more than 2 gels per
class.
The Melanie II User Manual
13-3
13
DATA ANALYSIS
Differential analysis without classes set
You can also compare gels using differential analysis without having previously
specified the classes. In this case, feature variations through different gels are
quantified.
Select a given number of groups among the gels (see Selecting groups on
page 9-2). Choose Analyze → Without Classes Set → Differential Analysis.
MelView will ask you to pick out the reference gel. If a master gel has already
been set, the latter is taken as the reference gel (see Master gels on page 142). You then have to select one of the feature value types for the analysis (OD,
VOL, AREA, %OD, %VOL).
A pop-up window lets you choose the minimum ratio to be considered between
the highest and the lowest values in groups. Groups with ratio values larger
than the chosen ratio remain selected, the others are unselected.
For example, considering the ratio default value (200), groups will be selected
where the largest feature is at least twice the value of the smallest feature in the
same group. Choosing ratio 1000, groups will be selected where there is at
least a tenfold ratio between the largest and the smallest spots respectively.
You may display a report on differential analysis results. Choose Show → Analysis → Report On Analysis. The report shows information on each selected
group, such as group ID and value of each feature in the group. It also shows
the ratio between the highest and the lowest values in groups.
Correspondence analysis without
classes set
Correspondence analysis compares gels without previously specifying the
existing classes. This method creates a projection onto a factorial space of
small dimensionality, in which gels and their significant features appear as
points. As a consequence, we can determine which gels are similar and which
are the characteristic features of these gels. In fact, the natural formation of
classes among the gels is highlighted with this method. For more details on correspondence analysis, see [reference 6].
Select a given number of groups among the gels (see Selecting groups on
page 9-2). Choose Analyze → Without Classes Set → Correspondence Analysis. MelView will ask you to pick out the reference gel. If a master gel has
already been set, the latter is taken as the reference gel (see Master gels on
page 14-2). You then have to select one of the feature value types for the analysis (OD, VOL, AREA, %OD, %VOL).
A pop-up window lets you choose the number of significant groups that will be
displayed in the results.
13-4
The Melanie II User Manual
DATA ANALYSIS
You may display a report by choosing Show → Analysis → Report On Analysis. The report shows information on groups, such as group ID and value of
each feature in the group. It also shows the amount by which each feature contributes to the constitution of the axis on the factorial space.
Another way to visualize the results of correspondence analysis is to display its
graphical representation of gels and features projected into the 2-D factorial
space. Choose Show → Analysis → Graphics on Analysis. A pop-up window
lets you choose to display gels, significant features or both.
Figure 13-2 shows the graphical results for 6 gels ([]) and 20 significative group
IDs (+). Gels that are found close to each other (apart from the scaling factor),
may correspond to the same class. You may print this screen.
Figure 13-2. Graphical result of correspondence analysis
Note that you can only have as visible gels those that are going to be treated by
correspondence analysis.
Reports on analysis
For each selected analysis method, you may display a report. Choose Show →
Analysis → Report On Analysis.
The report shows information on each selected group, such as group ID and
value of each feature in the group. It also shows the parameter value for each
feature to the corresponding method. You may save or print the report.
The Melanie II User Manual
13-5
13
13-6
DATA ANALYSIS
The Melanie II User Manual
14
DATABASES
2-DE databases
A key aspect of the MelView program is its ability to link features on gel images
to protein data in 2-DE databases. 2-DE databases contain data on proteins
identified on 2-DE images, such as pI and Mw, bibliographical references to
protein related literature, information on protein functions, etc. Several specialized 2-DE databases exist that Melanie II can work in conjunction with. MelView is especially well suited to work with data from the SWISS-2DPAGE global
2-DE database that is accessible over the Internet (see SWISS-2DPAGE master gels in this chapter).
Features on 2-DE gels analyzed with Melanie II may be linked to three different
types of 2-DE databases:
1 Private 2-DE databases - This is a database you build yourself by defining
your own master gel on which you add protein-related data. You may then
match gels with your master protein map.
2 The SWISS-2DPAGE database - Twelve master 2-DE maps of Human samples, as well as of Yeast and Escherichia Coli have been provided on the
Melanie II distribution CD-ROM. You may match your gels with any of these
master images and identify proteins on them. SWISS-2DPAGE master gels
may be updated by retrieving them from the Expasy FTP server.
3 Remote 2-DE databases - If your computer is connected to the Internet, you
may link your gels to remote databases such as SWISS-2DPAGE, and remotely
retrieve protein data related to features on your gels.
The Melanie II User Manual
14-1
14
DATABASES
The feature label
The label is a small tag associated to a feature and identifying the corresponding protein (see Labels on page 6-1). The label holds the protein’s accession
number (AC) and name taken from the 2-DE database, or it may just contain
any textual data. The label is the link between the gel and the 2-DE database.
Note that two labels are the same if they have the same AC.
Master gels
A master gel contains a label for each identified protein. It holds the protein’s
accession number (AC) and its name (Fig. 14-1). You may define your own
Figure 14-1. Labels on a master gel - with ACs (left) - with names (right).
master gels by creating labels for the identified proteins and adding their names
and ACs (accession or unique identification number). The ACs and names may
be taken from existing databases, such as the SWISS-2DPAGE 2-DE database, the SWISS-PROT protein sequence database, or even nucleotide
sequence databases such as EMBL or Genbank. Alternatively, you may match
your images with existing master gels, such as the SWISS-2DPAGE master
maps provided on the Melanie II distribution CD-ROM.
To work with master gels in MelView you have to designate the master among
the open gels. Choose Database → Set → Master and click on the master
image, then OK. The master’s name is now printed with a red background.
SWISS-2DPAGE master gels
SWISS-2DPAGE master gels contain labels for all proteins corresponding to
entries in the SWISS-2DPAGE 2-DE database. Each label holds the accession
number (AC) of the database entry, as well as the entry’s short name. For
example, the Human Plasma protein map possesses a label whose AC is
P02768 and name is ALBU_HUMAN, for each feature that corresponds to albu-
14-2
The Melanie II User Manual
DATABASES
min. SWISS-2DPAGE entries contain detailed data on the related proteins,
such as the protein’s full name, bibliographical references, annotations (protein
function, pathological variations, etc.) and the pI and Mw of the related spot on
the 2-DE maps. They also hold cross-references to other databases such as
the SWISS-PROT protein sequence database (that in turn has cross-references to numerous other databases such as nucleotide sequence databases,
disease databases, etc.) or the YEPD Yeast 2-DE database and the
ECO2DBASE E. Coli 2-DE database (Fig. 14-2).
Figure 14-2. The SWISS-2DPAGE entry for human Apo E.
In addition to labels containing data from the SWISS-2DPAGE database, features in SWISS-2DPAGE master gels also present the particularity of possessing serial numbers, an identification number that uniquely links a feature on
the gel and protein data in the SWISS-2DPAGE database to one spot on a specific SWISS-2DPAGE master gel. The serial number has the form 2D-xxxxxx,
where x is a digit or an upper case letter. For example, 2D-000C5W and 2D000C6F identify two spots on the Human Plasma protein map that have been
identified as Apo E (Fig. 14-2).
The serial numbers are embedded in the SWISS-2DPAGE master gels and
may not be changed. You may at any time retrieve updated master gels from
The Melanie II User Manual
14-3
14
DATABASES
the Expasy FTP server (ftp.expasy.ch) in the directory /pub/Masters. The serial
numbers are shown in reports on features (see Reports on features on page 57).
Selecting CH2D features
You can select the features for all identified proteins in a SWISS-2DPAGE master by choosing Database → Features → Select CH2D Features.
Adding labels from a master
After having matched gels with a master, you may copy some or all labels from
the master gel to any of the matched gels. Select one or more features in any
matched gels, then take Database → Labels → Add From Master. MelView will
look for features in the master that are paired to the selected ones. It will then
copy their associated labels to the selected features. The selected features will
thereafter have the same labels as their paired features in the master. This
operation will in this way identify proteins on your gels. You may then display
the ACs or names of these proteins, or use the database query options
described in Querying a remote database through the Internet on page 14-5.
Updating labels from a master
This option lets you update the content of labels by copying data from related
labels in the master. Select the features, whose labels you want to update.
Then take Database → Labels → Update From Master. The labels associated
to the selected features will be updated. This operation affects the AC as well
as the names of the labels.
Deleting labels from a master
Like the two options described above, this option also works on selected features. It deletes labels associated to selected features that are identical to the
corresponding labels in the master (identical = same AC). Select features, then
choose Database → Labels → Delete From Master.
14-4
The Melanie II User Manual
DATABASES
Querying a remote database through the
Internet
In MelView you may work with your own master images, or you can link your
gels to any SWISS-2DPAGE master gels. An interesting possibility to link your
images to 2-DE databases is offered if your computer is connected to the Internet. You may retrieve data from remote 2-DE databases for any label containing
a valid accession number (AC). Also, you may automatically update the label
names for these proteins. You have to follow the steps described in the remaining part of this chapter.
Setting the master
The master gel serves as the link to the remote database. You have to designate the master gel prior to querying the database. A gel may be master if it
contains at least one label with a valid AC. Take Database → Set → Master,
then choose the master from the open gels. Click OK.
Setting the browser (Unix only)
Unix
To retrieve data from remote databases you must have the Netscape Navigator® World-Wide Web browser installed. You also have to set the full path name
for Netscape. Choose Database → Set → Browser and enter the program
name and path. The program name alone may be sufficient if the directory in
which Netscape resides is part of your path.
This setting may also be made permanent from the File
option.
→ Preferences menu
Setting the server
You can choose the World-Wide Web server on which the remote database
resides. The server has to host a federated 2-DE database [see reference 14],
i.e. a 2-DE database that may be remotely queried from within 2-DE analysis
software. An example of such a WWW server is the Expasy WWW server.
Choose Database → Set → Server and enter the server’s host name. For
ExPASy, enter:
www.expasy.ch
Setting the database
You also have to set the name of the remote database. Choose Database →
Set → Database and enter the database name. On Expasy, you have the
choice of the SWISS-2DPAGE 2-DE database (type: SWISS-2DPAGE) and the
SWISS-PROT protein sequence database (type: SWISS-PROT).
The Melanie II User Manual
14-5
14
DATABASES
A list of federated 2-DE databases and servers is maintained on the WORLD2DPAGE WWW page at:
http://www.expasy.ch/ch2d/2d-index.html
Querying the database
To query the remote database, select one feature that has a label with a valid
accession number (AC). Choose Database → Query Server. This will call the
Netscape program on your computer that is going to automatically retrieve the
corresponding entry from the remote database. For example, if you have set
the database SWISS-2DPAGE on the www.expasy.ch server, and you select a
feature whose label has the accession number P02649, then if you do Database → Query Server, you will obtain in Netscape the entry for Human Apo E
(see Fig. 14-2).
Updating protein names
On most 2-DE databases, the accession number is the unique entry identifier,
while the protein name may change. It is therefore strongly recommended to
use ACs. MelView provides a way of automatically updating the protein names
in your gels. Select a gel containing labels with valid ACs. Set it as the master
gel. Select all labels you want to update. Choose Database → Labels →
Update Short Name from Database. For each selected label, MelView will
request its short name from the remote database (using the AC as identifier)
and then update the label accordingly.
14-6
The Melanie II User Manual