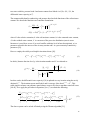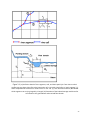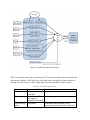
1
Process-based Adaptive Watershed Simulator (PAWS) Theoretical Documentation and User Manual Version 1.0 Chaopeng Shen Civil and Environmental Engineering Pennsylvania State University [email protected] 1 Table of Contents 1. About the model.......................................................................................................................... 4 2. Overview ..................................................................................................................................... 4 2.1. Model domain and processes (CLM is not described in this document) ......................... 5 2.2. Package organization ....................................................................................................... 6 2.3. Data structure ................................................................................................................... 7 2.4. Flow of model processes .................................................................................................. 8 2.5. Input and Output .............................................................................................................. 9 3. Theories and Implementations .................................................................................................. 10 3.1. Nomenclature ..................................................................................................................11 3.2. Grid discretization illustration ....................................................................................... 14 3.3. Evapotranspiration ......................................................................................................... 14 3.4. Canopy interception and depression storage.................................................................. 14 3.5. Overland flow ................................................................................................................ 15 3.6. Channel flow .................................................................................................................. 16 3.7. Soil water flow/Vadose zone .......................................................................................... 17 3.8. Groundwater flow .......................................................................................................... 20 3.9. Overland/Channel exchange .......................................................................................... 21 3.10. Groundwater/Channel exchange .................................................................................. 24 3.11. Surface runoff............................................................................................................... 25 4. Users Manual ............................................................................................................................ 27 4.1. Getting PAWS ................................................................................................................ 27 4.2. Prerequisites ................................................................................................................... 27 4.3. Setting up PAWS data Reader and Input System - Matlab (PRISM)............................. 28 4.4. Compile and Debug PAWS ............................................................................................ 28 4.5. Compilation -- Interactive mode .................................................................................... 31 4.6. Program structure ........................................................................................................... 33 4.7. Fortran code organizations ............................................................................................. 34 4.8. Input preparation ............................................................................................................ 35 4.8.1. Starting the interactive environment ................................................................... 35 4.8.2. Loading the data.................................................................................................. 36 4.8.3. Setting up the grid ............................................................................................... 38 4.8.4. Discretization ...................................................................................................... 40 4.8.5. Setting up solution schemes and time steps ........................................................ 41 4.8.6. Final model set up ............................................................................................... 43 4.8.7. Saving and Loading model ................................................................................. 44 4.8.8. Monitoring points and observation files ............................................................. 44 4.8.9. Set up model execution folder ............................................................................ 44 2 4.9. Running the model in standalone mode ......................................................................... 44 4.10. Post-processing and visualizing data ........................................................................... 45 4.10.10. Grid and channel visualization........................................................................ 45 4.10.11. Handling of time series data............................................................................ 51 4.11. Construct and run conceptual models .......................................................................... 51 4.12. Column mode ............................................................................................................... 51 4.13. Batch operation utilities ............................................................................................... 51 4.14. Calibration on High Performance Computing systems ............................................... 51 4.15. Useful utilities .............................................................................................................. 51 5. Input/Output documentation ..................................................................................................... 54 5.1. General source datasets for PRISM ............................................................................... 54 5.2. PRISM output and data structure ................................................................................... 58 5.3. Input files for the Fortran executable ............................................................................. 58 5.3.1. Driver control file ............................................................................................... 60 5.4. Output files of the Fortran executable ........................................................................... 62 5.4.1. Standard output files ........................................................................................... 62 5.4.2. Output of spatial fields ........................................................................................ 64 6. Function References.................................................................................................................. 66 7. Variable References .................................................................................................................. 80 3 1. About the model As an effort to help tackle water resources problems in the new era, PAWS was initially developed as Dr. Chaopeng Shen's Ph.D. dissertation topic at Computational Hydrology and Reactive Transport lab, Michigan State University, with help from labmate Jie Niu. The PAWS model is now being further extended and enhanced in both Dr. Chaopeng Shen’s Multi-scale Hydrology and Processes (MHP) group at Civil and Environmental Engineering, Pennsylvania State University and Dr. Phanikumar Mantha’s Hydrology and Reactive Transport lab at Civil and Environmental Engineering, Michigan State University. Starting in 2012, the land surface components (energy, phase change, vegetation, ET) of the model have been replaced by the Community Land Model (CLM). The model has become much more powerful because of the comprehensive physics available in CLM, which are being updated every year. If you used PAWS in your research, please cite the following publications in your research Shen, CP.*, J. Niu and K. Fang, Quantifying the Effects of Data Integration Algorithms on the Outcomes of a Subsurface - Land Surface Processes Model, Environmental Modeling & Software., doi: 10.1016/j.envsoft.2014.05.006 (2014) Shen, CP.*, J. Niu and M.S. Phanikumar, Evaluating Controls on Coupled Hydrologic and Vegetation Dynamics in a Humid Continental Climate Watershed Using a Subsurface - Land Surface Processes Model, Water Resources Research, 49(5), pp. 2552 - 2572, doi: 10.1002/wrcr.20189 (2013) Shen, CP. and M.S. Phanikumar*, A Process-Based, Distributed Hydrologic Model Based on a Large-Scale Method for Surface - Subsurface Coupling, Advances in Water Resources, 33(12), pp. 1524 - 1541, (2010) DOI: 10.1016/j.advwatres.2010.09.002 2. Overview This section attempts to give the user concise and general knowledge about the domains, processes, data structure and program organizations of PAWS. Therefore it is a must-read for first-time users. PAWS comes in two packages, the Fortran executable pack (PAWS) and the PAWS data Reader and Input System - Matlab (PRISM). PAWS has been compiled and executed on Windows 32bit and 64-bit systems, Linux and Macintosh. PRISM is a package that contains GIS data interfacing, input preparation utilities, model simulation, data output facilities and visualization functionalities. PAWS can be executed either in Matlab interactive environment, where 4 interaction, extension, visualization and idea-prototyping is easy, or as a pure Fortran program in the absence of MATLAB for maximum performance. On the scientific level, The design concepts of PAWS are to create a model that solves the physically-based conservative laws in a computational efficient manner, which allows applications across of range of spatial (from 1 km2 to 100,000 km2) and temporal scales, while realistically captures the major dynamics of the hydrologic system. On the implementation level, the author attempted to build an object-based, open-ended platform where ideas can be quickly tested with the support of a sufficient peripheral operations. It is wished that the model framework and its highly flexible, intelligible and extensible structure can be utilized by other scientists as a community tool. The model has good scalability and will be easily parallelized with comparably less effort. 2.1. Model domain and processes (CLM is not described in this document) PAWS solves physically-based conservative laws for major processes of the hydrologic cycle, including surface energy fluxes, ET, simple vegetation growth, groundwater interception, overland flow, unsaturated soil water flow, groundwater flow and the exchanges among these domains. The processes are graphically presented in Figure 2.1 and summarized in Table 1. The eight compartments where most calculations take place are, respectively, surface ponding layer, canopy storage layer, impervious cover storage layer, overland flow layer, snowpack, soil moisture, groundwater aquifers and stream channels. The major state variables are summarized in Table 2. Figure 2.1. Definition sketch of the model. T: transpiration, p: precipitation, EO Evaporation from overland flow/stream, EB: evaporation from bare soil; I: infiltration; R: Recharge 5 Table 1. Modeled Processes Processes Governing Equations Snowfall Accumulation and melting Mass and energy balance (UEB) Canopy interception Bucket model, storage capacity related to Leaf Area Index (LAI) Specific depth Depression Storage Runoff Infiltration/Exfiltration Manning’s formula + Kinematic wave formulation+Coupled to Richards equation Coupled to Richards equation Overland flow 2D Diffusive wave equation Overland/Channel Exchange Weir formulation Channel network Dynamic wave or diffusive wave Evapotranspiration Penman Monteith + Root extraction Soil Moisture Richards equation Lateral Groundwater Flow quasi-3D Recharge/Discharge (Vadose zone/Groundwater interaction) Stream/Groundwater interaction Non-iterative coupling inside Richards equation Conductance/Leakance Vegetation Growth Simplified Growth Cycle Table 2. Major state variables and their symbols State Variable Soil Water Content, Pressure Head* Overland Flow Depth* Canopy Storage Snow Water Equivalent, Snow Energy Content Groundwater Head River Cross Sectional Area Ponding storage on impervious cover Symbol Θ h H CS SWE, U H Ac hi Unit (-), m m m m, kJ/m2 m m2 m 2.2. Package organization The source files are PAWS are organized into several sub-folders, which are explained below, where {$PRISM$} is the installation directory. {$PRISM$ } stands for the root folder of PAWS, where the files are all extracted. {$PRISM$ }\grid: grid generation scripts that are used to initialize memory storage for each component 6 {$PRISM$ }\GUI: GUI scripts that generates user interface for data preparation, visualization and post-processing {$PRISM$ }\lib: general and re-usable library subroutines that realize particular functionalities {$PRISM$ }\mex: Fortran source files and compiled mex files {$PRISM$ }\obsolete: obsolete files used during development stage {$PRISM$ }\plot: functions and scripts used to visualize results {$PRISM$ }\prep: functions used to read input data and prepare data for the model {$PRISM$ }\problems: controlling scripts for test problems {$PRISM$ }\files: contains some input parameter files, e.g., rainfall hyetograph, snow depletion curve, etc. The functionalities of the each function or script are explained in the Section 4 as well as the Section 6 Function Reference. 2.3. Data structure Major functions of PAWS work on several Matlab global variables (also ported into Fortran modules with similar names), namely, w, g, r, standing for watershed, land grid and river. These global variables (stored as structure arrays) contain the data for the whole model, including parameters and state variables. The use of structures allows the model to be written in an objectbased fashion and greatly enhances the portability, readability and expandability of the model. On the other hand, as these data are stored in .mat format, they can be easily read, analyzed, visualized, modified and saved. We do not enforce the computer science concepts of encapsulation or inheritance. They are soft requirements that are generally followed in the program development. This makes it easy for scientists from other background to add their own modules. Such a design makes the model very expandable and very suited for prototyping ideas. The three global variables then contain sub-structures (fields of the objects, retrieved by the period sign ‘.’). Each of these sub-structures serves a specific purpose: either they contain a selfsufficient datasets for a hydrologic component or they wrap the data for a specific task. The three major objects and their sub-structures are described as in Figure 2.2. w(watershed master object). g (land master object). r (river master objects. There are most likely multiple elements in the r array for different rivers in the basin). 7 Prob: In addition, in the PRISM-produced matName.mat file (not in the Fortran-saved mat files), there is also a variable Prob. Prob contains various input datasets, including GIS data, at model creation time. Prob is not used during execution time and will not be saved in Fortran-output mat files. More complete descriptions of names and purposes of the fields are in Section 7. Variable References. Figure 2.2. The hierarchical internal data structure in PAWS 2.4. Flow of model processes The flow of the model processes is illustrated in Figure 2.3. Flow chart on the function and subroutine level is given in Section 4: Implementation and User Instructions. The model marches using the calendar days. The hydrologic processes, including Evaporation, transpiration, snowpack and unconfined aquifer are updated on an hourly basis. The vadose zone model solves infiltration, runoff and depression storage together with soil moisture. It uses an hour as a base time step but adjusts it depending on flow condition and convergence rate. The overland flow and river network also have the ability to adaptively select time steps to ensure stability and computational efficiency. 8 2.5. Input and Output The main input to the model is a matlab .mat file that is generated by the data preparation utilities GUI. This .mat file can be read easily by Matlab. In the Fortran mode, the variables stored in the .mat file are read into Fortran via a MAT-file interface that are Fortran codes that can be executed independently of Matlab. There are variable output file in the form of .mat files and ASCII text files. These files are described in details in section 5. Figure 2.3. Program Flow Chart of processes for the proposed model. Enclosed in dashed box are the components done in CLM 9 3. Theories and Implementations This section explains the theories behind the current version of PAWS, governing equations, discretizations, solution and coupling schemes. Some implementation details are appended to each component to further help clarify the codes. Starting in 2012, the land surface components (energy, phase change, vegetation, ET) of the model have been replaced by the Community Land Model (CLM). The model has become much more powerful because of the comprehensive physics available in CLM, which are being updated every year. However, it has since then become very difficult to keep with the theoretical documentation here. Therefore, in this chapter, we have removed descriptions for the land surface components. Users are recommended to read the following papers and documents to understand the theories of the model: Initial PAWS model and hydrologic flow components: Shen, CP. and M.S. Phanikumar*, A Process-Based, Distributed Hydrologic Model Based on a Large-Scale Method for Surface - Subsurface Coupling, Advances in Water Resources, 33(12), pp. 1524 - 1541, (2010) DOI: 10.1016/j.advwatres.2010.09.002 More algorithmic details in: A process-based distributed hydrologic model and its application to a Michigan watershed, PhD Dissertation, Chaopeng Shen, Civil and Environmental Engineering, Michigan State University (2009) Coupling with CLM and wetland module: Shen, CP.*, J. Niu and M.S. Phanikumar, Evaluating Controls on Coupled Hydrologic and Vegetation Dynamics in a Humid Continental Climate Watershed Using a Subsurface - Land Surface Processes Model, Water Resources Research, 49(5), pp. 2552 - 2572, doi: 10.1002/wrcr.20189 (2013) GUI and data integration algorithms: Shen, CP.*, J. Niu and K. Fang, Quantifying the Effects of Data Integration Algorithms on the Outcomes of a Subsurface - Land Surface Processes Model, Environmental Modeling & Software., doi: 10.1016/j.envsoft.2014.05.006 (2014) Community Land Model technical documentation: http://www.cesm.ucar.edu/models/cesm1.2/clm/CLM45_Tech_Note.pdf 10 3.1. Nomenclature These symbols are valid within the scope of Section 3: Theories and Implementations Symbol Physical Meaning Unit a van Genuchten soil water retention parameter m-1 d Fractional leaf cover of the i-th RPT (-) f Root efficiency function (-) fe Soil evaporation water constraint function (-) g Empirical fitting parameter for root efficiency function (-) h Free surface elevation (m) l van Genuchten pore tortuosity parameter (-) qf Field Capacity (-) rr Residual water content (-) qs Saturated water content (-) qw Wilting point (-) A Horizontal cell area, equal to Dx Dy m2 Ab Area of channel that spans the land cell m2 Ac Channel cross-sectional area m2 Am -1 Coefficients for Generalized Green and Ampt Equation for the (m-1)-th layer m b Thickness of aquifer m Bm -1 Coefficients for Generalized Green and Ampt Equation for the (m-1)-th layer m Cd Stability coefficient for overland flow routing (-) 11 C (h ) Soil Differential water capacity m-1 CS Canopy storage m dET Total ET demand from a cell md-1 Dp Percolation to deeper layers md-1 DR Vertically integrated lateral drainage term md-1 E Soil Evaporation md-1 EDF Soil evaporation distribution function (-) Eg Ground surface evaporation md-1 Esub Sublimation md-1 f Landuse fraction of a plant type (-) F Cumulative infiltration for Green and Ampt equation m Fg Runoff to overland flow domain md-1 g Gravitational acceleration ms-2 ge Soil evaporation distribution function (-) H Elevation of water table (or Hydraulic Head) m h¢ Steady state pressure head of saturated soil layers as a function of water table location and regional groundwater flow m ho Minimum depth of water for surface runoff to occur (vegetation understory storage, m) m hr River flow depth m IFC Soil infiltrating capacity md-1 Inf Infiltration md-1 Kc Alfalfa-based crop coefficient (-) 12 K (h ) Vertical soil unsaturated hydraulic conductivity md-1 km -1 Harmonic mean saturated soil hydraulic conductivities of layers 1 through m-1 md-1 Kr River bed conductivity md-1 Kxy Lateral hydraulic conductivity md-1 l Length of flow path for runoff contribution to overland flow domain m LAI Leaf Area Index (-) Lc Length of channel inside land cells m Lm -1 depth to the bottom of the soil layer m-1 m n Time level (-) N van Genuchten pore-size distribution parameter (-) nm Manning’s coefficient (-) nRPT Number of modeled plant types in a horizontal cell (-) P Precipitation md-1 q Regional groundwater flow term in the vadose zone equation md-1 qgc Groundwater contribution to river m2s-1 qoc Overland contribution to river m2s-1 qt Tributary contribution to river reach m2s-1 R Recharge to aquifer md-1 rET Alfalfa-based reference ET calculated using Penman_Monteith eq. md-1 RPT Representative Plant Type (-) rt Root distribution function for ET (-) S Storativity of aquifer (-) 13 Sf Frictional slope (-) SNOM Snowmelt md-1 S0 Average slope (-) SW Average suction of wetting front m T Transmissivity m2d-1 TP Transpiration md-1 u,v Water velocity (overland flow and channel flow) ms-1 ul Flow velocity of runoff contribution to overland flow domain md-1 w River width m W source/sink term including root extraction, pumping and soil evaporation md-1 WFP Wetting front location (depth from soil surface) m Wrmx Maximum canopy storage md-1 zd Depth of soil layer m zb River bed elevation m DZb Thickness of the river bed material m 3.2. Grid discretization illustration Please read the attached paws_structure_sketch document for an illustration of paws grid and various other concepts. 3.3. Evapotranspiration Please refer to the CLM technical documentation 3.4. Canopy interception and depression storage Please refer to the CLM technical documentation 14 3.5. Overland flow Overland flow is modeled using the two-dimensional Diffusive Wave Equation (DWE) [44]: ¶h ¶(hu ) ¶(hv ) + + =s ¶t ¶x ¶y 0 = -g ¶h + g(S 0x - S f ) ¶x 0 = -g ¶h + g(S 0y - S f ) ¶y (1) where, h is the overland flow water depth (m), u and v are the x- and y-direction water velocities (ms-1), g is the gravitational acceleration (ms-2), s is the source term (ms-1), S0 is the slope (-), Sf is the frictional slope (-). Some researchers argue that the use of Equation (1) implies sheet flow conceptualization of overflow. However, if we take h as an effective depth and slope s as the effective slope of the cell, Equation (1) may also be interpreted as rill flow conceptualization, governed by the same equation on a macro-scale. Surface flow components need to be run using small time steps in order to satisfy the Courant condition. A time step of 10 minutes is commonly employed (e.g. [37]). For long-term simulations, the computational efficiency of the surface flow modules is of great importance. An accurate, efficient and robust Runge-Kutta Finite Volume (RKFV) scheme is used to solve the Diffusive Wave equation for long term surface flow routing. Eq. (1) can be discretized in space as: éh ù hi, j -1/2vi, j -1/2 - hi, j ,, ¶h i -1/2, j ui -1/2, j - hi ,, 1/2, j ui 1/2, j 1/2vi, j 1/2 ú ê = -ê ,, ú si, j ¶t Dx Dy ê ú ë û (2) where s is the source term for overland flow including runoff and groundwater exfiltration (m/s). We can compute ui ,1/2, j and vi , j ,1/2 , the velocities at the cell interfaces, from hi ,, and hi , j 1/2 using the Manning’s equation. Given the water depth on two sides of the 1/2, j boundary as hL and hR , and the free surface elevation as ηL and ηR, we use the following logic to determine the flow depth at the boundary, h1/2: 15 ì ì ï ï ï ï ï ï ï ïY , ï Y , hL ? 0 ? í ï ï ï ï ï ï ï N, ï ï ï î hL ? hR ? í ì ï ï ï ï ï ï ï ïY , ï N , hR ? 0 ? í ï ï ï ï ï ï N, ï ï ï ï î ï î ìY , h ï ï 1/2 = 0.5 * (hL , hR ) Cd hL ? hR ? í ï N , h1/2 = hL ï ï î h1/2 = 0 ìY , h ï ï 1/2 = 0.5 * (hL , hR ) Cd hR ? hL ? í ï N , h1/2 = hR ï ï î h1/2 = 0 (3) The interface flow depth in the y direction can be calculated using the same approach. The first condition, hL ? hR ? , is to decide the upwind direction. For the DWE, the free surface elevation always determines the direction of flow. The second conditional statement is to decide if the upstream cell is dry. The third selection, CdhL > hR?, (Cd is a stability coefficient ) is to ensure the interface flux does not exceed what is available for outflow during the explicit updating. Larger Cd allows more frequent choice of the more accurate average depth, instead of the upwinding water depth which is more diffusive but stable. From extensive numerical tests we found a value of Cd = 4 worked well for almost all scenario. Once h1/2 is obtained, we use it in Eq. (4) to calculate interface velocities u and v using the Manning’s formula [44-45]: ii 1 2/3 i ,1, j - i, j = sgn( ) ui ,, ii h 1/2, j i 1, j i, j n i ,1/2, j Dx m i, j ,1/2 1/2 (4) The y-direction velocity is computed similarly. After computing the velocities, equation (2) is used to march in time using the Runge Kutta method. Such a design is chosen mainly for its efficiency, simplicity and stability which make it practical for large scale and long term simulations. A semi-implicit semi-Lagrangian (SISL) scheme [46-47] is also implemented to route water through surface water features such as shallow lakes and wetlands. Currently it is not used for long term overland flow simulation due to computational expenses, but it is reserved for the modeling of shallow water bodies in future versions.\ 3.6. Channel flow The channel flow model is based on the one dimensional Diffusive Wave equations: ¶Ac ¶t + 0 = -g ¶(uAc ) ¶x ¶hr ¶x = Pw + qoc + qgc + qt (5) + g(S 0x - S f ) 16 where Ac is the cross-sectional area of the channel (m2), u is the flow velocity (ms-1), h is the river stage (m), qoc is lateral inflow from overland flow (m3 m-1s-1), qgc is the groundwater contribution (m3 m-1s-1), qt is the contribution from tributaries, S0 is the slope, Sf is the friction slope and w is the width of the river. The equations are solved using the RKFV scheme similar to the one described above for overland flow. We employ an operator splitting technique for the calculation of qgc, which is computed after the rest of the terms are updated, as described later in section 3.9. The SISL scheme is also available for the solution of full nonlinear Dynamic Wave equation, and it is more affordable in river routing because the problem is 1D in nature. However, for the results reported in this paper, the simple RKFV is used in order to demonstrate its effectiveness. The river models are run in an upstream-downstream cascade sequence, so the contributions from tributaries are always computed before the model is run for the main river. The tributary inflows are converted into a source term to the main river: 1 qtn,i,, ® qtn,i 1 1 , Dxi Dt å t n ,1 nt qt, jdt j =1 t n ò (6) In which, qt ,i is the source term throughout the new time step of the confluence cell on the main t n ,1 qt, jdt is tn river (L T ), Δt and Δx are the temporal and spatial steps of the main river and ò 2 -1 the accumulative inflow of its j-th tributary during this time step, n denotes the time level and nt denotes the number of tributaries. The above boundary condition implicitly assumes that the downstream river stage does not change much during the time step, which is generally valid since the main river is a larger river. A limitation is that during high flow periods the time step of the river network may need to be reduced to maintain stability. 3.7. Soil water flow/Vadose zone First, please refer to the attached paws_structure_sketch document for an illustration of paws grid and various other concepts. Vertical water moisture movement in the soil compartment is described by the mixed form of the Richards equation [48-49]: C (h ) ù æ ¶h ¶h ¶ éê ÷÷öú + W (h ) çç K ( h ) 1 = + ÷÷ú çè ¶z ¶t ¶z êêë øúû (7) In which, K(h) is the unsaturated hydraulic conductivity (md-1), h is the soil water pressure head (m), W(h) is the volumetric source or sink term, which includes contributions from evaporation, plant root extraction and bypass flow and z is the vertical coordinate (positive upward) (m). The 17 two state variables, pressure head h and water content θ are linked via C(h)= ¶q / ¶h , the differential water capacity (m-1). The unsaturated hydraulic conductivity and pressure head are both functions of the soil moisture content. We choose the Mualem-van Genuchten formulation: -(N -1)/N æ Nö = çç1 + ah ÷÷÷ çè ø rr s - r é ù2 K (h ) = KS S l ê1 - (1 - S N /(N -1) )(N -1)/N ú ë û S = (h ) - r rr (8) where S is the relative saturation, θ is the soil moisture content, θS is the saturated water content, rr is the residual water content, N is a measure of the pore-size distribution (note in some literature n is used, here we use N to avoid conflict with time level in later descriptions), α is a parameter related to the inverse of the air entry suction and λ is a pore tortuosity/connectivity parameter [50]. Here we employ the widely used implicit iteration scheme [49]. 1 - qin = C in 1, p (hin 1, p - hin, p ) , qin 1, p -1 - qin qin ,,,, (9) In which j denotes the time level, p is the iteration number and C is evaluated as: C in ,1, p = ¶r =¶h (rr s - r) 2N -1 æ Nö çç n, p ÷÷ N , a h 1 ÷÷ çç ÷ø è ah n, p N (N - 1) h n, p (10) In other words, the differential water capacity C(θ) is updated at every iteration using the newly obtained h n ,p . The iteration repeats until both h and θ converge. Note that q n ,1,0 = q n . This stable implicit scheme can guarantee mass balance errors to be close to machine round off errors [48-49]. If we apply the procedure in Equation (9) to (7) we obtain the following: 1 é n ,,, ù 1, p n 1, p (hi - hin 1, p -1 ) , qin ,1,p -1 - qin ú êC i û Dt ë é n n æ ö÷ù æ ö n ,, 1, p n ,, 1, p n 1, p ÷ Ki ,1/2 çç hi - hin,11, p ê Ki -1/2 çç hi -1 - hi ÷ú ÷ çç =ê , 1÷÷ ,, 1÷÷ú Win çç ÷ú ê Dz çç ÷ Dzi -1/2 Dzi çç Dzi ,1/2 i è ø÷ êë è ø÷÷ûú (11) The above system can be solved efficiently using the Thomas algorithm [51]. 18 Under normal conditions, infiltration is simulated simultaneously with the soil column by the Richards equation (RE), as described in section 3.11. Under heavy rainfall at dry surfaces, however, RE alone is expected to produce significant numerical error with the vertical discretization we can generally afford. This scenario is thus handled by the Green and Ampt equation (GA). The basic assumption of GA is a piston-type saturated wetting front. This means that (a) after water enters the soil column it fills any pore space to saturation as the wetting front invades downward, and (b) the infiltration rate is determined by Darcy’s law using the effective saturated conductivity of the soil as well as suction head at the wetting front. GA is modified by [Mein and Larsen] to simulate infiltration under steady rain by [Chu] under unsteady rain. Jia [ ] developed a more generalized version of GA that is applicable for multiple layers to address the vertical heterogeneity of soils, and named the method Generalized Green and Ampt method (GGA). In PAWS we invoke a modified version of Jia’s GGA method when rainfall is heavy and the soil column is relatively dry. The modifications allows GGA and RE to be applied during the same time step, each taking care of a portion of the soil column, and takes into account the source terms due ET. The modified GGA proceeds as follows. Let wetting front position (WFP) be the location of the piston wetting front (m, from soil surface), and suppose WFP is in the m-th soil layer. For a given soil column, the infiltrating capacity, IFC (md-1), is only a function of WFP and can be calculated as [37]: æ Am -1 ö÷ dF ç ç = KS ,m ç1 , IFC = ÷÷ çè dt Bm -1 , F ø÷÷ (12) in which, m is the layer number, KS ,m is the saturated conductivity of m-th layer (md-1), F is the accumulated infiltration (m), F = m -1 å Dzi (rrrr s,i - r ,i ) , ( s,m - m ) and Am, Bm are 1 coefficients that are computed as: Am -1 = (Lm -1 Bm -1 = Lm -1 = KS ,m Lm -1 KS ,m Lm -1 km -1 km -1 , SWm )(rr s,m - m ) (rr s,m - m ) - Fm -1 (13) m -1 m -1 Dz m -1 i ), F D = = z k L , / ( å i m -1 m -1 å K å Dzi (rr m -1 s,i - r ,i ) S ,i 1 1 1 19 Lm -1, km -1 and Fm -1 are, respectively, depth to the bottom of the soil layer m-1, harmonic mean saturated conductivities and cumulative available pore space of layers 1 through m-1. To save computational time, they can be pre-computed and stored. The detailed derivations of the above terms are available in [Jia-98]. SWm is the average suction of the wetting front. As theoretically justified in [Neuman], SW can be calculated as SW (h ) = 0 K (h ¢( òh KS dh ¢ (14) For the van Genuchten hydraulic conductivity formulation in Eq. (8), this equation cannot be evaluated analytically, and is expensive to evaluate numerically. Thus the value of SW are numerically tabulated for different suction heads and soil parameters, and SW(h) is then queried from the table at the time of GGA execution. 3.8. Groundwater flow The saturated aquifers are conceptualized as a series of vertical layers. In each vertical layer, we solve the 2-dimenional groundwater equation: S ¶H ¶ éê æç ¶H ö÷ùú ¶ ÷÷ + = T çç ê ú ¶t ¶x êë è ¶x ø÷úû ¶y é æ ¶H öù ÷÷ú êT çç ê çè ¶y ø÷÷ú + R + W - Dp êë úû (15) where S is the storativity (dimensionless), T is the transmissivity of the aquifer (m2d-1), T=Kb where K is the saturated hydraulic conductivity (md-1) and b is the saturated thickness of the aquifer (m), H is hydraulic head (m), R is recharge or discharge (md-1) , W is the source and sink term due to pumping or root extraction (md-1) (inflow as positive) and Dp is percolation into deeper aquifers (md-1). The above equation is discretized using standard backward-in-time, center-in-space finite difference scheme: é æ n 1 1 n 1 ö÷ T n 1 ÷öù Ti -1/2, j æçç H in-,,,, H H H ç ê ÷ i , 1/2, j 1, j i , j i , j i ,1, j ÷÷úú çç 1 ÷÷ çç (H in, j,, - H in, j 1 ) = ê ÷ ç ÷ ê Dx Dt Dxi, j çç Dxi ,1/2, j ÷÷÷ú çç Dxi -1/2, j ÷÷ i , j êë è ø è øúû é æ n ,, æ n ,, 1 n 1ö 1 n 1 öù êTi, j -1/2 çç H i, j -1 - H i, j ÷÷ Ti, j ,1/2 çç H i, j - H i, j ,1 ÷÷ú ÷÷ ÷÷ú ,, çç Rin, j Win, j - Dpin, j ,ê ççç Dy ÷÷ ÷ ê Dy ú Dyi, j çç Dyi, j ,1/2 ÷÷ i, j çè i, j -1/2 ÷ø êë è øúû Si , j (16) Here i and j are x and y coordinate indices, respectively and n is the time level. Win, j = tn ,1 òtn Wi, jdt is the integral source term throughout the time step. 20 We solve for the percolation term implicitly: Dpin, j = -Kl (Hin, j,1 - Hln ) Dzl (17) where K l is the hydraulic conductivity (md-1) of the aquitard beneath the current aquifer, Dzl is the thickness of the aquitard, hln is the hydraulic head in the aquifer below. The x-direction interface transmissivity is taken as: Ti -1/2, j Dxi, j = 2Ti, jTi -1, j Dxi, jTi, j , Dxi -1, jTi -1, j (18) The y direction interface transmissivity is defined in a similar fashion. For the unconfined aquifer, the transmissivity is evaluated as Ti, j = Kxy,i, jbn where Kxy is the lateral hydraulic conductivity, bn is the thickness of the unconfined aquifer obtained from last time step (b = water table elevation – bed rock top elevation). This is a partial linearization of the equation for easier numerical handling. The resulting matrix system is solved using the Conjugate Gradient algorithm [51]. 3.9. Overland/Channel exchange A close-up view helps illustrate the exchange between the river and the land cells (Figure 3.1). It has been proposed in [28] that interaction between overland flow and channel can be modeled by the equations for flow over a wide rectangular weir. Similar to this approach, we have developed an efficient and stable procedure to compute river/land exchanges on a physical basis. The crosssectional and plane sketches of a river cell are given in Figure 3.1. ZBank is the elevation of the bank (m), ho is the depth of the overland flow (m), E is the average elevation of the cell (m), Zo is the average free surface elevation of the cell (m) (Zo = E + ho), hr is the channel flow depth and Zch is the stage of the channel (m). The exchange volume M (m3) between land and channel is computed with the procedure outlined in Shen et al. (2014) 21 Figure 3.1. (a) Definition sketch of river segments, cells, and their spatial join. Two rivers are their confluences are shown. We refer to the intersection of a river with a land cell as a ‘reach segment’ (s), and a computational element on a model river as a river ‘cell’ (c). Cells are often uniformly distributed while segments can varying irregularly in length. (b) Illustration of the lowland-storage module and its connection to the groundwater and overland flow domain. 22 In the above diagram, the first condition (1) is to determine the direction of the flow. If it is from the land to the river (Zo>Zch) and there is water on the land (condition 2), we first attempt to compute the contribution explicitly using the diffusive wave equation: ¶h 2L Dt 5/3 ¶h Mex = sgn( ) c h ¶x ¶x n 1/2 2L Dt 5/3 Zo - max(Zch , Z Bank ) = c h n (Dx / 2) 1/2 (19) in which, Lc is the length of the channel overlapping with the land cell (m), and other terms are defined as in Figure 3.1. However, this flux cannot exceed the amount of currently available water on the land cell: Ma = A × h (20) Also, there is an equilibrium state, at which the river stage will be the same as the land free surface elevation. Denoting this stage as Z*, the mass transfer equation is written as: (Z * - Zch )Ab = (Zo - Z * )A (21) Where A is the area of the land cell, A = Dx Dy as described above and Ab is the area of the river cell that spans this land cell. Then we can find Z*: (A + Ab )Z * = Zo A + Zch Ab æZ A + Z A (Z - Zch )Ab ÷÷ö ç * o ch b ç M E = (Z - Zch )Ab = ç - Zch ÷ Ab = o ÷÷ø (1 + Ab / A) èç (A + Ab ) (22) Thus the exchange mass will be the minimum of M ex , M E , M a . On the other hand, if the river stage rises higher than the land free surface elevation (and also the bank elevation), flooding would occur, which is solved using a backward Euler implicit approach to enhance stability. The exchange mass solved by the implicit method is denoted as M im . Again using the diffusive wave formulation, the mass exchange function can be written in the form of two ordinary differential equations: 23 A dZo Ab =- dt dZch dt M im =- Dt dZ = -A o dt 2L Zch - Zo (Zch - Z Bank )5/3 n Dx / 2 (23) These two equations can be solved by either Picard or Newton iteration. The resulting scheme is very stable. 3.10. Groundwater/Channel exchange Equations describing interactions between groundwater flow and channel flow are solved immediately after the channel flow step. We use operator splitting to couple the river flow and exchange with groundwater. After the river flow model is solved explicitly with a Runge-Kutta approach, an implicit step is used to calculate the exchange between streams and groundwater using the conductance concept [59]. The governing equation for the fractional step is written as: ì H - hr ïïï Kr ï dhr DZb ï = ïí ïï (zb - DZb ) - hr dt ïïïKr DZb ïî H > (zb - DZb ) (24) H £ (zb - DZb ) in which, zb is the river bed elevation (m), ΔZb is the thickness of the river bed material (m), K r is the river bed conductivity (ms-1) and H is the groundwater table elevation (m). The above equation can be discretized implicitly as: hrn +1 - hr* Dt = Kr H * - hrn +1 DZb (25) h* is computed from the solution to equation (5) (without the qgc term) and a similar equation can be written for the groundwater table H * which can be solved simultaneously. Then the lateral flow from groundwater is computed as: qgc = w(hrn +1 - hr* ) (26) where w is the wetted perimeter (m). For rivers wider than 10m, w is approximately the river width. Figure 2.3 shows the flow diagram for the model. The model marches in time using calendar days. The hydrologic processes, including evaporation, transpiration, snowpack and unconfined aquifer are updated on an hourly basis. The vadose zone model solves infiltration, runoff and 24 depression storage together with soil moisture. It uses an hour as a base time step but adjusts it depending on flow conditions and convergence rate, as in [48]. The overland flow and river network also have the ability to adaptively select time steps to ensure stability and computational efficiency. The computational subroutines of PAWS are written in FORTRAN while data preparation, certain control functions and display utilities are written in MATLAB®. PAWS allows model variables, including spatial fields of fluxes and state variables, river stages and time history to be displayed real-time. The goal is to keep the model as an open-ended, dynamically-evolving and interactive environment in which can engage the modeler on a real-time basis. A software package with Graphical User Interface (GUI) has been developed for the present model to help interface with data. PAWS was developed using an objected oriented programming approach, although it does not explicitly enforce concepts such as encapsulation and inheritance. The aim was to easily allow the addition of new functionality while keeping the code modular. 3.11. Surface runoff The surface ponding layer mass balance equation (1) is solved simultaneously with the soil column: æh - h ö÷ çç 1 2 = SS1 - K1/2 ç + 1÷÷÷ - Fg ç dt çè Dz1/2 ÷ø÷ dh1 (27) where, h1 is the surface ponding depth (the topmost cell of the soil column), h2 denotes the pressure head of the second cell of the soil column, SS1 = P + SNOM - CSnew - E1 is the source term accounting for precipitation, snowmelt, canopy storage and ground surface evaporation, Fg is surface runoff (md-1) and K1/2 is the surface hydraulic conductivity, which is calculated as the geometric mean of the saturated current-state unsaturated conductivity of the first soil layer (layer 2), considering the fraction of pervious area: K1/2 = (1 - fimp ) K1KS1 (28) The surface runoff is the contribution from surface ponding to various flow paths. If we assume the total length of overland flow paths in the cell as l , as described in [28] [59], the surface runoff contribution can be computed as: Fg (h1 ) = (h1 - ho )ul l 86400A (29) 25 where ul is the runoff flow velocity (ms-1), A is the area of the cell (m2), ho is a minimum depth of water for surface runoff to occur (vegetation understory storage, m) and the constant 86400 is for unit conversion from ms-1 to md-1. l can be parameterized based on land surface characteristics and adjusted during calibration. We use the Manning’s formula to compute flow velocity and apply the kinematic wave concept (S0=Sf): ul = 1 1/2 (h1 - ho )2/3 S 0 nm (30) where S0 is the average slope of the cell and nm is the manning’s roughness coefficient. Eq. (27) is a nonlinear equation that can be solved iteratively together with the rest of the soil profile. 26 4. Users Manual The section documents the organization, structure and implementation details of PAWS so that extensions or enhancements can be made by any interested party. 4.1. Getting PAWS Currently, PAWS and PRISM are version-controlled using git and svn. Group members can checkout the current version using (replace xxx with your username) svn --username xxx co https://rcc.its.psu.edu/repos/cshen/pawsPack/PRISM PRISM git clone https://[email protected]/lbl-climate-dev/psu-paws-git.git After entering the correct password, you will get your local working copes of PAWS and PRISM. To learn more about svn and version control (important if you don’t know it), read the following tutorial: https://www.clear.rice.edu/comp314/svn.html 4.2. Prerequisites PAWS comes in two packages, the Fortran executable pack (PAWS) and the PAWS data Reader and Input System - Matlab (PRISM). PAWS has been compiled and executed on Windows 32bit and 64-bit systems, Linux and Macintosh. Depending on the task, the pre-requisites are different: Execution only (only interested in using PAWS as an excutable) Matlab Compiler Runtime (or Matlab itself) (for mx and mat interfaces) Model input dataset building (PRISM, needs to build model input for a watershed): Matlab with mapping toolbox Compilers and Debugging environment (for code development): a) Windows setup: Intel Fortran Compiler 11.1 or above, MS Visual Studio 2008 or above, Matlab with mapping toolbox b) Linux setup: ifort (11.1 or above), emacs 23 or higher (for visual debugging), gdb, Matlab with mapping toolbox c) Interactive mode (Windows): PAWS itself can also run as a Matlab function through MatlabFortran mex interface. Pre-compiled mex files are distributed along in the PRISM package 27 ($PRISM$/mex). If you need to make changes to the computational core, on the other hand, you need a matching Matlab-Visual Studio-Fortran compiler set in order to compile the mex subroutines. Google “Matlab supported compilers” for your respective Matlab version for software requirements. (Optional debugging tools:) totalview, intel parallel studio (free), valgrind (PAWS suppression file), DDT, svn (tortoisesvn, rabbitvcs) 4.3. Setting up PAWS data Reader and Input System - Matlab (PRISM) For PRISM, the setup process is as easy as unzipping the files into a directory ($PRISM$). The user needs to start Matlab, change Matlab directory to $PRISM$, and type the command, gpath This will add the useful directories to Matlab path, and global environmental variable, Env, into Matlab workspace. Env is a structure. Env.rt is simply $PRISM$, Env.path contains all the directories where model source files are. 4.4. Compile and Debug PAWS Our past strategy has been to carry out most development and debugging tasks in Windows Visual Studio system because this is most user efficient and pitfall-free. Make sure the code runs smoothly and does what we want in Windows. Then we move to Linux system to fix compatibility issues. (A) Windows system: On Windows system debugging PAWS is very easy if you are familiar with Visual Studio. Only some slight changes are needed. If the prerequisite setup in Section 4.2 is complete, a Visual Studio (VS) project file can be directly used. If PAWS has been unzipped to directory ($PAWS$), an up-to-date installation instruction is given in the readme.txt under PAWS. The VS project file can be found at: $PAWS$\PAWS_debug\PAWS.vfproj Opening this project in VS will load relevant settings into the project. However, the Matlab path, which appear in several places in the project settings, may need to be updated: In VS, Project --> PAWS Properties: your $MATLABROOT must be correctly updated in (1) Project Properties --> Fortran --> Preprocessing --> Additional Include Directories (Currently C:\Program Files\MATLAB\R2010b\extern\include)and (2) Project Properties --> Linker --> General --> Additional Library Directories 28 (Currently C:\Program Files\MATLAB\R2010b\extern\lib\win64\microsoft) Replace C:\Program Files\MATLAB\R2010b with your own Matlab path Notes: (1) If changes need to be made to the debug version of the project, the same changes need to be applied to the settings of the Release project before compiling the Release executable. Also, there is no need to commit such setting changes to the repo. (2) This set up is for 64-bit machines. If you have a 32-bit machine, the 'Solution Platforms' in the VS needs to switched to Win32. (3) On the other hand, modify the directory: Project Properties --> Working Directory to be the directory where you intend to launch PAWS executable. This should be where the input files (like *.mat files) are. After all this is setup, standard VS functions can be (B) Linux system First make sure you have all prerequisites listed in Section 4.2. Upon Linux initialization you should execute the commands in $PAWS$/MAKE/.bash_profile which adds relevant paths into the system environmental variables. User should consider adding these commands in their Linux initialization script. Similar to the Windows version, the Matlab path in this initialization script needs to be adjusted. Currently, it is export MATLABROOT=/gpfs/apps/x86_64-rhel6/matlab/R2012b This needs to be updated to the users' own Matlab path. Before we can compile Matlab, because of a historical compatibility issue, we need to change all files with suffix '*.F90' to '*.f90'. You can do this using a small utility we wrote in Matlab: module load matlab matlab -nodisplay After matlab starts, go to $PRISM$, type gpath cd $PAWS$/src/ %(replace $PAWS$ with your PAWS directory) changeSuffix('.F90','.f90') After this, if we check under $PAWS$/src, no more files ending with *.F90 exists. Exit Matlab and go into $PAWS$/MAKE directory. The compilation of PAWS is done by typing: make -j4 all 29 This will invoke 4 processors to parallel compile PAWS. More processors can be employed by using a higher number after -j. After compilation, an executable named PAWS_CLM can be found in $PAWS$/bin. To clean up previously built files and re-build the project, do make clean By default, the code is compiled as the release version (optimized). If you want to have version of the code with source information (so that you can debug it), edit $PAWS$/MAKE/Makefile and $PAWS$/MAKE/subdir.mk, change ifort -O2 to ifort -g make clean and make all need to be done. We can debug it in various environments (e.g. emacs+gdb, idb, ddt or totalview). However, so far the most convenient seems to be idb as the code is mostly compiled with ifort. There are still some character array initialization statements that are not compatible with gfortran yet (oh dear dumb gfortran!). One downside of idb compared to emacs+gdb is that although it does show source files during debugging, we are not looking at the actual source code but stripped source code stored in the compiled executable and we cannot change it. Therefore in order to edit-compile-debug again we need another text editor like emacs on the side to actually make changes. To debug with idb, at Linux prompt, type idb & When idb pops up, open the correct executable and set up correct folder/arguments like below 30 Figure 4.1. idb settings to load executables. Paths and arguments may change depending on task After this all functionalities in idb can be used 4.5. Compilation -- Interactive mode The matlab functions will work on any machine as long as Matlab is installed. The Fortran subroutines, on the other hand, need to be compiled to run. The compiled binaries are distributed with model. Thus the model is set to work on Windows 32bit and 64bit machines (for either interactive mode or stand-alone mode). On Linux and Macintosh systems, however, due to the large variety of architecture and OS environments, the distributed binaries may not be guaranteed to work. The user may also want to add functionalities to the model or test some ideas. Therefore, local compilation may be necessary. Essentially, for the interactive mode, the user needs to employ the ‘mex’ External Interface of Matlab to compile the Fortran files for them to be called by Matlab. If the user has no knowledge of mex, he/she should work through the examples in Matlab Help Matlab External Interfaces ‘Calling C and Fortran Programs from MATLAB Command Line’ to make sure the compilers are set to work properly. 31 In most cases, assuming a compiler named ‘ifort’ does exist on the user’s system, the model can be compiled easily by running the command ‘build_mex’ from Matlab command prompt (in the root folder of the model, after gpath is used). This script should take care of the compilation details. However, if it doesn’t, the user needs to study the ‘build_mex’ function and see how it can be tailored to the user’s machine. To create PAWS-only mex subroutine. It is necessary to change some compiler flag in <preproc.h> in $PAWS$/src/include and add the following statement: #define MEX integer*4 Because this will cause entire program to re-compile, a better way is to make a copy of your current PAWS working copy to a new folder, say PAWSmex, and let’s call the location of this folder $PAWSmex$. The following is how to compile all mex files: In Matlab, after doing gpath, type edit build_mex This will bring up the file build_mex.m. Change the second line of pawsrt to the current position of $PAWSmex$. Then type build_mex in Matlab. A bunch of commands come up, including many commnds starting with “ifort” and one that start with “mex” Locate your command prompt with Fortran compiler (e.g., Start->Intel Parallel Studio XE2013-> Command Prompt->Parallel Studio XE with Intel Compiler -> Intel 64 Visual Studio 2012 mode). cd the command prompt to $PAWSmex$\PAS_debug. Copy and paste all commands into the command window. Make sure there are no error messages. Move Matlab current directory to $PAWSmex$\PAWS_debug\x64\Debug Copy and paste the statement starting with mex into Matlab command prompt and execute. Now you get the mex subroutine mexPAWS. You can move it into $PRISM\mex$ to call it from anywhere. This seems like more complexity than a ‘purely’ pure Fortran program. The question ‘why do you want to use .MAT file?’ is warranted. The advantages with using such a file format are explained below a. It can hold many different types of data in one file. This is convenient for a complex model like this which contains so many components and so many pieces of data in different shapes. 32 b. It is easy to test against conceptual test cases (see testCasesWorkshop) c. It can be easily viewed, modified or visualized in Matlab. It will take much more serious effort to develop visualization subroutines outside of Matlab d. Saving and loading .MAT files are easy, trans-platform and backward-compatible. The model may be resumed from a previous saved state, thus facilitating debugging. e. The linkage with Matlab is maintained with minimal effort, facilitating extension, idea prototyping, algorithm development and linking with advanced functionalities (e.g. autocalibration on a HPC, uncertainty analysis, image processing, etc). f. Matlab and Mapping Toolbox allows reading and processing of GIS files which could take large amount of effort if such facilities were not available. At the same time, this setup does not preclude the possibility of parallelization. 4.6. Program structure The calling sequence of major functions is illustrated in Figure 4.2. This diagram may be viewed in comparison with Figure 2.3. The purposes and some of the details of each function are provided in Section 6: Function References. 33 Figure 4.2 (outdated due to incorporation of CLM. See Figure 2.3, but many other components are still valid). Flow chart and calling sequence of major functions and subroutines In the interactive mode, the computational functions (e.g. ovn_cv, surface_proc, r_MacCormack, GW_sol) call Fortran subroutines via the gateway functions such as those in prism.F90. The organization of the Fortran codes is explained in the next section. 4.7. Fortran code organizations The Fortran codes are organized in *.F90 files. In these files, vdata.F90 and Flow.F90 need special explanations as they contain modules VDATA and FLOW. Any program that USE VDATA or USE FLOW can have access to the shared derived types, data and functions defined in these modules. 34 The module VDATA includes data structure in Fortran (derived types), data storage (instances of derived types) and a library of general-purpose functions (e.g. Thomas, Conjugate Gradient, Newton iteration, etc). The derived types contain fields that are, normally, pointers of different ranks, rather than actual allocated memory, to give the flexibility of linking to existing variables in memory or dynamically allocated memory. Flow.F90 consists of flow functions/subroutines that are written specifically for the PAWS model, namely, unsaturated soil water flow, saturated groundwater flow, 2D diffusive wave overland flow and generalized Green and Ampt infiltration, etc. prism.F90 is a special file that contains the interface functions between Matlab and Fortran (e.g. SUBROUTINE mexFunction, the pairs of BRIDGE*** and LINK*** subroutines), as well as program control subroutines such as SUBROUTINE LAND or SUBROUTINE UNSAT. SUBROUTINE mexFunction is the entry point from Matlab calls to Fortran. To know more about mixed-language programming between Fortran and Matlab, readers are referred to Section 6, comments in the programs and External Interfaces section of Matlab help documentation. 4.8. Input preparation A Graphical User Interface has been developed to assist interfacing with data and setting up the model. The GUI has 7 core capabilities, including, loading data input, specifying grid parameters, discretizing data into model, specifying runtime parameters (Component solvers, Model Start Time, Model End Time, etc), running the model, saving/loading model and displaying the results. The GUI is mainly used during the setting-up stage. The model can be run with or without the GUI. 4.8.1. Starting the interactive environment The model can be run in the interactive mode (in Matlab) or the compiled mode (after compilation by the mcc compiler). Running the model in the interactive mode is the same as running any other Matlab programs. To create the input for the model from source datasets, Matlab and Mapping Toolbox installation is required as PAWS needs to read and process GIS files. The use of Matlab greatly increased the efficiency of model development and enabled what could not have been achieved by the author in the timeframe allowed. To create a model in the interactive mode with the GUI: 1. Start up Matlab and browse to the root directly of the model ($PRISM$). 2. When Matlab path is under $PRISM$, enter ‘gpath’. This command adds the relevant directories into the Matlab paths and also set the values of some environmental variables (Env in matlab workspace) 35 3. Enter the command ‘mygui’. This command brings up the model main GUI session. Fig 4.3 shows the GUI window after it is started. (Depending on the Operating System and the Matlab version, the look of the windows may be trivially different.) Figure 4.3. GUI after the model is started 4.8.2. Loading the data To load the raw data for discretization, click on the ‘Data’ button on the main GUI. This brings up the data GUI (Figure 4.4a). This window allows the user to specify the input files. The data items listed in this window is summarized in Appendix 5.1. For each of these items, click on the item’s checkbox and then use the file browser to load the file(s). For the ‘Weather Data File Folder’ and ‘Ground Water Files Folder’, a directory that contains relevant files should be loaded. The ‘Soils Map Files’ can accept multiple ASCII raster data files because normally SSURGO data is organized in county we may span several counties in our study domain. All other input boxes expect one input file. After a file is loaded, its path is shown in the Edit box below the checkbox (Figure 4.4b). 36 (a) (b) Figure 4.4. Data GUI. (a) before loading data (b) after loading data files 37 Another way to quickly load the data files and avoiding much of the human actions is to create a GUI list file. Using this GUI list file is the same as manually setting all the fields. A GUI list file used for the GUIs in this model always has the format: Field_id:input where Field_id is the identification flag of the input field. An example GUI list file looks like: wtrshd_file:C:\Work\PRISM\data\Shapefiles\Wtrshd_RCR_Union.shp dem_file:C:\Work\PRISM\data\dem_lulc\ned_rcr.txt ned_file:C:\Work\PRISM\data\dem_lulc\ned_rcr.txt riv_file:C:\Work\PRISM\data\Shapefiles\RCRModelRivers.shp lulc_file:C:\Work\PRISM\data\dem_lulc\lulc_rcr_bigger.txt lulcTB_file:C:\Work\PRISM\data\dem_lulc\lulc_mat_rcr.mat soilsMap_file:C:\Work\PRISM\data\soils\ingham.txt;C:\Work\PRISM\data\soils\li vingston.txt; wea_file:C:\Work\PRISM\data\Shapefiles\Stations_RCR.shp wdata_file:C:\Work\PRISM\data\weather\RCR_PRCP.csv;C:\Work\PRISM\data\ weather\tmax.csv;C:\Work\PRISM\data\weather\tmin.csv; gw_file:C:\Work\PRISM\data\gw To load this file, Click on the ‘Load Input’ button on the data GUI window, and then select the GUI list file. If the GUI list file is successfully loaded, the edit boxes on the data GUI will be filled with the correct records. Click the ‘Apply’ button on the data GUI to close the window. 4.8.3. Setting up the grid 38 Press the ‘Grid’ button on the main GUI will open up the grid GUI (Figure 4.5). This window Figure 4.5. GUI after the model is started allows the user to specify discretization information. In the box ‘nx’ and ‘ny’, user needs to input the number of cells in x and y direction. In ‘dx’ and ‘dy’, spatial step size in meter should be input. The boxes origin_x and origin_y stand for the location of the lower left corner of the grid. Origin_x and origin_y information is automatically loaded for a given DEM raster grid. After filling in these fields, the user needs to click one of the options listed on the right to indicate what method should be used to aggregate DEM data in a grid cell. Because DEM maps usually have finer resolution than the computational grid, there can be many DEM point values inside each grid cell. ‘Area average’ means the elevation data inside one grid cell is averaged to obtain the grid cell elevation. ‘Linear’, ‘Nearest Neighbor’, ‘Spline’ and ‘Inverse Distance Weighting are different methods of interpolation. These options will take an interpolated point value as the elevation for the grid cell. The ‘Area Average’ method is best supported and tested right now and the user for the moment should generally choose this option. Similar to the data GUI, the grid GUI can also be filled by loading a GUI list file to save the manual input time: 39 row:50 col:67 dx:900 dy:900 origin_x:3978025.6696 origin_y:103832.3393 distance:1 cellsize:900 This GUI list file can be written by first filling the information in the GUI and the using the ‘Save’ button. Then it can be loaded by using the ‘Load’ button. After the blanks are properly filled, hit the ‘Apply’ button to finish the grid set-up process. Note that the ‘Apply’ button is available only after one of the ‘interpolation method’ options on the right is selected. 4.8.4. Discretization When grid information step is done, the ‘Discretize’ button on the main GUI is enabled (Figure 4.7). Here we can discretize one, several, or all of the components of the watershed model. In this window the user should select the components that need to be discretized. If a new watershed model is being created, all the boxes should be checked. There are also a few edit boxes that needed to be filled out. The ‘DX array’ next to the ‘River’ check box states the spatial step-size for the discretization of the rivers. The program will evaluate the content of the box and to get an array (in Matlab), whose i-th element correspond to the i-th river dx. The nRPT next the ‘LULC’ checkbox is the number of RPT that are going to be modeled in the domain. Other edit boxes should be left untouched at this moment. Once the user clicks the ‘Discretize!’ button, the program will take a couple of minutes to go through the discretization steps for all the components. New data storages will be allocated in memory. Data will be discretized onto the computational grid previously specified. Any data in the memory will be cleaned if the box of that component is discretized. 40 Figure 4.6. Discretization GUI 4.8.5. Setting up solution schemes and time steps The model is written in such a flexible way that different solution schemes to flow domains can replace the default value with great ease. After clicking on the ‘Solvers’ button the main the solvers GUI is bought up (Figure 4.7). The solvers GUI contains two sub-buttons and the ‘DTspecification’ section where the user specifies the temporal time step that should be used for each component. First we should use the ‘Solver Functions’ sub-button to open the solver functions GUI. In this new window (Fig 4.8a), the left column ‘Field’ shows the components. And the user is expected to fill in the middle column under ‘Value’ to indicate which solvers they want to choose for each component. These are expected to be Matlab function handles which accepts input in certain format. For the results published in this work, the settings can be directly loaded without any typing. On the new window, click on ‘FileOpen’ and select the file ‘$PRISM$/data/solvers.mat’. After clicking ‘Yes’ on the confirmation page (Figure 4.8b), we see that some of the fields have been filled (Figure 4.8c). The content in the filled fields are the Matlab function handles which correspond to a matlab .m file in the model package. Each of these files can be opened by typing ‘edit (FILENAME)’ under Matlab command prompt. For example, type the command ‘edit GW_sol’ in Matlab command prompt will open the file ‘GW_sol.m’. Some fields are still ‘void’ because their solvers may have been combined in other functions. Hit ‘OK’ to close this window. The next sub-button ‘Exchange Functions’ is the place to enter functions that calculate interactions among domains. For the current model structure, the user only need to input ‘@F_oc_dw’ for the ‘OC’ field. 41 Then we are ready to specify the time steps. The unit of the input should be ‘day’. A quick way to load the current setting is to click the ‘Load’ button on the solvers GUI and load the file ‘$PRISM$/data/dt.txt’. This will automatically fill in the relevant fields. (Fig 4.7b). Hit ‘Apply’ to save the settings. (a) (b) Figure 4.7. Solvers GUI. (a) after it is opened (b) after dt file is loaded 42 (a) (c) (b) Figure 4.8. Loading solvers data into solvers functions GUI 4.8.6. Final model set up Before model can be run, a few steps remain to be done. In the ‘Run Model’ section of the main GUI, the user is expected to set the model start time and model end time in ‘YYYY-MM-DD HH:MM:SS’ format. Clicking on the ‘Final Set Up’ button will enter the settings into the model. It will also execute a function called ‘modelSetUp’ the do some preparation steps for the model 43 to be ready to run. It is recommended that the user save the model at this moment so the model can be run directly from here without having to re-discretize the model. 4.8.7. Saving and Loading model At any stage of model preparation or model running, the model can be saved and can be later loaded to resume the previous operations by using the ‘Save’ (callback: cmd_Save.m) and ‘Load’ (callback: Load) buttons on the main GUI. This is a big advantage of building up the model in the Matlab environment as it would not be a trivial task to write such a utility in a completely Fortran-based program. The ‘Save’ and ‘Load’ functions have proven to be hugely convenient during the model development stage. Important: The “save” model button saves the complete dataset including GIS data used during model creation. For model execution, one additional step is needed, hit ‘port to Fortran’ button and follow the prompt to save the final *.mat file for the Fortran executable. This will apply a range of operations. If you set the filename as “Name”, then there will be two files written: Name.mat and Name_CLM.mat The ‘Clear All’ button can erase any model data from the current workspace and start a new main GUI. It is recommended to use ‘Clear All’ function before loading or creating a new model to avoid any potential memory issue. 4.8.8. Monitoring points and observation files 4.8.9. Set up model execution folder Apart from the mat files created by PRISM, there are a set of input files needed by the Fortran executable for various purposes (section 5.3). It is recommended that the users transfer the Name.mat and Name_CLM.mat to the template folder, make relevant customizations of other files and use that folder as the execution folder. 4.9. Running the model in standalone mode At the Operating System command prompt, launch the executable, with the *.in file (the primary driver control file, see section 5.3.1) as the sole input argument. For example, on Windows, start a command window, browse to the execution folder, and do (in the examples below, toRun should be replaced with the actual name of the *.in file) paws toRun.in The command window will then display model run-time information, including the year, Julian day of simulation and the wall-time (seconds) spent on the day and several parts of simulation. 44 In Linux, ./PAWS toRun.in A way of launching the model that we often use is in Matlab, which allows batch launch of jobs. Example, if, under the current directory, there are many folders, and we want to run a paws job in every folder starting with “CLN”, we can do the following, on Windows: D = dir(‘CLN*’); for i=1:length(D), cd(D(i).name); system(‘start paws toRun.in’); cd ..; end This will run a batch of jobs with one key-punch. On Linux, ‘start paws toRun.in’ should be modified accordingly. 4.10. Post-processing and visualizing data The model data, input, output and model states at any instant of time can be easily visualized in Matlab. The variables can be viewed and examined like any .MAT file. 4.10.10. Grid and channel visualization Here we describe some plotting functions that have been written to standardize the process including, highlightPoints (for 2D data), TV/displaygui (for 2D data and river variables), readBuget/plotBudget/hydrographSep/plotPresentation highlightPoints is the general map producing function to visualize 2D data with watershed boundaries, river shapes and coordinates. Any 2D array that carries the same dimension as the model grid can be displayed by this function. For example, in Matlab, typing the following: >>load Initial.mat >>highlightPoints([],[],g.GW(1).h) produces the figure in Figure 4.9(a). The first two arguments, left blank in the last example, are X and Y indices of the cell numbers to be highlighted. For example >> highlightPoints(30,20,g.GW(1).h) produces Figure 4.9(b), which highlights the point at the 20-th row and 30-th column. Note the order of indices has X comes first and Y second, which is the opposite to how Matlab reference a point. The point being highlighted in Figure 4.9(b) is g.GW(1).h(20,30). 45 (a) highlightPoints called without point indices (b) highlighting point (IX=30,IY=20): g.GW(1).h(20,30) Figure 4.9. output of highlightPoints TV/displaygui TV is the main visualization function used by the GUI display menu. It is generally called by the GUI. When the model GUI is started (by typing ‘mygui’ in Matlab after using ‘gpath’), load relevant data (.MAT file), and then we will be able to click on the ‘Display’ menu and show the display GUI (Figure 4.10). The user is free to customize the display menu. For example, if watershed shape and Grid are selected, the grid discretization on the bottom is displayed after 46 hitting ‘OK’. The list box on the right of the display GUI indicate what data have been selected to display. Besides selecting from the ‘Input’ boxes, the user may also customize the variable in the boxes at Figure 4.10. Using the TV function from the GUI the lower corner of the display GUI. Any 2D variable can be added. After hitting ‘Add’, it 47 should show in the list box on the right, together with any items prescribed. It can also be used to show variables in the rivers. For example, if the display menu is customized as shown in Figure 4.11(a), the river stages and bed elevation of r(25), r(26) and r(32) will be shown. We can get an immediate inspection of river depth and stage along the river distances (Figure 4.11(b)). In the function ModelSetup (which calls rCorrectCoord), the river coordinates are modified such that the ending coordinate of a tributary is the same as the coordinate of point of confluence on its downstream river. For example, if river 1 joins river 2 at x = 1500m on river 2, the coordinates of river 1 are modified such that its ending coordinate is 1500. By doing this, we can view multiple rivers and get a coherent sense of ‘where things are’ counting from the final outlet. This makes sense from transport point of view. In Figure 4.11(b), we see that r(32) joins r(26) at around x=60km (6 x 10⁴m). We notice that the stage of the two rivers are close to each other at confluence and the depths of r(32) actually increased sharply while approaching r(26). From the same figure, we observe that river is deep in relatively flat reaches, whereas for reaches with larger slopes the river stages are barely higher than the bed elevation (small depths). readBuget/plotBudget/hydrographSep/plotPresentation These functions are a suite of utilities to visualize temporal trends of hydrologic budgets from simulation results. After the simulation finished, the output file prj.txt can be load into Matlab by doing (gpath must have been used first): >> [M,vars] = readBudget(‘prj.txt’); As a result, we obtain a n-element cell array M, each M is an 1D column of data. The title of each column is saved in the same-indexed element in the cell array vars. To find the data for a given item, for example, prcp, we can do: >> k = findHeader(vars,’prcp’); dat = M{k}; The function findHeader simply find the index of the item ‘prcp’ in the cell array vars. Then we retrieve the corresponding column from M A fast way to get an understanding of the results is to use the command plotBudget: plotBudget(M,vars,1) Figure 4.12 shows the first figure as a result of this command. There are three panels. The top panel shows the simulated basin outflow hydrograph (at the most downstream outlet of the main river) vs the observed flow as recorded in w.tData.usgs(1). This only gives a rough idea of the hydrograph as the basin outlet may be far from where USGS is. The middle panel shows the temporal trends of the state variables. The third panel shows the temporal trends of basin average fluxes. It may be clustered as the figure attempts to show many fluxes simultaneously. The user may use Matlab figure GUI tools to remove lines that are not needed. 48 The large argument to plotBudget is the time series mode. Mode = 1 means daily, =2 means monthly, omitted means no aggregation will be one, thus hourly. plotTS the function plotBudget makes use of a function called plotTS which works on a time series object. A time series object should have at least two fields, namely, t and v. These two fields should contain equal number of elements, with t being the time (in Matlab datenum format) and v being the value corresponding to that time. The users will find plotTS used frequently in PAWS’ plotting functions. The format of using plotTS is: >>plotTS(ts, symbol) Where symbol is the symbol to plot the time series. (a) 49 (b) Figure 4.11. Using the display GUI to visualize river stages and bed elevations Figure 4.12. Using the plotBudget function to visualize temporal trends of hydrologic budgets 50 4.10.11. Handling of time series data 4.11. Construct and run conceptual models 4.12. Column mode 4.13. Batch operation utilities This chapter is being worked on. 4.14. Calibration on High Performance Computing systems This chapter is being worked on. 4.15. Useful utilities The functions below were written to facilitate the process of modeling/development/publishing. They have proven to be handy tools. Some of them have general purposes that can be used for other applications. The author encourages the users to read these functions in the Function Reference section and make use of these existing tools. After using ‘gpath’, all these functions can be opened in Matlab editor by doing: >> edit func Where func is the function name of interest. General Utilities 51 maxALL/minALL/meanALL/anyALL uniqueCount readASCIIGrid/writeASCIIGrid datenum2/ymd2jd insertbin polygonMask vec2grid area2 monotone_denoise area_slope copyStructColumn lineStats Post-processing wDaily/wMonthly/wMonthly2 compTS/compStats monthlySummary/annualAverages simResults3 analyzeLanduseMap visualization: updateTStick fixFigure fixLabels plotRiv plot121Line displayIndices 52 plotPrcp figureLineData plotHLine 53 5. Input/Output documentation 5.1. General source datasets for PRISM PRISM requires 3 kinds of input data, we note that the preferred datasets listed below are not the only possible sources of data. In square brackets we list acceptable file formats. In curly brackets we list any required attributes in the file. Table 5.1. List of input data to the watershed model and format Data category Subcategories and purpose of data Physiographical characterization of the Basin Digital Elevation Model (DEM or NED) [GIS, *.tiff or *.txt raster file]: provide information about elevation. River Network Datasets (NHD) [GIS. ESRI shapefile]: provide river network topological information, river width, spatial intersection with the land {required fields in the attribute table: METERS: length of the feature in meters; WID: river width in meters, some segments need to have values, segments with 0’s will be filled by upstream values; CType: channel geometry type. For now, put all 0s. RID: an ID assigned to rivers. This field is how the GUI recognizes the concept of a “river”. All segments with the same RID will be organized into one “model river” on which the hydrodynamics solver operate at one time. Segments with the same RID should be contiguous in the shapefile—there shouldn’t be gaps. RCHID: the ID for a reach. This is a GIS-file concept that does not impact Fortran computation, but influences how upstreamdownstream reaches are recognized during PRISM preprocessing. One RID river can be composed of many RCHID’s. DSRCHID: RCHID of the segment downstream of the present segment (where the current one is discharging into) WBody (optional): whether the reach is a water body. 0 or 1 for an ordinary river reach; 2 for a lake. If this fields is missing, all segments are river reaches. This influences how the code infers the water body depths. } Landuse Land Cover dataset (LULC) [GIS, *.tif or *.txt raster files]: provide a snapshot in time of the land use types in the basin. This also includes a table that can transform data base LULC types into modeling classes. 54 Landuse Land Cover dataset (LULC) mapping table [Matlab .mat file with variable called ‘lulc’] {raw data sources can be organized in various land use coding schemes, but the model only recognizes its own rules, which necessitates this mapping table, saved as a variable in matlab mat file } Soil dataset (SSURGO) [can now take either a. An excel workbook; or b. a folder of SSURGO text table data]: provide information of soil type, soil layering, soil water retention and hydraulic conductivity, etc. {} Groundwater Aquifer dataset (GW) [a folder of raster files]: provide groundwater aquifer layering, thickness, conductivity, and storage information {Three input as raster files, organized as {Field}_{n}) K_0, …, K_n: aquifer conductivity (m/day) for n-th layer. K_0 is for the upmost layer – the unconfined aquifer E_0, …, E_n: bottom elevation (m) for n-th layer. E_0 is for the upmost layer – the unconfined aquifer. This will also serve as the bottom of the vadose zone discretization H_0, …, H_n: initial head of the n-th layer. H_0 is the unconfined water table elevation. Typically would be ok if H_0=…=H_n } Soil Color dataset (scolor)* [GIS]: Soil color describes the optical and radiative transfer properties of soil. Watershed Boundaries [GIS, ESRI polygon shapefile]: provide geographic information about the boundary of the study region Climate Forcing Data Serves as the forcing data for the model, includes: Precipitation (required) Daily max/min temperature (required) Relative Humidity, or dew point temperature (preferred) Wind Speed (preferred) 55 Solar insolation (preferred) {} [Two formats for the Location of the weather stations [GIS. ESRI point shape] [NLDAS/GLDAS as climate forcing files are being developed at the moment. Other globally-available climate datasets, e.g., TRMM, are also being integrated into our inputs] Functional Type database* Plant Functional Type database (pftcon) (pftcon.mat): provide lookup table for a long series of plant parameters and descriptors for the plant biogeophysical properties Snow characterization (Snicar optics, Snicar drdt) Initial states Initial Carbon/Nitrogen pools (initialCStates.dat): provide initial states of plant carbon/nitrogen pools. Initial Soil temperature (initialSTemp.dat): provide initial states of plant soil temperature initial Groundwater head (H): provide initial groundwater table location (and soil moisture is inferred from this state) Execution control variables Regulate program behavior, such as: Algorithm switches Spatio-temporal recording schedules Observations (optional) Provide observational data that can be used to validate/calibrate the model, such as: Streamflow records Transient groundwater heads Leaf Area Index, MODIS observations, etc... * these data types are required for the new linkages with CLM, normally, they have already been provided and there is no need for collection 56 Figure 5.1. PAWS model Data Flow Diagram. Table 5.2 listed the source that is needed by the GUI to create the input data for the model and their expected formats. ASCII grid is the txt file that can be exported from raster datasets in ArcMap. For other inputs, see the example input .MAT file distributed with the model. Table 5.2. File format specifications Data DEM LULC map LULC mapping table Common Data Source Either DEM or NED from USGS NLCD from US EPA or local agencies. Remotely sensed data Customized Format/Comments ASCII grid or Tiff ASCII integer grid A variable called lulc saved in .mat format that contains two fields: M for the 57 Watershed Extent River Hydrography Dataset Soils Type SSURGO soils database Weather Station Locations Climatic Data Groundwater Hydraulic Conductivity Groundwater Aquifer Layer information Initial Groundwater Head Local agencies delineated watershed boundaries NHD from USGS transformation matrix; G for the group information for each model RPT ESRI shapefile: Polygon ESRI shapefile: Polyline Need to be processed. A river needs to be coded for its river ID. Currently, scattered observations of river width and type SSURGO mapunit map ASCII integer grid or Tiff NRCS SSURGO A .mat file containing processed database database information NCDC and other ESRI shapefile: Point climatic data network NCDC and other climatic data network Local agencies or inferred from geological information Local agencies or inferred from geological information Local agencies or inferred from geological information NCDC downloaded format or MAWN downloaded format ASCII grid or Tiff ASCII grid or Tiff The thickness (or elevation) of each layer ASCII grid or Tiff 5.2. PRISM output and data structure The primary output of PRISM are the matName.mat and matName_CLM.mat files. These two files should be transferred into the execution folder, either manually or automatically (see dispatchJob.m). The driver control file should then be modified to update the mat file. 5.3. Input files for the Fortran executable Table 5.3 provides a list of input files for the Fortran input files. Italic means the name can be modified. Non-italic file names means the filenames are hardcoded and other names will not be recognized by the model. The primary input file are the *.mat file that is produced by the PRISM utility. Most other files can be customized easily or used as they are distributed. Some files 58 (carbon initial states, initial soil temperature) are regional specific but global inputs are currently being developed. Table 5.3. Input file list for the Fortran executable toRun.in (to be customized) matName.mat (to be generated by PRISM using source datasets) changepar.dat (to be customized or written by optimization algorithm) CLMpoints.dat (to be customized) pftcon.mat (distributed) TimeSeriesMap.dat (to be customized) initialCStates.dat (distributed, but may need to be generated for different regions) initialSTemp.dat (distributed, but may need to be generated for different regions) snicar_drdt_bst_fit_60_ c070416 (distributed) snicar_optics_5bnd_c0 90915 Driver control file that contains names of other input files and some control options. (Using this *.in file is called in-file initialization in the model. This should be the most commonly used approach. Alternatively, there are also mat-file initialization and txt file initialization. See section 5.3.1 for details) A mat file generated by the PRISM data preparation package. This mat file contains all basin characteristics, climate input, boundary conditions and some default parameters A text file containing parameter adjustment information. See section 5.3.1 for details Column and pft points for which output will be written to cRec.txt and pRec.txt. This file has two columns: code and index. If code is 1, the index stands for the CLM “column” number. If code is 2, the index is the CLM “pft” number. If empty, cRec.txt and pRec.txt will be empty. A mat file containing vegetation “pft” parameters for CLM. Imported from pft-physiology.c120110.nc from NCAR database A text file containing time points (in Matlab datenum format) scheduling output of spatial fields. See discussions of tsMap_xxx.mat in section 5.4.1. Initial carbon states file (a new input source available for world simulations will be added soon) Initial soil temperature file (a new input source available for world simulations will be added soon) Hard-coded input file for snow characteristics (impurities and reflectances). This is not our research focus so changes are not anticipated soon for this file. Hard-coded input file for snow characteristics (impurities and reflectances). This is not our research focus so changes are not 59 (distributed) anticipated soon for this file. 5.3.1. Driver control file Three types of control files can be sent as an argument to the executable from the operating system: *.in, *.mat and *.txt. They are called in-File initialization, mat initialization and txt initialization, respectively. Use one of these options as the input argument when launching the Fortran executable for the in the operating system. To see how to run the model with the input argument, see section 4.9. *.in file initialization is the most commonly used approach, for real-world watershed simulations. This option allows parameter adjustments and additional control options. *.mat file: this option will run the model based on the input mat file. No parameter change is possible. Model parameters and control parameters are exactly as they are saved in the mat file. This option is often used when restarting from a saved mat file (see renewMonth.m) for debugging or elongated simulations. *.txt file: this is a testing mode for conceptual models. With this option, the inputs in the *.txt file are interpreted differently than the *.in file. This option allows us to run conceptual/idealized models (see section 4.11) without employing any GIS files. Content of the *.in file (square brackets means optional input line): prj matName.mat 0 0 changepar.dat [mode nrepeat nMatOutputFreq] [printCodeR printFileName] The variables in this file are explained in the following table Table 5.4. Explanation of variables in the *.in file. Inside square brackets are default values for the optional arguments prj A string designating the project name. There should be no space in the string. This string (no space) will be used to construct output file names (see how prj is used in section 5.4). matName.mat The name of the primary input mat file, produced by the PRISM package. This mat file contains all basin characteristics, climate input, boundary 60 conditions and some default parameters 0 Unused space holder changepar.dat This filename can be changed but normally we kept it as it is. This is a file containing parameter adjustment information. Because of uncertainties, inaccuracies with inputs and scaling effects, the model often need parameter adjustment to perform well. This file is self-explanatory. Do not modify the layout and numerical value format in this file. Using other formats may lead to unintended consequences. Better modify from the existing example file. “field” is the parameter to be adjusted. “mapfile_or_index_or_leaveEmpty”, the last column, is the index into the array of “field”, to be left empty if the whole array will be adjusted. Three adjustment methods “imet” are allowed. 1: set value as; 2: add value to; 3: multiple by value. Imet 2 or 3 allows a spatially-distributed parameter to be adjusted while maintaining the spatial pattern. “v” is the value to be implemented. “code” is currently not used. “ul” are “ll” are the physical upper and lower bounds of the parameter to prevent out of bounds. For example, if the parameter ‘g.VDZ.VParm(12)’, before adjustment, has default value of 2. The parameter adjustment line reads: g.VDZ.VParm 3 5.580123e+00 4.00 0.00e+00 0 12 This line will multiple g.VDZ.VParm(12) by 5.580123, and will thus set the value to 11.16. However, as specified in ul, the physical upper bounds of this parameter is 4. Therefore, the final value set to this parameter will be 4. mode [normal] Execution mode. The mode is helpful for diagnosing model issues, find equilibrium states for carbon and nitrogen or mass balance debugging. “normal”: a normal simulation “column”: column-mode simulation, where groundwater flow and overland will be activated, and there could just be a few cells set as active in the domain. See section 4.12 for details of the column mode. nrepeat This is the number of times the model will loop through the years of climate [1] forcing. If the model is scheduled to start from 20010901 (YYYYMMDD) to 20101231, and nrepeat is 500, the model will run 20010901 to 20011231 once, and then loop through 20020101 to 20101231 for 500 times. This mode is helpful is the model needs to be run many times to semi-steady state, as would be required by equilibrium searching simulations in column mode. nMatOutputFreq 0: no monthly mat file output, used in large simulations to avoid intensive [1] disk writing 1: monthly output will be written printCodeR 0: output will be printed to screen (may die under mex mode) [0] 1: output will be written to file printFileName 2: means the general output will be shown on both the screen and the file printFileName printFileName The name of the file that screen messages will be written to [] 61 'normal 1 0' states that it's a normal-mode simulation, will only run the calendar once (will not loop), and 0 means the monthly output is suppressed (set to 1 if the job has a possibility to die). For txt file initialization, the interpretation of the input file is slightly different from the *.in file. When txt file initialization is employed, the Fortran code runs the time stepping routine timeStepping instead of the commonly called calendarMarch. Content of the *.txt driver file (square brackets means optional input line): prj matName.mat ts te dt modeBC 5.4. Output files of the Fortran executable The model provides a strong set of output capabilities to cover the temporal and spatial aspects of the simulation. Outputs include time series of basin average fluxes and states (prj.txt), prescribed recording points (prj_Rec.txt), CLM and PAWS states and variables at selected points (cRec.txt and pRec.txt) and spatial fields (prj_m.mat and tsMap_xxx.mat). The output files also allows model restart, which greatly facilitates debugging of otherwise difficult issues. 5.4.1. Standard output files From a standard simulation, given the project name is prj as specified in the *.in file, the output files are: prj_m.mat: Description Format Notes Save all data in w, g, r in this .MAT file at the end of the simulation. This mat file has similar content as the input .MAT file, but w now contains additional information. Especially, w.tData.maps contains time-averaged spatial maps of simulated results. See section 4.10.2 for details. Matlab .mat file The conversion factors are taken care of in tsMapDataSeries, which offers good examples of how to get meaningful units Examples of post-processing utilities prj.txt: Description plotVerticalTHE, summaryFromMapOutput, compareSim, renewMonth, tsMapDataSeries this is the file containing per-time-step basin-average hydrologic budget information, mass balance statistics, fluxes and states. PRISM’s utilities readbudget and plotbudget handles this output and puts the data into variables of readily usable format in Matlab. 62 Format Notes Examples of post-processing utilities prj_Rec.txt: Description Format Notes Examples of post-processing utilities cRec.txt: Description Format Notes Examples of post-processing utilities pRec.txt: Description Format The first line is the header for each column, and each time step (currently, hourly) writes one line of output to the file. Values are defined as the grid-average (total summed value divided by area of the entire grid m × n × ∆𝑥 2 ). Normally the basin occupies only a fraction of the grid area (TAVoTA: Total Valid Area over Total Area, a <1 value). Therefore, to get basin average value, the values need to be divided by TAVoTA in this file. PRISM’s processing utility plotBudget already takes this into account. readBudget, plotBudget, summaryFromMapOutput, compareSim extractFromRec, plotPresentation, hydrographSep This file records the “Requested” output information on the channels or land cells. These requests are ordered on the objects: w.Rec.robj before the simulation starts. Column 1 is the time stamp. Column 2 through 2+n are the output for n output requests. Prj_output.txt is used primarily to calculate objective function values for either calibration or evaluation. The first line is the header for each column, and each time step (currently, hourly) writes one line of output to the file. The first column is the timestamp. Subsequently, all requests are written to the same line. For each time step, subroutine writeRec will use the information stored in w.Rec.robj to write a line of output. Internally, the subroutine recAcc handles the accumulation of sub-time-step values to one macro time step. These requests can be added manually in Matlab, or prepared using GIS files containing monitoring points (See section 4.8.8). simResults3 This is a column-level output of CLM and PAWS states and fluxes. One line for each “CLM column” specified in “CLMpoints.dat” (with code 1, see inputs section) at each time step. Format are as specified in subroutine writeCLMrec. As of 01/17/20015, the output items are, respectively: Colums 1-5: time stamp, “CLM column” index , top 10cm soil temperature (degrees C), top 10cm soil moisture content ([-]), 10cm-layer soil moisture Colums 6-10: 25cm-layer soil moisturegroundwater head of unconfined aquifer, head of aquifer layer 2, infiltration during time step ([m]), deep percolation during time step ([m]) Columns 11-15: groundwater lateral inflow ([m/day]), ground-received precipitation (m), runoff ([m]), transpiration ([m]), 1st-pft plant root water-constraint factor Columns 16-35: soil moisture for layers 2:21. procInitialCState, spatioTemporal This is a pft-level output of CLM states and fluxes. One line for each “CLM pft” specified in “CLMpoints.dat” (with code 2, see inputs section) at each time step. 63 Notes Examples of post-processing utilities Format are as specified in subroutine writeCLMrec. As of 01/17/20015, they are, respectively: Colums 1-5: time stamp, “CLM pft” index , sunlit projected leaf area index, total leaf area index Colums 6-10: net primary productivity (gC/m2/s), leaf carbon (gC/m2), leaf nitrogen (gN/m2), photosynthesis (umol CO2 /m2 /s), fine root carbon (gC/m2) Columns 11-15: pft-level plant root water-constraint factor, solar radiation absorbed (total) (W/m2), solar radiation reflected (W/m2), vegetation temperature (Kelvin), sunlit stomatal resistance (s/m) procInitialCState, spatiotemporal month.mat & month_CLM.mat (optional): Description Format Notes Examples of post-processing utilities This is the monthly save of internal states (g, w, r). This is normally used for debugging purpose. When some bugs happen at a time distant from the model starting date, this is very useful: we can use month.mat to restart the simulation. Matlab .mat file renewMonth tsMap_xxx.mat (optional): Description Format Notes Examples of post-processing utilities This is the a time series output of spatial fields, operated by timeSeriesMapControl and mapOutput2 as scheduled in TimeSeriesMap.dat. This output a series of tsMap_xxx.mat files so that we have a complete time history of the evolution of spatial fields. Matlab .mat file with only the variable w At the beginning of each day of simulation, the model checks if it hits a time point written in TimeSeriesMap.dat. If so, the variable w is written into tsMap_i.mat, where i is the index of the time point and the index starts at 0 for the first entry in TimeSeriesMap.dat. At the same time, the accumulated fields in the memory are wiped clean and the accumulation will start over again. Therefore, if TimeSeriesMap.dat contains consecutive daily time points from day d1 to day d2, then we will have daily output between these two days. In this case, discard tsMap_0.mat as it contains accumulation of values all the way to before d1, tsMap_1.mat corresponds to the states and fluxes accumulated during d1. The last tsMap_xxx.mat in the series contain values accumulated in the day d2-1. tsMapDataSeries 5.4.2. Output of spatial fields PAWS has the ability to accumulated and output simulated fields of many variables according to the output schedule prescribed in TimeSeriesMap.dat (optional, section 5.3). Subroutine mapoOutput2 handles this accumulation and output. By default, if this file is missing or it is empty, all fields are accumulated in w.tData.maps from w.CaliStartTime (or w.ModelStartTime if w.CaliStartTime is empty) to w.ModelEndTime and saved in the final prj_m.mat. Note that 64 the units of the fields. All fields have been accumulated w.tData.maps.n times so they must be divided by this number to obtain the original unit. In the following we describe the content of w.tData.maps. In matlab, if we do load prj_m.mat maps = w.tData.maps Then we will have these subfields under “maps” (in square brackets is the original unit, where dt is the macro-time step. Currently, dt = 1 hr). Not that all fields have been accumulated w.tData.maps.n times so they must be divided by this number to obtain the original unit: .n: the number of times the fields have been accumulated. .Prcp [m/dt] (𝑛𝑛 × 𝑑𝑑):: Ground-received precipitation (including throughflow, stemflow, snowmelt and condensation) .Inf [m/dt] (𝑛𝑛 × 𝑑𝑑):: Infiltration .PET [m/dt] (𝑛𝑛 × 𝑑𝑑):: Potential evapotranspiration .ET [m/dt] (𝑛𝑛 × 𝑑𝑑):: Actual Evapotranspiration .EvapG [m/dt] (𝑛𝑛 × 𝑑𝑑):: Ground evaporation .Dperc [m/dt] (𝑛𝑛 × 𝑑𝑑):: Recharge (moving from vadose zone to unconfined flow layer) .Dperc2 [m/dt] (𝑛𝑛 × 𝑑𝑑):: Deep percolation (from unconfined aquifer to confined aquifer) .SatE [m/dt] (𝑛𝑛 × 𝑑𝑑):: Saturation excess .InfE [m/dt] (𝑛𝑛 × 𝑑𝑑):: Infiltration excess .botT [day/dt] (𝑛𝑛 × 𝑑𝑑):: Time spent in subroutine botDrain, which is a fail-safe drainage subroutine when the Richards solver totally fails to converge. Should be very very small. .Qoc [m/dt] (𝑛𝑛 × 𝑑𝑑):: overland contribution to channels .Qgc [m/dt] (𝑛𝑛 × 𝑑𝑑):: groundwater contribution to channels .SUBM [m/dt] (𝑛𝑛 × 𝑑𝑑):: sublimation – dew on snow .SMELT [m/dt] (𝑛𝑛 × 𝑑𝑑):: snowmelt .GW [m] (𝑛𝑛 × 𝑑𝑑):: groundwater head of the unconfined aquifer .ovnH [m] (𝑛𝑛 × 𝑑𝑑):: overland flow depth .clmmap(𝑛𝑛 × 𝑑𝑑 × 100):: a variable containing maps of variables from CLM. Each variable occupy one layer of the 3D array (:,:,index). There are altogether close to 85 output fields, ranging from net ecosystem exchange to sensible heat flux to ground temperature, and this list continues to evolve. Therefore, the subfields are too numerous to be listed here. Users should refer to the subroutine mapOutput2 in the Appendix to examine the different fields and their indices in this array. Additional required fields can be added in the same way. 65 6. Function References (To generate a function references report like the following from comments in the codes, in Matlab command prompt, after using gpath, run: funcReport('report.txt',Env.path) The report will be written to report.txt. To see how to write comments that will automatically be include in the report, read the comments in funcComments.m and subrComments.m. ) <-> Aquifer (prism.F90) calls the 2D groundwater solver , either static or nonlinear storage coefficient OPT = 3 (static:aquifer2D -- this should be used in most cases), else (nonlinear storage: aquifer2DNL) <-> Aquifer2D (Flow.F90) Compute Lateral Movement of the Unconfined Aquifer Equations solved by Conjugate Gradient PDE Unit: [L]/[T The difference from Confined Aquifer is that the aquifer thickness is changing.Also the Specific Yield (differential water capacity) is changing ATYPE=0, confined aquifer, =1, unconfined aquife h is hydraulic head (L), E is bottom elevation(L), D is aquifer thickness (for ATYPE=0,D=h-E). K is conductivity(L/T), W is the source term (L/T). S is specific water capacity (specific yield for unconfined or storativity for confined).Mapp is a map of active cells (or percentage active) BBC is boundary conditions, NBC is number of BBCs. CP SHEN, PhD. MSU <-> Aquifer2DNL (Flow.F90) Non-Linear version of the GW code. Equation solved using newton iteration with Jacobians FR is to multiply (THES-THER), currently not used, applied outside The nonlinearity comes from using Hilberts' drainable porosity as the ST PDE Unit: [L]/[T] Added three input: HB: bottom of aquifer NLC, nonlinearity coefficient as: [1ES,2THES-THER,3ALPHA,4nn,5:-1/ nn,6:-(1+1/ nn)] STO, current storage, put zero for initialization nc: the number of coefficient CP SHEN. PhD. MSU <-> BOTDRAIN (Flow.F90) This is a linearized fail-safe bottom drainage model that RE can fall back on. it is simplified as it only means to help the RE solver (occasionally) in case of convergence problems. It computes flux from bottom up, the flux is the min of . 1.explicit flux 2.saturation of receiving cell and 3.available moisture of providing cell.may be less accurate, but more stable 66 <-> DCOMP (transport_cv3.F90) Compact scheme for advection <-> FWENO (transport_cv3.F90) WENO CODE for advection need variables in the main program: W,d,A,ALPHA,DX,QQ(may not be Q, depending on defined on where) <-> F_oc_dw.m Diffusive Wave Approximation to Overland-Channel Exchange Used an explicit DW formulation, not self-similar. Maybe not good for big dt. Also compute groundwater level for the channel cell <-> GGA (Flow.F90) Solve 1D GENERALIZED GREEN AND AMPT METHOD with source term writen using the concept from Jia 1998. Enhanced for applicability and stability Chaopeng Shen. PhD. CEE. Michigan State Univ. <-> GGA_Source (Flow.F90) Applying source term in the modified GGA method <-> GW_sol.m calls fortran program aquifer2D to solve the groundwater flow equation in quasi-3D fashion Input: iGW (aquifer layer number) Output: g.GW.h; g.GW.Qperc (Recharge to lower aquifer) <-> GW_source.m In this program source terms set elsewhere will be cleaned. So if necessary they must be set elsewhere Input: iGW: aquifer layer number; g.Riv.RepLidx (The repetitive indices: multiple segments in one land cell); r.Riv.fG (river exchange); g.VDZ.Dperc (recharge) Output: g.GW.h, W, Cond.h <-> ImpDif (transport_cv3.F90) Implicit Central Difference for dispersion and Inactivation/Decay use variable in main workspace: D,A,Eta,aa,bb,cc <-> Lowland (Flow.F90) 67 Lowland is the subroutine for depression storage treats overland flow as first aggregating to depression storage of the cell which will then flow out, if exceeding capacity of the depression storage This is similar to original flow domain, but with a storage and exchange with groundwater dP contains parameters of the depression storage which are: [1.hback, 2.hod, 3.Kdg, 4.dfrac, 5.gwST, 6.mr, 7.g1, 8.g2, 9.g3, 10.EB(GW), 11.Ed] hff is the volumetric depth of flow for the flow domain (subtracting hc by hod) hod is the storage depth of the depression storage which is related to topography and land use Kdg is the leakance between local depression storage and groundwater, related to landuse and soil types dfrac is the fraction of depression storage in the cell mr is the thickness of leakance bed g1 = K*dt/mr, g2=g1*Ad/(Ac*S), g3=g1/(1+g2) ICASE = 0 typ<0 -- only calculate run-on, not going to do runoff from h(1) to OVN.h (do it in vdz1c) parameter(sep = 0.5D0) function to calculate runoff hc is h in flow domain, hI is h in impervious ponding, h is vadose zone h ho is initial abstraction of ponding layer hG is the mean groundwater elevation in the cell hback is the barrier height for flow domain to flow back (an offset) which should be the difference between average elevation and bottom elevation of the cell <-> PNPOLY (pnpoly.F90) decide if a point (XX,YY) is within a polygon (PXX,PYY) <-> PenmanMonteith.m This function computes the reference ET using Penman Monteith method Steps of calculating ET: (1), reference ET for water, soil and vegetations (reference type) (2), spread solar radiation using Beer-Lambert law and LAI (3), compute total ET demand for each layer by considering crop coeff (4), compute actual ET by considering water stress and depth distribution (5), add up ET at each layer to become ET sink term for VDZ model inside this function, Rad, Hb, Hli, Rn are MJ/m2/day rET, rETs are mm/day RET is in mm/day Input: tau: air transmittance, ref: code for different reference basis (others self explanatory) Output: rET: reference ET; rETs: reference ET for bare soil, Rn: net radiation Hb: outgoing long wave radiation, Hli: incoming long wave radiation <-> Runoff (Flow.F90) Computes runoff from impervious region and also from ponding domain (if it is not solved from inside vdz1c, e.g., when GGA is applied) The formulation is an compact implicit diffisive wave model with coefficients written in SN typ<0 -- only calculate run-on, not going to do runoff from h(1) to OVN.h (do it in vdz1c) 68 function to calculate runoff hc is h in flow domain, hI is h in impervious ponding, h is vadose zone h ho is initial abstraction of ponding layer hback is the barrier height for flow domain to flow back (an offset) which should be the difference between average elevation and bottom elevation of the cell imp is the impervious cover (fraction). higher the imp, higher direct runoff (higher f2) <-> SPDXU (vdata.F90) Compute b = full(A) * u A(:,i) is the d(i)-th diagonal of the full matrix A(I,i) are the intersecting elements of the i-th diagonal with the I-th row of the full(A) if d(i)<0, then the first abs(d(i)) elements are zero (program don't use) if d(i)>0, then the last d(i) elements are zero (program don't use) it is expect u(K) can go out of bound. If no error is reported, let it be flag>=1, b = full(A)' *b <-> SURFACE (Flow.F90) This function takes care of ET, CANOPY, DEPRESSION STORAGE Rule of Thumb: Should not use pointer for output unless it is very clear given the context CH AOPEN G SHEN Code Unit: m <-> Solar_Radiation.m with numerical input, calculate the solar radiation for a given year Input arg: latitude = North Latitude (35N = 35, 25S = -25), degree longitude = East Longitude (75E = 75, 45W = -45), degree elevation (m) year = eg. (2000) weatherdata, which has the following format Day of year, min. air temp, max. air temp, rainfall Each day of year is on a separate line, missing values can be skipped. Output arg: Rs = solar radiation (W/m2) d_T = T_air_max - T_air_min, extreme temperature change of the tau value for each day <-> THOMAS (vdata.F90) This program does not care about a(1) and c(N) All BC should be embedded into coefficients this programs solves for tri-diagonal matrix in the form of aX(i-1)+bX(i)+cX(i+1) =d <-> TV.m the main visualization function used by the GUI display menu <-> UNCONFINED (prism.F90) 69 THIS FUNCTION IS NOT USED IN THE WATERSHED MODEL reserved for testing coupled sat/unsat models. The original dynamic storage approach pls see obsolete/prism_saveBeforeAddingVauclin.F90 <-> UNSAT (prism.F90) Unsaturated zone subsurface processes Loop through the valid cells to do: (1) update lowland storage (2) if applicable (large enough prcp, dry portion exists), use GGA to compute infiltration (3) use Picard iteration scheme with variable top boundary condition for soil water flow <-> adhoc_Set.m These codes are ad-hoc settings that will be implemented in formal codes This include initialization of some variables and setting some parameter values <-> agesn (snow.F90) Subroutine agesn(tausn,dt,ps,tsurf,tk) <-> applyCond (Flow.F90) Apply boundary condition for the groundwater model CP Shen <-> asolve (vdata.F90) This is used mainly for pre-conditioning To solve Main_Diagonal(A)*u=b Since it's only main diagonal, transpose operator is the same <-> borrowStations.m borrow valid data records from neighboring stations for missing data. bk--# of bad data points in the end nk--# of borrowed data points in the end <-> budgeter.m This function summarizes the hydrologic budget of the watershed in the past time step and writes relevant mass balance output Input: obj: a string indicating the type of budgeting being done. w for watershed, r for river, OVN for surface runoff, pond for surface water Output: text file output <-> calendarMarch.m 70 this function runs the model according to the calendar year/month/day it facilitates the scheduling of events it also applies essential operations like initialization, parameter change and calls adhoc_set outputs: budgeter:recfile(1)-Basin average fluxes (time series) recAcc and writeRec: recfile(2)-Monitoring point (time series) mapOutput: results saved in final mat file (time averaged Spatial maps) movOutput: spatial maps saved over time columnOutput: cell recording saved in final mat file w.tData.S1 <-> columnOutput.m function to grab output from a land column for a time step. This is for output purposes, working with wtrshd_column, also wtrshd_day. Include fluxes and states <-> dailySoilT (Flow.F90) solve a simple heat equation to update soil temperature <-> distWea.m This solver normally works on hourly time step on a station level, it does: (1) distribute prcp using reference precip unit hyetograph (2) calculate net radiation, reference (FAO grass) ET (3) store some ET coefficients data structure: a struct called 'day' include data distributed for each day for each station. day.prcp(1:24,i) is for the ith station. Input: wid: watershed ID, H: hour of day, JD: julian day (of the year) Output: Updated: g.Wea.day, g.OVN.prcp, g.Wea.t <-> elem (vdata.F90) copy all data in A (whatever rank it is) into A0, an 1D array <-> funcComments.m Extract the comments from a function file rules: comments lines that would be reported start with the first line after function statement, beginning with (E). Then all contiguous comment lines are included. Continuation lines are signaled by a hyphen at the end of the line. Otherwise the line will be treated as a new line. Note there should not be comment symbol inside a comments line otherwise it won't print properly <-> funcReport.m generate a documentation, using comment lines written in the functions in 'paths' which is cell arrays of paths. 71 varargin{1} is the types that will be processed. varargin{2}, if present, is the excluded strings. There are a list of default excluded strings <-> gClearTFlux.m This is to clean up transitional fluxes, applied after each land cell step <-> gOBJ.m This function defines the model data strctures (create empty templates) <-> h1negative (Flow.F90) this subroutine tries to fill up upper cell hh3<0 <-> highlightPoints.m this is the general map producing function to visualize 2D data with GIS shapes and coordinates. usage: highlightPoints(idx,idy) to plot the DEM grid highlightPoints(idx,idy,'g.GW(1).h') to plot head (or change the name to output other variables) highlightPoints(idx,idy,data) to plot the data idx,idy are the indices of points to be highlighted they can be put [] if no point is to be highlighted if only idx is present, idy=[], idx will be interpreted as the 1D indices the data to be plotted can be a 2D array, or a shapefile highlightPoints(j,i)--(x,y) indices or highlightPoints(idx): a bunch of 1D indices <-> initValues.m These are some values initiated after parameter change has been applied This is to avoid values being modified by changepar Applying multiplier parameters set in adhoc_set (and modified in changepar) VDZ initial values: heads, theta, WP, FC, they are determined from here because equilibrium profile THE is a function of K This equilibrium is an initial guess of soil water content to quickly bring the model into reality Assume hydrostatic equilibrium and evaluate THE and h This assumption may not be valid in arid regions, we need to make modifications if necessary, and this is only an initial guess also modifying River E and K previously <-> insertLoc (vdata.F90) find where ins is in E In is defined as ins between E(In) and E(In+1), may be equal to E(In) mode=1, E is in descending order 72 <-> interfaceH (interfaceHH.F90) an function to calculate interface water depth between two cells when both sides are wet, the water depth at interface will be the mean, this will be 2nd order accurate when one side is dry, if the wet side is the the lower side, hx=0 if the wet side is the higher side (with relaxed condition), upwinding of depth is employed <-> interfaceH (vdata.F90) determine interface depth between two cells <-> linbcg (vdata.F90) Linear BiConjugate Gradien Solves Ax = b for x, given b of the same length, by the iterative biconjugate gradientmethod. On input x should be set to an initial guess of the solution (or all zeros); itol is 1,2,3, or 4, specifying which convergence test is applied (see text); itmax is the maximum number of allowed iterations; and tol is the desired convergence tolerance. On output, x is reset to the improved solution, iter is the number of iterations actually taken, and err is the estimated error. The matrix A is referenced only through the user-supplied routines atimes, which computes the product of either A or its transpose on a vector; and asolve, A is diagonally-stored matrix. See SPDXU comments for explanation of A's format. Modified from numerical recipies CP Shen, MSU <-> lineprofile (lineprofile.F90) obtain a profile of a raster data along a prescribed line only consider points prescribed in the X Y pair. will not considering crossing of a raster cell without points in it <-> linkBC0 (prism.F90) Linking codes for type 0 boundary conditions for the aquifer BCs with C,S,N,E indices <-> linkBC1 (prism.F90) Linking codes for type 1 boundary conditions for the aquifer Link Fortran BC struct to Matlab struct (use pointers) <-> linkBC2 (prism.F90) Linking codes for type 2 boundary conditions for the aquifer (quasi-3D lower aquifer seepage) Link Fortran BC struct to Matlab struct (use pointers) <-> makeDay.m gather data from weather stations to create an object, 'day' Input: RFRAC: rescaling factor for radiation as the program's output is larger than actual radiation; frac: a rescaling factor for prcp used during testing, it should be 1 now; year: YYYY format, mm: month in MM format; JD: julian day of the year, day: a structure template for the outgoing object 73 Output: day, a structure which contains weather data for the day in arrays that are stored as fields <-> mapOutput.m accumulatively output map averages This produces a long term spatial trend of variables, states and fluxes <-> mexFunction (lineprofile.F90) Gateway function from Matlab to Fortran Call: euler(g(gid),g(gid).AMR) Users Generally do not have to modify this function, just make the computational subroutine accept the right arguments in the right order 1. Input: data, dt, dx, level, GHO 2. Output: data, smapx,dqdt, dqdtN <-> mexFunction (prism.F90) This function is the gateway to the Fortran programs for surface and subsurface processes Depending on the value of the first input, mode, the gateway function calls different subroutines the subroutines named link***, bridge*** are all interface functions between Fortran and Matlab. In Fortran, the structures (derived types) are defined in vdata.F90, which contain similarly-named fields in pointer format. Essentially, a memory is allocated while loading the .mat file (or its address passed in from matlab). The interface function then obtains the addresses of the fields in Bridge*** subroutines and thenassociate these addresses to Fortran pointers in link*** subroutines Each set of Bridge*** and Link*** subroutines work on a sub-object. As a result the program is modularized and object-based. To understand these linking codes, here is the explanation: Remember, anything that can be viewed in Matlab is an mxArray. Each matlab data (even double array) is data structure (mxArray) that contains slightly more info than its data like size, type and a pointer which points to the starting address of the actual data. mxArray cannot be directly used in C or Fortran due to this wrapping. Rather, we need to specifically get the addresses to the data. pr=mxGetPr gets you the address of the real data. This step is done in Bridge*** routines. However, Fortran still cannot understand pr as it still needs to know what is the size and rank of the array.This is done in Link*** subroutines with declare the sizes and ranks.- The calling function pass in val(pr) that is the starting address of the data. (It will not work if you pass in pr without <-> mexFunction (riv_cv3.F90) Gateway function from Matlab to Fortran Call: euler(g(gid),g(gid).AMR) Users Generally do not have to modify this function, just make the computational subroutine accept the right arguments in the right order 1. Input: data, dt, dx, level, GHO 2. Output: data, smapx,dqdt, dqdtN <-> nearestPop (nearestPop.F90) Inverse Distance Weighting interpolation, handles NaN 74 <-> objReport.m this function automatically generate report for an object with text descriptions. pad is the existing padding before line, padi is the item that will be appended if going into deeper level. This function iscalled recursively. <-> oneD_Ptr (vdata.F90) returns a 1D pointer to a 2D matrices so that row-based index can be usedto query values <-> one_step (riv_cv3.F90) Input: AA,(UU,wF,hhx). Output: dAdt,Q,UU,hhx,hh,RR Does not modify AA <-> ovn_cv (Flow.F90) overland flow module written in Fortran Use explicit 3-stage Runge-Kutta interface depth method to solve 2D diffusive wave equation (RKFV) The feature of this Fortran code is that the calculation is only done at wet regions to save some time CP S. PhD. MichSt <-> ovn_cv.m overland flow (2D diffusive wave) with RKFV scheme calls the fortran subroutine ovn_cv Output: Updated g.OVN <-> parseFiles.m delineate lists with ; into separate items <-> pcg (vdata.F90) This is the pre-conditioned (using main diagonal, or called Jacobi preconditioner CG algorithm given by Leveque FD book on page 84, but ak and bk is different.A is a diagonally-stored large,sparse SPD matrix. See SPDXU comments for explanation of A's format Modified from Numerical Recipies, using Diagonal-Sparse Matrix Storage.CHAOPENG SHEN, Environmental Engineering, Michigan State University This only works for SPD matrix, but in this case it's 2X faster than linbcSolves Ax = b for x, given b of the same length, by the iterative preconditioned gradient method. On input x should be set to an initial guess of the solution (or all zeros); itol is 1,2,3, or 4, specifying which convergence test is applied (see text); itmax is the maximum number of allowed iterations; and tol is the desired convergence tolerance. On output, x is reset to the improved solution, iter is the number of iterations actually taken, and err is the estimated error. The matrix A is referenced only through the user-supplied routines atimes, which computes the product of either A or its transpose on a vector; and asolve, <-> prepSnow (prism.F90) initialize some snow parameters in the module 75 <-> rAvgStages.m nComputing average stage for overland flow- channel exchange calculation Output: g.Riv.Stages <-> rClearTFlux.m Clear Transition Fluxes Output: r.Riv.Qoc,Qgc,evap,trib <-> rLateral.m Compute Source Term and Boundary Conditions for the River Segments Source Term: (m3/s/m) 1.Prcp; (m/s) --*w 2.Evaporation; (m/day)--*w/86400 3.Overland Inflow; 4.Tributaries (cms); --/dx 5.Groundwater Seepage/Contribution (m3/day/m) /86400 6.Upstream/Downstream BC Units of all source terms are m2/day (m3/hr/m). so Sprcp = prcp*w We are not expanding Sprcp when top width increases with increasing flow with the thought that the prcp landing in the adjacent cell will contribute that water anyway. In stead of doing thing on both sides, just ignore this step. Currently, overland exchange is directly applied in F_oc_dw, rather than a source term. r.Riv.Qoc = 0 at all times. So this is now mainly computing tributary inflows Input: tributary flows: r.Riv.Qx Output: r(rid).Riv.S and upstream, downstream boundary conditions <-> rMinDtSet.m Check for maximum velocity and COU2 The rational is that extreme cases happen when flow is very high (This may be wrong) and thus velocity is high. The most correct way is to identify if exchange term is too big, but there is no good way to check for that prior to computation of river flow Two Criteria: (1). Umax (2) Qmax Input: RL: list of river IDs; RDT: remaining dt to march in this river network loop step <-> r_MacCormack.m RKFV scheme for 1D diffusive wave equation For historical reasons this is named MacCormack, in fact this function is not MacCormack scheme. Future revision should modify its name for river flow, the upper and lower boundary conditions are stored in r.UPST,UPSV,DST and DSV. They are wrapped in rLateral Input: r(rid).Riv states Output: updated r(rid).Riv 76 <-> recAcc.m record accumulative fluxes before they are cleared for mass budgeting This is generally called for river flux accumulation Input/Output self-explanatory in the codes <-> riv_cv (riv_cv3.F90) RK3 river flow Chaopeng Shen PhD Environmental Engineering Michigan State Univ. <-> rtnewt (vdata.F90) newton iteration, modified from numerical recipie funcd is the function pointer, x1 and x2 is the bound, xacc is the convergence criteria for x, others are input for funcd. In fact, in this function, x1,x2 is only to generate an initial guess,no boundidng functionality funcd must accept these input and return f, function value and df, derivative value <-> rtsafe (vdata.F90) newton iteration, modified from numerical recipies safe version of newton iteration <-> satExcess (Flow.F90) picard iteration to solve the nonlinear equation for saturation excess used in the scenario of short cut for saturation excess <-> scheduleSolar.m run through the climatic input to prepare the solar radiation for a year using Spokas' method for every station, and record the air transmittance, tau, for each day <-> slope1 (aslope.F90) calculate the the most outside layer is discarded <-> slope2 (aslope.F90) the most outside layer is discarded <-> snapPoints (snapPoints.F90) snap a number of points to a polyline line feature, find the snapping indices on the line XYP, (X,Y) of points to be snapped 77 XY, (X,Y) coordinates of polyline y, (X,Y) of snapped points ind, index (in the XY sequence) of XYP <-> subrComments.m Extract the comments from a Fortran file rules: comments lines that would be reported start with the first line after subroutine statement. Then all contiguous comment lines are included. Continuation lines are signaled by a hyphen at the end of the line. Otherwise the line will be treated as a new line. Note there should not be comment symbol inside a comments line otherwise it won't print properly. In order for the subroutine or function to be included in the report, It has to start at column 7, the comment lines also need to start from 7. <-> surface_proc.m land surface processes (vegetation, ET) and subsurface processes (soil water flow). This function assembles some input in VDZ.Cond, and then calls the fortran interface with code = 1 Input: H: hour of day; varargin: irrelavant for watershed application Output: updated g.VDZ, g.GW.h and g.Veg <-> swFunc (Flow.F90) function to compute average wetting front suction see Jia 1998, Neuman 1976 for details for computation simplicity, obtain the value from closest n,l,h values in computing the matrix, alpha was assumed 1 (or,say, the integration variable was alpha*h) <-> transport (transport_cv3.F90) Advection Dispersion equation for 1D transport Input: AA,(UU,wF,hhx). Output: dAdt,Q,UU,hhx,hh,RR USE Vdata Does not modify AA <-> updateVeg (prism.F90) Computes the layer of rooting depth, evaporation extinction depth, canopy interception, bare soil fraction and albedo <-> vdz1c (Flow.F90) Vadose Zone Model using Celia Picard iteration scheme CP Shen. PhD. CEE, MSU PDE Unit: T^-1 Boundary Condition is implemented with a ghost cell on the top or in the bottom For Equation BC the top layer is included in the computation. Input: ddt: an initial guess of time step (recorded from last time step) 78 dtP: [minDT maxDT macroDT] BBCI: a derived type containing boundary conditions BBCI(2)<-> wWeights (wenomod.F90) 2p-1 order, p cell stencil <-> waterTable (Flow.F90) recognize the position of the water table, both water table layer (WTL) and position (GWL) WTL: the first fully saturated layer (water table higher than its upper edge) <-> weno3intp (wenomod.F90) interpolation for a bunch of indices in a rectangular box <-> weno5intp (wenomod.F90) interpolation for a bunch of indices in a rectangular box CHAOPENG SHEN Environmental Engineering PhD (to-be), Michigan State Univ <-> writeRec.m write accumulated fluxes at monitoring points to file, and clear value <-> wtrshd_day.m The daily marching script that runs watershed model for a day. Basic time step is hourly (or the macro watershed time step w.dt).Surface flow and river flow may run faster. Input: wid: watershed id, most likely 1, T: final time, most likely currenttime + 1 (day), JD: julian day (of the year) Output: TT: CPU time collected for different components: [1vegation+vadoseZone, 2overlandFlow, 3riverNetwork, 4groundwater, 5output] sig: whether the model exited the day normally (0) or with error (1) updated all relevant fields in g and r 79 7. Variable References g: land grid top-level object (structure array) .DM: Domain .d: spatial stepsizes [dy,dx] .msize: grid size ([ny nx]) .nGho: number of ghost cells [nGhoy,nGhox] .Map: map (double) of valid cells (Currently not used) .MapL: map (logical) of valid cells (Currently not used) .Nxy: the index of first and last valid cells in y and x dimension concatenated in a 1D array .origin: spatial original of grid [y(1,1),x(1,1)] .origin_idx: field reserved for future multiscale modeling .x: 1D array of x coordinate .y: 1D array of y coordinate .Pbound: Reserved field .Cbound: physical domain boundaries of y and x dimension concatenated in a 1D array .Ebound: similar to Cbound but extended to the ghost cell boundaries .dt: time step (d) .t: time (matlab datenum format) .OVN: overland flow object .h: overland flow domain depth (m) .Eta: overland flow domain free surface elevation (m) .U: x direction velocity (m/s) .V: y-direction velocity (m/s) .S: source term to overland flow (m/s) .ho: overland flow ground interception (m) .hd: overland flow depth in the lowland storage domain (m) .SN: Coefficient of surface runff rate, SN = (86400*S0.^0.5)./(Mann.*dist) .t: time - Matlab datenum format .dt: time step .Cond: boundary conditions for overland flow .Mann: Manning's coefficient .Rf: Runoff (m) .dfrac: areal fraction of lowland storage .dist: average distance from ponding domain to flow domain .hc: ponding domain depth (m), temporary holder .hf: runoff depth (m)-- preset parameter .OVF: areal fraction of flow domain .ffrac: fraction that stayed on the ponding domain (not runoff) .VDZ: vadose zone water object .DZ: Layer thickness (m) .DDZ: Distance between cell centers (m) 80 .NZC: number of active cells .PRatio: areal ratio of permeable land .EB: elevation of cell bottom (m) .E: elevation of cell center (m) .h: suction heads (m) .ET: Evapotranspiration .SRC: Source term (m/d) .WTL: index of the layer whose top is immediately below water table .K: hydraulic conductivity (m/d) .C: water specific capacity .THE: moisture content .DF: accumulated infiltration (m) .Dperc: accumulated recharge (m) .R: R(:,:,1):time spent in botdrain; R(:,:,2): complete saturation? .t: time .dt: last used time step for the column .dtP: [minDt,maxDT,macroDT] .THER: residual water content .THES: saturated water content .KS: saturated conductivity (m/d) .Ko: air-entry conductivity (m/d) .N: vG parameter N .LAMBDA: vG parameter Lambda .ALPHA: vG parameter Alpha .Mapp: map of active columns .FC: field capacity .WP: wilting point .GWL: Groundwater level determined from soil moisture profile .th: snow sub-object .GA: Generalized Green and Ampt sub-object .GW: groundwater object .DZ: layer thickness .EB: bottom elevation of layer .ES: top elevation of layer .E: center elevation of layer .D: layer thickness for computing T .h: hydraulic head .hNew: newly solved hydraulic head .tt: time .dt: time step (d) .K: conductivity (m/d) .T: transmissivity (m2/d) .ST: storativity .W: source term (m/d) .DR: Lateral Drainage term .Qperc: Deep percolation (positive downward, m/d) 81 .botK: conductivity of bottom aquitard (m/d) .botD: thickness of bottom aquitard (m) .mH: mean hydraulic head of layer (m) .mB: mean bottom elevation of layer (m) .mK: mean hydraulic conductivity of layer (m/d) .Cond: boundary conditions and seepage conditions .MAPP: mapp of domain cells .Topo: topographic object .E: mean cell elevation .Ex: elevation of x horizontal boundary i+1/2 .Ey: elevation of horizontal y boundary j+1/2 .S0: mean slope of cell .S0x: mean slope in x direction .S0y: mean slope in y direction .Veg: vegetation object .Frac: areal fraction of each RPT .LAI: Leaf area index of each RPT .RPT: RPT number of each type in the cell .BSoil: areal fraction of bare soil .Root: Rooting depth of each RPT .RDFN: Root distribution function .EDFN: evaporation distribution function .Delta: areal fraction of leaf coverage of each RPT .hc: canopy height (m) .Kc: Crop coefficient .Cpc: canopy water storage capacity (m) .CS: canopy storage (m) .EvapCS: evaporation of canopy storage in time step .SNOW: Snow in time step (m) .albedo: albedo of each RPT .ASP: aspect ratio .Imp: Impervious cover fraction .SWE: Snow water equivalent (m) .Gprcp: precipitation that falls on the ground (m) .EvapG: ground evaporation (m) .Salb: snow albedo .SNOCOV: snow cover fraction .SNOM: snow sublimation in time step .NewS: new canopy storage (m) .Evap: evaporation (m) .Tp: transpiration (m) .ET: Evapotranspiration (m) .PET: potential ET (m) .RPET: reference ET .SMAP: map of active columns 82 .LU: reserved field .Soil: reserved .Wea: reserved .Riv: object containing exchange info with river .ID: river ID connected to the land grid .Lidx: The indices of land grid cells intersecting with each river (cell format containing 1D arrays saved for each river) .Cidx: the channel indices corresponding to the intersecting segments .ZBank: bank elevations for each intersecting river (m) .Len: segment lengths (an 1D array for each river) .Stages: river stage elevation .W: river width .TM: mass transfer matrix to convert quantity from river segment to river cells .TN: mass transfer matrix to convert quantity from river cells to river segments .Budget: reserved .AMR: reserved .status: reserved .msg: reserved .temp: reserved .Group: reserved .title: reserved r: river top-level object (structure array) .order: reserved .shape: reserved .q: transport grids (indices in the q array) on this river .Riv: object containing all variables pertaining to calculation of flow .h: river flow depth (m) .hx: flow depth at cell interfaces (m) .Ac: river cross sectional area (state variable) m2 .U: flow velocity (m/s) .w: river width .wF: width at interfaces .R: Hydraulic radius .E: cell center elevation .Ex: elevation at cell interfaces .Eta: cell center free surface elevation .ZBank: Bank Elevation .Qx: discharge at cell interfaces (m3/s) .EstE: estimated stage (due to overland flow contribution) 83 .DX: spatial stepsize .Mann: Manning's coefficient .S: source term (m2/s) .S0: slope .l: total length of river (m) .CType: channel type code .UPST: type of upstream boundary condition .UPSV: upstream boundary condition value .DST: downstream BC type .DSV: downstream BC value .K: channel conductivity (m/d) .hg: groundwater elevations .mr: thickness of bed bottom materials .fG: groundwater contribution in time step(m3) .trib: tributary contribution (m2/s) .Ab: cell area (m2) .t: time .dt: time step (d) .Net: river network hierarchical information .level: level in the river network, higher level means smaller river .UPS: upstream river id .UPSC: upstream joining cell index .UPSQ: upstream discharge .DS: downstream river id .DSC: the confluece cell index on the downstream river to which this river connects .INSERT: distance along the downstream river (counting from the beginning to the confluence) that this river intersects (m) .DSQ: discharge to downstream .Parent: the parent river, most of the time the same as the downstream river .Trib: an array of tributary IDs .TribC: an array of confluencing cells .NAME: text name for the river .DM: domain discretization info .d: spatial stepsize .msize: array size .nGho: number of ghost cells .Nxy: starting and ending indices of valid cells .origin: origin of river x(1) .origin_idx: reserved field .x: x coordinate along the river .Sol: solvers .Budget: mass budgeting info 84 w: watershed top-level object, containing indices of land grid and rivers associated with the watershed .level: reserved .parent: reserved .child: reserved .shape: reserved .dt: watershed macro time step .t: time stamp (matlab datenum format) .ModelStartTime: Time of model start (datenum format) .ModelEndTime: time of model end (datenum format) .Rec: info for data recording and performance metric calculation .robj: object array detailing info for data recording and performance metric calculations .type: type of monitoring point. r: on-river, g : land states .id: ID of river on which the observation point is put .dist: distance from input points to neareast stream .ddist: distance along river from river head to observation point .xy: coordinates of input observation point .ix: indices of observation point (on the river or land grid) .sidx: index of monitoring point in the river shapefile vertices array .objnum: index of object of the monitoring points (for GW, this is the layer number) .Field: cell arrays with field names written consecutively .acc: temporary accumulative quantity .accT: time over which the quantity is accumulated .cc: n= floor(cc) is the observed datasets (index in w.usgs) to compare to; m = round((cc - n)*10) is the method to compute metrics, see simResults3.m .weight: the weighting factor used for computing overall weighted objective function .DM: domain discretization information .Stats: performance statistics .g: index of land grid associated with the watershed .ER: indices of rivers crisscrossing the watershed .CR: rivers 'controlled' by the watershed, written in upstream->downstream order .Tolerances: tolerances values for river network internal conditions .Sol: solvers for each process .wea: weather distributor .ovn: overland flow subroutine .deprs: depresssion storage, reserved .unsat: unsaturated flow, reserved .lat: lateral soil flow, reserved 85 .et: ET, reserved .intcpt: interception, reserved .gw: groundwater flow .veg: vegetation module. This solver currently contains all land surface processes and vadose zone flow in fortran .rte: river routing .record: recording subroutine .plot: plotting function .COMP: comparison, reserved .Exch: exchange solvers for interactions among some domains .Stations: climatic input data from weather stations .id: station ID .XYElev: [X Y Elevation] .LatLong: [Lat Long] .Name: name of station .gIndices: 1D indices of cells that are governed by this station .dates: dates of records .datenums: datenums of records .prcp: prcp records (mm) .tmin: minimum temperature (C) .tmax: maximum temperature (C) .hmd: relative humidity .dptp: dew point temperature .awnd: average wind speed (m/s) .Rad: estimated solar radiation (MJ/day/m2) .tau: air transmittance .rrad: measured solar radiation (MJ/day/m2) .s1: soil temperature (at 4 in depth) .s0: soil temperature (at 2 in depth) .neighbor: neighbors, 1st column: index of neighbor in the stations array, 2nd column: neighbor station ID .ref: reference scaling factors to distribute daily prcp into hourly prcp .ptr: pointer (index) to current records .DData: distributed data for the day Prob: problem definition object, containing information collected during input data processing stage, e.g. source datasets, etc .data: a structure containing file names/directories for all input .display: display menu .grid: a structure containing horizontal discretization info for the model .dem: elevation .ned: fine elevation data 86 .Riv: river shapes .lulc: landuse/landcover data .soils: soils data .DT: a structure containing time steps for components .dist: parameters for discretization q: top-level transport grid object 87