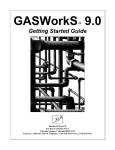
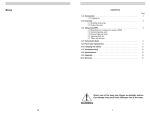
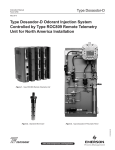
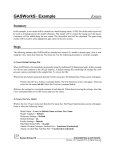
1
GASWorkS 9.0
™
Demonstration Guide
Bradley B Bean PE
419 East Columbia Street
Colorado Springs, Colorado 80907 USA
Toll Free: 1-800-391-9391 ! Telephone: (719) 578-9391 ! Fax: (719) 578-9394
Thank you for your interest in our products, and for taking the time to view our demonstration software.
We hope that you will be pleased with what you see during the demonstration. We are truly committed
to providing products that ensure your success. If you have suggestions which might help improve
GASWorkS to better meet your needs - please, let us know your ideas. Again, thank you for your
interest...
Bradley B. Bean
© 2015 Bradley B Bean PE - All rights reserved.
Revision 004
GASWorkS and the "B-Cubed" logo are trademarks of Bradley B Bean PE.
Windows is a trademark of Microsoft Corporation.
GASWorkS™ 9.0
Demonstration Guide
The information contained in this guide is intended to provide an overview of the GASWorkS software by
demonstrating a portion of its extensive feature set. Although the GASWorkS feature set is not fully
demonstrated, we hope that the features that are used during the exercises will provide a good appreciation
for how GASWorkS may be able to satisfy your network modeling needs.
The instructions in this guide assume that the User has some knowledge of working with the Windows
operating environment and Windows based applications. The example in this guide is for a simple
distribution style piping system, however please remember that the tasks used to create, solve, and edit this
model are applicable to any type of gas piping system.
The remainder of this guide will step you through the installation of GASWorkS, and the creation and
manipulation of a simple example model. Inserted throughout the text are notes which provide additional
information about the software. The example exercise is a bit long, however please be patient and persistent
in working through it - completion of the example will provide a valuable lesson on how to use the software
to efficiently meet your modeling needs.
Getting Help - Contact Us
Hours - Our normal work hours are 8:00 A.M. to 5:00 P.M. Mountain Time, Monday through Friday.
However if you have a problem, please try at any time, we may be in.
By Telephone - Telephone: (719) 578-9391
Toll Free (US Only): 1-800-391-9391
By Email - [email protected]
By Website - www.b3pe.com
Hardware/Software Requirements
GASWorkS will operate on any personal computer (PC) configured to run Windows XP or newer operating
system, through Windows 10. The Demonstration version of the GASWorkS software will require a
minimum of 24 MB of free hard disk space when installed.
Installing GASWorkS
An appropriate version of Windows must be running in order to install GASWorkS. If it is not, start
Windows now, then proceed with the installation process described below.
Bradley B Bean PE
ENGINEERING & SOFTWARE
Revision - 004, Copyright 2015, All Rights Reserved.
1
GASWorkS™ 9.0
Note...
Demonstration Guide
• On Windows Vista or newer machines, you will need to be logged on as the Full Administrator
or use the “Run as administrator” option when executing the installation file.
• In the following steps it is assumed that the compressed folder (“zip” file) containing the
demonstration software has already been downloaded to your machine. If it has not been
downloaded, go to our website, www.b3pe.com, to download it before continuing.
! Find the location where the downloaded folder is saved on your machine. Open the folder using Windows
File Explorer.
! Double-click on the executable setup file contained in the compressed folder. If a Windows Security
warning appears, allow your machine to install the file.
! The main setup screen will be displayed. Proceed by following the General Installation Instructions
described below.
General Installation Instructions
After the setup program has been started, several screens will be displayed during the installation process.
Read the contents of each screen carefully and respond appropriately.
Note...
On the License Agreement screen, read the terms of the License carefully and select the “Agree
to” option. If you do not wish to accept the License Agreement, you will not be able to continue
with the installation process.
A message will be displayed when the installation process is complete. The message will indicate whether
the installation was successful or whether it failed. Select the appropriate option to clear the message.
Starting GASWorkS
Note...
• An appropriate version of Windows must be running before GASWorkS may be executed. If
Windows is not running, begin its execution now.
• On Windows Vista, 7, and 8 machines, you will need to be logged on as the Full Administrator
or use the “Run As Administrator” option the first time you execute the GASWorkS software.
! From the Windows Desktop select the GASWorkS 9.0 shortcut icon.
Bradley B Bean PE
ENGINEERING & SOFTWARE
Revision - 004, Copyright 2015, All Rights Reserved.
2
GASWorkS™ 9.0
Demonstration Guide
! The GASWorkS software will be started.
! After the software has been loaded into memory, the GASWorkS
Copyright Notice will be displayed. Select the Continue command
button.
! The Demonstration Notes screen will be displayed. Read the contents
carefully and select any desired options, then select the Continue
command button.
Example
Various example files are included when GASWorkS is installed on the hard disk. These files are installed
in the "Files" subdirectory of the GASWorkS root directory. The examples contain a variety of system types.
You can view, manipulate, and solve these example files - or use the instructions provided in the following
sections to create, edit, solve, and report your own example model.
In this example, a model will be developed for a simple piping system representing a light industrial park
using generic loads. Once the model is built and solved, a new connection and demand will be added to the
system. The new load will exceed the capacity of the system. Changes will be made to the system to allow
the addition of the load. During the course of the example, you will learn how to create a new model using
various coordinate entry methods, solve a model, display graphic results, color code based on result values,
edit pipe and node data, tap an existing pipe, and use the report features.
Note...
GASWorkS has an automatic save feature which can be turned “on” or “off” depending on the
User’s preference. As initially installed, the option is turned “off”. To change this preference
option, select the Settings menu item from the Preferences submenu list of the File menu list.
Creating A New Model
! If a model is already open, close it now using the Close menu item from the File menu list.
! The first step in creating a model is to open a new set of model files. To open a new model, select the New
menu item from the File menu list. In the Filename data field, input an appropriate name for the new file.
For example, type MyDemo into the data field. When an appropriate name has been entered, press the Enter
key, or select the Continue command button to proceed.
! After a name has been entered, the Graphic Data Interface (GDI) Window will be displayed. We will
discuss the GDI Window and its various features later in the example.
Bradley B Bean PE
ENGINEERING & SOFTWARE
Revision - 004, Copyright 2015, All Rights Reserved.
3
GASWorkS™ 9.0
Demonstration Guide
Setting The Default Data Values
When creating a new model or adding new features to an existing model, the data values for the new features
are set using the current default data values. If similar models are being created, these values only need to
be set once. However, if models that are not similar are being created, the values will need to be
appropriately set when changing model types.
Note...
In this document, two values are listed where a data value is given. The first value represents the
value in English/US dimensional units. The second value (enclosed in brackets [ ]) represents the
value in Metric dimensional units. Use the appropriate values.
! To set the default values, select the Set Defaults menu item from the Utilities menu list. The Default Data
Values screen will be displayed.
! Select the Dimensional Units tab. Select the following values:
Coordinates = Feet [Metres]
Diameter = Inches [Millimeter]
Efficiency = Decimal
Elevation = Feet [Metres]
Heating Value = Btu/cf [Mjoules/m^3]
Length = Feet [Metres]
Load = Mcfh [M^3/hr]
Node Pressure = Psi [Bar]
Pipe Flow Rate = Mcfh [M^3/hr]
Pressure Drop = Psi [Bar]
Temperature = Fahrenheit [Celsius]
Velocity = Feet/sec [Metres/sec]
Viscosity = Lbm/Ft-sec [Centipoise]
! Select the Gas Properties tab. Enter or select the following values:
Specific Gravity = 0.6
Viscosity = 0.000007 Lbm/Ft-sec [0.0104 Centipoise]
Heating Value = 1000 Btu/cf [37.2 Mjoules/m^3]
Specific Heat Ratio = 1.3
! Select the Hydraulic Data tab. Enter or select the following values:
Pipe Size/Type = 2P Inches [63P-11 Millimeter]
Pipe Equation = IGT-Improved
Pipe Efficiency = 0.95 Decimal
Bradley B Bean PE
ENGINEERING & SOFTWARE
Revision - 004, Copyright 2015, All Rights Reserved.
4
GASWorkS™ 9.0
Demonstration Guide
Allow Pipe Sizing = Unselected (Unchecked)
Node Pressure = 0 Psi [0 Bar]
Value Is Unknown = Selected (Checked)
Node Base Load = -10 Mcfh [-283 M^3/hr]
Value Is Unknown = Unselected (Unchecked)
Node Elevation = 0 Feet [0 Metres]
Node Temperature = 60 Fahrenheit [15.6 Celsius]
Value Is Unknown = Unselected (Unchecked)
! When all the values have been entered, select the Close command button to close the screen and save the
settings.
Using The Graphic Data Interface (GDI)
The GDI Window will display differently on different monitors. Let’s resize it now so that it fits
nicely on your monitor. Select the Maximize GDI Window icon from the Graphic Window
Controls toolbar to fit the window to your monitor.
Note...
The GDI Window can also be manually sized by dragging the sides or corners of the window with
the mouse. To save the current window size as the default for future models, select the Settings
menu item from the Graphics menu list. The Graphic Settings screen will be displayed. Select
the Save As Default command button, select the OK command button to set changes, then select
the Close command button to close the screen.
When using GASWorkS, much of your time will be spent working within the GDI Window, so let's take a
few seconds to describe its various features. A set of GDI Toolbar Icons are displayed along the left side of
the GDI Window. When the mouse pointer is passed over a GDI Toolbar Icon, the toolbar will be expanded
exposing the GDI Icons. The GDI Icons are used to execute many of the GDI Commands.
In the GDI, a command is executed either by selecting the appropriate icon, by selecting a
command from the GDI Command List, or by typing on the GDI Command Line. In this example
we will use the icon method of execution. If a command is accidentally selected, it may be
canceled by selecting the Cancel icon.
Note...
The GDI Command List icon is located in the upper-right corner of the GDI Window.
The GDI Command Line is located at the bottom of the GDI Window below the
coordinate and GDI Command information.
Bradley B Bean PE
ENGINEERING & SOFTWARE
Revision - 004, Copyright 2015, All Rights Reserved.
5
GASWorkS™ 9.0
Demonstration Guide
The "work area" contains the main portion of the window. The Scroll icon is located in the lowerleft corner of the GDI Window. The view may be moved right or left and up or down by selecting
one of the arrow symbols on the icon. A Pan command and several Zoom commands are also
provided to help negotiate the model image. When a GDI Command requires keyboard input, a
prompt will appear just above the “work area”.
Note...
GASWorkS provides several ways to enter a node's location. These include - specifying an X-Y
coordinate pair, specifying a relative distance and angle, and drawing the segment with the
mouse. We will use each of these methods when constructing the example model. If your
Windows environment is set to use a comma “,” as the decimal separator, use a space to separate
the coordinate values - only use whole (non-decimal) coordinate values.
Building The Model
1) Add The First Pipe Using The Coordinate Method Of Entry
! Select the Add 2-Point Pipe icon from the Graphic Construction Commands toolbar.
! At the From Node Location prompt, enter 1000,1000 Feet [1000,1000 Metres], then
press the Enter key.
! The From Node Data screen will be
displayed. On the Hydraulic tab, change
the node's name by entering SUPPLY for
the Node Name. For the Pressure, enter 20
Psi [1.38 Bar].
! Generally the Load is shown as
“Unknown” and the Pressure is shown as
“Known” at a supply point. Indicate that
the Base Load is “Unknown” by placing a
check mark in the “Unknown”box adjacent
to the Load units list, and that the Pressure
is “Known” by unchecking the
“Unknown” box adjacent to the Pressure units list. The remaining values are acceptable.
! Select the Close command button to continue.
Bradley B Bean PE
ENGINEERING & SOFTWARE
Revision - 004, Copyright 2015, All Rights Reserved.
6
GASWorkS™ 9.0
Note...
Demonstration Guide
• A node symbol will appear at the new node's location. We will zoom in later to make the view
a bit easier to see.
• The setting of the "Unknown" options indicate whether the associated value is “Known” or
“Unknown”. When the option is selected (checked), the value is “Unknown” and will be
calculated during the Solution routine. At this node we indicated that the Pressure is “Known”
(not selected), and the Base Load is “Unknown” (selected). Generally, either the Pressure or the
Base Load must be “Known” at each node. At demand nodes the Pressure is generally set as
“Unknown” and the Base Load is set as “Known”. A negative value indicates that gas is leaving
the system.
! For the To Node Location type 1500,1000 Feet [1152,1000 Metres], then press the Enter key to
continue.
! The To Node Data screen will be displayed. On the Hydraulic tab, if the node is not already named
10, enter 10 for the Node Name. The remaining values are acceptable. Select the Close command
button to continue.
! The Pipe Data screen will be displayed. On the Hydraulic tab, change the diameter value to 4 inch
plastic pipe by selecting the code 4P Inches [125P-11 Millimeter] from the Size/Type list. Notice
that the pipe's length reflects the scaled distance based on the coordinate entry. Select the Close
command button to continue.
Note...
The Size/Type (diameter) list contains several predefined Size/Type Codes. Each code represents
an entry in the Pipe Property Table. GASWorkS uses Property Tables to store redundant data
items, such as inside diameter values. Tables are provided for pipe, fitting, regulator, valve,
compressor, and well data values. The User may add to or revise the data contained in any of the
Property Tables.
2) Add The Second Pipe Using The Relative Distance & Angle Method
! Right-click the mouse while the mouse pointer is in the GDI Window. The GDI Pop-Up Menu will
be displayed. Select the Repeat Last Command item from the menu list - the Add 2-Point Pipe
command will be re-executed.
! At the From Node Location prompt, right-click the mouse to accept the default From Node
coordinates (1500,1000 [1152,1000]).
Bradley B Bean PE
ENGINEERING & SOFTWARE
Revision - 004, Copyright 2015, All Rights Reserved.
7
GASWorkS™ 9.0
Note...
Demonstration Guide
GASWorkS remembers the coordinates of the last node that was entered. When a default
coordinate pair is displayed, either press the Enter key or right-click the mouse to accept the
coordinates.
! For the To Node Location, enter @500<180 Feet [@150<180 Metres], then press the Enter key
to continue.
Note...
The "@" symbol tells GASWorkS that a relative distance and angle will be used to locate the
node. The node location is calculated relative to the From Node Location. Angles are measured
clockwise from the 12 o'clock position (top of display) - zero (0) represents north.
! The To Node Data screen will be displayed. If the name is set to 15, the remaining data values are
acceptable. Select the Close command button to continue.
Note...
• Notice that a data screen did not appear for the From Node, but one did appear for the To Node.
That is because the data screens only appear when a new node or pipe is entered. The From Node
was previously entered, so the data screen did not appear.
• Some Users prefer to first build the entire model without interruption from the data screens,
then go back and edit or change the data values after the model has been created. For them, the
prompting data screens can be suppressed by selecting the Settings menu item from the Graphics
menu list. The Graphic Settings screen will be displayed. In the Options section, unselect
(uncheck) the Query During New Feature Entry option. Select the Close command button to save
the changes.
! The Pipe Data screen will be displayed. The default data values are acceptable. Select the Close
command button to continue.
! To make the pipes we just entered easier to see, let's zoom the display. Select the Zoom
To Fit icon from the View Controls toolbar to cause the display to be zoomed to fit into
the GDI Window.
3) Add The Third Pipe By Using The Drawing Entry Method
! Select the Add 2-Point Pipe icon from the Graphic Construction Commands toolbar.
! Select the From Node location by moving the mouse pointer near the location of Node
15. While holding down the Shift key, left-click the mouse to indicate the node's location.
Bradley B Bean PE
ENGINEERING & SOFTWARE
Revision - 004, Copyright 2015, All Rights Reserved.
8
GASWorkS™ 9.0
Note...
Demonstration Guide
• If the From Node Data screen is displayed, it indicates that the location for Node 15 was not
properly selected. To reselect the From Node Location, select the Cancel command button and
reselect the Add 2-Point Pipe icon.
• Holding down the Shift key while selecting a node location with the left mouse button will cause
the pipe end to be “snapped” to the existing node, nearest that location.
! Now move the mouse pointer to a location below Node SUPPLY and left of Node 15 - similar
to Figure 1, and left-click the mouse to indicate the node's location.
! The To Node Data and Pipe Data screens will be displayed. If the node name is set to 20, the
remaining data values are acceptable. Select the Close command button to continue. After entering
this pipe, the model should look similar to Figure 1.
Figure 1
4) Add The Fourth & Last Pipe
! Either select the Add 2-Point Pipe icon from the Graphic Construction Commands
toolbar, or right-click the mouse while the mouse pointer is in the GDI Window. The GDI Pop-Up
Menu will be displayed, and select the Repeat Last Command item.
! At the From Node Location prompt, either press the Enter key or right-click the mouse to accept
the default coordinates.
! At the To Node Location prompt, move the mouse pointer near the location of Node SUPPLY.
While holding down the Shift key, left-click the mouse to indicate the node's location.
Bradley B Bean PE
ENGINEERING & SOFTWARE
Revision - 004, Copyright 2015, All Rights Reserved.
9
GASWorkS™ 9.0
Note...
Demonstration Guide
If the To Node Data screen is displayed, it indicates that the location for the node was not
properly selected. To reselect the location, select the Cancel command button and reselect the
Add 2-Point Pipe icon.
! The Pipe Data screen will be displayed. The default data is acceptable. Select the Close command
button to continue. After entering the last pipe, the example model should look similar to Figure 2.
Figure 2
Note...
• To assist in building a model using the drawing method, GASWorkS provides two “snap”
methods which cause a pipe end to be snapped to an existing node. The first snap mode is
referred to as “auto-snap”. This method we have been using by holding down the Shift key while
left-clicking the mouse when prompted for a node location.
• The second method is referred to as Node Snap, this method snaps to an existing node found
within a certain distance of an entered location. To use this method select the Node Snap icon on
the Graphic Construction Commands toolbar until the icon’s background is darkened. When this
method is turned on, a circle will be displayed around the crosshairs. This circle represents the
snap distance, a node falling within the snap circle will be snapped to.
• We suggest generally using the “auto-snap” method.
Bradley B Bean PE
ENGINEERING & SOFTWARE
Revision - 004, Copyright 2015, All Rights Reserved.
10
GASWorkS™ 9.0
Demonstration Guide
Solving The Model
Now that the model has been created, the unknown pressure and flow values may be calculated by "solving"
the model. To solve the model:
! Select the Solve icon. The Solution Data screen will be displayed.
! Select the Other Settings tab. Enter 14.73 Psi [1.02 Bar] for Base Pressure and
enter 60 Fahrenheit [15.6 Celsius] for Base Temperature.
! For this example, the remaining default solution parameters are satisfactory. Select the
Solve command button to proceed with the solution.
! While the solution is being performed, the GASWorkS Solution Log will be displayed. The log
displays the solution activity, and informs the User when the solution is complete.
! Upon completion of the solution, select the Close command button to close the log and return to
the GDI Window.
! Notice that the Solve icon has changed - the scale is now balanced indicating that the model is
balanced.
Bradley B Bean PE
ENGINEERING & SOFTWARE
Revision - 004, Copyright 2015, All Rights Reserved.
11
GASWorkS™ 9.0
Note...
Demonstration Guide
The GASWorkS Solution Log displays the progress of the solution process. During a normal
solution the node errors should start relatively large and get smaller as the solution progresses,
until the node error is less than the specified convergence tolerance. The last line of the
GASWorkS Solution Log should indicate "Solution Complete”. If the solution is not complete,
recheck the model creation steps, correct any errors you encounter, then re-solve the model.
Viewing The Analysis Results
Now let's view the analysis results. In addition to its various Report routines, GASWorkS also provides
several graphical methods for viewing both the model data and analysis results. We will look at the Report
routines later, for now let's use some of the graphical methods to view the analysis results.
! Notice that the flow arrows are now displayed, indicating the direction of the pipe flow.
! Let's display the pressure values for the nodes. Select the Set Text Options icon from
the Display Controls toolbar. The Text Display Options screen will be displayed. In the
Node Items list select the Pressure item by clicking in the box adjacent to the item until
a check mark appears. Select the Apply command button to apply the changes to the
display.
! The pressure values and flow directions should be similar to those shown in Figure 3.
Figure 3
Bradley B Bean PE
ENGINEERING & SOFTWARE
Revision - 004, Copyright 2015, All Rights Reserved.
12
GASWorkS™ 9.0
Note...
Demonstration Guide
• The displayed pressure values represent the estimated pressure for each node point. As a result
of the "hand drawn" pipe segments (the third and fourth segments), each example model is
created slightly different. This will cause the pressure values to vary slightly. A large difference
indicates that an error has occurred during the creation of the model. If this is the case, you might
want to retrace the creation steps to identify the problem.
• The analysis results can also be viewed and printed using the Edit Node Data and Edit Pipe
Data icons from the Data Edit Commands toolbar.
Tapping A Pipe
To simulate a new connection to the system, let's add a new node (tap) to the pipe segment between Nodes
15 and 20.
! To make a tap, select the Tap Pipe icon from the Graphic Edit Commands toolbar. At
the Select Pipe To Tap prompt, move the mouse pointer near the pipe between Node 15
and Node 20, then left-click the mouse. At the Select Tap Location prompt, move the
mouse pointer midway along the pipe segment between Nodes 15 and 20, and left-click
the mouse. The Tap Node Data screen will be displayed. On the Hydraulic Tab, change the Node
Name to NEWTAP. Enter -40 Mcfh [-1133 M^3/hr] for the Base Load. The remaining data values
are acceptable. Select the Close command button to continue.
Note...
• The load for the new node was entered as a negative value, remember that a negative value
indicates a load leaving the system (a demand).
• Because a change has been made to the model, the previously computed pressure and
flow values are no longer valid. To see the effect of the new load on the system, we
will need to re-solve the model. Notice that the Solve icon has changed - the scale is
now unbalanced indicating that the model needs to be solved.
! Re-solve the model by selecting the Solve icon. When the Solution Data screen is displayed, select
the Solve command button to execute the solution. The GASWorkS Solution Log will be displayed.
When the solution is complete, select the Close command button to close the GASWorkS Solution
Log and return to the GDI Window.
! In Figure 4, notice that some of the pressure values are negative (less than zero). This indicates
that the system has "run-out-of-gas". In other words, the increased demand caused by the new load,
is greater then the system’s capacity.
Bradley B Bean PE
ENGINEERING & SOFTWARE
Revision - 004, Copyright 2015, All Rights Reserved.
13
GASWorkS™ 9.0
Demonstration Guide
Figure 4
! Let's use the color coding features to try to find the pipes that may be causing the problem.
Color Coding Pipes & Nodes
GASWorkS provides several routines for color coding pipes and nodes based on their data values. Features
may be colored based on the results of a query. For example, all of the nodes where the pressure was less
than a specific pressure value could be colored red. Features may also be colored based on a value range. The
range values and colors may be set by the User or automatically set by GASWorkS. Let's use one of the
automatic range methods to color code the pipes.
! To determine which pipes have the worst (largest) pressure drop, we will color code
the pipes based on the their pressure drop values. Select the Set Feature Colors icon from
the Display Controls toolbar.
! The Set Display Colors screen will be displayed. In the Color By Range section, select the Pipe
Pressure Drop item from the Item list. Select Psi [Bar] from the Units list. Next, select the
Calculate command button to automatically set the range values. Values will be placed in the From
and To data fields as shown in Figure 5.
Bradley B Bean PE
ENGINEERING & SOFTWARE
Revision - 004, Copyright 2015, All Rights Reserved.
14
GASWorkS™ 9.0
Demonstration Guide
Figure 5
! Select the Apply Range Colors command button. The colors of the displayed pipes will be updated
to reflect the color/value ranges.
! As a reminder of the color/value ranges, select the Display Color Legend icon from the
Display Controls toolbar. The Color Legend will be displayed showing the calculated
color and value ranges.
! You may move the Color Legend to a convenient location by placing the mouse pointer over the
title portion of the window, then hold down the left mouse button and drag the window to the desired
location. Release the mouse button when the window is positioned where desired. The Color Legend
can be resized by dragging its sides or corners with the mouse. To turn “off” the Color Legend later,
select the Display Color Legend icon from the Display Controls toolbar.
Note...
In this case, the pipes with the worst pressure drop are colored black. The segments between
Nodes 10 and 15 and between Nodes SUPPLY and 20 might both be colored black or one or the
other might only be colored black. The results vary because of the varied pipe lengths resulting
from the hand drawn sections. Let's try to fix the pressure problem at Node NEWTAP by
changing the size of the pipe between Nodes SUPPLY and 20.
Bradley B Bean PE
ENGINEERING & SOFTWARE
Revision - 004, Copyright 2015, All Rights Reserved.
15
GASWorkS™ 9.0
Demonstration Guide
Editing Data
During some of the previous steps, we used the GDI edit features to change the data associated with the new
nodes and pipes we entered. Now let's use the GDI's edit features to increase the size of the pipe between
Nodes SUPPLY and 20.
! Select the Edit Pipe Data icon from the Data Edit Commands toolbar. At the Select A
Pipe prompt, move the mouse pointer near the pipe segment between Nodes SUPPLY
and 20, then left-click the mouse. The Pipe Data screen will be displayed.
Note...
The Edit Customer, Edit Node, and Edit Pipe routines can be executed by using the appropriate
command method, or by clicking next to the feature in the GDI Window. Place the mouse pointer
next to a pipe feature and press the left mouse button to edit/view the pipe’s data. Place the mouse
pointer next to a node feature and press the left mouse button while holding down the Shift key
to edit/view the node’s data. Place the mouse pointer next to a customer feature and press the left
mouse button while holding down the Crtl key to edit/view the customer’s data.
! On the Hydraulic tab, increase the pipe size to 4 inch plastic by selecting 4P Inches [125P-11
Millimeter] from the Size/Type list. Select the Close command button to close the screen and save
the changes.
! Select the Solve icon. The Solution Data screen will be displayed. On the Solution Data tab, select
(check) the Update Color Coding solution option in the Solution Options list. Select the Solve
command button. The GASWorkS Solution Log will be displayed. When the solution is complete,
select the Close command button to close the GASWorkS Solution Log.
! We can see that all of the node pressures are now positive. If the current values are adequate, we
can conclude that the change that we made fixed the problem, or we can change additional pipe sizes
and re-solve the model to see the results.
Note...
Notice that the pipe colors were updated to reflect the new pressure drop values. By selecting the
Update Color Coding option, the last color by range values were used to update the GDI feature
colors after the solution was complete.
Working With Reports
The Standard Report provides a comprehensive look at the data contained in the model.
! To view the Standard Report, select the Standard (All) menu item from the Report menu list. The
various Report screens will be displayed.
Bradley B Bean PE
ENGINEERING & SOFTWARE
Revision - 004, Copyright 2015, All Rights Reserved.
16
GASWorkS™ 9.0
Note...
Demonstration Guide
The Standard Report is segregated into three separate sections - Header Data, Pipe, and Node.
Each section contains specific data related to its unique type. To view the contents of a specific
section, click on the screen associated with that section. If any of the reports are not visible, select
the associated report from the Window menu list.
! Select the Node Report.
! Sort the results from the lowest to the highest pressure. Select the Make Selection Set
icon. The Query Specification screen will be displayed.
! In the Find Records Where section, select Node Pressure from the left list, select Min
from the middle list, and enter 10 in right data field. Select the Perform Query command button to
create the selection set, then select the OK command button to clear the update message. Select the
Close command button. The pressure node values should now be listed from lowest to highest value.
Note...
• The contents of the reports can be manipulated by creating “selection sets” based on User
specified selection criteria. The previous few steps created a sorted selection set which found the
ten (10) lowest pressure node values. In this case there were only five nodes in the model, so all
records were included in the selection set, ranking them from the lowest to the highest
value. Successive selection sets can be created.
• A selection set can be “cleared” by choosing the Reset Selection Set icon.
! Select the Close This Report command button to close the Node Report.
Bradley B Bean PE
ENGINEERING & SOFTWARE
Revision - 004, Copyright 2015, All Rights Reserved.
17
GASWorkS™ 9.0
Demonstration Guide
! Select the Pipe Report. Use the horizontal scroll bar to view items displayed on the right side of
the report. As you scroll, you will see the various items reported for the pipe features including flow
rate, pressure drop, velocity, and volume values for each segment. For longer reports, the vertical
scroll bar can be used to browse through the various records.
! When you are done browsing the Reports, select the Close All Reports command button.
Note...
• This example barely touched on the many features associated with the Standard Report. The
report allows data editing directly from the report screen by simply clicking on the appropriate
data "cell". The User may control the contents of the report by expanding and collapsing columns,
and by creating query based selection sets. There are also several routines provided for sorting
and browsing through the report contents.
• Because of the amount of data contained in the report, the report width will always be greater
than the page width. When using the Print routine, a message will be displayed stating that the
report width is greater than the page width. An option will be given to cancel the Print routine
or continue. Generally you will want to select the continue option. If the Print routine is
continued, the report will be printed on multiple pages.
• To better fit the report on the printed page, try reducing the number of columns by
using the Set Columns routine to specify which columns to display and print. When
the Set Columns icon is selected, the Columns screen will be displayed. The checked
column names represent the columns that are currently displayed. Uncheck some of
the columns by clicking in the associated check box. Use a proportional font like "Arial Narrow",
use a font size of 9 points or smaller, and set the printer orientation to "Landscape".
What To Do Next
These last few steps really demonstrate the most powerful use of GASWorkS - the ability to study the affect
of system modifications before they are implemented. By analysis of these effects using the model, changes
which might adversely affect the system, may be identified before they become a real problem. Furthermore,
solutions to counter or fix the results of a negative change, can be easily tested in the model, avoiding
installation of incorrectly sized facilities in the field.
There are several pre-built example models distributed with the software. Refer to the Help Guide located
in the Help menu list for descriptions and instructions for viewing the various example models. These prebuilt examples include applications using regulators, valves, fittings, compressors, and wells, and
demonstrate many of the features associated with the software.
Bradley B Bean PE
ENGINEERING & SOFTWARE
Revision - 004, Copyright 2015, All Rights Reserved.
18
GASWorkS™ 9.0
Demonstration Guide
This simple example provided a brief overview of the basic routines found in the GASWorkS software. There
are many routines that were not used in the example - the Import and Export routines, attribute valves,
tracing, data checking, use of the Pipe Sizing routine, and use of the customer data features were all absent
from the demonstration. Perhaps you may wish to explore some of these features on your own. Information
about these features can be found in the User’s Manual or the Help Guide. These documents may be
downloaded from the Documents section of our website, www.b3pe.com.
When you are done exploring the software, select the Exit GASWorkS menu item from the File menu list to
close the program. A prompt will appear to save or discard the changes made to the model. Select the
appropriate option. If you choose not to save the changes, they will be ignored.
Uninstalling GASWorkS
If after using the GASWorkS software you wish to remove it, select the Uninstall GASWorkS 9.0 menu item
from the GASWorkS menu list. In Windows 8, right-click on the GASWorkS 9.0 tile on the start screen, then
select the Uninstall option.
! After the Uninstall Program has been started, read the contents of each screen carefully and respond
appropriately.
Note...
If the Uninstall Program asks to remove any shared system files, select the No command button.
! A message will be displayed when the Uninstall routine is complete. The message will indicate whether
the routine was successful or whether it failed. Select the appropriate option to clear the message.
Note...
On some machines, the Uninstall routine will not be able to remove any directory or file that has
been created after the initial installation.
! Some of the files and/or folders created by GASWorkS after the installation may include files
in the initialization directory (ini), files in the default calculation file directory (files), and/or files
in the application directory (app).
! To remove these files and/or folders, use Windows File Explorer to find and delete the
remaining files and folders. An example of the path for the initialization folder is shown below.
The other folders have similar path locations.
• 32-bit machines - C:\Program Files\GASWorkS 9\ini
• 64-bit machines - C:\Program Files (x86)\GASWorkS 9\ini
Bradley B Bean PE
ENGINEERING & SOFTWARE
Revision - 004, Copyright 2015, All Rights Reserved.
19
Bradley B Bean PE
ENGINEERING & SOFTWARE
Revision - 004, Copyright 2015, All Rights Reserved.