1
Phone 303/449-1105 ♦ Fax 303/449-0132 ♦ www.specinc.com
Cloud Particle Imager
CPI V2.5
User’s Manual
SPEC, Inc.
3022 Sterling Circle, Suite 200
Boulder, CO 80301
February 2013
TABLE OF CONTENTS
Section 1 CPI OVERVIEW ………………………………………………………………………………………….…………1
1.1 CPI General Description
1.1.1 Main Parts of The CPI
1.1.2 Functional Overview
1.1.2.1 Instrument Behavior With No Particle Present
1.1.2.2 Instrument Behavior With Particle(s) Present
Section 2 GETTING STARTED ……………………………………………………………………………………………….7
2.1 Unpacking the CPI System
2.2 Connecting the CPI Sensor Head to the Data Acquisition System
2.2.1 Connection Procedure for Operating the CPI in the Laboratory
2.2.2 Connection Procedure for Installing the CPI on an Airplane
2.3 CPI Atomizer Setup for Laboratory Testing
2.4 CPI Startup Procedure
2.5 Disconnecting the CPI Cables
2.6 Packing CPI System
Section 3 PHYSICAL DESCRIPTION …………………………………………………………………………….………29
3.1 CPI Sensor Head – Physical Description
Section 4 THEORY OF OPERATION ……………………………………………………………………………………36
4.1 Optical System Description
4.1.1 PDS System
4.1.2 Imaging System
4.1.3 Physical Location of Optical Components
4.2 Detailed Description of Electronics
4.2.1 Particle Detection System (PDS)
4.2.2.1 Logical State Machine
4.2.2 PDS Logic and Camera Image Processing
4.2.2.1 Logical State Machine
4.2.3 PDS 45, PDS 90, & Imaging Laser Drivers
4.2.4 DSP Data Acquisition and Control
4.2.5 Power Supply Board
Section 5 SOFTWARE DESCRIPTION AND REAL-TIME OPERATION ………………………………..……63
5.1 Data System Overview
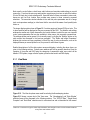
5.1.1 View Menu
5.1.1.1 Housekeeping Window
5.1.1.2 Stats Window
5.1.2 Setting Menu
5.1.2.1 Advanced Control and Settings Window
5.1.3 Particle Detection System Control and Monitoring
5.1.3.1 PDS Laser Power and DC Level
5.1.3.2 PDS Threshold Control
5.1.3.3 PDS Minimum Transit Time Control
5.1.4 Image Collection and Monitoring
5.1.4.1 Background Images and Parameters
5.1.4.2 Particle Collection and Associated Controls
5.1.4.3 Image and Background Mean Settings
5.1.4.4 Live Video Mode
5.1.5 Probe Sensor Head Thermal Control
5.1.6 Display Options
5.1.6.1 Rates and Image Parameters
5.1.6.2 Displays, Histograms and ROI X/Y Plots
5.1.7 CPI.INI File Description
5.1.7.1 Enunciator Panel
5.2 CPI Real-Time Operation and Troubleshooting
5.2.1 Operation and Troubleshooting in Flight
5.2.2 RTIA Log Troubleshooting
5.2.2.1 Sensor Head Powered Off/Camera Connector Disconnected
5.2.2.2 No Hardware Key Connected
5.2.2.3 Imaging Laser Power Too Low or Too High
5.2.3 Background Troubleshooting
5.2.3.1 What To Do If No Background is Acquired at Startup
5.2.3.2 What to Do if Probe is Communicating With DAS, but No
Background Taken
5.2.4 PDS Operation and Troubleshooting
5.2.4.1 What To Do If PDS Laser Power Needs Adjustment
5.2.4.2 What to Do if the PDS Threshold Needs Adjustment
5.2.4.3 What to Do If the PDS Minimum Transit Time Needs Adjusting
5.2.5 Enunciator Warnings
5.3 Artificial Intelligence (AI) DAS Controls
5.3.1 Setting Menu AI Items
5.3.2 PDS Laser Control
5.3.3 PDS Threshold Control
5.3.4 Background Control
5.3.5 Laser Pulse Width Control
Section 6 PROCEDURES ……………………………………………………………………………………………………118
6.1 Pylon Cover Removal
6.2 CPI DSP Control Board Access When Internal Sensor Head Is Mounted in the
Pylon
6.3 CPI Internal Sensor Removal
6.4 CPI Internal Sensor-Running on Test Stand
6.5
6.6
6.7
6.8
CPI Internal Sensor Installation into Pylon
Pylon Cover Installation
Cleaning CPI Optical Windows
CPI Imaging System Camera Alignment
Section 7 APPENDICES ……………………………………………………………………………………………………..159
7.1 Mechanical Drawings for Installation on Aircraft
7.2 CPI/INI
7.3 DSP Memory Address Decodes and Heater Controls
7.3.1 Reads
7.3.2 Writes
7.4 CPI ROI Data File Format
SPEC CPI Preliminary Technical Manual
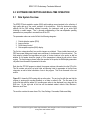
1.0 CPI OVERVIEW
1.1 CPI General Description
The UAV CPI is an airborne atmospheric research instrument that captures high-resolution images of
particles as they pass through the instrument.
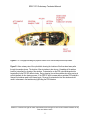
1.1.1 Main Parts of the CPI
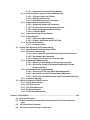
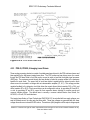
The UAV CPI can be subdivided into three basic parts, shown in the block diagram, Figure 1.1.1. The first
part, the Data Acquisition System, is housed inside a rack-mount computer case. This is usually mounted
inside the aircraft cabin. The second part is the Sensor Head, which is located outside the aircraft on the
fuselage or wing. The third part, the power system, occupies space in both the rack-mount computer case
and the sensor head.
SPEC Inc. reserves the right to make improvements and changes to the CPI and related software at any
time and without notice
1
SPEC CPI Preliminary Technical Manual
Figure 1.1.1 CPI Block Diagram
1.1.2 Functional Overview
SPEC Inc. reserves the right to make improvements and changes to the CPI and related software at any
time and without notice
2
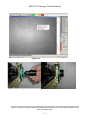
SPEC CPI Preliminary Technical Manual
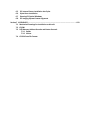
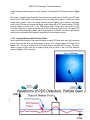
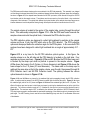
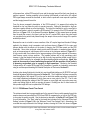
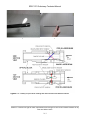
Figure 1.1.2 Optics, PDS detector waveforms, and exposed image of the CCD camera
when no particle is present.
In the CPI, a two-beam particle detection system strobes a high-power laser to flash the instant a particle is
in the imaging system object plane. A CCD camera records the particle image(s) and the frame containing
the particle(s) is sent to an image processing system that locates the particle(s) in the image and cuts out
these regions of interest (ROI) for display and recording. Electronics in the sensor monitor and control
numerous parameters as dictated by the software in the Data Acquisition System. The imaging system
utilizes a 1024 x 1024 pixel monochrome digital camera that has eight bits of resolution (256 levels) and
has an effective pixel size of 2.3 microns. The camera can download approximately 72 frames per second,
allowing the instrument to rapidly image small cloud particles.
1.1.2.1 Instrument Behavior With No Particle Present
Figure 1.1.2 shows the primary electro-optical components in the CPI. The upper left diagram shows a
cut-away view of the CPI sample volume. Two ribbon-shaped intersecting laser beams form the particle
detection system (PDS) sensitive area. Both PDSs are functionally identical. The PDSs use a continuous
wave laser and beam shaping optics that produce laser beams with a rectangular cross-section. The two
PDS laser beams are orthogonal to one another and form a volume of approximately 2.5 mm x 2.5 mm x
0.5 mm located in the center of the instrument sample tube, and tilted at an angle of 45 degrees to the
particle trajectory. Each rectangular laser beam is dumped onto a dump spot before it reaches its PDS light
detector, such that almost no light reaches the detector when no particle is present. The diagram in the
upper left of Figure 1.1.2 shows the laser beams being dumped, in the absence of a particle in the sample
volume. The object plane for the imaging CCD camera is located on the trailing edge of the PDS beam
intersection.
Upon instrument startup, the imaging system pulses the imaging laser and captures a full frame
background CCD image in the absence of cloud particles. The background image is stored and used to
SPEC Inc. reserves the right to make improvements and changes to the CPI and related software at any
time and without notice
3
SPEC CPI Preliminary Technical Manual
process subsequent frames thought to contain a particle. The background CCD image is shown in Figure
1.1.2.
When there is no particle flying through the instrument and only a small amount of light from the PDS laser
beams hits the PDS detectors, both detectors put out low voltage analog signals. A typical low voltage
analog signal is shown in red on the voltage waveform graph in Figure 1.1.2. An electronic comparator
circuit on each PDS detector compares the detector output voltage with a PDS Threshold voltage. The PDS
threshold voltage is shown in blue. If the PDS Detector output voltage never rises above the PDS
Threshold voltage then no particle is detected and no firing of the imaging laser occurs. The imaging CCD
camera is constantly downloading images, but during this period of no particles, the camera’s light sensitive
surface is never exposed and the images are discarded by the data acquisition system.
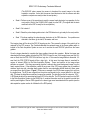
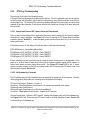
1.1.2.2. Instrument Behavior With Particle(s) Present
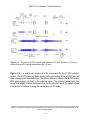
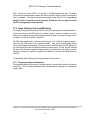
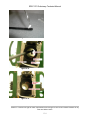
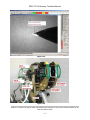
When a particle flies through the instrument and passes through a PDS laser beam some light is scattered
forward and around the dump spot by the particle as shown in the cutaway diagram in the upper left of
Figure 1.1.3. This light is collected by the PDS photo-detector associated with that laser. The photodetector converts the light pulse into an analog voltage pulse as shown in red in the PDS waveform
diagram in Figure 1.1.3. A comparator
SPEC Inc. reserves the right to make improvements and changes to the CPI and related software at any
time and without notice
4
SPEC CPI Preliminary Technical Manual
Figure 1.1.3. Optics, PDS detector waveforms, and exposure shot of the CCD camera when the CPI
detects a particle.
in each PDS detector circuit compares the photo-detector output voltage with the PDS threshold voltage
shown in blue in the waveform diagram in Figure 1.1.3. When the analog voltage pulse from the photodetector exceeds the PDS threshold of the comparator circuit the comparator outputs a clean digital pulse.
This digital pulse is shown in black in the PDS waveform diagram in Figure 1.1.3. It is passed to a digital
logic circuit for processing.
When a particle passes through the intersection of both PDS laser beams, a pulse of light is observed on
each of the scattered light detectors. In this case both PDS detectors output voltage pulses at the same
time. If the pulses last longer than a minimum duration then the “Particle In Beam OK” (PIB_OK) signal
goes high and a logical state machine located in the sensor head starts stepping through its 8-step cycle.
This state machine orchestrates the imaging of the particle, the sending of data associated with that particle
to the Data Acquisition Computer, and the resetting of the electronics in preparation for the next particle.
The states of this state machine are as follows:
State 0: Idle and wait for a particle. If a particle is present in both beams for a set minimum
duration (the minimum transit time), as indicated by the PIB_OK signal going high, go to
State 1.
State 1: Start a timer that measures the time during which the particle is in the PDS beams. This is
called the Transit Timer. Wait for the Particle In Beam OK (PIB_OK) signal to go low.
(This signal goes high when both of the PDS pulses have been high for longer than a
minimum duration. It goes low instantly when either one of the PDS pulses goes low. At
the instant when PIB_OK goes low the particle is in the object plane of the camera.) When
PIB_OK goes low jump to state 2.
State 2: Fire the imaging laser. Notify the frame grabber in the Data Acquisition System that a
particle was seen and this laser has fired by driving the PDS STATUS signal high. (The
PDS STATUS signal is received by the frame grabber and is used by the data acquisition
system to determine whether the next image frame it receives contains at least one
particle or not.)
State 3: The DSP is a microprocessor that resides in the sensor head of the CPI. Notify the digital
signal processor (DSP) that a particle was seen so that it can send a PDS packet to the
data acquisition system. (A PDS data packet accompanies each particle image with
particle-specific information such as the voltage pulse height that was output from each of
the PDS detectors.) Wait in this state and don’t allow any more particles to be imaged
until an EXSYNC pulse is received from the frame grabber in the data acquisition system.
SPEC Inc. reserves the right to make improvements and changes to the CPI and related software at any
time and without notice
5
SPEC CPI Preliminary Technical Manual
(The EXSYNC pulse causes the camera to download its current image to the data
acquisition computer. It also tells the sensor head electronics that the camera and data
acquisition computer are ready to take the next picture.)
State 4: Perform some of the operations to reset the sensor head electronics in preparation for the
next particle. Wait for the CLEAR HOLD signal from the DSP. (This signal tells the state
machine that the DSP is ready for the next particle.)
State 5: Go to state 6.
State 6: Reset the pulse-shaping electronics in the PDS detectors to get ready for the next particle.
State 7: Continue resetting the pulse-shaping electronics in the PDS detectors. If no particles are
detected in the beam, go to state 0; otherwise, wait here.
The imaging laser will fire when the PIB_OK signal goes low. This causes the image of the particle to be
captured by the CCD camera. The Camera downloads the captured image to the frame grabber which is
located in the Data Acquisition System as soon as it receives the next EXSYNC pulse from the frame
grabber.
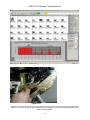
Once the image download is complete the frame grabber interrupts the computer. Before the image was
downloaded the frame grabber checked the PDS STATUS signal to see if the imaging laser was fired. If it
was not fired, then the PDS STATUS bit will be a logic low. In this case the image frame is discarded. If it
was fired, the PDS STATUS signal will be a logic high. In this case, the image frame is searched for
regions of interest (ROIs) by the Data Acquisition System. These are locations in the image where
particles are present. The image processing algorithm, subtracts the stored background image from the
newly acquired frame. If the subtraction results in any areas of the CCD image greater than a predefined
minimum pixel size with a shadow depth greater than the user selectable particle threshold, these areas
are cropped from the full frame. Figure 1.1.3 shows an example of an ROI that was cropped (cut out) from
the image frame. The ROIs are cropped from the picture and stored into the current data file on the hard
disk. This keep the data files as small and compact as possible. The data file has the file extension “.ROI ”.
A PDS data packet will be associated with each ROI in the data file. The PDS packet is sent from the DSP
to the Data Acquisition System via the RS422 link. It contains information such as the particle’s arrival time
and the peak heights of the two PDS signals for the laser trigger event associated with this particle (see the
data acquisition system section for full details of the PDS packet).
SPEC Inc. reserves the right to make improvements and changes to the CPI and related software at any
time and without notice
6
SPEC CPI Preliminary Technical Manual
2.0 GETTING STARTED
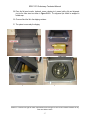
2.1 Unpacking the CPI System
This procedure is to be followed when unpacking the CPI system after shipment or storage.
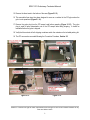
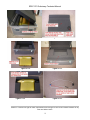
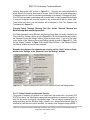
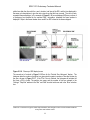
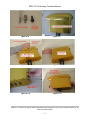
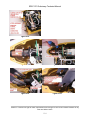
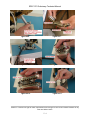
1. Open the container containing the CPI data system and other accessories (Figure 2.1.1).
2. Remove the flat panel monitor, manuals, mouse, keyboard, cleaning tool, alignment pin, and
pulling fork from the case (Figure 2.1.2).
3. Remove the top layer of foam exposing the data system and accessories.
4. Remove the data system, AcquireNow hardware key, power cables, monitor stand, test stand, and
atomizer from the case (Figure 2.1.3). The atomizer and alignment pin should be wrapped in
bubble wrap.
5. Foam blocks have been inserted into the computer case for added protection during shipping.
Remove the three screws for the computer cover (Figure 2.1.4) and remove the computer cover.
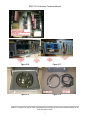
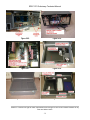
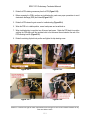
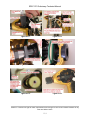
6. Remove the foam blocks from inside the computer (Figure 2.1.5). Taking proper ESD precautions,
inspect the components inside the computer. Check that all the computer cards and chips are
properly seated and that all cables are connected for disk drives, etc.
7. After a visual inspection that nothing was damaged in shipping, reinstall the computer cover.
8. The data system is shipped with the AcquireNow hardware key removed and the captive cabling
unplugged (Figure 2.1.6).
9. Connect the AcquireNow hardware key and the captive connectors to the RS 422/232 converter
card as shown in Figure 2.1.7.
10. Open the shipping case containing the CPI sensor head and cables (Figure 2.1.8).
11. Remove the cables from the top layer of foam, both the test cables and standard cables are
contained in this box (Figure 2.1.9).
12. Remove the top layer of foam (Figure 2.1.10).
13. This foam insert has been designed to use as a cushion for the pylon cover and nose cone during
disassembly of these components (Figure 2.1.11). Set this layer of foam aside for now.
14. Remove the CPI pylon from the shipping case (Figure 2.1.12).
SPEC Inc. reserves the right to make improvements and changes to the CPI and related software at any
time and without notice
7
SPEC CPI Preliminary Technical Manual
15. Remove the foam insert in the bottom of the case (Figure 2.1.13).
16. This removable foam insert has been designed to serve as a cushion for the CPI pylon when the
pylon is not operational (Figure 2.1.14).
17. Remove the pylon plug from the CPI sensor head before operating (Figure 2.1.15). The pylon
plug is used to keep contamination out of the CPI sample tube during shipping. It should be
reinstalled before the pylon is shipped.
18. Verify that the contents of both shipping containers match the contents on the included packing list.
19. The CPI can now be connected following the Connection Procedure, Section 2.2.
Figure 2.1.1.
Figure 2.1.2.
Figure 2.1.3.
Figure 2.1.4.
SPEC Inc. reserves the right to make improvements and changes to the CPI and related software at any
time and without notice
8
SPEC CPI Preliminary Technical Manual
Figure 2.1.5.
Figure 2.1.6.
Figure 2.1.7.
Figure 2.1.8.
Figure 2.1.9.
SPEC Inc. reserves the right to make improvements and changes to the CPI and related software at any
time and without notice
9
SPEC CPI Preliminary Technical Manual
Figure 2.1.10.
Figure 2.1.11.
Figure 2.1.12.
Figure 2.1.13.
Figure 2.1.14.
Figure 2.1.15.
SPEC Inc. reserves the right to make improvements and changes to the CPI and related software at any
time and without notice
10
SPEC CPI Preliminary Technical Manual
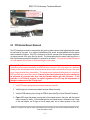
2.2 Connecting the CPI Sensor Head to the Data Acquisition System
Warning! Cables MUST be connected in a certain sequence. If you do not follow this sequence,
you may damage your CPI!
Warning! The Data acquisition system and Sensor Power switch MUST be turned off before
any cables are connected or Disconnected. If you do not turn them off before connecting
or disconnecting cables you may damage your CPI!
2.2.1 Connection Procedure for Operating the CPI in the Laboratory
1. Verify that the Sensor Power Switch on the front of the Data Acquisition System is turned off.
Verify that the Data Acquisition System Computer is turned off.
See Figure 2.2.1: Front of the Data Acquisition System.
2. Connect the Computer Power, AC1, and AC2 power cables to a 115 Volt AC source. The order of
connection of the AC power cables is not important. See Figure 2.2.2: CPI Cable Connection
Diagram and Figure 2.2.3: Back of the Data Acquisition System.
3. Connect the power/dsp cable from J2 on the Data Acquisition System to J2 on the Sensor Head.
See Figure 2.2.2: CPI Cable Connection Diagram, Figure 2.2.4: Connecting the power/dsp to the
Data Acquisition System, and Figure 2.2.8: Connecting the power/dsp cable to the Sensor Head.
4. Connect the framegrabber cable from J1 on the Data Acquisition System to J1 on the Sensor
Head. See Figure 2.2.5: Connecting the framegrabber to the Data Acquisition System, and Figure
2.2.9: Connecting the sensor camera cable to the Sensor Head.
5. Connect the mouse, keyboard, monitor, Computer Power, AC1, and AC2 to the back of the Data
Acquisition System. See Figure 2.2.2: CPI Cable Connection Diagram and Figure 2.2.6:
Connecting the mouse, keyboard, power supply, screen, and sensor AC1 and AC2.
6. Connect the 28 VDC Power Cord to the back of the Data Acquisition System. See Figure 2.2.7:
Connecting 28 VDC to back of Data Acquisition System.
7. The CPI is now ready to be powered up.
SPEC Inc. reserves the right to make improvements and changes to the CPI and related software at any
time and without notice
11
SPEC CPI Preliminary Technical Manual
2.2.2 Connection Procedure for Installing the CPI on an Airplane
1. Verify that the Sensor Power switch on the front of the Data Acquisition System is turned off.
Verify that the Data Acquisition System Computer is turned off. See Figure 2.2.1: Front of the Data
Acquisition System.
2. Connect the Computer Power, AC1, and AC2 power cables to a 115 Volt AC source. The order of
connection of the AC power cables is not important. See Figure 2.2.2: CPI Cable Connection
Diagram and Figure 2.2.3: Back of the Data Acquisition System.
3. Connect the mouse, keyboard, and monitor to the back of the Data Acquisition System. Connect
the AcquireNow Hardware Key to the parallel port. See Figure 2.2.2: CPI Cable Connection
Diagram and Figure 2.2.3: Back of the Data Acquisition System.
4. Connect the power/dsp cable to J2 on the Data Acquisition System only. DO NOT connect the
other end to the Sensor Head yet. See Figure 2.2.3: Back of the Data Acquisition System.
5. Connect the sensor camera cable to J1 on the Data Acquisition System only. DO NOT connect the
other end to the Sensor Head yet.
6. Before making connections to the Sensor Head, electrostatic discharge (ESD) precautions should
be taken. It is assumed that if the CPI Sensor Head is mounted on the aircraft, the CPI pylon is
grounded to the aircraft frame. It is also assumed that if the Data Acquisition System is mounted in
a metal frame inside the aircraft, that it is also grounded to the aircraft frame. In this case no extra
ground wire is needed. However, if the CPI Sensor Head is lying outside and is not mounted, or if
the Data Acquisition System is not mounted, then a temporary ground wire should be run between
the CPI pylon and the Data Acquisition System Chassis. If the Data Acquisition System Chassis is
grounded to the aircraft frame then the ground wire may alternatively be run from the pylon to the
aircraft frame. This will ensure that the Sensor Head and the Data Acquisition System Chassis are
at the same electrical potential when the cables are connected. The person making the cable
connections should be grounded to the CPI pylon by using a ground strap or by touching a screw
on the outside of the CPI pylon.
7.
Connect the power/dsp cable that runs from J2 on the Data Acquisition System to J2 on the
Sensor Head. See Figure 2.2.4: Connecting the power/dsp cable to the Sensor Head.
8. Connect the sensor camera cable that runs from J1 on the Data Acquisition System to J1 on the
Sensor Head. See Figure 2.2.5: Connecting the sensor camera cable to the Sensor Head.
9. Remove the temporary ground wire that was installed in step 5.
10. The CPI is now ready to be powered up.
SPEC Inc. reserves the right to make improvements and changes to the CPI and related software at any
time and without notice
12
SPEC CPI Preliminary Technical Manual
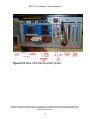
Figure 2.2.1: Front of the Data Acquisition System
Figure 2.2.2: CPI Cable Connection Diagram
SPEC Inc. reserves the right to make improvements and changes to the CPI and related software at any
time and without notice
13
SPEC CPI Preliminary Technical Manual
Figure 2.2.3: Back of the Data Acquisition System
SPEC Inc. reserves the right to make improvements and changes to the CPI and related software at any
time and without notice
14
SPEC CPI Preliminary Technical Manual
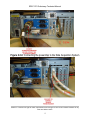
Figure 2.2.4: Connecting the power/dsp to the Data Acquisition System
SPEC Inc. reserves the right to make improvements and changes to the CPI and related software at any
time and without notice
15
SPEC CPI Preliminary Technical Manual
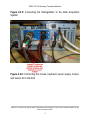
Figure 2.2.5: Connecting the framegrabber to the Data Acquisition
System
Figure 2.2.6: Connecting the mouse, keyboard, power supply, screen,
and sensor AC1 and AC2
SPEC Inc. reserves the right to make improvements and changes to the CPI and related software at any
time and without notice
16
SPEC CPI Preliminary Technical Manual
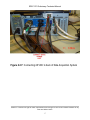
Figure 2.2.7: Connecting 28 VDC to back of Data Acquisition System
SPEC Inc. reserves the right to make improvements and changes to the CPI and related software at any
time and without notice
17
SPEC CPI Preliminary Technical Manual
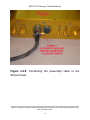
Figure 2.2.8: Connecting the power/dsp cable to the
Sensor Head.
SPEC Inc. reserves the right to make improvements and changes to the CPI and related software at any
time and without notice
18
SPEC CPI Preliminary Technical Manual
Figure 2.2.9: Connecting the sensor camera cable to the Sensor
Head.
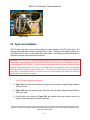
2.3 CPI Atomizer Setup for Laboratory Testing
1. Verify CPI has been connected to the Data Acquisition System unit following the connection
procedure.
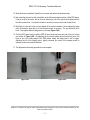
2. Place CPI on stable riser blocks (Figure 2.3.1). Height of blocks should be sufficient for bottom
connector clearance, but low enough to keep instrument stable (Figure 2.3.2).
3. Plug in vacuum hose adapter to CPI exhaust tube (Figure 2.3.3). Vacuum hose adapter may have
to be custom fit to mate with CPI exhaust tube (Figure 2.3.4).
SPEC Inc. reserves the right to make improvements and changes to the CPI and related software at any
time and without notice
19
SPEC CPI Preliminary Technical Manual
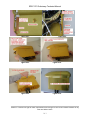
4. Setup droplet atomizer in front of CPI (Figure 2.3.5). The atomizer should spray drops in a
direction perpendicular to the direction of airflow into the CPI. DO NOT spray drops directly into
CPI along flow direction. (See Figure 2.3.6) Water drops will contaminate the windows and the
windows will need to be cleaned.
5. Power on the data system and probe per the CPI startup procedure, Section 2.4, and run CPI.exe
program.
6. After the CPI program has successfully started and obtained a background, turn on vacuum
cleaner and spray water drops by squeezing atomizer bulb. The CPI program should show water
drops appearing in real time. If the vacuum is turned on before the CPI has obtained a
background, it may take longer for the CPI to obtain a background due to particles passing through
the sample volume.
Figure 2.3.1
Figure 2.3.2
Figure 2.3.3
Figure 2.3.4
SPEC Inc. reserves the right to make improvements and changes to the CPI and related software at any
time and without notice
20
SPEC CPI Preliminary Technical Manual
Figure 2.3.5
Figure 2.3.6
2.4 CPI Startup Procedure
1. Verify that all cables are connected according to the “Connecting CPI Sensor Head to Data
Acquisition System” Section 2.2. See Figure 2.4.1.
SPEC Inc. reserves the right to make improvements and changes to the CPI and related software at any
time and without notice
21
SPEC CPI Preliminary Technical Manual
Figure 2.4.1: Rear of Data Acquisition System with all cables connected.
2. Unlock & open the disk drive bay door.
3. Start the Data Acquisition System computer by pressing the “Computer Power” switch on the lower
left side of the disk drive bay by the red “RESET” button. See Figure 2.4.2. Allow the computer to
boot up.
Figure 2.4.2: Front panel of the CPI Data Acquisition System.
4. Double click the CPI icon on the desktop to start the CPI.exe program.
5.
After the CPI program has started, switch on the “Sensor Power” switch on the front panel of the
Data Acquisition System. See Figure 2.4.2.
6.
Single click the “Start Probe” button on the left side on the CPI program window. See Figure 2.4.3.
SPEC Inc. reserves the right to make improvements and changes to the CPI and related software at any
time and without notice
22
SPEC CPI Preliminary Technical Manual
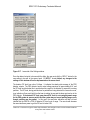
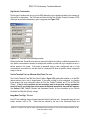
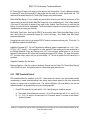
Figure 2.4.3: CPI Program Screen While It Is Allocating Memory.
7.
You should see an “Allocating Memory” message as shown in Figure 2.4.3. This message
indicates that the CPI program is allocating memory locally in the Data Acquisition Computer. It is
not yet trying to communicate with the probe (Sensor Head). Wait about forty seconds.
8.
After about forty seconds the message window should change to “Initializing the Probe…” as
shown in Figure 2.4.4. In this step the CPI program tries to communicate with the probe. If it is
successful, it sets up probe operating values, receives data packets from the probe, directs the
CCD camera to take two background images, and processes those images to establish a
background reference for the probe’s imaging system. After about ten more seconds you should
see the CPI startup screen, as described in step 9 below.
SPEC Inc. reserves the right to make improvements and changes to the CPI and related software at any
time and without notice
23
SPEC CPI Preliminary Technical Manual
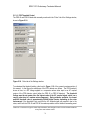
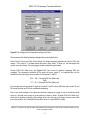
Figure 2.4.4: CPI Program Screen While It Is Initializing the Probe.
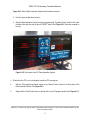
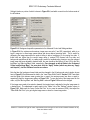
9.
Once the Probe is initialized you should see the CPI startup screen which contains a particle image
display window with at least one background image. Also you should see a “Statistics” window on
the right-hand side of the screen, as shown in Figure 2.4.5. If you see a screen like Figure 2.4.5
then your CPI has been started correctly and is running. See the “Software Description and Real
Time Operation, Section 5) for further instructions on fine-tuning and running your CPI.
If you DO NOT see a screen like Figure 2.4.5 then the software or probe has a problem. Review
the CPI cable connection procedure and CPI startup procedure to make sure that they were done
correctly. If these procedures were followed correctly, then please see the “Real Time Operation
and Troubleshooting, Section 5.2).
SPEC Inc. reserves the right to make improvements and changes to the CPI and related software at any
time and without notice
24
SPEC CPI Preliminary Technical Manual
Figure 2.4.5: Startup screen of CPI Program.
2.5 Disconnecting the CPI Cables
Warning! The sensor camera cable must be disconnected before the power/dsp cable. If you do not
disconnect the sensor camera cable first you may damage your CPI!
CPI cables must be disconnected in the reverse of the sequence in which they were connected, as follows:
1. Verify that the Sensor Power switch on the front of the data acquisition system is switched off.
Verify that the Data Acquisition System Computer is switched off.
2. Disconnect the sensor camera cable from J1 on the Data Acquisition Computer.
3. Disconnect the sensor camera cable from J1 on the Sensor Head.
SPEC Inc. reserves the right to make improvements and changes to the CPI and related software at any
time and without notice
25
SPEC CPI Preliminary Technical Manual
4. Disconnect the power/dsp cable from J2 on the Data Acquisition Computer.
5. Disconnect the power/dsp cable from J2 on the Sensor Head.
6. Disconnect mouse, keyboard, and monitor from the back of the Data Acquisition Computer.
7. Disconnect the three AC power cables: Computer Power, AC1, AC2.
2.6 Packing CPI System
This procedure is to be followed when packing the CPI system for shipment or storage.
20. Place the foam insert into the shipping case for the CPI pylon (Figure 2.6.1).
21. Place the pylon plug over the inlet and outlet of the CPI pylon to keep dust out during shipping
(Figure 2.6.2).
22. Place the CPI pylon in the shipping container and cover with the foam insert with the circular cutout
as shown in Figure 2.6. 3. Be sure the CPI pylon is in the same orientation as Figure 2.6.2.
23. Place the CPI cables into the circular cutout as shown in Figure 2.6.4. Close and latch this
shipping case.
24. Remove the AcquireNow Hardware key and then disconnect the captive cables from the back of
the data system (Figure 2.6.5).
25. This step is optional, but provides more protection during shipping of the computer. Remove the
three screws for the computer cover as shown in Figure 2.6.6 and remove the computer cover.
26. Insert the foam blocks included in the original shipment into the computer case for added
protection during shipping. Place the foam blocks in the location shown in Figure 2.6.7. Replace
the three screws for the computer cover. Replace the computer cover.
27. Place the data system and other accessories in the shipping case as shown in Figure 2.6.8. The
atomizer should be wrapped in bubble wrap.
28. Place the foam insert shown in Figure 2.6.9 on top of the data system.
SPEC Inc. reserves the right to make improvements and changes to the CPI and related software at any
time and without notice
26
SPEC CPI Preliminary Technical Manual
29. Place the flat panel monitor, keyboard, mouse, cleaning tool, manual, pulling fork and alignment
pin into the foam insert as shown in Figure 2.6.10. The alignment pin should be wrapped in
bubble wrap.
30. Close and latch the lid to the shipping container.
31. The system is now ready for shipping.
Figure 2.6.1.
Figure 2.6.2.
Figure 2.6.3.
Figure 2.6.4.
SPEC Inc. reserves the right to make improvements and changes to the CPI and related software at any
time and without notice
27
SPEC CPI Preliminary Technical Manual
Figure 2.6.5.
Figure 2.6.6.
Figure 2.6.7.
Figure 2.6.8.
Figure 2.6.9.
Figure 2.6.10.
SPEC Inc. reserves the right to make improvements and changes to the CPI and related software at any
time and without notice
28
SPEC CPI Preliminary Technical Manual
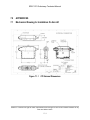
3.0 CPI PHYSICAL DESCRIPTION
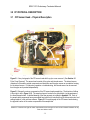
3.1 CPI Sensor Head – Physical Description
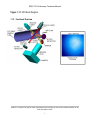
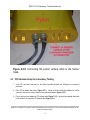
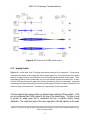
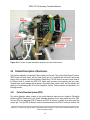
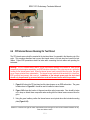
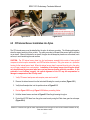
Figure 3.1.1. Photograph of CPI sensor head with pylon cover removed.
Figure 3.1.1 is a photograph of the CPI sensor head with the pylon cover removed. (See Section 6.1
Pylon Cover Removal) The sensor head consists of the pylon and internal sensor. The internal sensor
contains all of the electro-optical components and electronics and the pylon serves as a protective housing
for the internal sensor. For laboratory operation or troubleshooting, the internal sensor can be removed
from the pylon and operated independently.
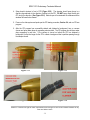
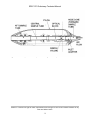
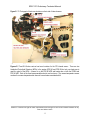
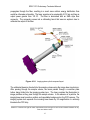
Figure 3.1.2 shows the various components of the CPI sensor head sample tube. The direction of airflow
is from right to left in Figure 3.1.2. The sample volume is located in the optical block, just downstream of
the forward sample tube. A detailed drawing of the flow geometry is included in Appendix 7.2. Each of
the sample tube components has an associated heat zone that is controlled from the “advanced control and
settings window” in the real time software. Figure 3.1.3 is a photograph of the CPI sensor head showing
the physical location of the various components of the sample tube.
SPEC Inc. reserves the right to make improvements and changes to the CPI and related software at any
time and without notice
29
SPEC CPI Preliminary Technical Manual
Figure 3.1.2. Cutaway view of CPI Sample Tube showing relevant components.
SPEC Inc. reserves the right to make improvements and changes to the CPI and related software at any
time and without notice
30
SPEC CPI Preliminary Technical Manual
Figure 3.1.3. Photograph showing the physical location of the various sample tube components.
Figure 3.1.4 is a cutaway view of the optical block showing the locations of the three laser beam paths
through the sample volume. The location of the six windows is also shown. Knowledge of the window
locations is important for cleaning of the windows. Contamination on the PDS output windows has the
largest effect on the PDS DC detector levels. During cleaning, the real time software should be running to
provide feedback for the cleaning process. If the PDS DC level increases after a particular PDS window is
cleaned, that window needs to be cleaned again. Removal of contamination from the windows should
result in a decrease in the baseline stray light hitting the PDS detectors.
SPEC Inc. reserves the right to make improvements and changes to the CPI and related software at any
time and without notice
31
SPEC CPI Preliminary Technical Manual
Figure 3.1.4. Cutaway of optical block showing laser beam locations and window locations.
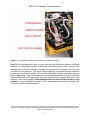
Figure 3.1.5 is a photograph showing the location of the electronics printed circuit boards in the CPI sensor
head. The power supply board and Digital Signal Processor (DSP) control board are equipped with
temperature sensors that monitor the temperature of these boards. This information is displayed in the
housekeeping window. These temperatures are monitored, but do not have a corresponding temperature
setpoint in the advanced control and settings window, as there are no heaters associated with these circuit
boards.
SPEC Inc. reserves the right to make improvements and changes to the CPI and related software at any
time and without notice
32
SPEC CPI Preliminary Technical Manual
Figure 3.1.5. Photograph showing location of the CPI printed circuit boards.
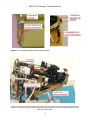
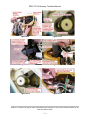
Figure 3.1.6 is a photograph of the pylon cover and pylon main body showing the location of the different
heat zones. The heat zones in the pylon are broken into three different areas for control: the pylon slugs,
pylon base patch, and pylon cover patch. Physically, there are four pylon slug heaters, two in the pylon
cover and two in the pylon base. They are all controlled together by one temperature sensor mounted in
the base near one of the slug heaters. The pylon base patch heater and pylon cover patch heater are
shown in Figure 3.1.6. Each of these heaters has its own temperature sensor and they are individually
controlled in the software. The main purpose of the pylon heaters is to de-ice the pylon when flown in icing
conditions. During normal operation, these temperature zones should not fall below freezing in icing
conditions. In very cold temperatures, such as –60C, these temperatures may fall below freezing, but
icing is not a concern at these temperatures.
SPEC Inc. reserves the right to make improvements and changes to the CPI and related software at any
time and without notice
33
SPEC CPI Preliminary Technical Manual
Figure 3.1.6. Photograph showing location of pylon heaters.
SPEC Inc. reserves the right to make improvements and changes to the CPI and related software at any
time and without notice
34
SPEC CPI Preliminary Technical Manual
Figure 3.1.7. Photograph of heat zone locations on front side of internal sensor.
Figure 3.1.8. Photograph of heat zone locations on rear side of internal sensor.
Figures 3.1.7 and 3.1.8 show various heat zone locations for the CPI internal sensor. There are two
Avalanche Photodiode Detectors (APDs) in the system (PDS 45 and PDS 90) but only one heat zone is
used for control of the APDs. A sensor is on the PDS 90 APD and heaters are on both the PDS90 and
PDS 45 APD. Each of the three laser assemblies has its own heat zone. The camera temperature sensor
monitors the camera temperature but does not have a heater associated with it.
SPEC Inc. reserves the right to make improvements and changes to the CPI and related software at any
time and without notice
35
SPEC CPI Preliminary Technical Manual
4.0 THEORY OF OPERATION
4.1 Optical System Description
The overall optical system consists of three separate subsystems: the 45 Particle Detection
System (PDS), the 90 PDS system, and the imaging system. Figure 1.1.2 is a functional
schematic for the CPI optical system. For the sake of clarity, only the major components of
each system are shown in the figure. The PDS system is used to detect the presence of a
particle in the sample volume. The CPI DSP electronics process the particle information. If
certain triggering criteria are satisfied (pulse height, minimum transit time, etc.), the DSP
electronics send a signal to pulse a high power imaging laser and capture an image of the
particle on a CCD camera.
Both PDS systems are functionally identical. The PDS systems use a continuous wave laser and beam shaping
optics that produce a laser beam with a rectangular cross-section. The two PDS laser beams are orthogonal to one
another forming a volume of approximately 2.5 mm x 2.5 mm x 0.5 mm thick. This volume is located in the center of
the instrument sample tube, tilted at an angle of 45 degrees. The rectangular laser beams are “dumped” onto a dump
spot upstream of the PDS detectors. Figure 1.1.2 shows the laser beams being dumped, in the absence of a particle
in the sample volume.
Figure 1.1.3 is a schematic of the optical system as a particle passes through the sample volume. As the particle
traverses the PDS laser beams, it begins to scatter light around the dump spots and onto the PDS detectors.
Avalanche photodiodes (APDs) are used for the PDS detectors due to their ability to detect low light levels. The
output of the PDS detectors is monitored by the DSP control board.
The imaging system consists of a CCD camera with an imaging lens, and a high power
pulsed laser. When the DSP electronics receive simultaneous signals from the 45 PDS and
90 PDS detectors, to indicate the presence of a particle in the sample volume, the CCD
camera is exposed with a 20-40 ns laser flash. The image of the particle is then captured
by the camera. The imaging system is configured such that the object plane is coplanar
with the backside of the rectangular volume formed by the PDS laser beams. The effective
imaging area is a square that is 2.5 mm x 2.5 mm.
4.1.1 PDS System
SPEC Inc. reserves the right to make improvements and changes to the CPI and related software at any
time and without notice
36
SPEC CPI Preliminary Technical Manual
Figure 1.1.3 is a simplified representation of the overall optical system. The actual PDS
systems and imaging system consist of many optical components used to achieve the
desired optical performance. The 90 PDS system has a beam path that makes an angle of
90° with the axis of the sample tube. The 45 PDS system has a beam path that makes an
angle of 45° with the axis of the sample tube. Figure 4.1.1 is a solid model the 90 PDS
system showing all of the individual system components. Figure 4.1.1 also shows a
simplified laser beam path through the 90 PDS system. The actual laser beam shape as
the light propagates through each optical element in the system is described using ray
tracing diagrams.
Figure 4.1.2 is a ray trace for the PDS laser beam shaping optics. The laser diodes and
beam shaping optics are identical for both the 90 degree and 45 degree PDS systems. The
beam shaping optics are used to produce an output beam with a rectangular cross-section
of the appropriate dimensions and a relatively uniform energy distribution.
Figure 4.1.1. 90 PDS system optical component layout.
SPEC Inc. reserves the right to make improvements and changes to the CPI and related software at any
time and without notice
37
SPEC CPI Preliminary Technical Manual
a)
b)
Figure 4.2.2. Ray trace for PDS laser beam shaping optics with a) view of compressed axis and b) view of
uncompressed axis.
The lasers used for the PDS system are Hitachi HL7851 laser diodes. The lasers operate at a wavelength of 785 nm
with a maximum output power of 40 mW. The output from the laser diode has an elliptically divergent beam with a
parallel divergence angle of 9.5° and a perpendicular divergence angle of 23°. An aspheric lens is used to produce
a collimated beam with an elliptical cross-section. As shown in Figure 4.2.2, the dimensions of the collimated beam
are approximately 5.5 mm x ~2 mm.
The minor axis of the elliptical beam is then compressed using a pair of cylindrical lenses. In Figure 4.2.2, the minor
axis is referred to as the x-axis and the major axis is referred to as the y-axis. The beam is compressed by the ratio
of the focal lengths of the cylindrical lenses. In this case the compression is 5/25 or 0.2X. This reduces the minor
axis of the ellipse to approximately 0.4 - 0.5 mm. The beam shape is now closer to rectangular than elliptical. Since
the cylindrical lenses do not affect the y-dimension of the beam, a rectangular aperture is used to reduce the beam to
the desired 2.5 mm dimension. The width of the aperture is 1 mm to allow the laser beam to cleanly pass through in
the x-dimension.
SPEC Inc. reserves the right to make improvements and changes to the CPI and related software at any
time and without notice
38
SPEC CPI Preliminary Technical Manual
The PDS lasers and the beam shaping optics are contained in the PDS tube assembly. This assembly is an integral
unit that allows the shaped laser beam to be pointed and steered without affecting the beam shape and collimation.
As shown in Figure 4.1.1, the shaped beam intersects the 90 PDS input mirror, which directs it through the 90 PDS
input window and into the sample volume. The windows and mirrors mount on the optical block, a key mechanical
component of the instrument. The optical block defines the physical location of the sample volume and serves as an
interface between air and cloud particles flowing through the sample tube and the internal structure of the CPI.
The sample volume is located in the center of the sample tube, running through the optical
block. This relationship is depicted in Figure 1.1.2. After the PDS laser beam traverses the
sample volume and exits the optical block, it intersects the PDS collection optics.
The PDS collection optics are designed to collect light scattered by particles in the sample
volume and focus it onto the APD which acts as the PDS detector. The PDS collection
optics and dump spot define the collection angle for the PDS system. In this case both PDS
systems have been designed to collect light scattered into an angle of approximately 2.5° 8.2°.
Figure 4.1.3 is a ray trace for the 90 PDS collection optical system. In this figure, the
sample volume is on the left side and the PDS detector is located on the right side. Four
separate ray traces are shown. Figure(s) 4.1.3a and 4.1.3b show the PDS laser beam as it
is blocked by the dump spot when no particle is present in the sample volume. Figure
4.1.3a shows the beam in the X-Z plane (~0.5 mm dimension) and Figure 4.1.3b shows the
beam shape for the Y-Z plane (2.5 mm dimension). The beam size on the dump spot is
relatively the same size as that in the sample volume, even though it has passed through 90
PDS Collection Lens1 and 90 PDS Collection Lens2. The spacing between the various
optical elements is shown in Figure 4.1.3b.
Figures 4.1.3c and 4.1.3d are ray traces for the scattered light path propagating through the 90 PDS collection
optics. A particle must be present in the 90 PDS beam to scatter light around the dump spot. Figure 4.1.3c shows
the scattered light path for the X-Z plane and Figure 4.1.3d shows the scattered light path for the Y-Z plane. The
effect of the dump spot can be seen in both these ray traces by noticing the shadowed area just to the right of the
dump spot. The minimum collection angle of 2.5° is defined by the rays that just pass around the dump spot in
Figure 4.1.3c. The maximum angle of 8.2° is defined by the maximum clear aperture of 90 PDS Collection Lens2.
The relay lenses are used to accommodate the mechanical packaging of the collection optics by increasing the total
path length. The APD Focusing Lens is used to focus the scattered light rays onto the 1.5 mm diameter active area
of the detector.
SPEC Inc. reserves the right to make improvements and changes to the CPI and related software at any
time and without notice
39
SPEC CPI Preliminary Technical Manual
a)
b)
c)
d)
Figure 4.1.3. Ray trace for 90 PDS collection optics: (a) beam in X-Z plane, (b) beam in Y-Z plane (c)
scattered light path X-Z plane (d) scattered light path Y-Z plane.
Figure 4.1.4 is a solid model showing all of the components for the 45 PDS collection
system. The 45 PDS laser and beam shaping optics are identical to the 90 PDS laser and
beam shaping optics described above. The primary difference between the 90 PDS and 45
PDS optical systems are found in the collection optics. The collection lenses must have
longer focal lengths because the distance from the first collection lens to the sample volume
is longer due to the beam crossing the sample tube at a 45° angle.
SPEC Inc. reserves the right to make improvements and changes to the CPI and related software at any
time and without notice
40
SPEC CPI Preliminary Technical Manual
Figure 4.1.4. 45 PDS system optical component layout.
Figures 4.1.5a-d are ray traces for the 45 PDS collection optics. The lenses labeled 45 Collection Lens1 and 45
Collection Lens2 have longer focal lengths than the corresponding lenses in the 90 PDS collection optics. Relay
lenses are not necessary due to the shorter path length to accommodate the mechanical packaging. As in the case
of the 90 PDS collection optics, 45 PDS Collection Lens2 is the limiting aperture that defines the maximum collection
angle of 8.2°.
SPEC Inc. reserves the right to make improvements and changes to the CPI and related software at any
time and without notice
41
SPEC CPI Preliminary Technical Manual
a)
b)
c)
d)
Figure 4.1.5. Ray trace for 45 PDS collection optics.
4.1.2 Imaging System
Figure 4.1.6 is a solid model of the CPI imaging optical system showing all of the components. The two primary
components of the system are the imaging laser and the imaging system lens. The primary function of the imaging
system is to capture images of cloud particles as they move through sample volume at aircraft speeds. This is
accomplished by flashing a laser at pulse widths up to 40 ns while a particle is present in the object plane. A 1024 x
1024 pixel CCD camera captures the image of the particle and transfers the frame to the data system. A previously
stored background image is subtracted from the newly acquired image and the result is a region of interest (ROI) that
contains an image of the cloud particle. The camera runs at approximately 74 frames per second
The laser used for the imaging system is a stacked array consisting of three emitters. A 600
μm core multimode fiber is butt-coupled to the face of the stacked array. The fiber is used
to provide an output beam that is circularized and has a relatively uniform energy
distribution. The output from each of the laser segments is blended together as the beam
SPEC Inc. reserves the right to make improvements and changes to the CPI and related software at any
time and without notice
42
SPEC CPI Preliminary Technical Manual
propagates through the fiber, resulting in a much more uniform energy distribution than
would be otherwise achievable. The laser operates at a wavelength of 810 nm and has an
output power greater than 120 W. The fiber is terminated with an SMA style fiber
connector. The connector screws into a collimating barrel that uses an aspheric lens to
collimate the output of the fiber.
Figure 4.1.6. Imaging system optical component layout.
The collimated beam is directed into the sample volume using the image laser input mirror.
After passing through the sample volume, the beam passes through a correction plate
before being folded into the imaging system lens. The laser provides the illumination to
image particles as they pass through the sample volume. In the absence of a particle, the
imaging laser must provide a uniform and repeatable background on the CCD camera. The
imaging system lens expands the incoming laser beam by 5X magnification to uniformly
illuminate the CCD chip.
SPEC Inc. reserves the right to make improvements and changes to the CPI and related software at any
time and without notice
43
SPEC CPI Preliminary Technical Manual
The CPI uses an imaging lens with a primary magnification of 5X. A feature of the imaging
lens is the ability to maintain a constant magnification over its focus adjustment range. The
focus of the imaging system is adjusted with an adjustment barrel on the body of the lens.
This lens system greatly simplifies the optical alignment of the imaging system.
The correction plate is necessary to correct the astigmatism produced in the imaging
system. This astigmatism is the result of the image output window being tilted at an angle
of 45° to the imaging system optical axis. The rays are refracted at different angles
depending on where they intersect the window. The result is an astigmatism that makes a
spherical water drop look elliptical. The correction plate is a plane parallel element that is
tilted at a specific angle to nullify the astigmatism.
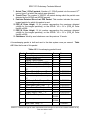
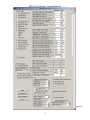
Table 4.1.1 is a summary of the optical specifications for the CPI.
Table 4.1.1. CPI optical specifications.
VALUE
UNITS
2.5 X 2.5
mm x mm
Pixel resolution
~2.4
m/pixel
camera array size
1024 x 1280
pixels x pixels
camera pixel size
12 x 12
m
Max. Frame Rate
74 at 1024 x 1024
frames per second at pixels x
pixels
Image system primary
magnification
~5X
Linear magnification
PARAMETER
Sample area
SPEC Inc. reserves the right to make improvements and changes to the CPI and related software at any
time and without notice
44
SPEC CPI Preliminary Technical Manual
Image laser wavelength
810
Nm
Image laser power
120
W
Image laser pulse max. pulse
width
40
ns
Image laser max. pulse
frequency
74 (currently)
Hz
PDS laser wavelength
785
nm
PDS laser max. power
40
mW (cw)
PDS beam size
~0.5 x 2.5
mm x mm
PDS collection angle
2.5 - 8.2
Degrees
4.1.3 Physical Location of Optical Components
Figures 4.1.7, 4.1.8 and 4.1.9 show the location of each of the optical components described above. The figures
should be used as a reference when trying to locate various optical components in the internal sensor head.
SPEC Inc. reserves the right to make improvements and changes to the CPI and related software at any
time and without notice
45
SPEC CPI Preliminary Technical Manual
Figure 4.1.7. Location of optical components visible from top side of internal sensor.
SPEC Inc. reserves the right to make improvements and changes to the CPI and related software at any
time and without notice
46
SPEC CPI Preliminary Technical Manual
Figure 4.1.8. Location of optical components visible from bottom side of internal sensor.
SPEC Inc. reserves the right to make improvements and changes to the CPI and related software at any
time and without notice
47
SPEC CPI Preliminary Technical Manual
Figure 4.1.9. Location of optical components visible from front side of internal sensor.
4.2 Detailed Description of Electronics
The electronic assembly is comprised of three printed circuit boards. They are the Digital Signal Processor
(DSP) board, the Relay board, and the Power board (not to be confused with the sensor head power
supply, which is located in the Data Acquisition System Box). The DSP board is the main control center of
the Sensor Head. It contains the ADSP 2191 digital signal processor microcomputer and logic chips.
Together these circuits manage particle detection, laser drive power, heater control, and the collection and
reporting of housekeeping data to the Data Acquisition System. These processes are described in the
following sections.
4.2.1
Particle Detection System (PDS)
The particle detection system consists of two particle detection lasers and two Avalanche Photodiode
Detectors (APDs). Please refer to the Optical Assembly description for the laser-related part of the PDS.
The two APDs are designated PDS 45 detector and PDS 90 detector to indicate from which laser they
receive light. Only the PDS 45 detector circuitry is described here but the PDS 90 circuitry is identical. See
SPEC Inc. reserves the right to make improvements and changes to the CPI and related software at any
time and without notice
48
SPEC CPI Preliminary Technical Manual
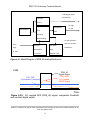
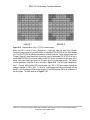
Figure 4.2.1, the block diagram of the PDS 45 analog electronics found in the schematics of Appendix 7.1.
The analog-processing electronics in the PDS 45 detector circuit high-pass filters the APD output pulse and
then feeds it to a comparator which generates a clean digital logic pulse, as shown in Figure 4.2.2.
A Hamamatsu Avalanche Photo Diode (APD) based detector with an on-board thermoelectric cooler, part
number C5460, is used to sense scattered light due to particles passing through the PDS 45 laser beam.
The output is fed into a resistor divider, R54 and R17, which scales the voltage down by a factor of 0.755.
This voltage is buffered through U15A, and the output fed to a low pass and to a high-pass filter. The low
pass filter scales the voltage down again, permitting DC monitoring of the PDS signal at the output of U16,
pin 1 with a limit of 3V max at the output. This signal goes to an analog to digital (A/D) converter and the
DSP sends the corresponding digital value to the data Acquisition system in the housekeeping packet. The
high pass filter blocks the DC component with capacitor C22, whose output is baseline restored by
transistor Q4. The baseline restored signal is input to U17, where the gain brings the AC signal amplitude
back up to 0.95 times the APD detector output.
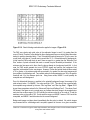
The output of U17 is, due to the described circuitry, a baseline restored, AC coupled analog signal which
should go positive when a particle passes through the PDS 45 laser beam, with an amplitude determined by
the particle’s scattering cross sectional area, the PDS 45 laser intensity, and the APD sensitivity. This signal is
compared with a PDS 45 threshold voltage, which is user programmable, at comparator U18. The AC coupled
signal, the comparator threshold and the comparator output are shown in Figure 4.2.2. The comparator output,
which is a clean digital pulse, is then sent to the digital logic IC U20.
The output of U17 described above also goes to the pulse peak detector, U19, as shown in the block diagram
in Figure 4.2.1. The output of U19 goes to an A/D converter and the corresponding analog to digital converted
(ADC) value is sent to the Data Acquisition System in the PDS packet. The PDS packet is stored in the .roi file
along with the image(s) of the particle(s) that triggered the PDS event. This allows data analysts to correlate the
size and shape of the particle with the amount of light it scattered past the dump spot and into the APD
detector.
SPEC Inc. reserves the right to make improvements and changes to the CPI and related software at any
time and without notice
49
SPEC CPI Preliminary Technical Manual
To Analog to digital
Low Pass
Converter for
Filter &
Housekeeping Data
To Logic
Buffer U16
High Pass
APD Detector
Comparator
Filter
IC U20
U18
& Analog
Wave Shaping
From
Logic
IC U20
To A/D Converter.
Circuit U17
Baseline
PDS Pulse
Restoration
Peak
Circuit Q4
Detector U19
Gets sent to Data
Acquisition
System in PDS packet
Figure 4.2.1: Block Diagram of PDS 45 Analog Electronics.
Volts
PDS_45
Digital Output
PDS_45AC
AC Coupled
APD45 Signal
P45_THR
(Comparator Threshold)
Time
Figure 4.2.2: AC coupled APD (PDS_45) signal, comparator threshold,
and resultant digital output.
SPEC Inc. reserves the right to make improvements and changes to the CPI and related software at any
time and without notice
50
SPEC CPI Preliminary Technical Manual
4.2.2 PDS Logic and Camera Image Processing
A digital logic state machine inside U20 processes the PDS 45 pulse from U18 and the PDS 90 pulse from U26
and decides when an imaging laser strobe can occur.
The PDS 45and PDS 90 pulses are digital logic 3.3V CMOS compatible signals. They are fed into U20, a
CPLD logic chip that controls the firing of the imaging laser. U20 also provides interrupts and data to the DSP,
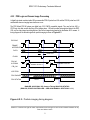
U35, and an output signal providing status of the current image being sampled by the Basler A501 camera. A
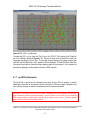
timing diagram of the relevant signals for particle imaging is shown in Figure 4.2.3.
EXSYNC
1
FRAME
INTERRUPT
DATA
2
0
3
IMAGE 1
3
2
1
IMAGE 3
IMAGE 2
Dead Time
FLASH
PDS 45
& PDS90
TTRANSIT QUALIFY
TTRANSIT QUALIFY
PIB_OK
LSR TRIG
PDS PACKET
PDS STATUS
PDS2
PDS 3
STAT3
STAT2
BASLER A501B UAV CPI Camera Timing With PDS STATUS
(EXSYNC, EDGE CONTROLLED – SEE A500 MANUAL SECTION 3.3.1.1)
Figure 4.2.3: Particle imaging timing diagram.
SPEC Inc. reserves the right to make improvements and changes to the CPI and related software at any
time and without notice
51
SPEC CPI Preliminary Technical Manual
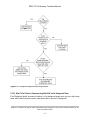
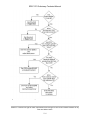
4.2.2.1
Logical State Machine
The PDS detection system is managed by a logical state machine located inside the Programmable Logic
Device (PLD) U20. A diagram of the state machine is shown in Figure 4.2.4.
The state machine idles in state 0 (S0). As long as there is no particle seen by the PDS 45 and PDS 90
detectors it idles in S0 and S8. The EXSYNCIN pulses from the frame grabber have no effect on it other
than to drive it to S8 and back to S0.
Recall that if the PDS 45 avalanche photodiode detector (APD) sees a particle then the output of
comparator U18 will go high. Likewise, if the PDS 90 APD sees a particle then the output of comparator
U26 will go high. The PDS digital processing electronics looks to see that both the PDS 45 and PDS 90
signals go high, then starts a “minimum transit time” counter. Once a minimum transit time, user set, is
exceeded, the PIB_OK signal goes high (internal to U20). The minimum transit time is shown as “T Transit
Qualify” in Figure 4.2.3. This causes the state machine to advance from S0 to S1.
When either the PDS 45 or PDS 90 signal goes low the PIB_OK signal goes low which causes the state
machine to go from S1 to S2. S2 forces the imaging laser to immediately fire a short (~20 nanosecond)
pulse of high intensity laser light, illuminating the detected particle onto the BASLER A501 CCD camera. At
the same time, the PDS STATUS signal goes high. The PDS STATUS signal tells the Data Acquisition
System that the next image downloaded from the CCD camera contains at least one particle and therefore
should not be discarded.
The state machine then advances from S2 to S3. In S3 the state machine outputs an interrupt signal to the
digital signal processor (DSP). This Notifies the DSP that a particle was seen so that it can send a PDS
packet to the data acquisition system. A PDS data packet accompanies each particle image with particlespecific information such as the voltage pulse height that was output from each of the PDS detectors. The
PDS packet is shown in the timing diagram in Figure 4.2.3. The state machine waits in S3 and doesn’t
advance to S4 until an EXSYNC pulse is received from the frame grabber in the data acquisition system.
This means no more particles will be imaged until the next EXSYNC pulse is received.
When the EXSYNC pulse is received from the frame grabber the state machine advances from S3 to S4. In
S4 the state machine outputs a CLRX signal which clears the latch that captured the last EXSYNC pulse.
This is done in preparation for the next particle. In S4 it waits for the CLEAR HOLD signal from the DSP
before advancing to S5. This signal tells the state machine that the DSP is ready for the next particle.
The EXSYNC pulse causes the CCD camera to download its current image to the frame grabber in the
data acquisition computer. EXSYNC also tells the sensor head electronics that the camera and data
acquisition computer are ready to take the next picture. The Basler A501 CCD camera is always taking
images and downloading them to the frame grabber asynchronously to the DSP and state machine clock.
This occurs at the rate of 72 frames per second. Each EXSYNC pulse corresponds to a single image sent
SPEC Inc. reserves the right to make improvements and changes to the CPI and related software at any
time and without notice
52
SPEC CPI Preliminary Technical Manual
from the CCD camera. The EXSYNC signal is generated by the frame grabber card in the data system
computer and goes to two places: the Basler A501 CCD camera and the DSP board. If the state machine
did not have to wait for the EXSYNC pulse from the frame grabber in S3 or the CLEAR HOLD signal from
the DSP in S4 it could run through its eight-step cycle many thousands of times in the time between
EXSYNC pulses, which is the same time that it takes the camera to download one image to the data
acquisition system. Forcing it to wait in S3 for EXSYNC from the frame grabber and to wait in S4 for
CLEAR HOLD from the DSP slows it down and synchronizes it somewhat with the entire image capturing
process.
When the state machine receives a CLEAR HOLD signal from the DSP it advances from S4 to S5.
It immediately moves from S5 to S6. In S6 it puts out a CLR_SMPL signal. This signal discharges the peakhold capacitors in the PDS 45 pulse peak detector U19 and the PDS 90 pulse peak detector U27, see
Block Diagram in Figure 4.2.1 and schematic diagrams in Appendix 7.1.
The state machine immediately moves from S6 to S7. In S7 it continues to put out a CLR_SMPL signal. If
no particles are detected in the PDS laser beams, it will go to S0; otherwise, it will wait here.
In S0 it idles and waits for the next particle. When the PDS detectors see the next particle the cycle repeats
itself.
EXSYNC causes the CCD camera to download its current image to the data system computer. Referring to
Figure 4.2.3. Once the image download is complete, the frame grabber interrupts the computer with a
FRAME INTERRUPT signal, and the CPI software checks the PDS STATUS bit to see if the imaging laser
was fired. If it was not, then the PDS STATUS bit is a logic zero and the image frame is discarded. If it
was, then the PDS STATUS bit is a logic one and the image frame is searched for regions of interest
(ROIs): locations in the image where particles are present. The ROIs are effectively cut out of the picture
and stored into the current data file, the name of which is based on the data system computer time when
the file was started, with the file extension .ROI. Also associated with each ROI in this file will be a PDS
packet containing information such as arrival time and peak heights of the PDS 45 and PDS 90 signals for
the laser trigger event that captured the particle image. The PDS packet is sent from the DSP to the data
acquisition system via the RS422 link.
Returning to the timing diagram of Figure 4.2.3, the 1st EXSYNC pulse (from the frame grabber to the
Basler camera and the DSP board) starts the camera downloading IMAGE 1 to the frame grabber. When
the data transfer completes, the data system computer gets a FRAME INTERRUPT from the frame grabber
associated with IMAGE 1 and sees there are no PDS packets to look for because PDS STATUS was low
during EXSYNC1. IMAGE 1 is discarded. The laser has been triggered during the transfer of IMAGE 1,
and the computer should therefore look at IMAGE 2, which is transferred due to EXSYNC2. The computer
will, during EXSYNC2, look at the new PDS STATUS signal. The blue timing line represents when the
computer looks at this signal. It is sent from U20 on the DSP board to the frame grabber. It tells the data
acquisition system to process the next image received. During FRAME INTERRUPT 2 the data acquisition
system will therefore process the next image received.
SPEC Inc. reserves the right to make improvements and changes to the CPI and related software at any
time and without notice
53
SPEC CPI Preliminary Technical Manual
Figure 4.2.4: PDS State Machine
4.2.3 PDS 45, PDS 90, & Imaging Laser Drivers
These analog-processing electronics consist of variable-power laser drivers for the PDS continuous lasers and
bias supplies for the high-power imaging laser driver. The PDS continuous laser drivers servo the current
through the PDS laser diode to force the monitor current to match a level that the digital signal processor
(DSP) sets. The maximum current through the laser diodes is limited by a series resistor to the maximum
specified for each diode. The power level of each laser diode is sensed with the internal monitor diode
whose current is converted to a voltage with an instrumentation amplifier (U7, U11). This voltage provides
negative feedback to the integrator circuit that drives the current drivers (driver transistor Q13 or Q14, and
driver transistor Q7 or Q10). Each current driver can be configured to source, by populating Q10 and Q13,
or sink, by populating Q7 and Q14, current for their respective lasers, allowing for common anode and
common cathode devices. The default laser is currently a common cathode device from Hitachi, the
HL7851G, a 50 mW, 785 nm diode laser.
The imaging laser flasher, a Power Technologies IP40C/20/40-10V is controlled with two supply voltages: one
sets the forward current, the other sets the pulse width. These bias voltages are generated with two linear
voltage drivers from an on board 60V DC source. These drivers (U44) integrate until the output voltage equals
SPEC Inc. reserves the right to make improvements and changes to the CPI and related software at any
time and without notice
54
SPEC CPI Preliminary Technical Manual
the control voltage times a constant. The feedback is set on these drivers so the output voltage will never
overdrive the pulse driver. All of the laser controllers’ operating points, for the imaging laser current and pulse
width values, and for the PDS 45 and PDS 90 lasers, are set utilizing a quad 12-bit digital to analog converter
(DAC), U40, controlled by the user through the data system graphical user interface (GUI).
4.2.4 DSP Data Acquisition and Control
The sensor electronics are based on a digital signal processor (DSP) control board that monitors system
temperature, pressure and voltage and controls 18 heat zones. The monitoring and controlling of heat
zones are implemented using the relay board piggy backed on the DSP control board. Additionally, the
control board communicates using standard asynchronous serial data protocol using a pair of RS-422
differential signals (RS-232 optional by board jumpers) with the Data Acquisition System, and implements a
particle detection system using analog and digital electronics.
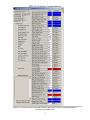
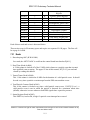
When the data system initially establishes communications with the DSP board, it sends a set time (Table
4.2.4) packet and a set mode packet (Table 4.2.5). The DSP board will subsequently track the time and
observe the commanded temperature set points for turning on heaters, as well as other commanded
parameters, such as minimum transit time limits. See Table 4.2 5 for a full list of set mode parameters.
The DSP board utilizes an Analog Devices ADSP2191 Digital Signal Processor to control and monitor the
probe hardware. This DSP has a bi-directional, high-speed, universal asynchronous receiver transmitter
serial port interfaced to either RS-422 or RS-232 level drivers and receivers, user selected using jumpers
J3, J4, J5, J6 and J7. The jumpers should short pins 1 and 2 (pin one is identified by a square solder pad
on the bottom of the board) for RS-422 interfaces (recommended), or short pins 2 and 3 for RS-232
interfaces. The asynchronous communications lines interface directly to a serial port on the host computer,
receiving commands from the host and transmitting data to it as described below.
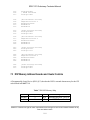
Three types of data packets are currently output from the sensor head (probe) and four types are received.
The transmitted packets are the PDS or PDS with SLS packet that is transmitted when a particle is
detected, and the housekeeping packet (Table 4.2.3) which is transmitted once per second. The format of
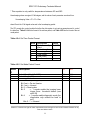
the PDS packet is given in Table 4.2 1. The PDS with SLS packet is found in Table 4.2.2.
Table 4.2.1. PDS packet format.
Word
1
2
3
4
5
6
Description
Packet Sync Word (0x4450)
Packet Length (12)
Packet Type (0x5050)
UTC Seconds of Year (LSW)
UTC Seconds of Year (MSW)
Arrival time - # of 62.5 ms periods into
SPEC Inc. reserves the right to make improvements and changes to the CPI and related software at any
time and without notice
55
SPEC CPI Preliminary Technical Manual
sec
Arrival time - # of 1.3333 us periods
into 16th
Transit time
Particles detected since last PDS
packet
PDS_45 pulse height
PDS_90 pulse height
Checksum
7
8
9
10
11
12
Table 4.2.2. PDS with SLS packet format.
Word
1
2
3
4
5
6
7
8
9
10
11
12-27
28
Description
Packet Sync Word (0x4450)
Packet Length (10)
Packet Type (0x5051)
UTC Seconds of Year (LSW)
UTC Seconds of Year (MSW)
Arrival time - # of 62.5 ms periods into
sec
Arrival time - # of 1.3333 us periods
into 16th
Transit time
Particles detected since last PDS
packet
PDS_45 pulse height
PDS_90 pulse height
SLS pulse heights [16]
Checksum
The PDS packet fields are described below:
1. Packet Sync Word: Used by the data system to detect the beginning of a
packet.
2. Packet Length: The number of words in this packet (12).
3. Packet Type: PDS packet with no SLS system is defined 0x5050
4. UTC LSW: Universal Time Code least significant word. This and word 5, the
most significant word, combine to give the number of seconds since the
beginning of the current year.
5. UTC MSW: Defined in 4.
6. Arrival Time 16ths: Number of 62.5 millisecond periods elapsed into the current
second (see 4 and 5) at which the particle was detected.
SPEC Inc. reserves the right to make improvements and changes to the CPI and related software at any
time and without notice
56
SPEC CPI Preliminary Technical Manual
7. Arrival Time 1.333uS periods: Number of 1.333uS periods into the current 16 th
second (see 6) at which the particle was detected.
8. Transit Time: The number of 20.8333 uS periods during which the particle was
detected by the APD45 and APD90 sensors.
9. Particles Detected Since Last PDS Packet: This number includes the current
imaged particle for which this packet is sent.
10. PDS_45 Pulse Height: 16 bit number representing the maximum detected
voltage for the imaged particle(s) on the APD45: VPK = 5V x (PDS_45 Pulse
Height) x 4096.
11. PDS_90 Pulse Height: 16 bit number representing the maximum detected
voltage for the imaged particle(s) on the APD90: VPK = 5V x (PDS_45 Pulse
Height) x 4096.
12. Checksum: Word by word checksum over the previous 10 words.
A housekeeping packet is built and sent to the data system once per second. Table
4.2.3 lists the format of this packet.
Table 4.2.3. Housekeeping packet format.
Word
1
2
3
4
5
6
7
8
9
10
11
12
13
14
15
16
17
18
Description
C0
Packet Sync (0x4450)
0
Packet Length (51)
0
Packet Type (0x484b)
0
UTC Seconds of Year (LSW)
0
UTC Seconds of Year (MSW)
0
Forward Sample Tube Temp. - 1.8775
C
1.8775
Optics Block A Temp. - C
1.8775
Optics Block B Temp. - C
Central Sample Tube Temp. - 1.8775
C
1.8775
Aft Sample Tube Temp. - C
1.8775
Pylon Slug Temp. - C
1.8775
Pylon Base Patch Temp. - C
1.8775
Porex Drain Tube Temp. - C
1.8775
45 APD Amplifier Temp. - C
1.8775
Power Supply Temp. - C
DSP Card Temp. - C
23.958
PMT Temp - C
23.958
SLS Laser Temp - C
C1
1
1
1
1
1
0.02935559
0.02935559
0.02935559
0.02935559
0.02935559
0.02935559
0.02935559
0.02935559
0.02935559
0.02935559
.0146484 *
.0146484 *
.0146484 *
SPEC Inc. reserves the right to make improvements and changes to the CPI and related software at any
time and without notice
57
SPEC CPI Preliminary Technical Manual
19
20
Inside Air Temp. - C
CCD Camera Temp - C
21
Imaging Laser Temp. - C
23.958
1.8775
0.02935559
.0146484 *
23.958
.0146484 *
23.958
22
PDS_45 Laser Temp. - C
.0146484 *
23.958
23
PDS_90 Laser Temp. - C
24
25
26
27
28
29
PDS_45 Laser Power - mW
PDS_45 Detector DC level
PDS_90 Laser Power - mW
PDS_90 Detector DC level
Imaging Laser Current - Volts
Imaging Laser Pulse Width –
Volts
-5 Volt Supply - Volts
+ 5 Volt Supply - Volts
+ 12 Volt Supply - Volts
- 12 Volt Supply - Volts
Probe Mode (Bit Mapped)
Bit 0 set -> De-ice Heat on
Bit 1 set -> Unused
Bits 2 -> Probe Reset
Bit 3 -> 1 equals enable the
imaging
laser
trigger
timer
threshold feature
(see word 35)
Bit 4 -> 1 equals enable
diagnostic mode
(for diagnostics
only—should be
hard to set).
Bits 5 - 7 -> unused
Bits 8 - 15 = Command #
Heater Status (Bit Mapped, 1 =
on)
Bit 0 -> Forward Sample
Tube
Bit 1 -> Upper Optics Block
Bit 2 -> Lower Optics Block
30
31
32
33
34
35
.0146484 *
23.958
0
0
0
0
35.0
35.0
0.0177557
.00439451
0.0177557
.00439451
0.02050781
0.02050781
0
0
0
0
.00292969
.00292969
.00735352
.00735352
1
0
1
SPEC Inc. reserves the right to make improvements and changes to the CPI and related software at any
time and without notice
58
SPEC CPI Preliminary Technical Manual
Bit 3 -> Central Sample Tube
Bit 4 -> Aft Sample Tube
Bit 5 -> Imaging Lens
Bit 6 -> APD_45 Amplifier
Bit 7 -> APD_90 Amplifier
Bit 8 -> Pylon Cover Patch
Bit 9 -> Pylon Slug
Bit 10 -> Pylon Base Patch
Bit 11 -> Imaging Laser
Bit 12 -> PDS 45 Laser
Bit 13 -> PDS 90 Laser
Bit 14 -> Spare_DC1
Bit 15 -> Camera
36
37
38
39
41
41
42
43
44
45
46
47
48
49
50
51
52
53
54
Number of detected particles
Dead Time - Seconds
PDS45 Laser Power Setpoint –
Mw
PDS45 Threshold Setpoint -V
PDS90 Laser power Setpoint –
mW
PDS90 Threshold Setpoint -V
Imaging laser current control
voltage Setpoint – V
Imaging laser pulse width
control voltage Setpoint - V
Minimum transit time – sec -1
90 APD Amplifier Temp. - C
-REF10/2 (Vref10) - Volts
Pressure Sensor – psi
0
0
0
1
0.000341333
0.0073982
0
0
0.000610352
0.0073982
0
0
0.000610352
0.00642700
0
0.007995605
0
1.8775
0
3.7594
Heater Status 2 (Bit Mapped, 1 0
= on)
Bit 0 -> PMT
Bit 1 -> SLS Laser
Bit2 -> Unused
Bit3 -> Unused
SLS Laser power Setpoint - mW
PMT Voltage
.013736
Pylon Cover Patch
Imaging Lens
1.8775
Laser Trigger Time Threshold
0
Checksum
0
20.83e-9
0.02935559
.001464843
.011014
1
21.7308
0.02935559
20.83e-9
1
SPEC Inc. reserves the right to make improvements and changes to the CPI and related software at any
time and without notice
59
SPEC CPI Preliminary Technical Manual
* This equation is only valid for temperatures between 0C and 50C.
Housekeeping values are signed 16 bit integers, and the values of each parameter are solved from:
Housekeeping Value = C0 + C1 x Raw
where Raw is the 16 bit signed value sent in the housekeeping packet.
The CPI accepts four control packets that allow the data system to set various parameters and to control
the data flow. Table 4.2.4 lists the format of the set time packet, and Table 4.2.5 lists the format of the set
mode packet.
Table 4.2.4. Set Time Packet Format.
Word
1
2
3
4
5
6
Description
Packet
Sync
Word
Packet Length
Packet Type
Time (MSW)
Time (LSW)
Checksum
Value
0x4450
6
0x544d
Table 4.2.5. Set Mode Packet Format.
Word
#
Description
C0
C1
1
2
3
4
Packet Sync Word (0x4450)
Packet Length (26)
Packet Type
Probe Mode (Bit Mapped)
Bit 0 set -> De-ice Heat on
Bit 1 set -> Unused
Bit 2 -> Reset probe
Bit 3
-> 1 equals enable the imaging laser
trigger timer threshold feature (see
word 35)
Bit 4
-> 1 equals enable diagnostic mode (for
diagnostics only—should be hard to
set).
Bits 5 - 7 -> Unused
NA
NA
0x4d44
0
NA
NA
NA
1
SPEC Inc. reserves the right to make improvements and changes to the CPI and related software at any
time and without notice
60
SPEC CPI Preliminary Technical Manual
5
6
7
8
9
10
11
12
13
14
15
16
17
18
19
20
21
22
23
24
25
26
27
Bits 8 - 15 = Command #
Heater Status (Bit Mapped, 1 = on)
Bit 0 -> Forward Sample Tube
Bit 1 -> Upper Optics Block
Bit 2 -> Lower Optics Block
Bit 3 -> Central Sample Tube
Bit 4 -> Aft Sample Tube
Bit 5 -> Imaging Lens
Bit 6 -> APD_45 Amplifier
Bit 7 -> APD_90 Amplifier
Bit 8 -> Pylon Cover Patch
Bit 9 -> Pylon Slug
Bit 10 -> Pylon Base Patch
Bit 11 -> Imaging Laser
Bit 12 -> PDS 45 Laser
Bit 13 -> PDS 90 Laser
Bit 14 -> Spare_DC1
Bit 15 -> Camera
Forward Sample Tube Temperature Set point
Upper Optics Block Temperature Set Point
Lower Optics Block Temperature Set Point
Central Sample Tube Temperature Set Point
Aft Sample Tube Temperature Set Point
Pylon Slug Temperature Set Point
Pylon Base Patch Temperature Set Point
Porex Drain Tube Temperature Set Point
45 APD Amplifier Temperature Set Point
Electronics Temperature Set Point
Imaging Laser Temperature Set Point
PDS_45 Laser Temperature Set Point
PDS_90 Laser Temperature Set Point
PDS_45 Laser Power Set Point
PDS_90 Laser Power Set Point
PDS_45 Threshold Set Point
PDS_90 Threshold Set Point
Imaging Laser Current Voltage
Imaging Laser Pulse Width Voltage
Minimum Transit Time
Heater Status 2 (Bit Mapped, 1 = on)
Bit 0 -> PMT
Bit 1 -> SLS Laser
90 APD Amplifier Temperature Set Point (Unused)
0
1
1.8775
1.8775
1.8775
1.8775
1.8775
1.8775
1.8775
1.8775
1.8775
23.958
23.958
23.958
23.958
0
0
0
0
0
0
0
0
0.02935559
0.02935559
0.02935559
0.02935559
0.02935559
0.02935559
0.02935559
0.02935559
0.02935559
.0146484 *
.0146484 *
.0146484 *
.0146484 *
0.0073982
0.0073982
0.00061035
0.00061035
0.00642700
0.007995605
20.83e-9
1
1.8775
0.02935559
SPEC Inc. reserves the right to make improvements and changes to the CPI and related software at any
time and without notice
61
SPEC CPI Preliminary Technical Manual
28
29
30
31
32
33
34
35
36
Camera Temperature Set Point
PMT Temperature Set Point
SLS Laser Temperature Set Point
SLS Laser Power Set Point
PMT Voltage
Pylon Cover Patch Set Point
Imaging Lens Set Point
Laser Trigger Time Threshold
Bits 0:10 -> Count at which to fire (needs to be
greater than the minimum transit time
(above)
Checksum
23.958
23.958
23.958
Tbd
Tbd
1.8775
1.8775
.0146484 *
.0146484 *
.0146484 *
tbd
tbd
0.02935559
0.02935559
0
20.83e-9
NA
NA
The temperature set points are integers in the range of -2048 to 2047. The power and voltage set points
are in the range of 0 to 4095. In either case, the engineering unit (EU) for a particular parameter is
calculated with the following equation.
EU = C0 + C1 * Set Point
The probe mode is returned in the housekeeping so that bits 8 – 15 of word 4, which contain the command
number, can be used to hold a unique number thereby providing the mechanism for verifying that a set
mode packet has been accepted.
4.2.5
Power Supply Board
See the schematic in Appendix 7.1. This board generates four DC voltages using +28V DC that comes
from the Data Acquisition System. The generated DC Voltages are: +15V, -15V, +7V, and -7V. Many of
these are converted using linear regulators at the DSP board to create the most noise free DC supplies
possible. The DSP board also has an on-board DC/DC converter to generate a 60V signal used in the bias
circuits for the imaging laser, discussed previously.
SPEC Inc. reserves the right to make improvements and changes to the CPI and related software at any
time and without notice
62
SPEC CPI Preliminary Technical Manual
5.0 SOFTWARE DESCRIPTION AND REAL-TIME OPERATION
5.1 Data System Overview
The SPEC CPI data acquisition system (DAS) and its settings are as important to the collection of
high quality data as is the correct operation of the electronics. Were the electronics working
perfectly but the DAS settings adjusted incorrectly, the instrument could go an entire flight
collecting no useful images. Thus, a thorough understanding of the user adjustable operating
parameters is a prerequisite to successful use of the CPI.
The parameters under user control fall into the following categories:
1.
2.
3.
4.
Particle detection system (PDS).
Image collection.
Probe thermal control.
Data acquisition system (DAS) display.
The first two categories affect how particle images are collected. These include items such as
PDS laser power settings and image mean minimums (to be discussed in the next section). The
third category includes the temperature set points of various locations in the probe, as well as
whether or not heaters should be turned on if the temperature is below the set points in those
regions. The fourth category doesn’t affect the operation of the probe; the DAS display parameters
only affect how information is presented to the user.
Each time the CPI DAS program is started, the program retrieves information from the CPI.ini file.
This file contains set points, set point limits, and warning limits for parameters in the first three
categories, as well as other information of use to the program. This file is discussed in the next
section.
Figure 5.1.1 shows the DAS running with an active probe. The very top line tells the user that the
program is running with recording disabled, so no data is written to file. The file name of the
current file that would be written to if recording were active is also displayed here, along with the
DAS time. On the right side of this line are the standard window controls: Hide, Minimize /
Maximize, and Close.
The next line contains the menu items: File, View, Settings, Commands, Window and Help.
SPEC Inc. reserves the right to make improvements and changes to the CPI and related software
at any time and without notice
63
SPEC CPI Preliminary Technical Manual
Figure 5.1.1. Screen shot of data system GUI.
SPEC Inc. reserves the right to make improvements and changes to the CPI and related software at any time and without notice
65
SPEC CPI Preliminary Technical Manual
Next come the control buttons, check boxes, radio buttons and enunciator window items on a quick
access line. From here the user may easily perform operations such as turn on and off the heaters
(De-ice ON check box) or take a background. Users will find all of these commands in various submenus as well, but their location here provides easy access to these commonly accessed
selections. The enunciator window indicates to the user that probe parameters are out of range
(such as temperature readings) or other items that the user should be aware of and possibly take
action on.
The image display section shown in Figure 5.1.1 contains regions of interest (ROIs) cut outs. This
is where particles will be displayed as they are processed by the DAS. The statistics and settings
windows are another set of quick observation and control windows in which the user can view and
control various parameters that are also available in other menus, but are easily accessed here.
The settings window can be opened, (if not currently open), by clicking the “Settings” button on the
quick access line discussed in the previous paragraph. The “Rates and Image Parameters”
window plots various real time parameters to inform the user of probe performance, such as the
displayed frames per second plotted in red, the percent of valid frames in green.
Detailed descriptions of all the data system menus and displays, including the above items, are
given in the following sections. System menu windows will first be generally described, then the
operation of the probe and DAS using the categories of parameters under user control will be
detailed: PDS system, image collection system, probe thermal control and DAS display.
5.1.1 View Menu
Figure 5.1.2. The View drop down menu used for selecting the Housekeeping window.
Figure 5.1.2 shows a screen shot of the View menu. The “Housekeeping” and “Stats Window”
selection items will be discussed in the following sections. The “SPP100 Data”, “Single Board
Computer” and “Serial Data” selections are for customized use and not described in this manual.
SPEC Inc. reserves the right to make improvements and changes to the CPI and related software
at any time and without notice
66
SPEC CPI Preliminary Technical Manual
The other 5 items display or remove windows that will not be described but which the user may
wish to experiment with by selecting and deselecting from this menu.
5.1.1.1 Housekeeping Window
Selecting the first item in the “View” menu opens the housekeeping window shown in Figure 5.1.3.
Here, the user may observe all the measured parameters of the operating probe in one window.
The housekeeping data is used to evaluate the status or “health” of the probe by monitoring such
engineering parameters as internal temperatures, power supply voltages, pylon internal pressure,
etc. Real-time values for laser powers and actively controlled temperature zones are also
contained in the housekeeping data. The right side of the window shows housekeeping
parameters measured in the last second by the probe, e.g. the PDS 45 Laser Power Actual, as well
as current set points used by the probe, e.g. the PDS 45 Laser Power Set (point). The column
labeled “RAW” contains analog to digital (ADC) and digital to analog (DAC) converter values
currently measured or set by the probe and DAS. Using the PDS 45 laser again as an example,
the PDS 45 Laser Power Actual value of 876 seen in Figure 5.1.3 (19th item down) is the result of
an ADC conversion taken in the last second; the PDS 45 Laser Power Set (point) value of 2123
(29th item down) is the current DAC setting, generating a Voltage in an electronic servo loop that
forces the PDS 45 laser to 20.154 mW, as seen in the column labeled “Corrected”.
The “Corrected” column values have units, such as mW and degrees C, and use coefficients from
the cpi.INI file described in Section 5.1.7. Noting that the set and measured raw values for the
PDS 45 laser power are quite different—876 and 2123—but that the corrected values are quite
close—19.938 mW and 20.154 mW respectively—one observes that the set point and observed
coefficients are often different for the same parameter (in this case, the laser power).
On the left side of the housekeeping window is a set of radio buttons labeled “Heater Status”. The
button at the bottom of this section labeled “De-Ice Heat” would be enabled (black) if the heaters
are currently chosen active by the user. If so, the CPI sensor head will turn on heaters if any
region (that is individually enabled—see Section 5.1.2.1) has a measured temperature less than
its set point. If a heater was on during the last second, the sensor head reports that this is the case
and the corresponding radio button will be active (black). In Figure 5.1.2, the De-Ice Heat is off
and thus, correctly, there are no heaters displayed as currently on.
The other reported values on the top left side of the window Include the update rate (set to once
per second in the window); the time reported by the probe when it sent its most recent
housekeeping information, which it does once per second; the command number, which should
increment every time probe operating commands are sent from the DAS to the sensor head (see
Section 5.1.2.1); the laser strobes count, which is the number of times the imaging laser was
flashed in the last second because a particle was detected; and the dead time, which is the sum of
the small windows of time during which the probe was processing a particle and therefore could not
acquire a subsequent particle, if there was one. This sum is taken over a period of one second.
The two radio buttons at the bottom left of the housekeeping window indicate current sensor head
settings for parameters that may be used in the future, but currently should always be off (white),
SPEC Inc. reserves the right to make improvements and changes to the CPI and related software
at any time and without notice
67
SPEC CPI Preliminary Technical Manual
as shown in the Figure 5.1.3. Parameters that do not display any corrected units in the
housekeeping window are not used for that particular version of CPI. Any references to PMT or
SLS powers or set points are only used with CPIs containing a Scattered Light System (SLS).
SPEC Inc. reserves the right to make improvements and changes to the CPI and related software
at any time and without notice
68
SPEC CPI Preliminary Technical Manual
SPEC Inc. reserves the right to make improvements and changes to the CPI and related software
at any time and without notice
70
SPEC CPI Preliminary Technical Manual
Figure 5.1.3. Housekeeping window.
SPEC Inc. reserves the right to make improvements and changes to the CPI and related software
at any time and without notice
71
SPEC CPI Preliminary Technical Manual
5.1.1.2 Stats Window
Selecting “Stats Window” in the “View” menu opens the statistics window shown in Figure 5.1.4.
This window contains a set of parameters of interest to the user.
Figure 5.1.4. Statistics window.
Items in the section of the statistics window labeled “Last Frame” are discussed in Section 5.1.4
covering image collection control and monitoring.
The items in the upper portion of the window are updated at the user selected interval, in seconds
which is the first item in the “Frame, Particle, and Other Rates” section. The user also enters air
speed here in meters per second, for use in deriving parameters such as particle concentrations.
The true air speed has no other function and entering values that do not match the speed of the
craft on which the CPI is located will not affect its operation.
The “Frms Captured”, “Frms Attempted” and “% Valid Frms” fields refer to the number of frames
the DAS has received in the last “Interval” period in which a valid ROI was found, the number of
frames total received in the same period (with and without ROIs), and the percentage of valid
frames, equal to (frames captured / frames attempted) x 100%, respectively. Imaged particles are
the number of ROIs found during the interval. “Particle Conc” is the derived particle concentration
and “ROI Conc” is the derived number of ROIs in the last interval period, given in units of number
per liter. “PDS strobes” is the number of times the PDS system has seen a qualified particle pass
through the sample volume during the interval, and “Average Dead Time” is the time, in seconds,
summed over the interval that the sensor head was busy processing a current particle and thus
unable to image subsequent particles.
SPEC Inc. reserves the right to make improvements and changes to the CPI and related software
at any time and without notice
72
SPEC CPI Preliminary Technical Manual
5.1.2 Settings Menu
The settings menu is shown in Figure 5.1.5 below. The “Probe and Display” selection brings up
the window labeled “Settings” in Figure 5.1.1. The “Settings” window provides easy access to
many parameters that are also found, but with more searching required, in the “housekeeping” and
“advanced control and settings” windows discussed elsewhere.
Figure 5.1.5. The Settings Menu
The “AI Background Settings” and “AI PDS Control Settings” are discussed in Section 5.3. The
“Advanced Control and Settings” selection is discussed next.
5.1.2.1 Advanced Control and Settings Window
Selecting the “Advanced Control and Settings” item in the settings menu of Figure 5.1.5 brings up
the window shown in Figure 5.1.6. The upper section of the window is much like that of the
“housekeeping” window. The set points for various probe parameters are defined in this window by
the user and sent to the probe by hitting the “Apply” button. The left side contains heater enable
radio buttons (instead of status indicators), and the right side has parameter set points (instead of
observed values). For most of the parameters in this window, such as temperature zone set points
and laser powers when the user enters a new value and then hits the “apply” button, a
corresponding change in the housekeeping data will occur as the CPI sensor Digital Signal
Processor (DSP) responds to the new set point values.
Disabling the “De-Ice Heat” radio button (black means it is enabled—as shown, white means it is
disabled) disables temperature controlling at the sensor head. If disabled, no heaters will be
turned on, regardless of the monitored temperature values. If “De-Ice Heat” is enabled, the sensor
head DSP control board (Section 3.1 Figure 3.1.5) will monitor the measured temperatures of the
selectively enabled heat zones—enabled by selecting them with the radio buttons on the left side
of Figure 5.1.6—and if the temperature is below the set point value, turn on a heater in the
appropriate sensor head zone. The set points for heaters (and other parameters) are located on
the right side of the “Advanced Control and Settings” window, with the “Corrected” and “Raw”
column labels having the same meaning as previously described for the housekeeping window. By
selecting one of the displayed values, such as the “Forward Sample Tube Temp” on the first line,
right side, a user can adjust the set point in two ways. First, one can type in a new number (either
raw or corrected—the corresponding value in the other field will change). Second, once a field is
highlighted, one may use the slider bar located immediately right of the “Raw” column to adjust the
values.
SPEC Inc. reserves the right to make improvements and changes to the CPI and related software
at any time and without notice
73
SPEC CPI Preliminary Technical Manual
SPEC Inc. reserves the right to make improvements and changes to the CPI and related software
at any time and without notice
74
SPEC CPI Preliminary Technical Manual
Figure 5.1.6. The Advanced Control and Settings Window.
Adjusting the slider bar has the benefit of only allowing the user to choose set point values that are
within the allowed limits as set in the cpi.INI file, discussed in section 5.1.7. If manually entering
values via the first option, a user-entered number may exceed the allowed limits, generating an
error window and requiring the user to try another value.
Focusing again on the left side of the window, a check box labeled “Recording Disabled” is visible,
checked in the Figure 5.1.6. If checked, the data system will not record any activity. All
housekeeping, image and PDS information received by the DAS will be visible to the user
via the GUI, but no data will be recorded. If recording is disabled, the user is warned via a red
enunciator in the main window, as seen in Figure 5.1.1.
The “Drive For Next File” selection tool, located mid to lower left in the window, allows the user to
choose to which storage drive the data files should go on the DAS computer. The “Drive Count”
selection tool allows multiple drives to be used for data recording after the initial drive is full.
The “Enable Cycling of Settings”, “Image Laser Trig Timer Thresh” and “Diagnostic Mode”
radio buttons, located in the lower left of the window, are under development and should
always be left disabled, as shown.
The “Apply” button is context sensitive: if the probe and DAS are not communicating, it will read,
“Apply and Acquire”. Regardless of what is displayed on the button, if a change is made to any
of the settings in this window, the “Apply” button must be clicked to make the changes
active.
Clicking on the “Stop Acquisition” button is the same as clicking the “Stop Probe” button located in
the main screen; both will stop communications with the sensor head. However, if power is
maintained to the sensor head, the last commanded settings will continue to be observed and the
probe will continue operating. The DAS will ignore any communications and the GUI will not
update with housekeeping or image data.
The “Restore Defaults” button retrieves all the saved settings from a default file called
cpi_restore_defaults.INI, located in the same directory as the cpi.INI file.
The
cpi_restore_defaults.INI file matches the cpi.INI file when the CPI is originally configured. Users
should customize the cpi.INI file to have temperature set-points and alarm limits appropriate for the
operating environment of that particular instrument (see Section 5.1.7) Users are encouraged to
store a copy of the customized cpi.INI file with safe settings (such as a large PDS threshold value,
described later) as the cpi_restore_defaults.INI file for quick restoration of safe operating
parameters for the CPI system.
The rest of the parameters in the window will be discussed in the sections covering the PDS and
Image Control systems. Parameters that are greyed out or do not display any corrected units in
this window are not used for this particular version of CPI. Any references to PMT or SLS powers
or set points are only used with CPIs containing a Scattered Light System (SLS).
SPEC Inc. reserves the right to make improvements and changes to the CPI and related software
at any time and without notice
75
SPEC CPI Preliminary Technical Manual
5.1.3 Particle Detection System Control and Monitoring
The upper left section of Figure 1.1.2 of the “General Description” section 1.1 of this manual
shows the major components of the PDS system: lasers, dump spots and detectors. The user
adjustable parameters for the PDS system are as follows:
1.
2.
3.
4.
5.
6.
7.
PDS 45 laser power.
PDS 90 laser power.
PDS 45 detector DC level (feedback -dependent on PDS 45 laser power).
PDS 90 detector DC level (feedback –dependent on PDS 90 laser power).
PDS 45 threshold Voltage.
PDS 90 threshold Voltage.
PDS minimum transit time.
These items are easily accessed via the Settings window, labeled and displayed in the full DAS
image, Figure 5.1.1. To observe and change items 1 through 4 click on the “Lasers” tab on the
upper right of the Settings window, shown in Figure 5.1.7. Items 5 through 7 are easily accessed
via the “Probe” tab of the “Settings” window shown in Figure 5.1.8.
5.1.3.1
PDS Laser Power and DC Level
The PDS settings and monitors are contained within the boxes labeled PDS 45 and PDS 90. The
PDS 45 laser power set point is controlled using the slider bar shown in Figure 5.1.7 with value
2123. As the slider is adjusted, the raw number is incremented and decremented. This value is a
set point sent to the sensor head DSP board (See Section 3, Figure 3.1.5) which applies this
value to a digital to analog converter (DAC), with its output setting the desired PDS 45 laser power.
The laser power set point is given in units of milliWatts (mW) and is updated as the slider is moved.
SPEC Inc. reserves the right to make improvements and changes to the CPI and related software
at any time and without notice
76
SPEC CPI Preliminary Technical Manual
Figure 5.1.7. Lasers tab of the Settings window.
Once the desired set point is chosen with the slider, the user must click the “APPLY” button for the
new setting to be sent to the sensor head. If “APPLY” is not clicked, any changes to the
settings in this window will not be implemented on the sensor head.
The detector DC level has units of Voltage. It indicates the steady state average of the PDS
detector outputs. The PDS detector has an output voltage maximum of approximately 9.6V, and
the DC level must be below this to provide dynamic range for the detector to respond to incoming
particles. The DC level, during periods when no particles are being detected for a second or more,
is an indication of how much light from the laser is making its way past the dump spot and on to the
PDS detector. If the detector DC level goes above 8.8V, there is not enough dynamic range
for the PDS system to sense a particle and the system may not record particle images, even
though particles may be present. In this case, the enunciator indicators will flash red and
indicate that the PDS 45 or PDS 90 detector DC level is out of range. The user should decrease
the associated laser power to get the DC level to below 8.8V.
SPEC Inc. reserves the right to make improvements and changes to the CPI and related software
at any time and without notice
77
SPEC CPI Preliminary Technical Manual
5.1.3.2 PDS Threshold Control
The PDS 45 and PDS 90 thresholds are easily monitored in the “Probe” tab of the Settings window,
shown in Figure 5.1.8.
Figure 5.1.8. Probe tab of the Settings window.
To understand the threshold setting, refer back to Figure 1.1.2 of the general overview section of
this manual. In that figure the waveforms of the PDS detector are shown. The PDS threshold,
shown in blue, is a DC Voltage applied to a comparator whose other input is an AC coupled
version of the PDS detector output (either the PDS 45 or PDS 90 detector). The threshold
Voltage must be set greater than the highest value of the AC coupled signal, which has a
varying value due to a random noise component. During airborne operation, the lowest
practical threshold value is approximately 200-400 digital counts, depending on the noise
environment. If the threshold is set such that the AC coupled signal may exceed it due to the
noise, and if both the PDS 45 and PDS 90 channels experience such a threshold exceeding event
SPEC Inc. reserves the right to make improvements and changes to the CPI and related software
at any time and without notice
78
SPEC CPI Preliminary Technical Manual
at the same time, a false PDS event will occur and the imaging laser will be fired, even though no
particle is present. Another possibility is that of setting the threshold so low that the AC coupled
PDS signal always exceeds the threshold, in which case the probe will never respond to particles
and the imaging laser will never fire.
From the above paragraph’s description of the PDS threshold, it is apparent that setting the
threshold too low can cause the probe to operate incorrectly. Setting the threshold too high can
also have negative effects on probe functionality. The higher the threshold is set, the more light a
particle must scatter in order to exceed the PDS threshold. For example, if the PDS threshold—the
blue line—in Figure 1.1.3 of the General Description Section 1 of this manual were set greater
than the peak that occurs in the figure’s red line—the AC coupled PDS output—the probe would
not recognize that a particle had passed through the sample volume, and no image of the particle
would be produced.
Because the user is not able to see a waveform of the AC coupled signal and threshold Voltage
applied to the detector circuit comparator, such as those shown in Figure 1.1.3, the user must
become familiar with the effects on the probe of changing the PDS laser power and the PDS
thresholds. Some other monitored values provide useful information in assessing these effects,
such as the percentage of valid frames, which is shown in the histogram window of Figure 5.1.1.
A high percent valid is an indicator that a large percentage of the images captured by the sensor
head camera contain in-focus particles. The possible problem with a high percentage valid,
however, is that the threshold may be set so high that only large particles scatter enough light to
cause the PDS threshold to be exceeded, thus discriminating against small particles. Again, this
points to the necessity of users familiarizing themselves with the operation of their probe in
a laboratory environment prior to engaging in flight operations. Monitoring the threshold
Voltage and the AC coupled PDS signal to the comparator is possible in a laboratory environment
using an oscilloscope and reading the Detailed Description of Electronics, Section 4.2.
Another option during flight (and in the lab) is to use the artificial intelligence (AI) PDS DC level and
threshold adjustment algorithms discussed in Section 5.3. The AI algorithm has been successfully
used during flights of the original CPI (not the one for which this manual was written, but which has
very similar operational parameters) in which there was no user control of the CPI. The AI code
successfully optimized the settings of the PDS system on every flight and is an option users may
prefer even during flights in which an operator is present. Reading how the AI control works will
also provide insight into how to optimize the PDS settings.
5.1.3.3 PDS Minimum Transit Time Control
The minimum transit time is programmable and is the amount of time a particle passing through the
sample volume must cause both the PDS 45 and PDS 90 comparators to go high for the PDS logic
to recognize the particle as valid. See the electronics description in Section 4.2 and Figure 5.1.8
for more information. The “Raw” value for the transit time is entered in the “Advanced Control and
Settings” window of Figure 5.1.6 in the “Minimum Transit Time Setpoint” field. Alternatively, the
corrected time may be entered in the “Settings” window, choosing the “Probe” tab, shown in Figure
SPEC Inc. reserves the right to make improvements and changes to the CPI and related software
at any time and without notice
79
SPEC CPI Preliminary Technical Manual
5.1.8. The time is in units of 20.833 x 10⁻⁹ seconds (1 / 48 MHz) times the raw value. The display
of the corrected values attempts to display the value in scientific notation; however the exponent is
often not viewable. In the Advanced control and settings window (Figure 5.1.6), a raw value of
about 35 counts is a practical value for operation. Setting this value too high will prevent
the CPI from triggering on smaller particles.
5.1.4 Image Collection Control and Monitoring
The image processing performed by the DAS is critical in achieving maximum probe performance.
Just as poor settings in the PDS system can cause the probe to receive no images, so can poor
settings in the image processing setup parameters cause the probe to process no images, even in
the presence of high concentrations of particles.
The DAS takes several steps in order to process images. First it takes a background image: a
frame from the CCD camera with no particles present. Then, when received camera frames
arrive—which happens approximately 72 times per second—the DAS checks the PDS Status bit to
see if the imaging laser was fired during this frame’s exposure period. If it was, the DAS subtracts
the frame from the stored background image (pixel by pixel subtraction), and performs a search
algorithm to determine if a particle or particles is/are present in the frame and cutting it/them out
into ROIs.
The parameters affecting this process are discussed in the next sections.
5.1.4.1 Background Images and Parameters
Two parameters define the recognition of a particle within a frame: particle threshold and minimum
size (pixels). The role of these parameters will first be discussed in explaining how a background
image is taken.
SPEC Inc. reserves the right to make improvements and changes to the CPI and related software
at any time and without notice
80
SPEC CPI Preliminary Technical Manual
Figure 5.1.9. Representation of two 7 x 7 CCD camera images.
When the DAS is ready to take a background, it waits until there are fewer than “Strobes
Threshold” image frames per second that have an associated PDS STATUS bit high (See Section
1.1). The PDS STATUS bit indicates the presence of sensed particles. When there are fewer than
“Strobes Threshold” image frames per second that have an associated PDS STATUS bit high a
signal called EXTRIG from the frame grabber, under DAS control, is pulsed once per image frame
period, forcing the digital logic system on the sensor head to fire the imaging laser. Two frames
are thus generated, a depiction of which is shown in Figure 5.1.9. The two image examples are
only 7 x 7 pixels, but the actual CCD camera sends over 1024 x 1024 pixel images—though the
camera is capable of 1280 x 1024. To check for a valid background image (the camera will use
IMAGE 1 as the background if the process qualifies it), the DAS performs a bit by bit subtraction of
the two images. The result is shown in Figure 5.1.10.
SPEC Inc. reserves the right to make improvements and changes to the CPI and related software
at any time and without notice
81
SPEC CPI Preliminary Technical Manual
Figure 5.1.10. Result of background subtraction applied to images of Figure 5.1.9.
The DAS now checks each pixel value in the subtracted image to see if it is greater than the
current “Particle Threshold” value divided by three (backgrounds are more strictly tested than when
testing for particles, described later). Thus, if the particle threshold were set to 15 by the user, the
corner pixels, with value of 5, would meet or exceed the 15 / 3 = 5 threshold used for backgrounds.
In that case the DAS would check to see if there are equal to or greater than the “Minimum Pixel
Size” number of pixels collocated that meet or exceed the pixel threshold just described. If the
minimum pixel size were set to three, then the above attempt at a background would fail. In that
case, the DAS would generate two more EXTRIG signals and perform the background test
algorithm just described on two new images. However, if either the particle threshold were raised
to 16 or greater, or the minimum pixel size were raised to 4 or greater, the above two images would
be considered a valid background. Two realistic values for these parameters are 36 for the particle
threshold and 4 for the minimum pixel size. Using these values, IMAGE 1 would possibly be
accepted as a valid background.
Once it is determined there are no particles in the potential background image, the average of the
pixel values is taken. For IMAGE 1, the value would be 118.8. This value is then compared with
an acceptable range entered by the user: “Min Img Mean” and “Max Img Mean”. Figure 5.1.11
shows these parameters entered in the “Advanced Control and Settings Panel”. The values 2 and
255 shown in the figure are not a normal range, as it allows almost any image to be accepted since
each pixel has a value range of 0 to 255; usually the minimum value is on the order of 70 and the
maximum value on the order of 180. If such were the range, our IMAGE 1 mean of 118.8 would be
acceptable, and IMAGE 1 would be stored as the current background.
Background images are taken almost immediately after the probe is started. No particle images
are processed until a valid background is acquired, apparent to the user via a green enunciator
SPEC Inc. reserves the right to make improvements and changes to the CPI and related software
at any time and without notice
82
SPEC CPI Preliminary Technical Manual
declaring “Background Valid” as seen in Figure 5.1.1. The probe also takes backgrounds at
regular intervals, the period of which is set by the user. If the DAS fails to get a valid background in
a reasonable amount of time, the enunciator panel displays a red warning of “Background Failed”.
If the DAS has just started communicating with the sensor head, too many repeated failed attempts
to acquire a background will cause the program to stop communications with the sensor head.
These failures and others, and their solutions, will be explained in “Real Time Operation and
Troubleshooting”, Section 5.2.
Changing Particle Threshold, Minimum Pixel Size, Strobes Threshold, Minimum and
Maximum Image Mean, and Background Rate
All of these parameters except Minimum and Maximum Image Mean are readily changed in the
“Probe” tab of the “Settings” window, shown in Figure 5.1.8. All of these parameters are located in
the “Advanced Control and Settings” window, located at bottom center. A cut out of the image
control section of the “Advanced Control and Settings” window is shown in Figure 5.1.11. Note
that the “Strobes Threshold” of Figure 5.1.8 is labeled “Max PDS Rate” in the “Advanced Control
and Settings” window; they are the same parameter.
Remember that changes to the parameters are not active until the “Apply” button is clicked,
whether in the “Settings” or the “Advanced Control and Settings” windows.
Figure 5.1.11. Image processing control section of the Advanced Control and Settings window.
5.1.4.2 Particle Collection and Associated Controls
The process of searching for particles in an image frame that arrives with a concurrent PDS
STATUS bit value of one, indicating the imaging laser was fired due to the presence of a particle, is
much like the process for acquiring a background image. The new image is subtracted from the
background image and the difference image, referred to as a background subtracted image, is
searched for pixels below the particle threshold. An example of the background image (IMAGE 1
SPEC Inc. reserves the right to make improvements and changes to the CPI and related software
at any time and without notice
83
SPEC CPI Preliminary Technical Manual
taken from Figure 5.1.9), and an image with a potential particle are shown in Figure 5.1.12.
Figure 5.1.13 shows the background subtracted image.
Figure 5.1.12. Background image and new CCD camera image for particle extraction example.
Figure 5.1.13. Result of background subtraction on images of Figure 5.1.12.
The DAS looks through the background subtracted image and compares the values, such as those
shown in Figure 5.1.13, with the particle threshold parameter. With the particle threshold at 40,
only four pixels in the image are considered as shadowed due to a particle. If the particle threshold
were lowered to 38, the DAS would recognize eight shadowed pixels. The number of collocated
SPEC Inc. reserves the right to make improvements and changes to the CPI and related software
at any time and without notice
84
SPEC CPI Preliminary Technical Manual
pixels is then compared to the minimum pixel size parameter. The value of four for this parameter
means that this particle is accepted as an ROI and stored (if recording is enabled) to the current
data file.
Other parameters under user control affect how a recognized ROI is stored. The “ROI X Pad” and
“ROI Y Pad” fields, both set to 6 in Figure 5.1.11, tell the DAS to include six pixels to the left and
right and six pixels above and below a rectangle that encompasses all recognized shadow pixels
(as described in the previous paragraph) when saving the ROI image to file.
5.1.4.3
Image and Background Mean Settings
Because the CCD camera’s active area is unlit, except by the flash of the imaging laser, it is the
total incident light energy of this pulse that must be adjusted to change the image brightness and
mean. This is important, because if an image is too bright or too dark, it may not respond linearly
to the occultation of the laser by passing particles, and sensed particles may not be correctly
imaged.
How many Joules of light energy reach the camera are set by changing two imaging laser
parameters: “Laser Current Setpoint” and “Pulse Width Setpoint”, as accessed via the “Laser” tab
of the “Settings” window shown in Figure 5.1.7. These parameters are also accessed in the
“Advanced Control and Settings” window on the right side, found in Figure 5.1.6. Generally, the
DAS is set to run the imaging laser current at a safe maximum when the CPI is
manufactured, and users should need change only the laser pulse width. The laser power is
approximately constant, but for a duration controlled by the “Pulse Width Set Point” parameter.
The parameter is given in Voltage units, but the maximum Voltage corresponds to approximately
40 nS (this varies slightly from instrument to instrument). Setting a lower applied Voltage
decreases the time the laser is on when it pulses, thus lowering the amount of light energy to the
CCD camera, and lowering the image mean.
5.1.4.4 LIVE VIDEO MODE
To adjust the image mean in real time, the user can check the “Live Video On” check box shown in
the upper left of Figure 5.1.1, in the main screen. It is best to run live video with recording
disabled, as approximately 72 full images of approximately 1 Megabyte size each per
second will be saved to hard disk if recording is active. Live Video Mode is very useful for
troubleshooting any image system problems. Once live video is turned on, the image display will
look like Figure 5.1.13. A full frame (1024 x 1024) image of the entire CCD camera (though for
most CRT and LCD computer monitors, only a fraction of the total image may be seen; move the
scroll bars for the image display area to view different portions of the CCD image) will be displayed.
A red “Live Video On” message will display in the enunciator panel to indicate live video has been
selected. The Rates and Image Parameters window (see Section 5.1.1) will show the attempted
frames per second at 72 and the % valid images at 100%. The values in the rates and image
parameters window will update at the selected update interval. The setting of this interval is
discussed in Section 5.1.6.2.
SPEC Inc. reserves the right to make improvements and changes to the CPI and related software
at any time and without notice
85
SPEC CPI Preliminary Technical Manual
The image mean will be updated in real time in the “Img Mean” field of the “Statistics” window of
Figure 5.1.13. While running live video, adjustment of the imaging laser current pulse width
remember to click the “Apply” button) will change the image brightness displayed and reported.
Once the image mean is at a desirable value—e.g. somewhere between 100 and 150, though this
is different for each probe—turn off live video by unchecking the “Live Video” box. A new
background should be taken immediately after any changes are made to the imaging laser
set points. If not, the background subtraction will now have a large offset due to the changed
image mean, causing the particle processing algorithm to work poorly or not at all.
Figure 5.1.13. Main GUI window and Rates and Image parameters window in Live Video mode.
5.1.5 Probe Sensor Head Thermal Control
The probe sensor head has 12 temperature zones it controls, all with set point controls in the
“Advanced Control and Settings” window of Figure 5.1.6. The name for the 12 heat zones is given
here for reference:
SPEC Inc. reserves the right to make improvements and changes to the CPI and related software
at any time and without notice
86
SPEC CPI Preliminary Technical Manual
1.
2.
3.
4.
5.
6.
7.
8.
9.
10.
11.
12.
Forward Sample Tube
Optical Block A
Optical Block B
Central Sample Tube
Aft Sample Tube
Pylon Slug
Pylon Base Patch
APD Amplifiers
Electronics – monitor only, no control
Imaging Laser
PDS 45 laser
PDS 90 laser
Currently there is no heater for the electronics (item 9), but all the others are controlled as
described in Sections 5.1.1.1 Housekeeping Window and 5.1.2.1 Advanced Control and
Settings Window. The physical description of the heat zones is given in the SPI Sensor Head –
Physical Description Section 3.1. Pictures, diagrams and descriptions in that section provide an
understanding of where the 12 controlled heat zones in this list exist on the sensor head. Other
temperatures are also monitored, but not controlled, such as at the CCD camera. Here, no
associated heater is used to maintain a minimum temperature.
Warning! Running the instrument in the pylon for extended periods at room temperature (20C) or
above results in excessive self- heating. With De-ice heat off, it is still possible for the internal
temperature of the sensor head to become overly warm. Shut down the instrument, including
instrument power, if the Power supply board or DSP temperature exceed 45C.
5.1.6 Display Options
Aside from the displays previously discussed, some derived parameters, size histograms, and
ways of looking at and storing particle images are available to the user.
5.1.6.1 Rates and Image Parameters
Some of these were discussed in Section 1 and seen in Figure 5.1.1. More are available to the
user via the “Settings” window in the “Plots” tab, shown in Figure 5.1.14.
SPEC Inc. reserves the right to make improvements and changes to the CPI and related software
at any time and without notice
87
SPEC CPI Preliminary Technical Manual
Figure 5.1.14. Plots tab of the Settings window for selecting items to display in the Rates and
Image Parameters plot.
A short description of each item available for plotting follows:
1. Frames Captured: The number of frames in which the DAS found particles and cut out
ROIs.
2. Frames Attempted: The number of frames the DAS searched for particles due to
correlated PDS STATUS having value of one.
3. %Valid Frames: Frames Captured / Frames Attempted x 100%
4. Imaged Particles: The number of ROIs cut out from searched image frames.
5. Particle Concentration: An estimate of the number of particles per liter based on the air
speed ROI Concentration: TBD
6. PDS Strobes: Total number of transit time qualified particles sensed.
7. Laser Strobes: The number of times the imaging laser was fired in an attempt to image a
sensed particle.
8. Image Mean: The mean of the last processed frame.
9. Transit Time: Interval during which the particle was in both PDS beams.
SPEC Inc. reserves the right to make improvements and changes to the CPI and related software
at any time and without notice
88
SPEC CPI Preliminary Technical Manual
10. Missed PDS: TBD
11. Imaged Particles: The number of ROIs found in the last processed frame.
5.1.6.2 Displays, Histograms and ROI X/Y Plots
The last tab available in the “Settings Window” is the “Disp/Hist” tab shown in Figure 5.1.15.
Under the label “Layout”, the number of columns and rows for displaying particle images is
selected. Shown in Figure 5.1.15 is Cols = 5 and Rows = 4. This corresponds to the number of
available ROI display boxes in the “Image Display” section of Figure 5.1.1. Each box will display a
single ROI when particles are successfully imaged. When changing the number of columns and
rows, the size of the ROI display boxes is changed in the “DX” and “DY” fields, corresponding to
the size of an image (in microns) that will fit in the ROI box. Not all DX and DY values will work for
a given set of column and row numbers, so experimentation is required.
Figure 5.1.15. Disp/Hist tab of the Settings window.
A close up of eight ROI display boxes is shown in Figure 5.1.16. Beneath each ROI box is the x
and y location on the CCD in pixels of the ROI, the total size of the ROI in the box in microns,
including the pad (not the total size displayed, which is DX and DY above), and the time the ROI
was captured. If more than one ROI is captured in a single frame, ROI display boxes will be
SPEC Inc. reserves the right to make improvements and changes to the CPI and related software
at any time and without notice
89
SPEC CPI Preliminary Technical Manual
plotted one after the other with the x and y location, total size of the ROI, and the time displayed in
the same color descriptions to give the user a visual cue that this has occurred. The color of each
sequential frame alternates. In the example of Figure 5.1.16, some displayed ROIs are portions of
a background, as identified by the reported “Bkg:” information, otherwise the frame number is
displayed. Skips in the frame number are a result of no ROI’s found in the frames skipped.
Figure 5.1.16. Close up of ROI display boxes.
The second set of controls in Figure 5.1.15 are for the “Particle Size Histogram” display. The
histogram plots the number of particles in a given size bin against a number of size bins chosen by
the user, as seen in Figure 5.1.17. If the “Plot it” box is checked, the histogram will activate the
first time a ROI is found. The particle size range and the number of bins are entered in the
“Settings” “Disp/Hist” window in the “Min” and “Max” size bin text boxes and in the “Bins” selection
box.
SPEC Inc. reserves the right to make improvements and changes to the CPI and related software
at any time and without notice
90
SPEC CPI Preliminary Technical Manual
Figure 5.1.17. The particle histogram plot used to size particles in real time.
The histogram plot uses two colors, red and green, in plotting. The two are plotted alternately in
order to contrast current measurements with past measurements. Two other parameters in Figure
5.1.15, “Interval” and “Update”, affect how often the current color is updated (update) and for how
long each color is plotted (interval). For example, if update is 1 sec, and interval is 5 sec, every 1
sec the histogram will update and every 5 sec the counting will alternate between green and red. If
update is 5 sec and interval is 20, there will be 4 updates between red and green changing.
To remove the histogram display, either click on the minimize button in the upper right of the
histogram window, or uncheck the “Plot it” box in the “Settings” window.
The last plot of interest shows the location of detected particle ROI locations, shown in Figure
5.1.18. Each ROI’s top left corner and lower right corner are plotted, in red and green,
respectively, against x and y pixel coordinates of the CCD camera. Thus each axis range is 1
to1024. This plot provides a visual means of identifying how uniformly the PDS system detects
particles in the sample volume. If the ROI locations become biased to one side of this plot, there is
likely a problem with the PDS electro-optical system.
SPEC Inc. reserves the right to make improvements and changes to the CPI and related software
at any time and without notice
91
SPEC CPI Preliminary Technical Manual
Figure 5.1.18. ROI x, y location plot.
To enable the ROI x, y plot, check the “Plot it” box in the “ROI X/Y Plot” section of the “Disp/Hist”
tab of the “Settings” window of Figure 5.1.15. The plot will open when the first ROI is found in an
image after checking the “Plot it” box. The plot will continue adding red and green markers with
each ROI until the “Max ROIs in Plot” number of ROIs is displayed. If “Reset Plot When Filled” box
is checked, the plot will be cleared and begin updating again as if just opened. If not checked, the
plot will stop updating once the maximum number of ROIs is plotted.
5.1.7 cpi.INI File Description
The cpi.INI file is opened and its information used each time the CPI.exe program is started.
Additionally, information is recorded into this file each time the CPI.exe program is stopped by the
user, reflecting changes in operation parameters since the program was started.
WARNING! The format of the cpi.INI file is critical. Manipulation of the file manually, though sometimes necessary, must be performed carefully. Incorrect format of the cpi.INI file can cause the
DAS program to fail to communicate correctly with the probe or even to start. Therefore, always
back up the cpi.INI file before making changes.
SPEC Inc. reserves the right to make improvements and changes to the CPI and related software
at any time and without notice
92
SPEC CPI Preliminary Technical Manual
The cpi.INI file is located in the c:\winnt\ directory. Editing may be done using the Windows
Notepad program. A copy of a sample cpi.INI file is included in appendix Section 7.3, and has
line numbers added for reference that are not in the standard cpi.INI file. These are for
reference only and should not be added to the actual file! The cpi.INI file records the set point
value of all parameters accessed from the CPI.exe program. Most changes to the cpi.INI file occur
when the user adjusts a parameter (eg, in Advanced control and settings window) during real time
operation and then stops data acquisition by hitting the “stop probe” button and exits the program.
Some parameters in the cpi.INI file, however, must be changed within the file directly, and will be
carefully discussed below.
The cpi.INI file is separated into sections, each delimited by brackets. For example, on line 1,
[System] indicates to the DAS program that it will find information related to the current system
here. The parameters under [System] come factory configured and should not be changed
by the user.
Likewise, the parameters under the next heading, [ROI Parameters], should not be changed
directly using a text editor such as Notepad. Some of these parameters are manipulated by the
user from within the CPI.exe program, but will be explained in following sections that describe the
DAS graphical user interface (GUI).
Next comes the [Probe Settings] heading. This section contains the first parameters a user may
need to change directly. For example, on lines 26 and 27 the cpi.INI file contains the following:
Note that the semicolon indicates that the information on line 26 is for the user’s information only;
the DAS does not do anything with it. Line 26 tells the user that the next line contains the
temperature set point for the Forward Sample Tube. The three numbers, from left to right are:
1. The current set point.
2. The lower limit of the set point.
3. The upper limit of the set point.
The current set point value is written to the file every time the CPI.exe program is shutdown by the
user. The lower and upper limits set the acceptable set point range for the particular parameter.
These limits serve as the slider limits in the “advanced control and settings” window. If a value is
manually typed in that is not within range, an error message will appear “Probe set point out of
range”. The only numbers the user may need to change from within a text editor are items 2 and 3.
SPEC Inc. reserves the right to make improvements and changes to the CPI and related software
at any time and without notice
93
SPEC CPI Preliminary Technical Manual
Item 1 is automatically changed from within the CPI.exe program, so should not be manipulated
here. The value of these three items is given in analog to digital conversion (ADC) raw
numbers; they are not actual engineering units. Understanding how to interpret and set these
numbers requires looking further into the file.
The next section of the file, with heading [Gains/Offsets for Readings], contains on lines 116 and
117:
Again note that the semicolon indicates that the information on line 116 is for the users information
only; the DAS does not do anything with it. The next line contains values described from left to
right:
1.
2.
3.
4.
Gain
Offset
Lower Alarm Limit
Upper Alarm Limit
The gain and offset are applied to measured Analog to Digital Converter (ADC) values. For
example, if the ADC is read for the Forward Sample Tube and is determined to be 800, the
temperature in degrees Centigrade would be found:
Forward Sample Tube Temp = ADC x Gain + Offset
Forward Sample Tube Temp = 800 x 0.029356 + 1.8775
Forward Sample Tube Temp = 25.36 C.
The alarm limits are given in engineering units (degrees Centigrade in this case) and tell the DAS
that if the derived temperature is less than 10 or greater than 35 degrees Centigrade for the
Forward Sample Tube, flash a blue (if less than lower limit) or red (if greater than upper limit) alarm
in the housekeeping window. A yellow “invalid temperature” light will also appear in the enunciator
panel (see red enunciator windows near the top of Figure 5.1.1).
Returning to lines 26 and 27 of the cp.INI file, note that items 2 and 3 are limits given in ADC
values. For the given values of 0 and 957, the Forward Sample Tube temperature set point has
the range:
Upper = 957 x 0.029356 + 1.8775 = 29.97 C.
Lower = 0 x 0.029356 + 1.8775 = 1.8775 C.
SPEC Inc. reserves the right to make improvements and changes to the CPI and related software
at any time and without notice
94
SPEC CPI Preliminary Technical Manual
The effect of these settings is such that, from within the CPI.exe program, users may change the
Forward Sample Tube set point to be any value from 1.8775 to 29.97 degrees centigrade. If the
probe reports back any temperature below 10 degrees C or above 35 degrees C, the DAS should
display warning enunciator indicators to the user.
Other parameters may be changed that have different units, such as Volts or milliWatts, but the
procedure is the same. To determine the units, find the parameter in the housekeeping window.
For example the PDS45 Laser Power is reported with units of mW (milliWatts). The settings for
this, on line 66 of the cpi.INI file, are again given in ADC values:
Setting14=4095 0 4095
And the reported limits on line 171—
Gain/Offset19= 0.0246752 -1.6774 15.000000 41.000000
–are 15 and 41 mW, upper and lower, respectively.
The settings and gains/offsets all have a descriptive line of text above them indicating which
physical parameter the values correspond to. Other than the settings limits and alarm limits, the
user should not manipulate anything in the cpi.INI file. The limits are set to reasonable values by
SPEC before shipping the CPI and data system; however some changes to these values may be
appropriate depending on operating conditions (See Section 5.1.7.1)
Finally, a few setting limits and gain/offset limit values are set at the factory and should not
be changed: They are:
1.
2.
3.
4.
Imaging laser current set voltage.
Imaging laser pulse width set voltage.
Imaging Laser Current Set Point.
Imaging Laser Pulse Width Set Point.
5.1.7.1 Enunciator Panel
The purpose of the enunciator panel is to alert CPI operators to potential instrument problems.
Figure 5.1.19 shows the enunciator panel that is located at the top of main real time operation
window in Figure 5.1.1. Ideally, the user sees a “clean” panel during normal operation. That is,
only a green “background valid” light is present. The other lights alert the user to some problem
conditions for normal operation. “Recording Disabled” tells the user that no data is currently being
recorded. “Live Video On” tells the user that the probe is in Live Video Mode. “4 Invalid
Temperatures” tells the user that four different temperatures are beyond their alarm limits.
SPEC Inc. reserves the right to make improvements and changes to the CPI and related software
at any time and without notice
95
SPEC CPI Preliminary Technical Manual
Figure 5.1.19. Enunciator Panel lights
Any light other than “Background Valid” should prompt the user to further investigate the problem
or take corrective action. “Live Video On” can be corrected by clicking off the Live Video checkbox
in the main Real Time Operation Window Figure 5.1.1. “Recording Disabled” can be corrected by
clicking on the Record Data Checkbox in the main operators window. Messages such as “invalid
temperature”, “power supply out of range”, “PDS detector invalid” require the user to look at the
housekeeping window to further diagnose the problem. Figure 5.1.20 shows a portion of the
housekeeping window with two parameters out of range. One parameter is turned blue because it
is below the lower alarm limit and another parameter is red because it is above the upper alarm
limit.
SPEC Inc. reserves the right to make improvements and changes to the CPI and related software
at any time and without notice
96
SPEC CPI Preliminary Technical Manual
Figure 5.1.20. Section of HouseKeeping window showing out of range parameters.
Provided the alarm limits have been set to reasonable values, these out of range parameters
indicate a problem. The “pylon cover patch” heater may not be selected on, for instance, in the
advanced control and settings window. If the user enables this heater, the pylon cover patch
temperature should increase and the blue alarm should go away. If the heater is already enabled,
perhaps the AC2 circuit breaker is off, and there is no AC heater power present (there would be
many blue temperatures in this case). For the over range parameter, in Figure 5.1.20, the
“Imaging Lens Temp.”, the heater may be experiencing normal thermal overshoot. In this case the
upper alarm limit should be increased, because this is a “false alarm”. The set point may be 25 C,
and the actual temperature overshoots to 27 C as the heater pulses on for one second. A
problematic over temperature condition could occur, for example, if a temperature sensor became
unattached from its particular heat zone.
Another example of an incorrect alarm range could be the pylon temperature alarm limits of 5 C
and 35C, shown on line 135 of the cpi.INI file. This heat zone may have a lower limit that is often
exceeded during flights in extremely cold ambient conditions. In this case, the user should
decrease the lower limit to below –10 C: a temperature that the pylon may often reach and that
does not require a warning to be issued to the user. For the user to have any confidence that
the flashing enunciator lights should be taken seriously, the limits must be customized in
the cpi.INI file for a particular CPI in a particular operating environment.
Other enunciator messages such as “PDS Detector Invalid” alert the user to a problem with the
PDS system. If the PDS detector DC level is too high, that particular PDS laser power needs to be
decreased, to allow dynamic range on the detector for triggering (see Section 5.1.3.1). This may
also indicate a larger problem, such as contamination on the windows of the PDS system. This
condition may indicate it is time for the windows to be cleaned.
5.2 CPI Real-Time Operation and Troubleshooting
The real time operation and troubleshooting section will outline the process of operating the CPI in
real time. The flowchart in Figure 5.2.1 should be used as a step-by-step guide to enable the user
to operate the CPI in the most efficient manner. At certain points in the flow chart, depending on
the branch taken, the user will be referred to troubleshooting information for specific operational
problems. By using the information in this section, the operator will optimize the data collected by
the CPI.
5.2.1 Operation and Troubleshooting In Flight
This section assumes the user has set up the probe per the instructions in the “Getting Started”
Section 2 and is attempting to run the probe. The flowchart in Figure 5.2.1 assumes the user has
started the CPI.exe real time program and is attempting to communicate with the probe by having
SPEC Inc. reserves the right to make improvements and changes to the CPI and related software
at any time and without notice
97
SPEC CPI Preliminary Technical Manual
clicked “Start Probe” in the main window or “Apply and Acquire” in the “Advanced Control and
Settings” window.
If the probe is not working, the flowchart will lead to one of four sections:
1.
2.
3.
4.
RTIA Log Troubleshooting.
Background Troubleshooting.
PDS System Troubleshooting.
Enunciator Troubleshooting.
If the flowchart does not list an observed problem, reading the troubleshooting sections may
provide insight and is still suggested. Problems with displaying data such as rates and image
parameters are not handled here. The user is referred to Section 5.1.6.1, “Rates and Image
Parameters” for information on this topic.
AT THIS TIME, THE USER SHOULD BEGIN OPERATING THE PROBE, FOLLOWING THE
FIGURE 5.2.1 FLOW CHART STEP-BY-STEP UNTIL THE “PROBE IS WORKING” BOX IS
ARRIVED AT.
SPEC Inc. reserves the right to make improvements and changes to the CPI and related software
at any time and without notice
98
SPEC CPI Preliminary Technical Manual
Figure 5.2.1. Troubleshooting flow chart (data system access only).
SPEC Inc. reserves the right to make improvements and changes to the CPI and related software at any
time and without notice
99
SPEC CPI Preliminary Technical Manual
5.2.2
RTIA Log Troubleshooting
The rtialog.txt file is found in the following directory:
C:\Program Files\boulderimaginginc\acquirenow\cpi\ directory. This file is produced every time the probe is
run and is written with information that is useful for troubleshooting many different problems, some of which
are described here. The following RTIA subsection headings describe the problem (such as sensor head
powered off) and the information in that section includes lines copied from a rtialog.txt file taken when that
error occurred.
5.2.2.1 Sensor Head Powered Off / Camera Connector Disconnected
Trying to start communicating with the probe while the sensor head is powered off is a common mistake.
Fortunately it is easy to diagnose. See Figure 2.2.1 of the “Connecting the CPI Sensor Head to the Data
Acquisition System” Section 2.2. Locate the sensor power indicator and see that it is lit; if not, turn on the
sensor power switch.
If the sensor power is off, the rtialog.txt file will have lines in it that match the following:
[0]PCLNKCapture: m_CaptureStartingEvent.Set()
PCLNKCapture::PCD_SWTRIG1_32 SENT - Frame TIMEOUT.
PCLNKCapture::PCD_SWTRIG1_32 SENT - Frame TIMEOUT.
PCLNKCapture::PCD_SWTRIG1_32 SENT - Frame TIMEOUT.
If these repeating lines are found in the log file, check the sensor head power is on as described. If the
power is on, another cause of these lines in the log file is the data acquisition system (DAS) computer to
sensor head camera connector being disconnected. See Figures 2.2.3 and 2.2.5 for the J1 sensor
camera connector locations on the DAS and sensor head in the “Connecting the CPI Sensor Head to the
Data Acquisition System” Section 2.2.
5.2.2.2 No Hardware Key Connected
The CPI software requires that a hardware key be connected to the parallel port of the computer. If there is
nothing plugged into the parallel port, the rtialog.txt file will produce the following:
CTracer::FinalConstruct - Enabled = 1; Level = 9
ThrowError:: CUserConfigCamera::FinalConstruct - No cameras are specified in the registry.
CMemoryOperator::FinalConstruct
CMemoryOperator::FinalConstruct- m_bDontLockLargeMem=0
ThrowError:: CBlobOperator::FinalConstruct - Operator is NOT licensed.
The final line indicates, “Operator is NOT licensed”, meaning the software could not find the hardware key.
See Figure 2.2.3 of the “Connecting the CPI Sensor Head to the Data Acquisition System” Section 2.2.
Locate and plug in the hardware key.
SPEC Inc. reserves the right to make improvements and changes to the CPI and related software at any
time and without notice
100
SPEC CPI Preliminary Technical Manual
5.2.2.3 Imaging Laser Power Too Low or Too High
The probe won’t acquire a background if the image mean is too low (or too high). A possibility is that the
imaging laser power has been turned down or up in the controls such that the incident light energy is not
within operating range on the CCD camera. If this is the case, the rtialog.txt file will have text like the
following in it:
CSerialComm::ReadDataPacket - a PDS packet received, Cnt=2764.
PCLNKCapture: [0]Frm #2831 (1, 0, 2, 2): 0 0 2 (XFer 0.0086 s, Period 0.0136 s)
CCorecoPCLNKDevice::CompleteAcquire: !m_bFrameCycleComplete
CBlobOperator::PerformOperation *Mean* = 0.000336sec/frame (Mean= 9.75).
CBlobOperator::PerformOperation BAD Mean: 9, (Valid: 63, 195).
The last line tells the user that the mean of the CCD camera image was 9, but the acceptable range is 63 to
195. In this case, the imaging laser power might have been turned down and needs to be adjusted back
up. If the line read “…BAD Mean: 220”, the imaging laser would need to be turned down. See Section
5.2.3.2 “ What To Do If Probe Is Communicating With DAS, but No Background Taken” which describes
how to adjust the image mean.
5.2.3 Background Troubleshooting
The background collection process and the parameters affecting it are described in detail in Section
5.1.4.1 “Background Images and Parameters”. The first thing the DAS must do on start up is acquire a
background from the sensor head CCD camera. The various problems that can occur in taking a
background are described in the following sections. The flowchart of Figure 5.2.2 provides a guide to
steps for correcting background problems.
5.2.3.1 What To Do If No Background Is Acquired At Startup
See flowcharts of Figure 5.2.1 and Figure 5.2.2.
SPEC Inc. reserves the right to make improvements and changes to the CPI and related software at any
time and without notice
101
SPEC CPI Preliminary Technical Manual
Figure 5.2.2. Background image troubleshooting flowchart.
5.2.3.2 What To Do If Probe Is Communicating With DAS, but No Background Taken
If the “Background Invalid” enunciator is flashing, or if the background image has a very low or high image
mean, which varies from probe to probe, steps can be taken to improve the background.
SPEC Inc. reserves the right to make improvements and changes to the CPI and related software at any
time and without notice
102
SPEC CPI Preliminary Technical Manual
High Particle Concentration
The first type of problem that can occur is the DAS attempting to get a background while in the presence of
high particle concentrations. The DAS waits until there are less than “Strobes Threshold” number of PDS
events per second before attempting to get a background (see Figure 5.2.3).
Figure 5.2.3. The probe tab of the settings window.
Raising the Strobes Threshold value does not improve the likelihood of getting a valid background while in
high particle concentrations because the background validation process will reject images that have a
particle present in the image. If the probe is repeatedly trying to take a background and is in high
concentrations, the solution is to exit the cloud for a brief period to allow the probe to take a background
image in clear air.
Particle Threshold Too Low, Minimum Size (Pixels) Too Low
The “Particle Threshold” and “Min Size (Pixels)” fields in Figure 5.2.3 greatly affect whether or not the DAS
detects particles (real or not) in image frames. If the probe is failing to get a background, try changing
these values to the more conservative values of 50 for the “Particle Threshold” and “6” for the ”Min Size
(Pixels)”. If this is not the problem, the user should go back to the previous settings (somewhere
around 40 and 4), as raising these values raises the minimum size particle the probe will measure.
See Section 5.1.4.2 “Particle Collection and Associated Controls” for more information on the “Particle
Threshold” and “Min Size (Pixels)” settings.
Image Mean Too High / Too Low
Each CPI has a different range of image means with which it performs well. A reasonable range for most
probes, however, is 80 to 160. These limits are entered by the user in the “Advanced Control and
SPEC Inc. reserves the right to make improvements and changes to the CPI and related software at any
time and without notice
103
SPEC CPI Preliminary Technical Manual
Settings” window, a portion of which is shown in Figure 5.2.4, and which comes from the bottom center of
the full window.
Figure 5.2.4. Background acquisition parameters in the Advanced Control and Settings window.
In Figure 5.2.4, the minimum and maximum image mean are set to 2 and 255, respectively, which is so
large a range as to allow image means below and above desired operating limits. This is useful for
diagnosing the image mean when the probe is failing to take a background, or for running live video. If
these limits are tighter than the current image mean of received CCD frames, both live video and
background acquisitions will fail, so a wide range is useful for troubleshooting; however, once the retrieved
image mean has been adjusted to desired levels, the user should set the limits to 80 and 160 for the “Min
Img Mean” and “Max Img Mean” fields, respectively. Once changed, as with all fields in the “Advanced
Control and Settings Menu”, the user must click the “Apply” button (which may also say “Apply
and Acquire”), else the DAS won’t use the new values.
Note that also the background mean limits must be changed in the AI background control window, shown
here in Figure 5.2.5, and discussed in detail in the “Laser Pulse Width Control” Section 5.3.5. These limits
must be tighter (the minimum mean greater than or equal, the maximum mean less than or equal to,
respectively) than the image mean settings in Figure 5.2.4. To open the limits of the image mean for live
video, only the “Min Img Mean” and “Max Img Mean” values in Figure 5.2.4 need to be changed.
If the image mean needs to be raised or lowered, the imaging laser is adjusted to bring the image mean to
a desired level. The adjustment is easily made in the “Lasers” tab of the “Settings” window, shown in
Figure 5.2.6. Make sure the “Laser Current Set Point” is at or near its maximum (4095), then adjust the
“Pulse Width Set Point” up to get a higher image mean or down for a lower image mean.
SPEC Inc. reserves the right to make improvements and changes to the CPI and related software at any
time and without notice
104
SPEC CPI Preliminary Technical Manual
Figure 5.2.5. AI Background control chosen from the Settings menu.
SPEC Inc. reserves the right to make improvements and changes to the CPI and related software at any
time and without notice
105
SPEC CPI Preliminary Technical Manual
Figure 5.2.6. Lasers tab of the Settings window.
SPEC Inc. reserves the right to make improvements and changes to the CPI and related software at any
time and without notice
106
SPEC CPI Preliminary Technical Manual
To adjust the image mean in real time, the user can check the “Live Video On” check box in the main
screen. It is best to run live video with recording disabled, as about 72 full images of approximately
1 Megabyte size each will be saved to hard disk every second if recording is active. Once live video
is turned on, the image display area will show the entire CCD camera image (though for most CRT and
LCD computer monitors, only a fraction of the total image may be seen; move the scroll bars for the image
display area to view different portions of the CCD image). The image mean will be updated in real time in
the “Img Mean” field of the “Statistics” window (see “Live Video mode” Section 5.1.4.4). While running live
video, adjustment of the imaging laser current (remember to click the “Apply” button) will change the image
brightness displayed and reported. Once the image mean is at a desirable value—e.g. somewhere
between 80 and 160, though this is different for each probe—turn off live video by unchecking the “Live
Video” box. A new background should be taken immediately after any changes are made to the
imaging laser set points. If not, the background subtraction will now have a large offset due to the
changed image mean, causing the particle processing algorithm to work poorly or not at all.
Warning! If the image mean is outside the limits set in the “Advanced Control and Settings” window, shown
in Figure 5.2.4, live video will fail to update the “Display” window and the probe will fail to take a
background. To prevent the image mean from falling outside the limits, set “Min Img Mean” equal to 1 and
the “Max Img Mean” equal to 255 when troubleshooting image mean problems. Be sure to return the limits
to a proper operating range when you are finished diagnosing and correcting the image mean problem.
5.2.4 PDS Operation and Troubleshooting
The PDS system is described in detail in Section 5.1.3 “Particle Detection System Control and
Monitoring”.
The flowchart of Figure 5.2.7 is a guide to troubleshooting any problems with this system.
The user adjustable parameters for the PDS system are as follows:
8.
9.
10.
11.
12.
13.
14.
PDS 45 laser power.
PDS 90 laser power.
PDS 45 detector DC level.
PDS 90 detector DC level.
PDS 45 threshold Voltage.
PDS 90 threshold Voltage.
PDS minimum transit time.
Items 1 through 4 are easily accessed via the “Lasers” tab of the “Settings” window of Figure 5.2.6
Items 5 through 7 are easily accessed via the “Probe” tab of the “Settings” window shown in Figure 5.2.3
SPEC Inc. reserves the right to make improvements and changes to the CPI and related software at any
time and without notice
107
SPEC CPI Preliminary Technical Manual
Figure 5.2.7. PDS troubleshooting flowchart.
SPEC Inc. reserves the right to make improvements and changes to the CPI and related software at any
time and without notice
108
SPEC CPI Preliminary Technical Manual
5.2.4.1 What To Do If PDS Laser Power Needs Adjustment
The indicator for laser power out of range is that the “Detector DC Level” for either the PDS 45 or PDS 90
system, is above 8.8V or below 3.5V, as reported in the Lasers tab of the Settings window, Figure 5.2.6.
These limits are different for every probe, but a well-aligned probe with clean optics will have an operating
range of approximately 3.5V to 8.8V. If not within this range (or a normal range for a given probe), adjust
the laser power up or down by moving the slider in the PDS 45 or PDS 90 box in the lasers tab of the
Settings window. This window is shown in Figure 5.2.6. Move the slider right for more power, raising the
DC level, or left, lowering the DC level. Slide the adjuster to a new value and click the “Apply” button.
Monitor the DC values and the reported “Laser Power Setpoint” to see that the change was accepted and
the DC Voltage levels are at an acceptable level. Repeat the steps if necessary until the DC levels are
within the above stated range.
If the DC Voltage remains very high, even though the “Laser Power Setpoint” and “Laser Power Actual”
values are low—less than 18 mW—then either the PDS laser is not correctly focused on the dump spot
(see diagram in the upper left of Figure 1.1.2 of the “General Description” Section 1.1), or the PDS optics
are dirty and scattering laser light around the dump spot. Both problems require access to the sensor
head. A knowledgeable person must work on the optics of the PDS system (see procedure in “Cleaning
Windows Section 6.7).
5.2.4.2 What To Do If the PDS Threshold Needs Adjustment
The PDS threshold settings are adjusted in the “Probe” tab of the “Settings” window, shown in Figure 5.2.3.
200 is a normal lower limit, though some probes can be operated at even lower values while running in a
laboratory (such as the 167 value, shown in Figure 5.2.3). As described in the “Particle Detection System
Control and Monitoring” Section 5.1.3, the higher the threshold is set, the fewer small particles are seen.
600 is a nominal upper limit, however, like the lower limit, this is not a hard and fast number.
If the probe is not collecting particles and the PDS laser power levels are acceptable, adjust the PDS
threshold to a safe value, 350, and click the “Apply” button. At this setting, particles of the smallest size
may not be seen, but if in the presence of an ensemble of cloud particles that includes some medium (50 to
100 m) to larger particles, this setting should be safely above the noise and allow the PDS system to
detect particles. However, if particles are still not collected, lower values should be attempted.
5.2.4.3 What To Do If the PDS Minimum Transit Time Needs Adjusting
As described in the optics section of the manual, the PDS sample volume is 0.5mm thick and tilted at an
angle of 45 to the direction of particle travel. The time required for a particle to enter, then exit the sample
volume is, ignoring the particle size, approximately:
TTRANSIT = 0.5 x 10⁻³ meters / (V x Sin 45)
TTRANSIT = 0.707 x 10⁻³ meters / V
SPEC Inc. reserves the right to make improvements and changes to the CPI and related software at any
time and without notice
109
SPEC CPI Preliminary Technical Manual
Where V is the velocity in meters per second. To a first approximation, the transit time including the
particle size is given by:
TTRANSIT = (0.707 + D) x 10-3 meters / V
Where D is the particle diameter in millimeters. From this equation, the transit time of a 10 micron particle
traveling at 200 m/S is 3.585 x 10⁻⁶ seconds. The transit time counter operates at 48 MHz, so this particle
would have a total transit time count of approximately 172 counts. A 200 micron particle at the same speed
would have a transit time of 4.535 x 10⁻⁶ seconds and transit time count of approximately 218. In actuality,
the particle spends time in the beam during which the particle threshold is not exceeded, so the transit time
count is smaller than those given. From this analysis it is apparent that a “Minimum Transit Time” setting of
200, when flying at 200 meters per second, is going to limit the smallest sizes seen; in some cloud droplet
distributions, no particles might be imaged at all due to failing the minimum transit time criterion.
If the probe is not imaging particles, adjust the raw value of the “Minimum Transit Time Setpoint” to 30 and
click “Apply” in the “Advanced Control and Settings” window shown in Figure 5.1.6 in the Software
Description Section 5.1.
5.2.5 Enunciator Warnings
When operating with no limits exceeded, such as heat zone measured temperatures, laser powers, etc.,
the DAS enunciator panel (see the upper part of the window shown in Figure 5.1.1 in the Software
Description Section 5.1) should have one green background alert stating “Background Valid”. Any other
alert, given in red, yellow or blue, indicates a parameter is out of the assigned operating range. Users
assign these limits in the cpi.INI file, described in Section 5.1.7 The enunciator panel is further described
there as well. If any alerts other than “Background Valid” or short alerts titled “Getting Background” are in
the enunciator panel, read Section 5.1.7 and address the problem.
5.3 Artificial Intelligence (AI) DAS Controls
Incorporated into the software are control algorithms that automate the PDS threshold settings, the PDS
laser power settings, and the imaging laser power. Also available for use is an algorithm to take a new
background any time a particle is seen in nearly the same position in multiple frames. All of these
algorithms were designed to remove the need for an operator to monitor and control the system settings.
However, this should not preclude operator oversight and we encourage users to turn the control
algorithms off until they have spent significant lab time familiarizing themselves with them.
5.3.1 Settings Menu AI Items
Figure 5.3.1 shows the Settings menu options. The Settings/SPP100 Settings and Settings/Single Board
Computer Settings options should be ignored, as they are features of a purely stand-alone data system, or
a system incorporating an SPP100 instrument. The two menu options that change the control algorithm
SPEC Inc. reserves the right to make improvements and changes to the CPI and related software at any
time and without notice
110
SPEC CPI Preliminary Technical Manual
behaviors, including turning them on and off, are Settings/AI Background Setting and Settings/AI PDS
Control Settings. These will be discussed in the following sections.
Figure 5.3.1. The New Settings Menu.
5.3.2 PDS Laser Control
The CPI, due to changes in temperature affecting optical paths and laser power fluctuations, requires
monitoring and control of the PDS laser settings. Users typically set the laser power monitoring the PDS
DC voltage on both the PDS45 and PDS 90 lasers, attempting to set the PDS laser power as high as
possible without going over 8.8V on the monitor. The artificial intelligence (AI) code added to the real time
software attempts to do the same thing using the following algorithm:
1. Start with the set point stored in the CPI.ini file.
2. Wait X (start with 5) seconds.
3. Look at error between desired PDS DC level—the upper limit for the DC Voltage measured
found in the cpi.INI file—and the measured value.
4. Implement proportional/integral control based on error in 3.
5. Record new set point
6. Go to 2.
Figure 5.3.2 shows the window used to change the parameters that affect this algorithm. The lower two
thirds of the form are for PDS laser setting control, which this section discusses, while the upper third is for
controlling the PDS threshold, to be discussed in the next section.
To turn off the DC level control algorithm so that the real time software lets the user maintain control, leave
the Algorithm Enabled checkboxes unchecked.
SPEC Inc. reserves the right to make improvements and changes to the CPI and related software at any
time and without notice
111
SPEC CPI Preliminary Technical Manual
Figure 5.3.2. PDS threshold and DC level control form.
The following is a description of the parameters affecting the PDS laser DC level control. Note that both
the PDS45 and PDS90 lasers have settings that need entered, but should usually be the same. One
possible difference is the target DC level.
Target DC Level: This comes from the cpi.ini file in the C:\Winnt directory -- Gain/Offset 20 (line 173 of the
example .ini file in the appendix) and Gain/Offset 22 (line 179 of the example .ini file in the appendix); the
max value entered in the file is used as the target DC level. This value is not editable in the form shown in
Figure 5.3.2.
Err Thresh (Start Change): Volts away from the target for the algorithm to go active. The control algorithm
will do nothing until the target DC value differs from the actual DC value by more than this value.
SPEC Inc. reserves the right to make improvements and changes to the CPI and related software at any
time and without notice
112
SPEC CPI Preliminary Technical Manual
Err Thresh (Stop Change): Volts away from the target to stop the algorithm. Once the difference between
the desired DC value and the actual DC value is less than this value, the control algorithm will end. This
value should be smaller than the Err Thresh (Start Change) value just discussed.
Stable State Max Range: For min. stability time period (which will be the next field that we discuss), all the
values need to be within the Stable State Max Range Volts to be considered good. If the Voltage samples
of the laser DC level within a window of time equal to Min. Stability Time Period vary by more than this
setting, the control will not be implemented. This feature keeps the algorithm from becoming unstable if the
measurements are varying too erratically.
Min Stability Time Period: How long the PDS DC levels must be within “Stable State Max Range” Volts of
each other before the proportional—integral (PI) control will begin. See “Stable State Max Range”
parameter explanation.
Averaging time period: How long to average PDS DC levels for comparison with set point. This is time T in
the difference equation discussed below.
Adaptation Parameter Ki*T: For the PI algorithm the difference equation implemented is uk = uk-1 + (Kp +
Ki*T)*ek + (Ki*T - Kp)ek-1. In this equation, uk is the applied DC laser setting (as the user would enter in
the Settings/Advanced Control and Settings form); uk-1 is the previously applied value; ek-1 is the error
between the desired laser DC voltage and the previously measured DC voltage. The larger this number,
Ki*T, the faster things change, but you get less stability. Ki*T should be greater than Kp--twice Kp is a
good start.
Adaptation Parameter Kp: See above.
Maximum Iterations: After this number of iterations, if the set level isn't within “Err Thresh (Stop Change)”
Volts of the DC set point, the algorithm looks for a stable state again and starts over.
5.3.3 PDS Threshold Control
PDS thresholds affect the sensitivity of the CPI. Users balance the desire to see the smallest particles,
corresponding to lowest threshold settings, with getting empty images caused by the probe interpreting
electronic or optical noise as a particle event. The artificial intelligence (AI) code added to the real time
software attempts to do the same thing using the following algorithm:
1. Raise PDS threshold by X4 (start with X4 = 50). If the following two conditions are met:
a) The number of laser flashes per second is > X1 for X2 seconds (start with X1 = 5, and X2 = 5).
b) R < X3 (0.1 to start) for the same period of X2 seconds, where R = number of valid frames /
number of strobes.
SPEC Inc. reserves the right to make improvements and changes to the CPI and related software at any
time and without notice
113
SPEC CPI Preliminary Technical Manual
2. If the sum of the laser flashes per second over the duration of X5 seconds is < X6 (start with X5 =
30, X6 = 2), then lower the PDS threshold by X7 (start with X7 = 50).
Figure 5.3.2 shows the form used to change the parameters that affect this algorithm, with the upper third
of the form controlling the PDS threshold control parameters.
To turn off the PDS Threshold Level control algorithm so that the real time software lets the user maintain
control, leave the Algorithm Enabled checkbox unchecked.
The parameters in the form are all described in the description of the control algorithm above. Note that
item number 1 in the algorithm raises the threshold if a number of particles have been detected (via
imaging laser flashes) over a given time period, but the percentage of valid frames (frames containing valid
particles, or regions of interest denoted as ROI’s) is low. The assumption is increasing the PDS thresholds
will increase the valid frames.
Item 2 in the algorithm decreases the PDS threshold if, over a long period of time, very few (X6) laser
flashes occur. In clear air, with no particles present, this algorithm will decrease the PDS thresholds
enough to cause light and optical noise to just begin triggering the PDS system. This is the optimum
sensitivity setting of the probe’s PDS system.
5.3.4 Background Control
Currently users set a time period, in seconds, after which the probe should take a background. This is
done so that variations in the image intensity over time can be removed when looking for particles in a
captured frame. An added feature that may be user enabled looks, in every captured frame, to see if
multiple frames have captured a detectable ROI in the same area of the image. So if, for example, a piece
of dust on a lens were to remain in one spot, this algorithm would then take a background, thus removing
the effect of the dust spot. Otherwise, every time a particle was detected by the PDS system, causing the
image processing software to look for ROI’s, the image processing would find the dust spot and count it as
a particle.
Choosing the “Settings/AI Background Settings” menu option brings up the form shown in Figure 5.3.3.
The background adaptation just described is controlled in the lower half of the form, and to cause the real
time software not to perform the algorithm, leave the Algorithm Enabled checkbox unchecked.
SPEC Inc. reserves the right to make improvements and changes to the CPI and related software at any
time and without notice
114
SPEC CPI Preliminary Technical Manual
Figure 5.3.3. Background and image laser setting control form.
The parameters that affect the background algorithm are described below:
Check Period: Once every Check Period frames, the image processing algorithm will look for ROI’s that
overlap. If this value is 1, the data system will monitor every frame. If value is 2, the data system will
monitor every other frame. Choosing bigger numbers makes the system faster.
Overlap ROIs Pixel Offset Limit: See Figure 5.4.3. Two corners of possible overlapping ROIs are
compared. The comparison calculation for the upper left corner (points P ) is explained here, but the
calculation for the lower right corner is similar. For the points P1 and P2:
If |X1 – X2| < “Overlap ROIs Pixel Offset Limit”
AND
|Y1 – Y2| < “Overlap ROIs Pixel Offset Limit”
then the upper left corners overlap. If upper left corners P1 and P2 overlap AND lower right corners Q1 and
Q2 overlap then the two ROI’s are considered overlapping.
Due to very small changes in the optical and electronic systems the image of even a fixed dust particle
stuck on a lens will move around by a few pixels from frame to frame. “Overlap ROIs Pixel Offset Limit”
allows the AI algorithm to identify a dust particle stuck to the lens even if its image moves around a little
from frame to frame. An “Overlap ROIs pixel offset” value of 1 means EXACT overlap.
SPEC Inc. reserves the right to make improvements and changes to the CPI and related software at any
time and without notice
115
SPEC CPI Preliminary Technical Manual
Figure 5.3.4. Calculation of Overlap ROIs Pixel Offsets.
Max Consecutive Frames Checked: Number of frames that must have overlapping particles to execute new
background.
Overlapped ROI count limit: Need more than this value to execute background. Leave at 0 to remove all
stuck images.
5.3.5 Laser Pulse Width Control
The imaging laser energy incident on the CPI’s digital camera sensor is proportional to the image mean, or
how light the exposed image appears. If the energy is too low, then the exposure is too dark to see
particles; too high and saturation nets the same effect. Users can set this incident energy by changing the
imaging laser current setting and the imaging laser pulse width setting. It is standard practice with the CPI
to set the imaging laser current to its maximum (4095 counts), then adjust the pulse width to achieve an
optimum image. A new AI control does the same thing, changing the imaging laser pulse width to maintain
an optimal image mean.
The upper half of the form shown in Figure 5.3.3 controls this new AI feature.
To turn off the imaging laser level control algorithm so that the real time software lets the user maintain
control, leave the Enable Mean Error Event checkbox unchecked.
Even if the checkbox is left unchecked, the background minimum and maximum values, for
acceptable background image means, is entered in this form and must be set correctly.
SPEC Inc. reserves the right to make improvements and changes to the CPI and related software at any
time and without notice
116
SPEC CPI Preliminary Technical Manual
Under user control the image mean min and max, set in the “Settings/Advanced Control and Settings”
window (see Section 5.2.3.2), defined the acceptable range of the background mean. However, under AI
algorithm control the background mean’s range must also be entered in the form shown in Figure 5.3.3,
and the background mean’s range should be tighter than the image mean’s range. In other words, the
Minimum Mean in the AI form (Figure 5.3.3) should be larger than the minimum image mean in the
“Advanced Control and Settings” Window. Also the Maximum Mean in the AI form (Figure 5.3.3) should be
smaller than the maximum image mean in the “Advanced Control and Settings Window”. A good starting
point for the AI algorithm settings is: Minimum Mean = 130 and Maximum Mean = 150.
Pulse Width Update Step: how many counts to adjust the laser pulse width setting. “100” is a good value
here.
Maximum ROIs in Diff image: If there are more than this number of ROI’s detected in an image, then the
background algorithm will not use the current frame for image mean calculation. “2” is a good value to use.
Max ROI size in Diff image: If any ROI in the image is over this number of pixels, the image is rejected for
background. A value of “10” will work OK here.
Max time between images: If frames get thrown out, the time between the first and last accepted frame for
performing ROI subtraction must be less than this number in milliseconds. “700” is a good value here.
All these values are set in the form shown in Figure 5.3.3.
SPEC Inc. reserves the right to make improvements and changes to the CPI and related software at any
time and without notice
117
SPEC CPI Preliminary Technical Manual
6.0 PROCEDURES
6.1 Pylon Cover Removal
The CPI sensor head pylon cover must be removed to gain access to the internal sensor head. This step is
necessary if the internal sensor head is to be completely removed from the pylon, or to perform electronics
troubleshooting of the internal sensor head while in the pylon. The photographs show the sensor head
lying flat on a table. The pylon should always be placed on a soft material, such as foam, to avoid
scratching the outer surface. This procedure can also be followed when the sensor head is mounted on an
aircraft.
The pylon internal pressure is monitored in the Housekeeping data. If the internal pressure drops during
flight, a leak in the pylon cover’s seal is indicated. If the instrument was being flown in a wet environment
when the pressure dropped, the pylon cover should be removed after the flight. The internal sensor should
be inspected for moisture. If moisture is found, allow the pylon internal sensor to dry out before putting the
pylon cover back on. The AR coatings on the optical block windows are sensitive to high humidity
environments. Do not allow moisture to reside in the closed pylon, it will damage the AR coatings.
Warning! The CPI pylon is a high performance assembly that serves as a protective housing for the
internal sensor head components and as the structural interface to the aircraft. It is hermetically sealed up
to approximately 65,000 ft altitude. O-rings and precision-machined surfaces are used to achieve this seal.
Improper disassembly/assembly of the pylon or mishandling of the components can result in
damage that will compromise the pressure integrity of the pylon. This may result in malfunctioning
of the instrument during flight. Disassembly/Assembly of the pylon should only be performed by
personnel who have read and become familiar with this procedure.
1. Verify CPI sensor head power is turned off.
2. Figure 6.1.1 shows the primary external components of the pylon assembly; the pylon body, pylon
cover, and nose cone
3. The nose cone is fastened to the pylon using 4X - #6-32 socket head cap screws (SHCS) (Figure
6.1.2).
4. In order to remove the pylon cover, it is first necessary to remove the nose cone. Using a 7/64”
ball driver or hex wrench, remove the four screws mounting the nose cone to the pylon (Figure
6.1.3).
5. Do not twist the nose cone during removal. After the four screws are completely loose, remove the
nose cone from the pylon by pulling away from the pylon. Do not twist the nose cone as you pull.
This procedure is shown in Figure 6.1.4. Put the nose cone in a safe place, taking care not to
damage any sharp edges. The nose cone contains two de-ice slug heaters, a temperature sensor,
SPEC Inc. reserves the right to make improvements and changes to the CPI and related software at any
time and without notice
118
SPEC CPI Preliminary Technical Manual
and connector (Figure 6.1.5). Dowel pins are used to properly align the connector to mate
correctly.
6.
Torx plus fasteners are used to fasten the pylon lid to the pylon body. This type of fastener uses a
special type of drive to minimize stripping of the drive head over repeated use. Special T15 Torx
Plus drivers (Figure 6.1.6) are necessary to work on the pylon. These drivers have been provided
with the CPI.
7. 21X - #8-32 Torx plus fasteners are used to fasten the pylon cover to the pylon body. 19 of the
fasteners are ¾” long while 2 of the fasteners are only ½” long (Figure 6.1.7). The locations of the
½” fasteners are important during reassembly of the pylon cover.
8. Using the Torx plus driver, gradually loosen all the pylon fasteners approximately ¼ to ½ turn,
saving the center fastener for last (Figure 6.1.8). This will gradually decrease the compression on
the O-ring, and uniformly decrease the stress on the pylon cover. Once all the fasteners have
been initially loosened, proceed to remove them until all 21 fasteners are removed. Place the
fasteners in a safe place, as they will be reused during reassembly.
9. Two pry points are located on the pylon cover to facilitate removal (Figure 6.1.9). The pylon cover
mates onto the pylon body with a tongue and groove design.
10. Verify that all 21 fasteners have been removed form the pylon cover. Insert a small flat-blade
screwdriver into one of the pry grooves (Figure 6.1.10), and gradually pry upward on the pylon
cover. Take care not to damage the tongue or O-ring on the pylon cover. Very little force should
be required to lift the tongue on the pylon cover from the groove on the pylon body.
11. After the cover has been freed from groove, grasp the cover with two hands as shown in Figure
6.1.11.
12. Lift the cover directly upward to until it clears the internal sensor head assembly (Figure 6.1.12).
13. Place the cover in a safe location such as a soft foam surface (Figure 6.1.13).
14. Figures 6.1.14 and 6.1.15 show the parts of the pylon cover and pylon body that mate together.
Inspect the O-rings for wear that may occur over time. If the O-rings appear damaged, they should
be replaced.
SPEC Inc. reserves the right to make improvements and changes to the CPI and related software at any
time and without notice
119
SPEC CPI Preliminary Technical Manual
Figure 6.1.1.
Figure 6.1.2.
Figure 6.1.3.
Figure 6.1.4.
Figure 6.1.5.
SPEC Inc. reserves the right to make improvements and changes to the CPI and related software at any
time and without notice
120
SPEC CPI Preliminary Technical Manual
Figure 6.1.6.
Figure 6.1.7.
Figure 6.1.8.
Figure 6.1.9.
Figure 6.1.10.
Figure 6.1.11.
SPEC Inc. reserves the right to make improvements and changes to the CPI and related software at any
time and without notice
121
SPEC CPI Preliminary Technical Manual
Figure 6.1.12.
Figure 6.1.13.
Figure 6.1.14.
Figure 6.1.15.
6.2 CPI DSP Control Board Access When Internal Sensor Head Is
Mounted in the Pylon
The following steps describe how to access the DSP control board (also called printed circuit board (PCB))
for troubleshooting when the instrument in mounted in the pylon. The ability to access the PCB in the pylon
can be particularly useful when the instrument is mounted to an aircraft, as it does not require removal of
the entire internal sensor head.
1. Before rotating the PCB, verify CPI power is switched off.
2. Using a 5/32” ball driver of hex wrench, loosen the PCB retaining screw that holds the PCB
retaining clip (Figure 6.2.1).
SPEC Inc. reserves the right to make improvements and changes to the CPI and related software at any
time and without notice
122
SPEC CPI Preliminary Technical Manual
3. Rotate the PCB retaining screw away from the PCB (Figure 6.2.2).
4. Before accessing the PCB to perform any troubleshooting, make sure proper precautions to avoid
electrostatic discharge (ESD) are followed (Figure 6.2.3).
5. Rotate the PCB outward to gain access for troubleshooting (Figure 6.2.4).
6. When the PCB is in a stable position, sensor head power can be switched on.
7. When troubleshooting is complete, turn off sensor head power. Rotate the PCB back into position
verifying the PCB aligns with the machined slots in the instrument frame located at the rear of the
PCB mounting location (Figure 6.2.5).
8. Rotate the retaining clip back into position and tighten the clip retaining screw.
Figure 6.2.1
Figure 6.2.2
Figure 6.2.3
Figure 6.2.4
SPEC Inc. reserves the right to make improvements and changes to the CPI and related software at any
time and without notice
123
SPEC CPI Preliminary Technical Manual
Figure 6.2.5
6.3 CPI Internal Sensor Removal
The CPI internal sensor must be removed from the pylon to perform various optical adjustments that cannot
be performed in the pylon, or to perform troubleshooting that cannot be accomplished with the internal
sensor mounted in the pylon. If the CPI is mounted to an aircraft, removal of the internal sensor head does
not require removal of the pylon from the aircraft. The photographs show the sensor head lying flat on a
table, but the same procedure is followed if it is mounted on an aircraft. The pylon should always be placed
on a soft material, such as foam, to avoid scratching the outer surface.
Warning! The CPI internal sensor head is a high performance assembly that consists of many optical
components, electro-optics assemblies, and ESD sensitive electronics. The pylon serves as a protective
housing for the internal sensor head. When the internal sensor head is removed from the pylon, the optics
are no longer protected from contamination. The internal sensor head should be worked on in a dust free,
ESD protected environment after removal. Removal of the internal sensor from the pylon should only
be performed by personnel who have read and become familiar with this procedure. If this
procedure is not followed correctly, the optical alignment of the CPI may be compromised or
damage to components of the CPI may result.
1. Verify CPI sensor head power and computer power are turned off.
2. Verify the pylon cover removal procedure has been followed correctly.
3. Verify the PCB retaining clip is locking the PCB into place (see Pylon Cover Removal Procedure).
4. Figure 6.3.1 shows the primary mount points for the internal sensor in the pylon, with the internal
sensor removed for clarity. In the installed position, the internal sensor is mounted to two O-rings
on the inlet adapter, two O-rings on the aft sample tube, and a robber grommet on the pylon
SPEC Inc. reserves the right to make improvements and changes to the CPI and related software at any
time and without notice
124
SPEC CPI Preliminary Technical Manual
spreader. The O-rings and grommet serve to vibration isolate the internal sensor from the pylon,
as it is free to float a small amount on these points. The O-rings also serve as a hermetic seal
between the sample tube and internal pylon.
5. Figure 6.3.2 shows the general location of the connectors that need to be de-mated.
6. De-mate both base and full cables from the camera (Figure 6.3.3).
7. De-mate the J23S-internal pylon connector from the connectors captive to the pylon. (Figure
6.3.4). If the pylon is connected to the data system (as is the case when installed on an aircraft),
make sure that both the base and full cables are removed before J20S, J21S, or J22S.
8. Using a small flat-blade screwdriver, loosen the screws for connector J20S-AC power and J21SDC power (Figure 6.3.5). These screws are captive to the connectors. Using the 3/32” ball driver,
remove the screws and lock washers for connector J22S-DSP data.
9. De-mate connectors J20S, J21S, and J22S from each of their mating connectors captive to the
pylon. Verify that five connectors have been completely de-mated at this point.
10. 2X - #8-32 Torx plus fasteners are used to lock the aft sample tube into the correct position
(Figure 6.3.7). Using the T15 Torx plus driver, remove the two fasteners for the aft sample tube
(Figure 6.3 8).
11. The CPI pulling fork tool is required to assist in the internal sensor removal. Figure 6.3.9 shows
the CPI pulling fork tool and the pry points on the aft sample tube and pylon.
12. Study Figure 6.3.9 thru Figure 6.3.22 before proceeding any further.
13. Slide the slots in the pulling fork over the aft sample tube pry bosses and the pylon pry bosses
(Figure 6.3.10).
14. Gradually pull back on the pulling fork in the direction shown in Figure 6.3.11 to begin removal of
the aft sample tube. As the aft sample tube begins to slide, the internal sensor head will also begin
to slide off the inlet adapter and pylon spreader. Assist the sliding of the internal sensor by pulling
on the green handle (Figure 6.3.11) with your available hand in the same direction as you are
pulling with the fork. If the pylon is not mounted on an aircraft, have another person steady the
pylon if it begins to move.
15. Figure 6.3.12 shows the direction the components will begin to move.
16. Figure 6.3.13 shows the aft sample tube O-rings that will be exposed as the aft sample tube slides
back.
17. Figure 6.3.14 shows the inlet adapter O-ring that will be exposed as the internal sensor slides
back.
SPEC Inc. reserves the right to make improvements and changes to the CPI and related software at any
time and without notice
125
SPEC CPI Preliminary Technical Manual
18. Figure 6.3.15 shows the gap that will develop between the internal sensor and pylon spreader
grommet as the internal sensor slides back.
19. Continue pulling back on the CPI pulling fork until the maximum pulling point is reached (Figure
6.3.11). Both O-rings on the inboard end of the aft sample tube should be almost completely
exposed by this time (Figure 6.3.16). By hand, slide the aft sample tube into the farthest back
position shown in Figure 6.3.16.
20. Figure 6.3.17 shows the PDS 45 laser and Delrin laser guard on the internal sensor. The Delrin
laser guard protects the PDS 45 laser from colliding with the pylon screw boss. If the PDS 45 laser
collides with the pylon screw boss, damage to the laser can occur.
21. Study Figures 6.3.18 through Figure 6.3.22 before proceeding further.
22. Place your hands in the position shown in Figure 6.3.18, with the left hand on the green handle,
and the right hand as shown. Continue to slide the internal sensor in the direction shown in Figure
6.3.18.
23. Eventually the internal sensor will be completely freed from the pylon spreader grommet (Figure
6.3.19) and the inlet adapter (Figure 6.3.20).
24. As shown in Figure 6.3.20, rotate the bottom of the internal sensor upward, pivoting around the
laser guard, and taking great care to safeguard the PDS 45 laser.
25. After the PDS 45 laser and pylon spreader are cleared (Figure 6.3.21), lift the internal sensor
upward, out of the pylon.
26. Place the internal sensor on the side shown on an ESD safe surface (Figure 6.3.22).
27. The internal sensor should rest on the support feet (Figure 6.3.23) to protect sensitive components
from misalignment or damage.
SPEC Inc. reserves the right to make improvements and changes to the CPI and related software at any
time and without notice
126
SPEC CPI Preliminary Technical Manual
Figure 6.3.1.
Figure 6.3.2.
Figure 6.3.3.
Figure 6.3.4.
Figure 6.3.5.
SPEC Inc. reserves the right to make improvements and changes to the CPI and related software at any
time and without notice
127
SPEC CPI Preliminary Technical Manual
Figure 6.3.6.
Figure 6.3.7.
Figure 6.3.8.
Figure 6.3.9.
Figure 6.3.10.
SPEC Inc. reserves the right to make improvements and changes to the CPI and related software at any
time and without notice
128
SPEC CPI Preliminary Technical Manual
Figure 6.3.11.
Figure 6.3.12.
Figure 6.3.13.
Figure 6.3.14.
Figure 6.3.15.
Figure 6.3.16.
SPEC Inc. reserves the right to make improvements and changes to the CPI and related software at any
time and without notice
129
SPEC CPI Preliminary Technical Manual
Figure 6.3.17.
Figure 6.3.18.
Figure 6.3.19.
Figure 6.3.20.
Figure 6.3.21.
Figure 6.3.22.
SPEC Inc. reserves the right to make improvements and changes to the CPI and related software at any
time and without notice
130
SPEC CPI Preliminary Technical Manual
Figure 6.3.23.
6.4 CPI Internal Sensor-Running On Test Stand
The CPI internal sensor should be mounted to the test stand when it is operated in the laboratory out of the
pylon. This procedure describes how to mount the internal sensor to the test stand and connect the test
cables. Proper ESD precautions should be taken while connecting the test cables and operating the
instrument.
Warning! The CPI internal sensor head is a high performance assembly that consists of many optical
components, electro-optics assemblies, and ESD sensitive electronics. The pylon serves as a protective
housing for the internal sensor head. When the internal sensor head is removed from the pylon, the optics
are no longer protected from contamination. The internal sensor head should be worked on in a dust free,
ESD protected environment after removal. Installation of the internal sensor onto the test stand
should only be performed by personnel who have read and become familiar with this procedure.
1. Figure 6.4.1 shows the CPI test stand and the internal sensor on an ESD safe surface. The green
handles shown in Figure 6.4.1 should be used to handle the internal sensor.
2. Figure 6.4.2 shows the location of alignment sensitive optical components. Care should be taken
not to bump or disturb these components when working with the internal sensor removed from the
pylon.
3. Using the green handles, position the internal sensor mount points above the test stand mounting
plate (Figure 6.4.3).
SPEC Inc. reserves the right to make improvements and changes to the CPI and related software at any
time and without notice
131
SPEC CPI Preliminary Technical Manual
4. While holding onto the green handles on the internal sensor, screw one of the mount screws into
the internal sensor mount point only a few threads (Figure 6.4.4).
5. While holding onto the green handles on the internal sensor, screw the opposite mounting screw
into the internal sensor mount point only a few threads (Figure 6.4.5). When both screws have
been started, alternate turning them until they are tight and the mount plate is completely flush with
the internal sensor.
6. After the mount screws have been completely tightened, verify the universal joint screw is
completely tight (Figure 6.4.6).
7. Verify that sensor power and computer power are off.
8. Figure 6.4.7 shows the connectors for the sensor end of the test cables. Connect the opposite
ends of the test cables to the data acquisition system as described in the CPI connection
procedure.
9. Using a clamp, strain relieve the test cables to the table to avoid any stress on the connectors
when they are mounted to the sensor head (Figure 6.4.8).
10. Mate the J21S-DC power connectors (Figure 6.4.9).
11. Mate the J20S-AC power connectors (Figure 6.4.10).
12. Mate the J22S-DSP data connectors (Figure 6.4.11).
13. Mate the camera data connector (Figure 6.4.12).
14. Verify all cables have been mated and are strain relieved to the table (Figure 6.4.13).
15. The internal sensor is now ready to be operated in the laboratory.
16. To remove the internal sensor from the test stand, verify that sensor and computer power are off
and follow the above procedure in reverse.
SPEC Inc. reserves the right to make improvements and changes to the CPI and related software at any
time and without notice
132
SPEC CPI Preliminary Technical Manual
Figure 6.4.1.
Figure 6.4.2.
Figure 6.4.3.
Figure 6.4.4.
Figure 6.4.5.
SPEC Inc. reserves the right to make improvements and changes to the CPI and related software at any
time and without notice
133
SPEC CPI Preliminary Technical Manual
Figure 6.4.6.
Figure 6.4.7.
Figure 6.4.8.
Figure 6.4.9.
Figure 6.4.10.
Figure 6.4.11.
SPEC Inc. reserves the right to make improvements and changes to the CPI and related software at any
time and without notice
134
SPEC CPI Preliminary Technical Manual
Figure 6.4.12.
Figure 6.4.13.
6.5 CPI Internal Sensor Installation into Pylon
The CPI internal sensor must be installed into the pylon for airborne operation. The following photographs
show the sensor head lying flat on a table. The same procedure is followed if the sensor head is mounted
on an aircraft. When not mounted to an aircraft, the pylon should always be placed on a soft material, such
as foam, to avoid scratching the outer surface.
CAUTION: The CPI internal sensor head is a high performance assembly that consists of many optical
components, electro-optics assemblies, and ESD sensitive electronics. The pylon serves as a protective
housing for the internal sensor head. When the internal sensor head is removed from the pylon, the optics
are no longer protected from contamination. Installation of the internal sensor into the pylon should
only be performed by personnel who have read and become familiar with this procedure. If this
procedure is not followed correctly, the optical alignment of the CPI may be compromised or
damage to components of the CPI may result.
1. Verify CPI sensor head power and computer power are turned off.
2. Remove the internal sensor from the test stand following the correct procedure (Figure 6.5.1).
3. Verify the aft sample tube is in the position shown in Figure 6.5.2.
4. Review Figure 6.5.3 through Figure 6.5.10 before proceeding further.
5. Hold the internal sensor as shown in Figure 6.5.3 and begin lowering into pylon.
6. Protect the 45 PDS laser from the pylon screw boss by using the Delrin laser guard as a bumper
(Figure 6.5.4).
SPEC Inc. reserves the right to make improvements and changes to the CPI and related software at any
time and without notice
135
SPEC CPI Preliminary Technical Manual
7. Pivot the internal sensor around the laser guard and lower onto the pylon spreader as shown in
Figure 6.5.5.
8. Align the inlet adapter with the internal sensor as shown in Figure 6.5.6.
9. The internal sensor must be below the grommet surface as shown in Figure 6.5.7.
10. Figure 6.5.8 shows the installation direction of the internal sensor into the pylon.
11. Hold the internal sensor as shown in Figure 6.5.9 and begin sliding onto inlet adapter and pylon
spreader.
12. As the internal sensor slides on the inlet adapter and pylon spreader grommet, the gap decreases
as shown in Figure 6.5.10.
13. When the internal sensor reaches the position approximately shown in Figure 6.5.10, the pulling
fork tool is required to move the internal sensor into its final position.
14. Insert the aft sample tube into the internal sensor as shown in Figure 6.5.11. The sample tube and
internal sensor may need to be lifted slightly to clear the mount base.
15. Use the CPI pulling fork to begin sliding the aft sample tube into the internal sensor. Push the fork
and the internal sensor in the direction shown in Figure 6.5.12. If necessary, pull up slightly on the
green handle to help the aft tube clear the mount base as is slides forward.
16. The internal sensor will be in its final forward position when the pylon spreader and internal sensor
are fully mated (Figure 6.5.13).
17. Continue pushing the aft sample tube into the internal sensor with the fork until the holes in the
mount base align with the aft sample tube holes (Figure 6.5.14).
18. Install the 2X - #8-32 torx plus fasteners and tighten with the T15 torx plus driver (Figure 6.5.15).
19. Check that both fasteners have been completely tightened (Figure 6.5.16).
20. Figure 6.5.17 shows the first set of connectors to be mated.
21. Using a small flat-blade screws driver, fasten connectors J20S and J21S as shown in Figure
6.5.18. Use a 3/32” ball driver or hex wrench to fasten the mounting screws for connector J22S.
22. Mate camera connector and J23S as shown in Figure 6.5.19.
23. Verify all connectors have been mated and tightened (Figure 6.5.20).
SPEC Inc. reserves the right to make improvements and changes to the CPI and related software at any
time and without notice
136
SPEC CPI Preliminary Technical Manual
24. Before proceeding to install the pylon cover, operate the CPI in the pylon to verify no problems
occurred during the internal sensor installation.
25. After operation of the CPI has been verified, turn off the sensor power and proceed to the pylon
cover installation procedure.
Figure 6.5.1.
Figure 6.5.2.
Figure 6.5.3.
SPEC Inc. reserves the right to make improvements and changes to the CPI and related software at any
time and without notice
137
SPEC CPI Preliminary Technical Manual
Figure 6.5.4.
Figure 6.5.5.
Figure 6.5.6.
Figure 6.5.7.
Figure 6.5.8.
SPEC Inc. reserves the right to make improvements and changes to the CPI and related software at any
time and without notice
138
SPEC CPI Preliminary Technical Manual
Figure 6.5.9.
Figure 6.5.10.
Figure 6.5.11.
Figure 6.5.12.
Figure 6.5.13.
Figure 6.5.14.
SPEC Inc. reserves the right to make improvements and changes to the CPI and related software at any
time and without notice
139
SPEC CPI Preliminary Technical Manual
Figure 6.5.15.
Figure 6.5.16.
Figure 6.5.17.
Figure 6.5.18.
Figure 6.5.19.
SPEC Inc. reserves the right to make improvements and changes to the CPI and related software at any
time and without notice
140
SPEC CPI Preliminary Technical Manual
Figure 6.5.20.
6.6 Pylon Cover Installation
The CPI sensor head pylon cover must be installed for airborne operation of the CPI sensor head. The
following photographs show the sensor head lying flat on a table. The pylon should always be placed on a
soft material, such as foam, to avoid scratching the outer surface. The following procedure should also be
used when the sensor head is mounted on an aircraft.
CAUTION: The CPI pylon is a high performance assembly that serves as a protective housing for the
internal sensor head components and as the structural interface to the aircraft. It is hermetically sealed up
to approximately 65,000 ft altitude. O-rings and precision-machined surfaces are used to achieve this seal.
Improper disassembly/assembly of the pylon or mishandling of the components can result in damage that
will compromise the pressure integrity of the pylon. This may result in malfunctioning of the instrument
during flight. Disassembly/Assembly of the pylon should only be performed by personnel who have read
and become familiar with this procedure.
1. Verify CPI sensor head power is turned off.
2. Figure 6.6.1 shows the important areas of the pylon cover that must be aligned during installation
of the pylon cover.
3. Figure 6.6.2 shows the important areas of the pylon body that must be aligned during installation
of the pylon cover.
4. Hold the pylon cover as shown in Figure 6.6.3 and gradually lower onto the pylon body so the
tongue and groove and pylon connector are aligned.
SPEC Inc. reserves the right to make improvements and changes to the CPI and related software at any
time and without notice
141
SPEC CPI Preliminary Technical Manual
5. Gently lower the pylon cover into the position shown in Figure 6.6.4. If the pylon cover is not
properly aligned, it will not be flush with the pylon body at this time.
6. Study Figure 6.6.5 through Figure 6.6.11 before proceeding further.
7. Using the T15 Torx plus driver, install the center pylon fastener, but do not tighten it down
completely (Figure 6.6.5). It may be necessary to push the pylon cover down by hand slightly to
maintain alignment of the tongue and groove while the center fastener is being tightened.
8. 21X - #8-32 Torx plus fasteners are used to fasten the pylon cover to the pylon body (Figure 6.6.5
and Figure 6.6.6). 19 of the fasteners are ¾” long while 2 of the fasteners are only ½” long. The
locations on the pylon cover for the shorter fasteners are marked in black below the screw head.
Do not install ¾” fasteners in these two locations or the pylon will be damaged.
9. Install the remaining 20 fasteners in the proper locations. Using the T15 torx plus driver, engage
all the fasteners but do not tighten completely . As the various fasteners are engaged, verify the
pylon cover remains aligned to the pylon body (Figure 6.6.6).
10. After all the pylon fasteners have been engaged, begin the process of completely tightening each
of the fasteners (Figure 6.6.7). The gap between the pylon cover and body will be completely
closed as the cover is tightened down. Do not use excessive force on the fasteners as they may
break. It will be obvious when the fasteners are completely tight because they will be much harder
to turn.
11. Verify all fasteners are completely tightened. The ones initially tightened may require additional
tightening after all fasteners are completely installed.
12. Prepare to install the inlet nose cone onto the pylon as shown in Figure 6.6.8. It is very important
that the alignment pins mate correctly.
13. Align the pins and press the nose cone onto the pylon as shown in Figure 6.6.9. The nose cone
should completely engage onto the pylon if aligned correctly.
14. 4X - #6-32 socket head cap screws are used to mount the nose cone to the pylon (Figure 6.6.10).
15. Install and tighten the mount screws using a 7/64” ball driver as shown in Figure 6.6.11. Verify the
screws have been completely tightened.
16. Figure 6.6.12 shows the completely reassembled pylon, ready for aircraft installation.
SPEC Inc. reserves the right to make improvements and changes to the CPI and related software at any
time and without notice
142
SPEC CPI Preliminary Technical Manual
Figure 6.6.1.
Figure 6.6.2.
Figure 6.6.3.
Figure 6.6.4.
Figure 6.6.5.
Figure 6.6.6.
SPEC Inc. reserves the right to make improvements and changes to the CPI and related software at any
time and without notice
143
SPEC CPI Preliminary Technical Manual
Figure 6.6.7.
Figure 6.6.8.
Figure 6.6.9.
Figure 6.6.10.
Figure 6.6.11.
SPEC Inc. reserves the right to make improvements and changes to the CPI and related software at any
time and without notice
144
SPEC CPI Preliminary Technical Manual
Figure 6.6.12.
6.7
Cleaning CPI Optical Windows
During normal airborne operation, the optical windows of the CPI will become contaminated due to cloud
drops and streaming water. Contamination on the windows of the imaging system can result in a
decreased image mean and a severely contaminated background over time. Small levels of contamination
on the PDS system windows can result in an increased detector DC level (Figure 6.7.1) due to light
scattering around the dump spot caused by the contaminants. In an extreme case, a large amount of
contamination could reduce the detector DC level by blocking most of the laser light. During normal
operation, the laser power levels can be gradually reduced as contamination increases to lower the PDS
detector DC levels. When the lasers are being operated at less than half power (20 mW set point),
the PDS windows should be cleaned. The following procedure describes how to properly clean the
windows. The real time software must be operated during cleaning of the windows to provide
feedback that the correct result is being obtained.
Warning! The CPI optical windows are made of sapphire and coated with a high performance antireflective (AR) coating. The windows are bonded into the optical block using a thermally conductive epoxy.
This interface serves as a hermetic seal between the internal pylon and air flowing through the sample
tube. Extreme care must be taken when working around the windows. A special, non-metallic cleaning
tool has been provided with the CPI. DO NOT INSERT SHARP METALLIC OBJECTS INTO THE
SAMPLE TUBE THAT CAN SCRATCH THE COATED WINDOWS. ONCE THE AR COATING IS
DAMAGED, REPLACING THE WINDOWS IS EXTREMELY LABOR INTENSIVE AND COSTLY.
Cleaning of the optical windows should only be performed by personnel who have read and
become familiar with this procedure using only the tools and materials described in this procedure.
32. Figure 6.7.1 shows the enunciator panel and settings window indicating the PDS detector DC
levels are saturated. Reducing the laser power should decrease the DC levels. This is satisfactory
SPEC Inc. reserves the right to make improvements and changes to the CPI and related software at any
time and without notice
145
SPEC CPI Preliminary Technical Manual
until the laser powers are reduced to below approximately 20 mW for the DC level to drop below
8.8 V. The windows should be cleaned at this time.
33. Figure 6.7.2 shows the materials required to clean the windows. A can of electronics grade
compressed air is also necessary to blow off particulates (not shown). Purified reagent grade
methyl alcohol should be used as a cleaning agent because it does not leave streaks as it
evaporates and will not damage the AR coatings. 100% pure cotton swabs and the Delrin cleaning
tool provided with the CPI are also necessary. Do not use a type of cotton swab that can damage
the window. Can of electronics grade compressed air (not shown).
34. Blow compressed air over each of the windows to remove any particulates that may be present on
the windows. Do not tip the canned air as liquid will come out and contaminate the windows.
35. Take a cotton swab, break it in half, and insert one half into the hole at each end of the cleaning
tool. Break off the back of the swab so it is nearly flush with the Delrin rod to allow for maximum
clearance (Figure 6.7.3, Figure 6.7.4, Figure 6.7.5).
36. Figure 6.7.6 is a drawing showing the relative location of each of the windows in the optical block.
37. Read through each of the following steps before proceeding further.
38. One complete swab will be used for each window. Using the eyedropper from the methyl alcohol,
dispense one drop onto one of the half cotton swabs (Figure 6.7.7). The wetted swab will first be
used in a back and forth motion across the window to remove the contamination. The dry half of
the swab will be used to remove the residual alcohol.
39. Verify each window has been sprayed with canned air to remove particulates. Scrubbing a
particulate across the AR coated window will damage the coating.
40. As shown in Figure 6.7.8, insert the cleaning tool with the wetted end of the swab first, clean and
dry only the window you are targeting. Observe the result of the cleaning in the real time software.
The cleaning tool is inserted in the direction of airflow through the probe, from the end where the
nose cone mounts.
41. Each of the optical systems should be cleaned in order and each window must be specifically
targeted (Figure 6.7.9). For the PDS systems, verify the lasers are at full power. Observing the
PDS 45 detector DC level, clean and dry the input window and observe the DC level. If it slightly
decreased or stayed the same, move onto the PDS 45 output window. If the DC level increased
during cleaning, that window should be cleaned again until the DC level decreases or stays the
same.
42. View the PDS 90 DC level and clean the windows for that optical system.
SPEC Inc. reserves the right to make improvements and changes to the CPI and related software at any
time and without notice
146
SPEC CPI Preliminary Technical Manual
43. Figure 6.7.10 shows the DC levels reduced to satisfactory values after cleaning.
44. Clean the imaging system windows (Figure 6.7.9). Before cleaning the imaging system windows,
run the probe in Live Video Mode and locate any contamination visible by the CCD array. Observe
the effect of the cleaning on the CCD array image, there should be fewer contaminants visible after
cleaning. Also observe the image mean in real time. The image mean should increase or stay the
same after cleaning. If the image mean decreases, or more contaminants are present in the CCD
image, repeat the cleaning procedure.
45. Cleaning of the windows can occur when the probe is mounted to an aircraft, or in the laboratory, in
or out of the pylon. The nose cone can be removed (see Pylon Cover Removal Procedure) to
improve access to the optical windows. Replace the nose cone after cleaning.
46. The exact location of the windows depends on the orientation of the probe. This is critical for
identifying which window is being cleaned. Figure 6.7.8 and Figure 6.7.9 show the internal sensor
removed from the pylon in the laboratory with the input windows on top and the output windows on
the bottom. The PDS 90 input window is on the right and the output window is on the left in these
figures. If the probe is hanging upside down on an aircraft, all the positions will be flipped 180
degrees. Use Figure 6.7.6, Figure 6.7.8, and Figure 6.7.9 as a reference to locate the windows in
any situation.
SPEC Inc. reserves the right to make improvements and changes to the CPI and related software at any
time and without notice
147
SPEC CPI Preliminary Technical Manual
Figure 6.7.1. Enunciator panel shows “PDS Det. Invalid” and settings window showing saturated PDS DC
levels.
Figure 6.7.2.
Figure 6.7.3.
SPEC Inc. reserves the right to make improvements and changes to the CPI and related software at any
time and without notice
148
SPEC CPI Preliminary Technical Manual
Figure 6.7.4.
Figure 6.7.5.
Figure 6.7.6. Cutaway of optical block showing laser beam locations and window locations.
SPEC Inc. reserves the right to make improvements and changes to the CPI and related software at any
time and without notice
149
SPEC CPI Preliminary Technical Manual
Figure 6.7.7.
Figure 6.7.8.
Figure 6.7.9.
SPEC Inc. reserves the right to make improvements and changes to the CPI and related software at any
time and without notice
150
SPEC CPI Preliminary Technical Manual
Figure 6.7.10.
6.8 CPI Imaging System Camera Alignment
The CPI imaging system camera may need to be realigned if the imaging system goes out of alignment
over repeated airborne operation or it is removed from the instrument for servicing. This procedure
provides a fundamental overview for aligning and focusing the imaging system camera and lens assembly.
CAUTION: The overall quality of the images recorded by the CPI depends on the camera being properly
aligned and focused. The alignment procedure should only be performed by personnel who have read and
become familiar with this procedure.
1. An alignment pin is included with the CPI for use in centering and aligning the imaging system
(Figure 6.8.1).
2. Figure 6.8.2 shows the proper way to remove the cover from the alignment pin. The pin has been
machined on a lathe to come to a sharp point at an exact distance into the optical block. Be
SPEC Inc. reserves the right to make improvements and changes to the CPI and related software at any
time and without notice
151
SPEC CPI Preliminary Technical Manual
careful not to damage the pin during handling and never touch the end of the pin to any
surface, as it will deform.
3. The probe must be operated in Live Video Mode to perform this procedure. Live Video mode
shows the full 1024 x 1024 CCD array.
4.
The full 1024 x 1024 pixels will not fit on the main operators window. The horizontal dimension will
fit, but the vertical will not. Figure 6.8.3, Figure 6.8.4, and Figure 6.8.5 show the full horizontal
dimension of the array and the vertical scroll bar at the top, bottom, and center positions. Notice
that the corners of the array are clipped off by the imaging lens barrel. This is normal.
5. For this alignment procedure, the goal is to center the camera on the point of the pin, which has
been manufactured to be in the center of the sample volume. The vertical scroll bar must be
positioned exactly in the center, as shown in Figure 6.8.5.
6. Insert the alignment pin into the optical block as shown in Figure 6.8.6. Be careful not to bump the
point of the pin. Insert the pin as far as it will go into the optical block (Figure 6.8.7). At full
insertion, the pin will be very close to the center of the sample volume.
7. Look at Live Video and you should see the pin as shown in Figure 6.8.8. Notice how the scattered
light from the PDS 45 laser is visible. Also notice that the pin is exactly in the center of the CCD
array in this position.
8. Using a ruler on the computer monitor, locate the exact center of the CCD array and mark it with a
piece of tape on the computer monitor. If the pinpoint is not at this position, adjust the image mirror
tilt screws (Figure 6.8.9), until the pin is centered. It is first necessary to loosen the image mirror
lock screw shown in Figure 6.8.9 before adjusting the tilt screws.
9. Turn off the PDS lasers shown in Figure 6.8.10 and the point of the pin should be exactly in focus.
Slide the pin in and out of the optical block slightly to see how it looks when it goes in and out of
focus.
10. If the pinpoint is not exactly in focus, as shown in Figure 6.8.10, at this position in the sample
volume, it is necessary to adjust the focus. This is accomplished by pulling water drops through
the probe and adjusting the image lens focus adjustment shown in Figure 6.8.9.
11. Following the procedure describing how to set up the droplet atomizer, pull particles through the
probe and observe the ROI images (Live Video Mode must be turned off, PDS lasers turned on).
12. The focus adjustment barrel is locked in place with a piece of aluminum tape and a lock screw.
Remove the tape and slightly loosen the lock screw with an allen wrench. The focus adjustment
should be rotated (Figure 6.8.12) until the majority of the images are in focus as shown in Figure
6.8.11. Note: even for the best focus, there will always be some out of focus particles present.
The goal is to maximize the number of particles in focus. As you rotate the barrel, it is apparent
what constitutes an out of focus image.
SPEC Inc. reserves the right to make improvements and changes to the CPI and related software at any
time and without notice
152
SPEC CPI Preliminary Technical Manual
13. When the focus is optimized, tighten the lock screws and replace the aluminum tape.
14. Now insert the pin back into the optical block at the full insertion depth and turn off the PDS lasers.
If the pin is still in the center, but not in focus, slide the pin out of the optical block slightly until the
best focus is achieved. You should not have to move the pin very much to find the best focus.
15. Most likely, the pin will now be in focus slightly off the vertical centerline. Now readjust the image
mirror tilt screws to place the pin in the horizontal center of the array. The pin should still be in
focus. Now tighten down the image mirror lock screw (Figure 6.8.9).
16. Turn the PDS lasers back on and the PDS 45 laser should end up at the end of the pin, looking
very similar to Figure 6.8.8. By adjusting the focus while pulling drops through the probe, the
focus is set to the trailing edge of the PDS beams, where the image laser is set to trigger.
Adjusting the tilt of the imaging mirror, slightly relocated the center of the sample volume to
optimize the focus and particle detection.
17. The alignment and focusing procedure is now complete.
Figure 6.8.1.
Figure 6.8.2.
SPEC Inc. reserves the right to make improvements and changes to the CPI and related software at any
time and without notice
153
SPEC CPI Preliminary Technical Manual
Figure 6.8.3.
Figure 6.8.4.
SPEC Inc. reserves the right to make improvements and changes to the CPI and related software at any
time and without notice
154
SPEC CPI Preliminary Technical Manual
Figure 6.8.5.
Figure 6.8.6.
Figure 6.8.7.
SPEC Inc. reserves the right to make improvements and changes to the CPI and related software at any
time and without notice
155
SPEC CPI Preliminary Technical Manual
Figure 6.8.8.
Figure 6.8.9.
SPEC Inc. reserves the right to make improvements and changes to the CPI and related software at any
time and without notice
156
SPEC CPI Preliminary Technical Manual
Figure 6.8.10.
SPEC Inc. reserves the right to make improvements and changes to the CPI and related software at any
time and without notice
157
SPEC CPI Preliminary Technical Manual
Figure 6.8.11.
Figure 6.8.12.
SPEC Inc. reserves the right to make improvements and changes to the CPI and related software at any
time and without notice
158
SPEC CPI Preliminary Technical Manual
7.0
APPENDICES
7.1
Mechanical Drawing for Installation On Aircraft
Figure 7.1.1 CPI External Dimensions
SPEC Inc. reserves the right to make improvements and changes to the CPI and related software at any
time and without notice
159
SPEC CPI Preliminary Technical Manual
Figure 7.1.2 Pylon Interface
SPEC Inc. reserves the right to make improvements and changes to the CPI and related software at any
time and without notice
160
SPEC CPI Preliminary Technical Manual
Figure 7.1.3 Flow Geometry Dimensions
7.2 CPI INI
1.
2.
3.
4.
[System]
CameraType=1
ProbeRev#=3
PixelPolarity=0
5. [ROI Parameters]
6. ImageType=33280
7. DispMode=0
8. StartDrive=4 1 15
9. DriveCount=1 1 6
10.
BackgroundRate=600
11.
BkgPDSThreshold=10
12.
ROIThreshold=40 20
13.
ImgMeanMin=63 1 70
14.
ImgMeanMax=195 160
15.
ROIMinSize=4 0 400
10 36000
1 35
150
255
SPEC Inc. reserves the right to make improvements and changes to the CPI and related software at any
time and without notice
161
SPEC CPI Preliminary Technical Manual
16.
17.
18.
19.
20.
21.
22.
23.
24.
25.
26.
27.
28.
29.
30.
31.
32.
33.
34.
35.
36.
37.
38.
39.
40.
41.
42.
43.
44.
45.
46.
47.
ROIAspectRatio=640 2 900
ROIFillRatio=0.000006 0.000000 0.800000
ROIXPad=15 0 50
ROIYPad=6 0 50
DebugMode=0
FullFrame_Skips=0 0 10000
[Probe Settings]
Mode=3
Heaters=16383
Heaters2=0
;Setting1 = Forward Sample Tube Temp set point
Setting1=957 0 957
;
;Setting2 is the Upper Optical Block Temp set point
Setting2=957 108 1057
;
;Setting3 is the Lower Optical Block Temp set point
Setting3=957 108 1057
;
;setting 4 is the Central Sample Tube Temp set point
Setting4=1036 108 1057
;
;setting5 is the Aft Sample Tube Temp set point
Setting5=1057 -64 1057
;
;setting 6 is the nose temp set point
Setting6=957 -64 957
;
;setting 7 is the pylon temp set point
Setting7=1057 -64 1057
;
;setting 8 is the camera temp set point- currently has no
heater installed
48.
Setting8=813 -64 1057
49.
;
50.
; setting 9 is the APD45 temp set point
51.
Setting9=1057 108 1057
52.
;
53.
;setting 10 is the electronics temp set point - currently no
heater installed
54.
Setting10=241 -64 1057
55.
;
56.
;setting 11 is the imaging laser temp set point
57.
Setting11=296 290 1057
58.
;
59.
;setting 12 is the PDS45 laser temp set point
60.
Setting12=290 290 1057
61.
;
62.
;setting 13 is the PDS90 laser temp set point
63.
Setting13=298 290 1057
64.
;
65.
;setting 14 is the PDS45 laser power set point
66.
Setting14=4095 0 4095
67.
;
SPEC Inc. reserves the right to make improvements and changes to the CPI and related software at any
time and without notice
162
SPEC CPI Preliminary Technical Manual
68.
69.
70.
71.
72.
73.
74.
75.
76.
77.
78.
79.
80.
81.
82.
83.
84.
85.
86.
87.
88.
89.
90.
91.
92.
93.
94.
95.
96.
97.
98.
99.
100.
101.
102.
103.
104.
105.
106.
107.
108.
109.
110.
111.
112.
113.
;setting 15 is the PDS90 laser power set point
Setting15=4095 0 4095
;
;setting 16 is the PDS45 threshold set point
Setting16=207 100 1000
;
;setting 17 is the PDS90 threshold set point
Setting17=207 100 1000
;
;setting 18 is the Imaging laser current set voltage
Setting18=3792 0 3920
;
;setting 19 is the imaging laser pulse width set voltage
Setting19=3413 0 4000
;
;setting 20 is the minimum transit time set point
Setting20=35 10 255
; rev31 only
;Setting21=1035 10 50
;
;setting 22 is the APD90 amplifier temp set point
Setting22=458 0 1139
;
;Setting 23 is the camera temp set point
Setting23=59 0 992
;
;setting 24 is the PMT temp set point
Setting24=237 0 970
;
;setting 25 is the SLS laser temp set point
Setting25=1255 0 1555
;
;setting 26 is the SLS laser power set point
Setting26=25 0 4095
;
;setting 27 is the PMT high voltage set point
Setting27=26 0 1255
;
;setting 28 is the pylon cover patch temperature set point
Setting28=867 -1500 1057
;
;setting 29 is the imaging lens temperature set point
Setting29=838 450 1057
;
;setting 30 is the laser trigger timer threshold set point
Setting30=0 0 4095
114.
[Gains/Offsets for Readings]
115.
;
116.
;Gain/offset1 is the Forward Sample Tube Temperature (AD590) on
J2-1 and J2-19
117.
Gain/Offset1=0.029356 1.877500 10.000000 35.000000
118.
;
119.
;G/O2 is the Upper Optics Block Temp (AD590) on J2-2 and J2-20
SPEC Inc. reserves the right to make improvements and changes to the CPI and related software at any
time and without notice
163
SPEC CPI Preliminary Technical Manual
120.
Gain/Offset2=0.029356 1.877500 20.000000 35.000000
121.
;
122.
;G/O3 is the Lower Optics Block Temp (AD590) on J2-3 and J2-21
123.
Gain/Offset3=0.029356 1.877500 20.000000 35.000000
124.
;
125.
;G/O4 is the Central Sample Tube Temp (AD590) on J2-4 and J2-22
126.
Gain/Offset4=0.029356 1.877500 10.000000 35.000000
127.
;
128.
;G/O5 is the Aft Sample Tube Temp (AD590) on J2-5 and J2-23
129.
Gain/Offset5=0.029356 1.877500 10.000000 35.000000
130.
;
131.
;G/O6 is the Nose Temp (AD590) on J2-6 and J2-24
132.
Gain/Offset6=0.029356 1.877500 5.000000 35.000000
133.
;
134.
;G/O7 is the Pylon Temp (AD590) on J2-7 and J2-25
135.
Gain/Offset7=0.029356 1.877500 5.000000 35.000000
136.
;
137.
;G/O8 is the old Camera Filter/Drop Cop Tube (AD590) J2-8 and J226
138.
Gain/Offset8=0.029356 1.877500 -60 60.000000
139.
;
140.
;G/O9 is the APD45 Temp (AD590) on J2-50 and J2-51
141.
Gain/Offset9=0.029356 1.877500 0.000000 35.000000
142.
;
143.
;G/O10 is the Outside Air Temp (AD590) J2-10 and J2-28 (power
supply?)
144.
Gain/Offset10=0.029356 1.877500 0.000000 46.000000
145.
;
146.
;G/O11 is the DSP card Temp (AD590) J1-2 and J1-41
147.
Gain/Offset11=0.029356 1.877500 0.000000 60.000000
148.
;
149.
;G/O12 is the PMT Temp (Thermistor) J2-16 and J2-34
150.
Gain/Offset12=0.013736 21.7308 -20.000000 50.000000
151.
;
152.
;G/O13 is the SLS Laser TMP (Thermistor) on J2-17 and J2-35
153.
Gain/Offset13=0.013736 1.877500 -40.00000 60.000000
154.
;
155.
;G/O14 is the Inside Air TMP (AD590) on J2-9 and J2-27
156.
Gain/Offset14=0.029356 1.877500 0.000000 60.000000
157.
;
158.
;G/O15 is the Camera TMP (Thermistor) on J2-11 and J2-29
159.
Gain/Offset15= 0.013736 21.7308 0.000000 39.000000
160.
;
161.
;G/O16 is the Imaging Laser TMP (Thermistor) on J2-12 and J2-30
162.
Gain/Offset16= 0.013736 21.7308 0.000000 35.000000
163.
;
164.
G/O17 is the PDS45 Laser TMP (Thermistor) on J2-14 and J2-32
165.
Gain/Offset17= 0.013736 21.7308 0.000000 35.000000
166.
;
167.
;G/O18 is the PDS90 Laser TMP (Thermistor) on J2-13 and J2-31
168.
Gain/Offset18= 0.013736 21.7308 0.000000 35.000000
169.
;
170.
;G/O19 is the PDS45 Laser Power J1-22 (from photodiode monitor)
171.
Gain/Offset19= 0.0246752 -1.6774 15.000000 41.000000
SPEC Inc. reserves the right to make improvements and changes to the CPI and related software at any
time and without notice
164
SPEC CPI Preliminary Technical Manual
172.
173.
174.
175.
176.
177.
178.
179.
180.
181.
182.
183.
184.
185.
186.
187.
188.
189.
190.
191.
192.
193.
194.
195.
196.
197.
198.
199.
200.
201.
202.
203.
204.
205.
206.
207.
208.
209.
210.
211.
212.
213.
214.
215.
216.
217.
218.
219.
;
;G/O20 is the PDS45 DC Voltage on J1-42
Gain/Offset20= 0.00486000 0.000000 2.000000 8.800000
;
;G/O21 is the PDS90 Laser Power on J1-3(from photodiode monitor)
Gain/Offset21= 0.0232 0.7538 15.000000 41.000000
;
;G/O22 is the PDS90 DC Voltage on J1-23
Gain/Offset22= 0.00486000 0.000000 2.000000 8.800000
;
;G/O23 is the Imaging Laser Current Set Voltage Measured J1-47
Gain/Offset23= 0.0161133 27.5 20.000000 36.000000
;
;G/O24 is the Imaging Laser Pulse Width Voltage Measured J1-8
Gain/Offset24= 0.0161133 27.5 20.000000 38.000000
;
;G/O25 is the -5V Supply on J1-4
Gain/Offset25= 0.0029296875 -12 -5.25 -4.0
;
;G/O26 is the +5V Supply on J1-44
Gain/Offset26= 0.002930 0.000000 4.7500000 5.2500000
;
;G/O27 is the +12V Supply on J1-24
Gain/Offset27= 0.007354 0.000000 11.500000 12.500000
;
;G/O28 is the -12V Supply on J1-43
Gain/Offset28= 0.007354 -30.12 -12.500000 -9.000000
;
;G/O29 is the PDS45 Laser Power Set Point
Gain/Offset29= 0.0102775 -1.664985 12.000000 43.000000
;
;G/O30 is the PDS45 Threshold Set Point
Gain/Offset30= 0.000610352 0.000000 0.000000 60.000000
;
;G/O31 is the PDS90 Laser Power Set Point
Gain/Offset31= 0.0096665 0.754 12.000000 43.000000
;
;G/O32 is the PDS90 Threshold Set Point
Gain/Offset32= 0.000610352 0.000000 0.000000 40.000000
;
;G/O33 is the Imaging Laser Current Set Point
Gain/Offset33= 0.0085449 0.000000 0.000000 35
;
;G/O34 is the Imaging Laser Pulse Width Set Point
Gain/Offset34= 0.009353 0.000000 0.000000 38
;
;G/O35 is the Minimum Transit Time Set Point
Gain/Offset35= 20.83333e-9 0.000000 0.000000 1000.000000
220.
221.
; Dead Time:
Gain/Offset36= 1.0 0.000000 0.000000 0
222.
223.
; Rev31 only
;
SPEC Inc. reserves the right to make improvements and changes to the CPI and related software at any
time and without notice
165
SPEC CPI Preliminary Technical Manual
224.
225.
226.
227.
228.
229.
230.
231.
232.
233.
234.
235.
236.
237.
238.
239.
240.
241.
242.
243.
244.
245.
246.
;G/O37 is the APD90 Amplifier Temp (From Where?)
Gain/Offset37= 0.029356 1.877500 10.000000 35.000000
;
;G/O38 is the Vref10 Voltage (From Where?)
Gain/Offset38= 0.001464843 0.000000 1.000000 35.000000
;
;G/O39 is the Pressure Sensor
Gain/Offset39= 0.011014 -3.7594 0.000000 35.000000
;
;G/O40 is the SLS laser power setpoint- mw
Gain/Offset40= 0.007324219 0.000000 0.000000 0.600000
;
;G/O39 is the PMT voltage
Gain/Offset41= 0.007324219 0.000000 0.000000 0.400000
;;
;G/O42 is the pylon cover patch - therm
Gain/Offset42= 0.013736 21.7308 0.000000 35.000000
;
;G/O43 is the image lens temperture-ad590
Gain/Offset43= 0.029356 1.877500 10.000000 30.000000
;
;G/O44 is thelaser trigger timer thresh.
Gain/Offset44= 20.83e-9 0.000000 0.000000 2.3e-6
247.
248.
249.
250.
251.
252.
253.
254.
255.
256.
257.
258.
259.
260.
261.
262.
263.
[Display Options]
ROI DX=132
ROI DY=87
ROI Columns=5
ROI Rows=4
Pixel Size(um)=2.3
Flags=32790
Display Frame Skips=0
Histogram Bins=20
Histogram Min Size=0
Histogram Max Size=109
Histogram ITime=10000
Histogram Refresh=1000
Rates ITime=3000
Air Speed(m/s)=150
ROI XY Plot Max ROIs=1000
ROI XY Plot Reset When Filled=1
264.
265.
266.
267.
268.
269.
270.
271.
272.
273.
274.
275.
[Serial Data Parameters]
PortSettings=COM1: baud=9600 parity=N data=8 stop=1
;BlockSize=72
BlockSize=197
BlockMark=;\r
NumFields=30
Field1= [Hour] %02d
Field2= [Minute] %02d
Field3= [Second] %02d
Field4= [Pressure(mb)] %6.1f
Field5= [Temperature(C)] %6.1f
Field6= [Relative Humidity(%)] %5.1f
SPEC Inc. reserves the right to make improvements and changes to the CPI and related software at any
time and without notice
166
SPEC CPI Preliminary Technical Manual
276.
277.
278.
279.
280.
281.
282.
283.
284.
285.
286.
287.
288.
289.
290.
291.
292.
293.
294.
295.
296.
297.
298.
299.
300.
301.
Field7= [Wind Speed(m/s)] %5.2f
Field8= [Wind Direction(degree magnetic)] %5.1f
Field9= [Latitude(deg)] %11.7f
Field10= [Logitude(deg)] %12.7f
Field11= [Altitude(m)] %7.1f
Field12= [East Velocity(m/s)] %6.1f
Field13= [North Velocity(m/s)] %6.1f
Field14= [Vertical Velocity(m/s)] %6.1f
Field15= [4PI Top Channel a] %5ld
Field16= [4PI Top Channel b] %5ld
Field17= [4PI North Channel a] %5ld
Field18= [4PI North Channel b] %5ld
Field19= [4PI East Channel a] %5ld
Field20= [4PI East Channel b] %5ld
Field21= [4PI South Channel a] %5ld
Field22= [4PI South Channel b] %5ld
Field23= [4PI West Channel a] %5ld
Field24= [4PI West Channel b] %5ld
Field25= [4PI Bottom Channel a] %5ld
Field26= [4PI Bottom Channel b] %5ld
Field27= [Primary Voltage(V)] %5.1f
Field28= [Primary Current(A)] %5.3f
Field29= [Extra Voltage 1(V)] %7.5f
Field30= [Extra Voltage 2(V)] %7.5f
SampleInterval=1
HistoryLength=20
302.
; Below are parameters for the cycling of settings
303.
; Section below is required, and SettingsSamples must be greater
than 1
304.
[Settings Sampling]
305.
; Turns cycling ON/OFF
306.
DoSettingsSampling=0
307.
; Number of setting cycles
308.
SettingsSamples=4
309.
; Section below is required, and SampleDuration must be greater
or equal to 10
310.
[ROI Parameters Period1]
311.
; Duration of cycle period1 in seconds (>= 10)
312.
SampleDuration=11
313.
; Below you can specify any or no settings to change
314.
BkgPDSThreshold=35
315.
ROIThreshold=25
316.
ROIMinSize=4
317.
ROIAspectRatio=900
318.
ROIFillRatio=0.000006
319.
ROIXPad=6
320.
ROIYPad=6
321.
322.
323.
324.
[Probe Settings Period1]
; Probe Settings values for Period 1
; These are optional
; PDS45 Threshold
SPEC Inc. reserves the right to make improvements and changes to the CPI and related software at any
time and without notice
167
SPEC CPI Preliminary Technical Manual
325.
326.
327.
Setting16=800
; PDS90 Threshold
Setting17=800
328.
329.
330.
331.
332.
[ROI Parameters Period2]
SampleDuration=12.5
ROIThreshold=45
ROIXPad=14
ROIYPad=14
333.
334.
335.
[Probe Settings Period2]
Setting16=600
Setting17=601
336.
337.
338.
339.
340.
[ROI Parameters Period3]
SampleDuration=10.5
ROIThreshold=55
ROIXPad=10
ROIYPad=10
341.
342.
343.
[Probe Settings Period3]
Setting16=700
Setting17=701
344.
345.
346.
347.
348.
[ROI Parameters Period4]
SampleDuration=10.5
ROIThreshold=65
ROIXPad=10
ROIYPad=10
349.
350.
351.
[Probe Settings Period4]
Setting16=800
Setting17=801
7.3 DSP Memory Address Decodes and Heater Controls
A Programmable Logic Device (PLD) (U3) decodes the DSP’s external data memory for the CPI
as described in Table 7.3.1.
Table 7.3.1 DSP Memory Map
Address
0x2000
0x2001
Size (words)
2
2
R/W
R/W
R
Description
Housekeeping ADC AD7878
AD7878 Status Read
SPEC Inc. reserves the right to make improvements and changes to the CPI and related software at any
time and without notice
168
SPEC CPI Preliminary Technical Manual
0x2002
2
W
0x2004
0x2006
0x4000
0x4000
0x5000
0x5000
0x5001
0x5001
0x5002
0x5002
0x5005
1
1
1
1
1
1
1
1
1
1
1
W
W
R
W
R
W
R
W
R
W
W
Housekeeping Control
Register
System Control Register
General Purpose Latch
Dead Time Counter
Set Minimum Transit Time
Transit Timer
Clear Hold
Total Particle Counter
Clear Total Particle Counter
PDS Status Register
Clear PDET and IRQ Bits
Laser Pulse Timer
Each of these reads and writes is discussed below.
These writes occur in I/O memory space and require two separate I/O 1K pages. The first will
be at page 8: 0x2000
7.3.1 Reads
1. Housekeeping ADC (R/W 0x2000)
On a read, the AD7878 ADC is read from the control board into data bus D[0:11].
2. Dead Time (Read 0x4000)
A 24 bit counter is clocked off of the 12 MHz clock whenever a particle event that is transit
time qualified is not occurring. The upper 12 bits of this counter, DT[23:12], are read and
cleared by reading this address.
3. Transit Timer (Read 0x5000)
This 11 bit counter is clocked at 48 MHz for the duration of a valid particle event. It should
be read every time a particle event interrupt from the PDS state machine occurs.
4. Total Particle Counter (Read 0x5001)
This 10 bit counter is clocked every time a valid particle event occurs. If MT[12] is a 1, a
valid particle event is one in which the particle is detected for a minimum transit time
(default); otherwise it occurs whenever both PDS signals show a particles presence.
5. Status Register (Read 0x5002)
This PDET bit, read on D0, is high if a particle event interrupt has occurred.
SPEC Inc. reserves the right to make improvements and changes to the CPI and related software at any
time and without notice
169
SPEC CPI Preliminary Technical Manual
7.3.2 Writes
1. House keeping control (Write 0x2002)
On a write, data bus bits D[0:8] are latched into CTRL[0:8] in the DSP_HSKP logic.
CTRL[0:4] are clocked into TEMP_ADD_I[0:4],
TEMP_ADD[0:2] = TEMP_ADDI[0:2] = CTRL[0:2]
TEMP_ADD[0:2] are MUX selects on the relay board.
TS0 = !TEMP_ADD_I[3] = !CTRL[3]
TS1 = TEMP_ADD_I[3] = CTRL[3]
TS0 and TS1 are MUX enables on the relay board.
CTRL[5:8] are clocked into CC[0:3], the house keeping state machine down counter.
2. System Control Register (Write 0x2004)
Data bus bit D[1] is inverted and latched, with the latch output driving the watchdog IC, the
MAX6823. The DSP should write to this address, toggling the value on D[1] on each write.
3. Laser Pulse Timer (Write 0x2005)
A write to this address latches data bus bits D[0:12].
If D[11] = 1, a timer counts down from the value latched off of D[0:10,] at 48 MHz, firing
the laser after the count reaches 0 in the presence of a particle. This allows programmable
delay for firing the laser and should come from the data system. Writing a 0 to bit D[11]
disables this feature.
If D[12] = 1, the PDS state machine goes into diagnostic mode (FORCE_TRIG in the
NewStateMachine.ppt slide #4. This bit should be a 0 in regular operation, and should be
controlled by the data system.
4. General Purpose Latch (Write 0x2006)
A 9 bit general purpose register that latches data bus D[0:8] to GP[0:8] in the DSP_HSKP
CPLD. The bits are defined as:
GP[1]: General purpose bit going to the SLS board; presently undefined.
GP[2]: XMIT HDLC. When pulsed high, an HDLC transfer is initiated.
GP[3:7]: Undefined.
GP[8]: Heater Enable. When high, TMR0 and TMR1 outputs drive the PMT and SLS laser
heaters. They are disabled at reset in case of DSP failure.
5. Set Minimum Transit Time (Write 0x4000)
A write to this address latches data bus D[0:12] to the TT_PDS logic’s MT[0:12] bits.
D[0:11] sets the minimum transit time count that is counted down at 48 MHz.
Writing a 1 to D[12] enables minimum transit time qualification, 0 disables. This comes
from the data system, but on power up, it should be enabled, and currently it is, with
MT[0:11] = 3.
6. Transit Time Qualifier Enable / Set (Write 0x4000)
SPEC Inc. reserves the right to make improvements and changes to the CPI and related software at any
time and without notice
170
SPEC CPI Preliminary Technical Manual
Writing a 1 to data bus bit D[12] requires the PDS state machine to transit time qualify
particle events. A down counter is preset to the value written in D[11:0] and counts down
using A 48 MHz clock. If a particle stops being detected before the counter reaches zero, it is
not imaged, so long as D[12] was written with a value of 1. The state machine defaults to
MT[12] (MT[12:0] is the registered latch that holds values written to this address) = 1, MT
[11:0] = 3. Thus, by default, a particle must be present for three 48 MHz clock periods.
7. Clear Hold (Write 0x5000)
The HOLD bit in the PDS state machine goes high when a valid particle event, the expiration
of the transit time threshold in the case of a long duration particle event, or an EXTRIG signal
comes from the data system computer. It forces the state machine to wait until the DSP
responds to the interrupt that is generated at the same time the HOLD bit goes active.
8. Clear Total Particle Counter (Write 0x5001)
See item 2. A write to this address clears the counter.
9. Clear PDET Bit and IRQ0 Bit (Write 0x5002)
See item 3. A write to this address clears the PDET and IRQ0 bits.
10. Trigger Threshold Value (Write 0x5005)
If written with data bus bit D[11] = 1, the imaging laser will fire when the transit timer (see 1,
above) reaches the value written at address 0x5005 on the data bus bits D[10:0].
D[12] = 1 forces the PDS state machine in to diagnostic mode, where camera frames will be
sent to the PC data system no matter what the state of particle events. If a PDS channel gets
stuck high, the state machine will not work in normal operation. Setting D[12] = 1 while
writing to this address will bypass that problem. Normally, D[12] should be set to 0.
The DSP controls the PDS trigger thresholds with a 12-bit, four output AD5327 Digital to
Analog Converter (DAC) which outputs voltages between 0 and 2.5 V. Two other DACS of the
same type will be used on the system, and all three utilize the SPI serial interface protocol. One
is used to control the PDS45, PDS90 (SLS systems will not have a PDS90 signal) and imaging
laser power set points; the other, on a system with an SLS, will control the PMT high voltage set
point and the SLS/PDS laser power. These DACS replace the need to perform writes to
addresses 0x0404 through 0x0407 and 0x3001 and 0x3002.
All heaters on the UAV CPI are controlled by turning on bits in the data written, using the SPI1
channel, with SPI1_SEL1 (PF3). The SLS system PMT and laser heaters are driven by TMR0
and TMR1 outputs, respectively. These outputs feed into the DSP_HSKP CPLD, and require
that GP[8] be written with a value of one to enable the heater (see WRITES, item 4, above). The
relays and FETs that control power are on the relay and sensor board that piggybacks the main
DSP control board (see Figure 3).
SPEC Inc. reserves the right to make improvements and changes to the CPI and related software at any
time and without notice
171
SPEC CPI Preliminary Technical Manual
Table 7.3.2. Heater Control Bits and Applied Power
Bit
Location
0
FWD Sample
TubeNOTE 1
Optics Block
UpperNOTE 1
Optics Block
LowerNOTE 1
Central
Sample Tube
AFT Sample
Tube
Imaging Lens
PDS 45 APD
PDS 90 APD
Pylon Cover
Patch
Pylon Slug
Pylon Base
Patch
IMG LSR
PDS 45 LSR
PDS 90 LSR
Spare DC
Camera
PMT (SLS)
SLS LSR
1
2
3
4
5
6
7
8
9
10
11
12
13
14
15
TMR0
TMR1
Supply
Voltage
115 AC
Power
(Watts)
159
Relay / FET
115 AC
197
K4
115 AC
197
K5
115 AC
100
K6
115 AC
190
K7
115 AC
115 AC
115 AC
115 AC
-6.6
6.6
330
K8
K9
K10
K12
115 AC
115 AC
330
400
K13
K14
115 AC
15V DC
15V DC
15V DC
115 AC
115 AC
115 AC
48
7.7
7.7
-30
???
30
K1
Q2
Q3
Q4
K15
K11
K3
K2
NOTE 1: K2, K4 and K5 can be depopulated and Q5, Q6 and Q7 (normally not installed) can be populated to
provide an alternate set of 3 +15V DC heaters.
7.4 CPI ROI Data File Format
(as given by Jeffrey Schuenke to Brad, Paul, and Tara Jenson on 6/23/1999)
A raw .roi file is structured as follows:
{File header} {House Keeping block } {House Keeping block } … {Frame Block}… {House
Keeping block }…
SPEC Inc. reserves the right to make improvements and changes to the CPI and related software at any
time and without notice
172
SPEC CPI Preliminary Technical Manual
Where the HK blocks occur on 1 second intervals until a frame block is output. The frame block
has priority, so multiple frame blocks may occur before the next HK block. If the frame blocks
take more time to output than 1 second, the required HK blocks are buffered, and output when
possible. Each HK block and each Frame block has a time stamp in seconds of year. Each
Frame block has a matching HK block with the same time stamp. This HK block will always
come after the Frame block and has the deadtime value associated with the frame.
File header structure
Field name
Ver
Year
Month
DX
DY
Text
Type
Int
Int
Int
Int
Int
BYTARR(70)
Frame header Structure
Field name
Type
BlockNum
0
ItemSize
0L
Ver
0
ROIsCount
0
TotROIsSize
0L
day
0B
hour
0B
minute
0B
sec
0B
msec
0
ImgType
0
Sx
0
Sy
0
Ex
0
Ey
0
BGRate
0
BkgPDSThresh 0
FrmsProc
0L
Description
File version
Year
Month
Max Width of frame
Max Height of frame
Misc. text descriptor
Description
Header Block Marker
Total bytes in this frameheader only
Version number of this frame
number of ROI's in this frame
total bytes of IMAGE data
time of frame 1-31
time of frame 0-23
time of frame 0-59
time of frame 0-59
time of frame 0-999
bit array with data information
upper left X corner of image
upper left Y corner of image
lower right X corner of image
lower right Y corner of image
time between backgrounds in tenths of a second, 0 means no
bckgnds
number of machine strobes before a background can be collected
total number of frames processed so far
SPEC Inc. reserves the right to make improvements and changes to the CPI and related software at any
time and without notice
173
SPEC CPI Preliminary Technical Manual
IThresh
ROIErr
ROIMinSize
ROIAspect
ROIFill
ROIFCount
ImgMean
BkgMean
Spare1
ROIXPad
ROIYPad
StrobeCount
FrmsSaved
ImgMinVal
ImgMaxVal
ROIsSaved
ChkSum
PDSHead
0B
0B
0
0.0
0.0
0L
0B
0B
0
0
0
0L
0L
0B
0B
0L
0
INTARR(
3)
0L
0
0
0
0
0
0
0
0
Time
ArrivalT1
ArrivalT2
TransitT
Missed
PHeight1
PHeight2
PDSChkSum
ProbeMode
Image threshold 0-255, 0 means no thresholding done.
ROI Rejection/Failure code
min particle rejection size
particle aspect criteria
min value for (#pixels within ROI threshold)/# pixels in ROI)
# pixels within ROI above threshold
image mean value
background mean value
Unused
width of border around sides of particle in pixels
width of border around top/bottom of particle in pixels
Probe's strobe count per image
number of frames saved to disk so far
min image mean for an acceptable frame
max image mean for an acceptable frame
total number of ROI's saved so far
Checksum
PDS data block
seconds of year
Arrival time ???
Arrival time ???
Transit time ???
number of particles missed while processor is busy
??
?? Note: header file only has one of these listed!!
check sum
probe mode
Image header - Data contained in the raw ROI file from the instrument
Field Name
BlockMark
ROIInfoSize
Type
0
0L
ROIVer
sx
sy
0
0
0
Description
Block mark
Total bytes in this block ( variable because of the last two
fields)
Tracks this structures version
Start X upper left corner of roi ( relative to CCD frame)
Start Y upper left corner of roi ( relative to CCD frame)
SPEC Inc. reserves the right to make improvements and changes to the CPI and related software at any
time and without notice
174
SPEC CPI Preliminary Technical Manual
ex
0
End X upper left corner of roi ( relative to CCD frame)
ey
0
End Y upper left corner of roi ( relative to CCD frame)
PixBytes
0
Bytes per pixel in image
Flags
0
Contains info about particle ( see definition below)
Len
0.0
Computed Length of particles major axis
SLen
0L
1D index coordinate of start of length vector
ELen
0L
1D index coordinate of end of length vector
Wid
0.0
Computed width of particle ( perpendicular to length vector)
SWid
0L
1D index coordinate of start of width vector
EWid
0L
1D index coordinate of end of width vector
Dark
0
Info on particle depth and cut-off (See definition below)
Area
Float Area of roi in pixels
Perimeter
Float Perimeter of roi in pixels
(ROI image data follows each image header. The .min file leaves this data out)
SPEC Inc. reserves the right to make improvements and changes to the CPI and related software at any
time and without notice
175
SPEC CPI Preliminary Technical Manual
Object Structure Version 30
Field name
Organization
BlockMark
Scalar
ROIInfoSize
Scalar
Type
Int
Long
ROIVer
Sx
Sy
Ex
Ey
PixBytes
Scalar
Scalar
Scalar
Scalar
Scalar
Scalar
Int
Int
Int
Int
Int
Int
Flags
Len
Slen
ELen
Wid
Scalar
Scalar
Scalar
Scalar
Scalar
Int
Float
Long
Long
Float
SWid
EWid
Dark
Area
Perimeter
Centroid
Roundness
X_Moment
Y_moment
Rubber_Band
Fractal_dim
Harmonic_len
Bound_len
Sample_period
Focus
FocusMin
FocusMax
FocusStdDev
FocusGoodSamples
CutOff
Scalar
Scalar
Scalar
Scalar
Scalar
1D Array
Scalar
Scalar
Scalar
Scalar
Scalar
Scalar
Scalar
Scalar
Scalar
Scalar
Scalar
Scalar
Scalar
Scalar
Long
Long
Int
Float
Float
Int
Float
Float
Float
Float
Float
Int
Int
Float
Byte
Byte
Byte
Float
Byte
Byte
Description
Block mark
Total bytes in this block ( variable because of the last two
fields)
Tracks this structures version
Start X upper left corner of roi ( relative to CCD frame)
Start Y upper left corner of roi ( relative to CCD frame)
End X upper left corner of roi ( relative to CCD frame)
End Y upper left corner of roi ( relative to CCD frame)
Bytes per pixel in image ( if zero then image data
excluded!)
Contains info about particle ( see below)
Computed Length of particles major axis
1D index coordinate of start of length vector
1D index coordinate of end of length vector
Computed width of particle ( perpendicular to length
vector)
1D index coordinate of start of width vector
1D index coordinate of end of width vector
Info on particle depth and cut-off (See definition below)
Area of object in square pixels
Perimeter of object in pixels
Centroid of particle ( 2 elements )
Measure of particle roundness
1/2 area on each side of vert line
1/2 area on each side of horiz line
Measure of boundary roughness
Fractal dimension
Number of elements in Harmonic array
Number of elements in Boundary array
Sample period of harmonic array in pixels
% focus 0-100 Mean of 20 points on perimeter
Min of 20 points on perimeter
Max of 20 points on perimeter
Std Dev of 20 points on perimeter
?
% particle is cut-off 0 – 100
SPEC Inc. reserves the right to make improvements and changes to the CPI and related software at any
time and without notice
176
SPEC CPI Preliminary Technical Manual
Crystal
Confidence
P1
P2
P3
P4
Harmonics
Boundary
Scalar
Scalar
Scalar
Scalar
Scalar
Scalar
1D Array
1D Array
Byte
Byte
Float
Float
Float
Float
Float
Int
Scalar type index meaning TBD
Factor assessing confidence in particle use 0-10
1 if manual features set
Place holder
Place holder
Place holder
Circular harmonics of boundary(var. len)
Location of boundary pixels in ROI array ( 1D indicies)
(var. len)
(note: roi image data may follow at this point if PixBytes not equal to zero. Option not currently
implemented)
An object file consists of a file header (see below), and a sequence of object frames. Object
frames conatin a frame header and a sequence of object headers, one for each ROI in the
original frame.
Dark: 2-byte word
Byte
Meaning
1st byte
darkness number
nd
2 byte
LS 5-bits = Particle cutoff index:
0-31 (no cut-off to almost fully cut-off)
Flags: 2-byte word
Bit Number
Meaning
0-7
out of focus number
8-11
crystal type 0=circular 1=column 2=stellar 3=other
12
Not used.
13
ROI was drawn manually.
14
Crystal type was manually corrected.
15
Particle was manually rejected.
Scan List structure; used to gather file info at load time
Field Name
Type Description
BlockMark
int
Marker
Fpos
long
File position
ImgType
int
Image type
1 = normal frame with roi's
2 = background
0 = error type
-1 = house keeping block
SPEC Inc. reserves the right to make improvements and changes to the CPI and related software at any
time and without notice
177
SPEC CPI Preliminary Technical Manual
HTime
day
long
byte
hour
byte
minute
byte
sec
byte
msec
ROIsCount
HouseSize
int
int
int
House keeping time
Day From header unless HK, then computed from
Htime
Hour From header unless HK, then computed from
Htime
Minute From header unless HK, then computed
from Htime
Sec From header unless HK, then computed from
Htime
Msec From header unless HK, then 0
Number of ROI’s in block, 0 for HK blocks
Size of House Keeping block or 0 if Image block
SPEC Inc. reserves the right to make improvements and changes to the CPI and related software at any
time and without notice
178