1
FP7-ICT-247615 - HEAP
Free Software-Based Flow for the Visualization of the
Parallelism in the Program Execution -- User Manual and Tutorial
2. An example of parallelization using the HEAP tools
In this section we illustrate the use of the HEAP parallelization flow and tool suite to one of the
HEAP applications from WP5, namely the ray tracer.
Ray tracing, which mimics the visual process by simulating light rays from light sources, to objects,
to the eye, is a widely known “embarrassing parallel” application. However, taking an existing sequential implementation without any prior knowledge of the software, guided only by a classical
source code profiler can be a daunting task. The gprof output may look like this:
%
cumulative self
self
time seconds
seconds
calls
name
16.61 2.79
2.79
788215425 Dot
13.78 5.12
2.32
141631877 IntersectQuad
8.26 6.50
1.39
281277610 intersectObject
8.02 7.86
1.35
139645733 IntersectSphere
7.90 9.19
1.33
69361053
NormalizeVec3
7.69 10.48
1.29
220258108 Cross
6.42 11.56
1.08
268195824 Mul1Vec3
6.12 12.59
1.03
350638670 Sub2Vec3
4.46 13.34
0.75
45257208
IntersectionShadowWithScene
4.22 14.05
0.71
191964084 Add2Vec3
3.77 14.69
0.64
330958926 UpdateStat
3.36 15.25
0.56
15085736
CastShadowRay
...
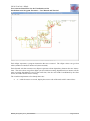
however, this execution time profile does not provide any clue about how the data flows through the
code. On the other hand, the output of the HEAP data dependency profiler, shown below, shows a
clear uni-directional data flow through some of the functions that are at the top in the cumulative profile above, namely intersectObject, intersectQuad and intersectSphere.
This provides the developer with the required clue about where to focus his or her attention: loops
involving these functions. These uni-directional data dependencies are essential to highlight both
pipeline and doall parallelism, because they clearly identify stateless parallelizable computation.
HEAP_D3.6_PTO_V1.3_20120402.doc
Page 8 of 23