1
www.scb.se
PC-Axis 2003
Users Manual
PC-Axis 2003 huvudmodul inklusive funktion
för att skapa egna indelningar
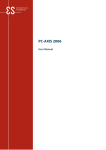
News in PC-Axis 2003
The most important news in PC-Axis 2003:
- The table cells can get a thousand delimiter
- Optional menu for long texts in variable values
- A link between PC-Axis and Excel is
automatically established when installing PCAxis
- New function to produce HTML list of contenst
for a PC-Axis database
List of contents
LIST OF CONTENTS.........................................................................................................1
SOME INFORMATION ON PC-AXIS AND ITS HELPFUNCTIONS.........................2
A WALK THROUGH OF THE TOOLBAR ..................................................................................3
OPEN A DATABASE IN PC-AXIS. ..................................................................................4
MAKE A TABLE IN PC-AXIS ..........................................................................................4
TO SAVE A TABLE............................................................................................................9
TO EDIT A TABLE IN PC-AXIS ....................................................................................11
TO DO SIMPLE CALCULATIONS USING PC-AXIS.................................................12
UPDATING TABLES .......................................................................................................14
TO MAKE GRAPHS IN PC-AXIS ..................................................................................15
PX-MAP – PRESENTS THE STATISTICS AS A THEMATIC MAP ........................17
ABOUT ADVANCED FUNCTIONS IN PC-AXIS.........................................................18
TABLE SIZE......................................................................................................................21
CLASSIFICATIONS… .....................................................................................................23
TO CREATE A CLASSIFICATION BASED ON AN EXISTING VALUE SET. .................................23
TO CREATE A CLASSIFICTAION BASED ON A NEW VALUE SET. ...........................................26
WHAT IS WRONG?.............................................................................................................26
HISTORY ...........................................................................................................................28
PC-AXIS FOR DISSEMINATION OF STATISTICS FROM OTHER
ORGANISATIONS............................................................................................................28
OVERVIEW OF THE PC-AXIS FAMILY SOFTWARE .............................................28
CONTACT PERSON ........................................................................................................28
1
PC-AXIS 2003
www.scb.se
Some information on PC-Axis and its helpfunctions
There a few things good to know before you start using PC-Axis for the first time.
If you let the mouse stay over a toolkey in the toolbar a small yellow frame will tell the
purpose of that very toolkey.
If you need more help, please use the toolkey that opens the help function. It is on the farest
right position in the toolbar. This key is the way to get help for menus, commands and how
to work with PC-Axis. Press the F1 keyboardkey to get context related help where ever you
are in PC-Axis.
2
PC-AXIS 2003
www.scb.se
A walk through of the toolbar
Öpen a database
Footnote
Select new values
Save
Print out
Undo
Copy
Pivot (clockwise)
Pivot (anti-clockwise)
Pivot any option
Sum
Percent
Per mille
Add
Subtract
Multiply
Divide
More information
Graphs
Maps
Search help
3
PC-AXIS 2003
www.scb.se
Open a database in PC-Axis.
Picture 1.
When you are opening a table in PC-Axis, there are optional ways of doing it. If the
program is running, you just press File – Open Database or you can click on the button
and you will find the catalogue which contains the current database or table. On this
picture you can see the PC-Axis files all having the extension PX.
Picture 2
To be able to use the Classification function (see below) you must set the right catalogue
for the classifications belonging to the current database. It can be changed using the button
Change Classification.. on Picture 2.
When you are going to select a new table you either can click on it, or mark it using the
mouse and then press the ENTER key.
Let us say that you are interested in Population statistics – press the subject ”Population”,
select the subcatalogue ”Population statistics” and then select the table named Mean
population by region, age, period and sex. See Picture 3.
Make a table in PC-Axis
Now it is time to select values for the variables – decide what the table shall contain.
4
PC-AXIS 2003
www.scb.se
Selected values:
CTRL+mause
Click here to
select all values
Picture 3
Select values to the table
How to select all
About classification of
values
If you desire all values in a variable you can click on the namebar for the very variable
selection box. As in sample on Picture 3, where all, two, values will be selectged by
clicking on the word sex.
If you only want some of the values, just press the CTRL-button at the same time as you
click the left mousebutton on the desired values. Then only those selected will be put into
the table.
If you wish to get all the variables and all their variable values, just click on the button All.
All variables can be grouped into a classification if desired. It shall be done before you
select all variables with the ”All” button. See Pictureers 4 and 5.
You can use the classifications if you have a table which is more detailed than you want it
to be. For example one-year classes or municipalities. You can create your own age
classifications or make your own areas based on the municipalities.
If you want to classify on variable age – in the selected table it is in one year classes, and
you would prefer it to be five year classes.
On the picture where you select the variables there is a button named Aggregate. Press it
and it looks like Picture 4. You will find what is avialable for classification for this very
table, in this case the variables age and region. We select age.
Picture 4
5
PC-AXIS 2003
www.scb.se
Press OK. In next window you will find a list showing the different classifications
available.
Picture 5
Select the 5-yearclasses and press on the OK button.
Then you will come back to Picture 3, but the list of ages has been changed to 5yearclasses:
Picture 6 a
When all selections are finnished, click OK and the table appears on the screen.
If there are very long texts on the variable values there is an option in the new version 2003
of PC-Axis to get an alternative menu. Just press
Om det är mycket långa texter för variabelvärden finns från och med version 2003 av PCAxis en möjlighet att få en annan layout genom att trycka på knappen Långa texter. Då får
man denna bild istället:
6
PC-AXIS 2003
www.scb.se
Figure 6 b. If you tick the option “Use this layout as default”, the only way to alter back to
the original layout can be done in the menu View, Advanced, the tag “Information” where
you can tick the box “Show value selection in layout with small listboxes”.
The table will appear similar in both cases.
Picture 7
Now you can click on the tool key with the icon of a star which gives the footnote
information for this very table. In this case latest up date, source, contact persons etc.
7
PC-AXIS 2003
www.scb.se
If there are additional information available the icon showing a little book in the toolbar
will be activated. Press it and the book will lead you to additional documents concerning
this very material. It will be opened according what type of textfile it is written.
8
PC-AXIS 2003
www.scb.se
To save a table
When you are satisfied with the layout of the table you can save it on your hard disc or a
server. Use the pulldown menu ”File, Save as.. "
Picture 8
Then a windows turns up where you can enter where to save the file and name the file.
Location
Name
Picture 9
If you would like to save the table in another file format you just select the tag ”Convert” as
in Picture 10.
9
PC-AXIS 2003
www.scb.se
Picture 10
In the listbox File Format you can save the table in any of the optional file formats.
10
PC-AXIS 2003
www.scb.se
To edit a table in PC-Axis
If you are not satisfied with the layout of the table there are some different things to be
done to change it.
The Pivot function can be used to let the variables change places in the table. Stub and
, which give
heading can be switched according to your own needs. Press this button
you total freedom to move around with the variables. You are using a drag and drop
technique as showed on Picture 11:
Picture 11
When you are satisfied just press OK and the new table turns up. This can be repeated so
you will realy be satisfied with your table.
11
PC-AXIS 2003
www.scb.se
To do simple calculations using PC-Axis
There are some simple tasks able to carry out with the PC-Axis calculation toolbox. Let us
study some samples.
Click on the pull down menu Calculate as showed on Picture 12 and you will find the
different options.
Picture 12
Let us try the percent calculation as is marked in the picture 12 above. Then the following
window pops up:
Picture 13.
12
PC-AXIS 2003
www.scb.se
If we wish to calculate the ratio female and male compared to the total we select the total
for the variable sex as the base for the operation. Then you will be prompted a name of the
new established value.
Picture 14
PC-Axis will automatically suggest the name ”Per cent”, you can change it if you wish and
then click OK.
Now all the figures will turn up on the screen. If you did not wish to have the initial values
left in the table there is a possibility on the base selection window to tick according to your
wishes. See picture 15.
Picture 15
Change texts in the table
It is also possible to change the texts in the column headings and the stub. Use Edit Change
texts... Here you mark the variables you want to modify, the variable name and also
variable values are possible to change.
13
PC-AXIS 2003
www.scb.se
Updating tables
If you have a table that contains the population in sixteen municipalities, distributed on age,
sex and time (1995-2000), and the figures for 2001 has become published it is possible to
update with the new figures instead of download the whole table again from Sweden’s
statistical databases on Internet.
You just link a table to another table (adding new values).
It is also possible to overlay a table with another table (adding a new variable), for example
if imigration and emigration are retrieved from two separate tables they can be put together
in a very large table using this function.
Please notice when using these two functions the tables have to be very similar. So if
something is changed in one of the tables the other has to be changed in exactly the same
manner to fit in together.
Picture 16
To use these functions, click Edit and then Link with table../Overlay with table. See Picture
16.
You will then be prompted what catalogue to pick up the second table from. Be aware that
you are only offered the tables that are possible to put together. Select the table you want to
have and click OK. Then your table on the screen have got new values or variable.
If you are using Link with table it is a matter of adding a new time period.
When using Overlay with table it is because you have to similar tables possible to put
together.
14
PC-AXIS 2003
www.scb.se
To make graphs in PC-Axis
When you have a table in PC-Axis it is possible to make a graph out from it. It is possible
to make different types of graphs, like charts, line diagram and population pyramids. There
is also possible to make thematic maps that will be showed later on.
If you want to make a graph, please click on this icon:
up where you can select from different types of graphs.
and the picture below will turn
Picture 17
If you press the button ”Adjust..” you will get some options to change in the graph.
Picture 18
15
PC-AXIS 2003
www.scb.se
To coopy a graph
You can use the option copy in the graph window and insert the graph into another
Windows program like MS-Word and MS-Excel. Just click on this button
.
When arriving to the other program where the graph is supposed to be inserted use the
”paste special” option using ”bitmap” format. If not using this, a table will apear instead of
the graph in the windows program.
Notice
Notice that some of the graph options need a certain structure of the table. For example a
population pyramid desires that the age variable is in the stub alone and the sex variable is
as column heads. If you are violating these rules PC-Axis will tell you what is wrong for a
certain type of graph.
When you have moved a diagram to Excel you must notice that it is just a picture which is
not possible to adjust in Excel.
If you on the other hand transfer a table it is of course possible to continue to work on this
table in Excel.
16
PC-AXIS 2003
www.scb.se
PX-Map – presents the statistics as a thematic map
Using the PX-Map makes it possible to transfer your table information into a thematic map.
If you are using the CD-ROM Statistics Across the Borders and want a regional distributed
table to be a map, just click the globe icon in the toolbar presented as maps. If it is not possible the icon is non collored.
. All tables can not be
This is how a thematic map in PX-Map looks like:
If you retrieve a table from the Sweden’s Statistical databases there is not yet made any link
to Maps.
To make a Map link
If you insists to make a map from a table retreived from Sweden’s Statisitcal Database on
the Internet, download the table in PC-Axis file format to your computer and save it. Then
you open the file in a text editor like MS-Word. Search for a section looking like this:
TITLE="Mean population by region, age, period and sex.";
CONTENTS="Mean population";
UNITS="number";
STUB="region","age";
HEADING="period","sex";
MAP("region")="Sweden_municipality";
Insert the line:
MAP("region")="Sweden_municipality";
You have to insert this line after STUB and HEADING which is in the beginning of the
file.
When you save the file again (be aware of that MS-Word tries to change the extension of
the file when saving in another file format than doc. Save in txt format and change the
extension to PX) it is possible to find the file from PC-Axis and make a map in PX-Map. A
more detailed description of PX-Map is in a separate Users Manual available on the CDROM Statisitcs Across borders.
17
PC-AXIS 2003
www.scb.se
About advanced functions in PC-Axis
The presentation of figures in the table cells can optionally hold thousand delimiters. Use
the menu View, Advanced
Picture 19
Where you select the tag ”Format for data cells”:
Figure 20.
Then mark the type of thousand delimiter you want to use in the tables. The selected option
will work from the next table opened in PC-Axis.
18
PC-AXIS 2003
www.scb.se
PC-Axis optionally can be linked to another software. Then it is possible to launge the other
program from PC-Axis moving the present table into that very program. To make such a
link use the menu View, Advanced. The installation program will automatically establish
such a link to MS-Excel if it is available on the computer.
In the new window select a folder named More Features and then click on Additions. Now
use the folder Other programs andthe button
window:
. And you will find this
Picture 21
In the dialog box there are options to create links to four other programs. To create such a
link PC-Axis needs the following informations:
−
The name of the program is entered in the Menu text field. If a & sign is entered before
a letter in the name this gives a key shortcut for that letter. The program name will
appear as a line in the File menu in PC-Axis.
−
The file type for the program is entered in the field File type.
−
In the field Program the path and the name of the exe-file has to be entered using
Browse support. If you can not find the program search for it using the File explorer
search function.
When you getting back to PC-Axis you will find a line in the File menu named Excel.
19
PC-AXIS 2003
www.scb.se
Picture 22
When you click on the Excel line PC-Axis automatically will pass the table on into Excel.
In Excel the table will be put in a new sheet and footnotes will appear below the table in
Excel.
20
PC-AXIS 2003
www.scb.se
Table size
Another thing to be happy about concerning PC-Axis is the capacity to handle tables
consisting of millions of table cells.
One more thing that make you glad is that you do not have to watch all these table cells on
the screen. The more table cells you show on the screen the longer it will take to make
operations on the table. Furthermore it uses more RAM. So it is possible to reduce the
number of table lines to be exposed on the screen.
Click on View, Advanced and select a tag called Table Presentation.
Picture 23
Here you can set the number of lines you as a maximum want the table to use on the screen.
Remember that even if you cannot see the table on the screen you can work with the whole
table. Everything you do will effect the whole table.
To change the table layout
It is easy to change the table layout. If you do not want to have line numbers, gridframes
just enter the View menu omit or insert the different properties.
21
PC-AXIS 2003
www.scb.se
Picture 24
Within the program it is possible to copy, move or delete tables and subject matter areas.
When you are doing it in PC-Axis you are sure that all references are deleted at the same
time.
Click on File, Maintenance...
Copy, move or delete a table within a subject matter area. Select Copy/Move or Delete in
the dialog box Maintenance. Select a subject area as ”Population” and delete, copy or move
the tables.
22
PC-AXIS 2003
www.scb.se
Classifications…
Former mentioned classification will be elaborated and explained and you will see how
useful the classifications can be.
The principle is that from a value set define a classification register that contains the desired
summings. The classification register then can be used on all files where the very variable
classified is used. One usefull area is on the variable age where several different
classifications can be established. Another is on region where municipalities can be put
together in larger areas forming special divisions of the country.
It is not a must to make classification registers, it is possible use the sum function in PCAxis. The advantage is the possibility to reuse the classifications. It is obviously possible to
make your own classification if the ones delivered from the statistical office on CD-ROM
or on Internet is not exactly the one you want to use.
To make a classification list takes some time, but you gain from it every time you use it in
the future.
To create a classification based on an existing value set.
Open File, Classification...
Picture 25
Select among the valuesets available in the listbox. For example ALDER1, or use Browse if
you want to change to another classification catalogue. (If the value set is on a read only
medium, as a CD-ROM, you have to copy it into your hard disc or a server and change
property to not read only status.)
23
PC-AXIS 2003
www.scb.se
Picture 26
Press Continue..
Picture 27
To avoid manual data entry you can use the option Read from file... and you will find a
window with allready existing value sets.
24
PC-AXIS 2003
www.scb.se
Picture 28
Now the page will be filled with values from the selected value set (text and codes) for
example ALDER1, the name of the domain and the type of value set (V=Value set of
normal structure, H= Hierarcical value set, N=sub areas). Press on the button named
Aggregations.
1
2
3
Picture 29
1. In the upper field the name of the aggregation list is entered, for example 10-yearclasses.
This name will be used in the table heading when this aggregation list is used.
2. In the next field every single group is named (Code and text), for example 0-9 in both
fields in this case. Before every new group you press the button Add.
3. In the bottom field you select the values that shall be included into the group for
example 0, 1, 2, 3, 4, 5, 6, 7, 8, 9. They will be found in the right hand side list and then
transfered to the left using the arrow key on the screen.
25
PC-AXIS 2003
www.scb.se
If it is not ticked on ”Allow values in a group to overlap” the values will dissapear from the
right hand box when clicked to the left. This is the most common way of using
classification.
If you make groupes that contains for example 0-4 years and also one 0-9 years it is
necessary to tick the ”Allow values in a group to overlap” button. This because 0-4 is a
subset of 0-9.
Use the Show button to check the result.
Then save.
To create a classifictaion based on a new value set.
To be able to create aggregations based on values not available in a classification register,
you first have to import that values. The value set is a file containing codes and texts for the
values to be aggregated from. For example ”0” with the corresponding text ”0 year”. The
code ”1” with the corresponding text ”1 year” and so on. Value sets can be read into PCAxis from a commaseparated file which could look like this:
0,0 year
1,1 year
2,2 year
It is also possible to import an existing value set (a file with the extension VS) to optionally
correct it. At most cases it is a PC-Axis file one want to make aggregations for and then the
PC-Axis file can be used as input to get the value set.
To be able to use the aggregations one shall secure the consistency between the PC-Axis
files and the aggregations lists.
Domain is a keyword that can occur for any variable. It refers to a class of values. A list
with all names of existing domains can be seen from the Classification program if the right
current database is linked. The name can also be found with the Domain keyword in the
PX-file. This name is to be used when establishing a new value set.
When using the aggregation lists you shall secure the right classification catalogue is linked
to PC-Axis.
What is wrong?
If you after having created a classification register do not access to it when opening a table
the reasons can be the following:
•
•
The Current Classification catalogue does not contain the created classification
register. Shift classification catalogue. Do it at the same places as where you shift
database. It is also possible to set a default catalogue in ”View, Advanced..”.
Select ”Classification Directory” and set the desired catalogue.
DOMAIN is not corresponding between the PX-file and the value set. Open the
PX-file in Notepad and check if the name corresponds to the value set.
26
PC-AXIS 2003
www.scb.se
Picture30
27
PC-AXIS 2003
www.scb.se
History
PC-Axis was developed for the 1990 Population Census inn Sweden. The software has
been further developed in the framework of the International PC-Axis Reference Group.
For instance a Windows version 1995 that has become a help application to the Sweden’s
Statistical Databases on Internet. An Internet version of PC-Axis named PX-Web is
available and in use since 2000. In Statistics Denmark a software to create PC-Axis files,
named PX-Make, has been developed. Statistics Norway has made a map-software named
PX-Map.
PC-Axis for dissemination of Statistics from other organisations
The PC-Axis family products are used for dissemination of statistics from statistical
agencies in the following countries: Algeria, Basque country, Bolivia, Brazil, Denmark,
Estonia, The Philippines, Finland, Faeroe Islands, Greenland, Ireland, Iceland, Croatia,
Kuwait, Lithuania, Latvia, Norway, Slovenia, Spain, South Africa and Uganda.
Furthermore PC-Axis is used by UN/ECE, East Africa Commission (Kenya, Tanzania,
Uganda). In Sweden PC-Axis is used outside Statistics Sweden by Integrationsverket,
Sverige Folkhälsoinstitut, Falköpings kommun, Halmstads kommun, Linköpings kommun,
Täby kommun, Västra Götalandsregionen, Örebro kommun
Overview of the PC-Axis family software
The
PC-Axis
family
software is leaning on the
The Nordic concept for dissemination of
thesis of Professor Bo
statistics on the Internet
Sundgren
on
Output
databases using many
dimensional matrices, also
Makrometa
called cubicles or boxes.
MetaDok
These
thoughts
are
MacroData
implemented into the data
Statistics Sweden MetaList
model used in the
Sweden’s Statistical DataPC-Axis SQL meta data models
bases and also in use in
for macro and
the databanks of Denmark
micro data
PX-Batch
and Norway. In the figure
PX-Publ
to the left are the programs
PX-Make
that touches the ellipse related to the SQL-database,
PX-Edit
Internet SQL User
while those not touching
Interface
the ellipse is only using
SuperCross
the PC-Axis file format.
PX-Web
PC-Axis files can be
produced by PC-Axis
PC-Axis
PxSQL, PX-Batch, PXPX-Map
main
module
file
Make, PX-Edit (From Finland) and SuperCross. PXMeta driven databases and publication
Publ can produce tables
production for Internet
direct into a MS-Word- or
MS-Excel documents. Makrometa and Metalist are
used for the maintenance
of the metadata. Metadok is software for entering metadata on registers for micro data.
Contact person
Lars Nordbäck, e-mail: [email protected] and telephone: +46 8 5069 4095
28
PC-AXIS 2003