1
Freescale Semiconductor
Application Note
AN2267
Rev. 2, 11/2004
Stack Measurement on StarCore™Based DSPs
By Cristian Zamfirescu and Emilian Medve
Stack allocation can be a very delicate problem in a real-time
application for embedded systems. Because of the scarcity of
memory space, it is desirable to allocate as little stack space as
possible while still covering the worst-case stack needs.
However, it can be difficult to define with accuracy the amount
of stack space needed in the worst case of a complex
application. Interrupts are a further complication. Therefore, it
is usually more practical to measure stack usage during testing
and determine the maximum space requirements. Of course, it
is up to the testing engineer to select adequate test vectors that
approach the worst case. This application note presents two
ways to measure stack usage for applications running on the
StarCore™ SC140/SC1400 DSP core:
•
Add extra code to the application for monitoring the stack.
This method is a little more complex since it requires
additional code in the program. Also, it must be used with
caution to avoid problems covered in the guidelines section
of this document. However, the measurements can be
performed directly on the chip and are much faster.
•
Run the program with a simulator and monitor the stack
pointer. This method requires no code modifications.
Someone with no access to the source can perform the
measurements. This method always pinpoints the top of the
stack without errors. Also, it can provide the stack trace for
the worst case, which is valuable information when the goal
is to decrease stack size. However, since this method runs
on the simulator, it is much slower than the first method and
may be unusable for a complex application. One solution is
to add extra code to the application to locate the frame
where the maximum stack occurs and run the simulator
only on that frame to obtain more detailed information.
© Freescale Semiconductor, Inc., 2002, 2004. All rights reserved.
CONTENTS
1
1.1
1.2
1.3
2
2.1
2.2
2.3
3
Stack Measurement From A Program .....................2
Implementation .......................................................2
Guidelines ...............................................................5
Example of Library Use ..........................................5
Stack Measurement With a Simulator ....................6
SIMSC100 Simulator ..............................................7
Constraints ..............................................................8
Example of Script Use ............................................8
References............................................................. 10
Stack Measurement From A Program
1
Stack Measurement From A Program
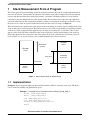
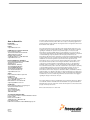
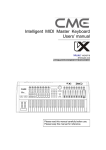
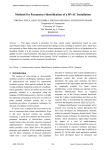
This section presents the watermarking method of stack measurement along with an example implementation to
run on the SC140 core. Watermarking fills the stack with a known value (the search pattern) before the function
executes and then determines how much of the pattern is overwritten. The highest address of a stack position
containing a value that differs from the search pattern defines the maximum value of the stack top required for
execution of the function. The watermarking method is similar to measuring the maximum water level in a river;
the water leaves a mark on a special marker that remains after the water level drops (see Figure 1).
The tested function may duplicate the search pattern on the stack during its execution, but it is unlikely if the value
of the search pattern is chosen properly. The pattern must be a value with a low probability of appearing randomly
on the stack, and it can depend on the application (for example, 0 is probably not a good choice, since it often
appears on the stack). The final verification of the stack is top-down to ensure against finding a fake stack top.
Even if the application never writes the value of the pattern on the stack, a function may still allocate space for
local variables or even vectors and leave some of them unchanged for a certain execution.
Filled With
Pattern
Stack Grows
Upwards
Filled With
Pattern
Stack Size
Overwritten
By Function
Stack Pointer
Below
Below
Function
Function
Before Function Call
After Function Call
Figure 1. Measuring the Stack by Watermarking
1.1 Implementation
Example 1 shows a proposed application programming interface (API) for measuring stack usage. The library
code is written in assembly and optimized for speed.
Example 1. Proposed API for Stack Measurement, MDCR_SC100_Stack.h
#ifndef __MDCR_SC100_STACK_H
#define __MDCR_SC100_STACK_H
void * MDCR_SC100_GetSP(void);
void * MDCR_SC100_MarkStack(void);
unsigned int MDCR_SC100_GetStack(void);
#endif
Stack Measurement on StarCore™-Based DSPs, Rev. 2
2
Freescale Semiconductor
Stack Measurement From A Program
This is the header file containing the declarations of the three functions. The definitions are listed in Example 2,
Example 3, and Example 4. The _MDCR_SC100_GetSP() function returns the value of the stack pointer before
the call.
Example 2. ASM Code for Stack Measurement, _MDCR_SC100_GetSP
GLOBAL _MDCR_SC100_GetSP
ALIGN 16
_MDCR_SC100_GetSP TYPE FUNC
rts
adda #<-8,sp,r0
return address
GLOBAL F_MDCR_SC100_GetSP_end
F_MDCR_SC100_GetSP_end
SIZE _MDCR_SC100_GetSP,*-_MDCR_SC100_GetSP
; -8 for
The MDCR_SC100_MarkStack() function in Example 3 fills the stack with the search pattern. It starts from
the current stack pointer and stops at the _MDCR_SC100_TopOfStack marker, which represents the top of the
currently allocated stack space and must be a multiple of 8. This function must be called just before the call to the
tested function. It returns the current stack pointer, which represents the stack base for the tested function (see
Figure 2).
Example 3. ASM Code for Stack Measurement, _MDCR_SC100_MarkStack
GLOBAL _MDCR_SC100_MarkStack
ALIGN 16
_MDCR_SC100_MarkStack TYPE FUNC
tfra sp,r1
adda #<8,sp,r0
; second write pointer
move.l r1,d0
move.l #<_MDCR_SC100_TopOfStack,d1
[
sub d0,d1,d0
; d0 is size of stack
move.w #<2,n0
]
[
asrr #<4,d0
; loop executes
stack_size/16 times
bmtsts #<8,d0.l
; assuming d0 is a
multiple of 8
; this is false if d0 is
a
]
; multiple of 16
doensh3 d0
move.l MDCR,d2
tfr d2,d3
LOOPSTART3
move.2l d2:d3,(r1)+n0 move.2l d2:d3,(r0)+n0 ; write 16 bytes at a
time
LOOPEND3
rtsd
adda #<-8,sp,r0
; return stack base in r0
ift move.2l d2:d3,(r1)
; if size of stack is not
a
; multiple of 16 write 8
more bytes
GLOBAL F_MDCR_SC100_MarkStack_end
F_MDCR_SC100_MarkStack_end
SIZE _MDCR_SC100_MarkStack,*-_MDCR_SC100_MarkStack
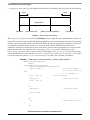
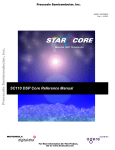
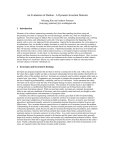
Figure 2 shows the stack layout after execution of MDCR_SC100_MarkStack. The _StackStart,
_MDCR_SC100_TopOfStack and _TopOfStack symbols are all defined in the linker command file (.cmd).
Stack Measurement on StarCore™-Based DSPs, Rev. 2
Freescale Semiconductor
3
Stack Measurement From A Program
_StackStart and _TopOfStack represent the boundaries of the memory space allocated for stack and heap.
Stack
Heap
Marked Zone
_StackStart
_StackPointer (SP)
_MDCR_SC100_TopOfStack
TopOfStack
Figure 2. Stack Layout After Marking
The MDCR_SC100_GetStack() function in Example 4 must be called after the tested function has returned. It
inspects the stack from top down to find the highest modified location, and it returns the size of the stack, measured
from the current stack pointer (that is, the value of SP before the function call). If the last eight bytes of the stack
are modified, the function returns a value of –1 to indicate stack overflow. The initial stack allocation is
insufficient, and the tester should allocate more stack and try again. For the measurement to be correct, the stack
pointer must have the same value before the call to MDCR_SC100_MarkStack and before the call to
MDCR_SC100_GetStack. If for some reason this cannot happen, MDCR_SC100_GetSP is used to return the
current SP. Then the size of the stack is MDCR_SC100_GetStack() + MDCR_SC100_GetSP() – base, where
base is the return value of MDCR_SC100_MarkStack() or any other value you chose as stack base.
Example 4. ASM Code for Stack Measurement, _MDCR_SC100_GetStack
GLOBAL _MDCR_SC100_GetStack
ALIGN 16
_MDCR_SC100_GetStack TYPE FUNC
move.l #<(_MDCR_SC100_TopOfStack-4),r0
adda #<-28,sp,r1
;8 for return address
; 16 for extra reads from
(r0)
move.l (r0)-,d1
; 4 for rounding up
move.l Pattern,d2
[
cmpeq d2,d1
move.l (r0)-,d1
; check top of stack
]
[
IFT
cmpeq d2,d1
; check next element
]
move.l #-1,d0
[
IFF
rts
; stack overflow: return
-1
IFT
Stack Measurement on StarCore™-Based DSPs, Rev. 2
4
Freescale Semiconductor
Stack Measurement From A Program
move.l (r0)-,d1
]
FALIGN
L0_0
[
cmpeq d2,d1
btd L0_0
]
move.l (r0)-,d1
suba r1,r0
move.w #<-8,d1 ; r0 is size of stack
move.l r0,d0
rtsd
and d1,d0
; stack size must be
multiple of 8
GLOBAL F_MDCR_SC100_GetStack_end
F_MDCR_SC100_GetStack_end
SIZE _MDCR_SC100_GetStack,*-_MDCR_SC100_GetStack
1.2 Guidelines
For the MDCR_SC100_GetStack function, stack overflow is indicated by the modification of the last valid
position in stack (last eight bytes). However, if those bytes are not modified, this does not guarantee the absence of
a stack overflow. A function can allocate a certain amount of stack space and not write all of it (leave “holes” on
the stack still containing the search pattern). Then the function can write beyond the top stack marker, leaving the
top of the stack untouched. To avoid such problems, establish a certain safety value greater than any stack gap that
can appear, depending on the application. When the remaining space on the stack is smaller than this value, treat
this as a possible overflow and allocate more memory for the stack by increasing the
MDCR_SC100_TopOfStack marker. The remaining space on the stack can be calculated as
MDCR_SC100_TopOfStack - MDCR_SC100_GetSP() - MDCR_SC100_GetStack().
If the application allocates memory dynamically, extra attention must be paid to the size of the heap. The heap can
grow beyond the MDCR_SC100_TopOfStack marker, and MDCR_SC100_GetStack() reports this as a stack
overflow. Of course, increasing MDCR_SC100_TopOfStack only makes the problem worse since it leaves even
less space for the heap. The solution here is to increase stack and heap size by changing the memory allocation in
the linker command file (increase _TopOfStack - _StackStart).
Interrupts should be disabled when the tested function executes so that they do not influence the results in
unpredictable ways. To measure the worst stack case for the application that includes interrupts, measure the stack
space for interrupt handling routines separately, since it is usually impossible to trigger the interrupts exactly when
the function stack reaches its maximum size.
1.3 Example of Library Use
Example 5 shows how to use the previously-discussed functions to measure the stack size for a function.
Example 5. Stack Size for a Function, stack_measurement.c
#include <stdio.h>
#include "mdcr_sc100_stack.h"
int function3(int n)
{
#pragma noinline
int v[10];
int i;
Stack Measurement on StarCore™-Based DSPs, Rev. 2
Freescale Semiconductor
5
Stack Measurement With a Simulator
v[0] = v[1] = 1;
for (i=2; i<10; i++)
{
v[i] = v[i-1] + v[i-2];
}
return v[n];
}
int function2(int n)
{
#pragma noinline
if (n==1) return 1;
else return function3(n);
}
int function1(int n)
{
#pragma noinline
if (n<=0) return 0;
else return function2(n);
}
void main()
{
int n=0;
int i;
int stack_size;
for (i=0; i<3; i++)
{
MDCR_SC100_MarkStack();
n+=function1(i);
stack_size = MDCR_SC100_GetStack();
printf ("\nStack size for call %d: %d\n", i, stack_size);
}
}
This program was compiled with Metrowerks® StarCore C compiler R 1.1 with –O3 optimization option, DQGthe
output is as shown in Example 6.
Example 6. Test Program Output
Stack size for call 0: 8
Stack size for call 1: 16
Stack size for call 2: 64
2
Stack Measurement With a Simulator
Measuring the stack from an application running on the hardware is much faster than measuring the stack from a
simulator. However, the simulator offers some advantages. It does not require the addition of code to the program,
and it yields more detailed information. This method of stack measurement is precise. It indicates the exact value
of the stack in any moment, not just the maximum value. It is not influenced by overflows or by the heap
overwriting the stack, unless the application crashes. Measuring the stack on a simulator, we can monitor all
changes of the stack pointer. The value of the stack pointer before the call to the function (or the value after the call
to the function minus eight) is the base of the stack. The maximum of all the different stack pointer values between
the beginning and the end of the function represents the top of the stack. Subtracting the stack base from this value
Stack Measurement on StarCore™-Based DSPs, Rev. 2
6
Freescale Semiconductor
Stack Measurement With a Simulator
yields the stack usage for that execution of the function. We locate the beginning of the function by setting a
breakpoint to that function. The problem is finding the end. Since compilers do not usually generate labels for the
last instruction of a function, it is hard to set a breakpoint there. If the simulator offers more advanced options, such
as stepping out from a function, the problem is easily solved. Otherwise, a call to an empty function must be
inserted immediately after the call to the tested function and the breakpoint set on the empty function call. If a call
to another function already exists at that location, it can be used instead.
2.1 SIMSC100 Simulator
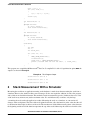
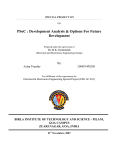
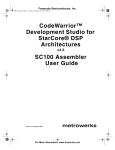
We monitored the stack via the SIMSC100 simulator using a Perl script and a few SIMSC100 scripts. Appendix A,
Listing of Perl and simsc100 Scripts, on page 11 presents a full listing of the scripts. The Perl script receives as
parameters the name of the analyzed program (without the .eld extension) and the name of the function with an
optional number of frames, which is the number of function calls after which the simulation stops. If the program
does not call the function this many times, the simulation stops at the end of the program. The executable
program_name.eld and the map file program_name.map must be in the current directory (the .map file is
needed for the stack trace). It generates an output .txt file containing the maximum size of the stack and the stack
trace for that execution of the function (stack_analysis_program.txt, where program stands for the
name of the analyzed program) and another file containing the evolution of the stack for the frame that produced
the largest stack (stack_trace_program.txt).
stack_analyzer.pl
(Data Generation)
stack_analyzer_frame_start.sc
stack_analyzer_program.sc
stack_analyzer_frame_end.sc
simsc100
program.eld
stack_analyzer_program.log
stack_analyzer.pl
(Analysis)
stack_analysis_program.txt
program.map
stack_trace_program.txt
Figure 3. Measuring the Stack With the simsc100 Simulator
Stack Measurement on StarCore™-Based DSPs, Rev. 2
Freescale Semiconductor
7
Stack Measurement With a Simulator
From the command line parameters the Perl script generates a SIMSC100 script
(stack_analyzer_program.sc) and runs SIMSC100 using this script. The simulator generates a trace file
from which the Perl script can later retrieve the necessary information. stack_analyzer_program.sc sets a
breakpoint at the function entry to detect the beginning of the function and trigger the execution of another script
(stack_analyzer_frame_start.sc). This script reads the stack pointer (esp) in the cnt2 variable and sets
a conditional breakpoint with the condition esp<cnt2 to detect the end of the function and trigger the execution of
the stack_analyzer_frame_end.sc script. Another breakpoint in stack_analyzer_program.sc
prints the value of esp each time it changes but does not stop the simulation. This breakpoint is enabled when the
function begins and disabled when it ends, so it prints only the values of esp inside the function. To count the
function calls, a breakpoint at the function entry increments the cnt1 counter, and another breakpoint stops the
simulation when the counter reaches the required number. A breakpoint set at the end of program handles the case
when the number of frames is too big or no number is specified.
When the simulator finishes the Perl script begins the analysis stage, using the generated trace file
(stack_analyzer_program.log). The program.map file is read and the (address, function_name) pairs
are recorded in a hash table. The log file is parsed by the Perl script and the maximum stack size is found. Finally
the stack trace is generated by parsing the log file from the position where the maximum stack size was found,
recording all the program locations where the stack pointer is decremented and looking up the corresponding
function name in the hash table.
The script also generates a file (stack_trace_program_name.txt) containing the evolution of the stack for
the frame that produced the largest stack, one (function_name, stack_size) pair per line. From this file a graph can
easily be generated to summarize the evolution of the stack for that frame. Depending on the needs of the
application developer, the scripts can be modified to produce other useful information.
2.2 Constraints
In addition to the fact that stack measurements on the simulator are significantly slower than those taken on the
hardware platform, there are certain other constraints to keep in mind:
•
Stack trace generation does not work for static functions since they do not appear in the .map file. Every static
function that should appear in the stack trace is replaced by the name of the first global function that precedes
it in memory.
•
The stack_analyzer_program.sc script does not perform correctly in a multiprocess system. If a task
switch occurs during the execution of the analyzed function, the results are totally corrupted.
2.3 Example of Script Use
Example 7 demonstrates the use of the stack_analyzer_program.sc script on a test program:
Example 7. Test Program for Stack Measurement Scripts
#include <stdio.h>
int function3(int
{
#pragma noinline
int v[10];
int i;
n)
Stack Measurement on StarCore™-Based DSPs, Rev. 2
8
Freescale Semiconductor
Stack Measurement With a Simulator
v[0] = v[1] = 1;
for (i=2; i<10; i++)
{
v[i] = v[i-1] + v[i-2];
}
return v[n];
}
int function2(int n)
{
#pragma noinline
if (n<=1) return 1;
else return function3(n) + function3(n-2);
}
int function1(int n)
{
#pragma noinline
if (n<=0) return 0;
else return function2(n) + function2(n-1);
}
int main()
{
int n=0;
int i;
for (i=0; i<5; i++)
n+=function1(i);
return n;
}
The program name is stack_test.c. If we compile it with the following, we obtain the files stack_test.map and
stack_test.eld:
scc -be -dm stack_test.map -o stack_test.eld stack_test.c
Next, we run the following script:
perl stack_analyzer.pl stack_test function1
and we obtain the file stack_analysis_stack_test.txt containing the maximum stack size and the stack
trace listed from top to bottom:
Example 8. Script Output
Statistics made for stack_test :
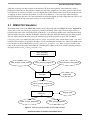
Maximum stack size for function1 is 88 (in frame 3) with the following
call stack:
function3
function2
function1
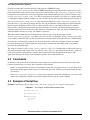
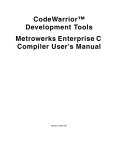
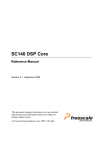
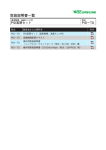
The graph shown in Figure 4 is generated from the resulting trace file (stack_trace_stack_test.txt). It
represents the evolution of the stack for the frame that produces the largest stack.
Stack Measurement on StarCore™-Based DSPs, Rev. 2
Freescale Semiconductor
9
References
n1
nc
ti o
fu
nc
ti o
n2
n1
fu
nc
ti o
fu
fu
nc
ti o
n2
n3
nc
ti o
fu
nc
ti o
fu
fu
nc
ti o
n3
n2
nc
ti o
fu
nc
ti o
fu
n2
100
90
80
70
60
50
40
30
20
10
0
n1
Stack size (bytes)
Stack
evolution
function1
Stack
Evolutionfor
for function1
Time
Figure 4. Stack Evolution for Example Program
3
References
[1]
Michael T. Trade. Dynamic Stack Depth Determination Using ‘Footprint’ Analysis.
[2]
SC140 DSP Core Reference Manual (MNSC140CORE).
[3]
SC100 C Compiler User’s Manual, (MNSC100CC).
[4]
SC100 Assembly Language Tools User’s Manual (MNSC100ALT).
[5]
SC100 Application Binary Interface Reference Manual (MNSC100ABI).
Stack Measurement on StarCore™-Based DSPs, Rev. 2
10
Freescale Semiconductor
References
Appendix A Listing of Perl and simsc100 Scripts
Following is the full listing of the scripts used for stack measurements in Section 2, Stack Measurement With a
Simulator:
Example 9. stack_analyzer.pl
use warnings;
use strict;
# Receives as parameter a scalar that represents the name of the module
being tested
# Returns a reference to a hash table containing the functions from the
module received as
# parameter and with their addresses as keys
sub get_map_table
{
my $module = shift; # Get the first parameter
my %map_table;
# This is the map table that will be filled in
this function
my $fin;
# Map file descriptor
# Open map file
open( $fin , $module . ".map" ) || die("open " . $module . ".map" .
": $!\n");
# Process the whole map file
while( <$fin> )
{
# Match lines that contain a function name and its address
# Such lines look like the one beelow:
# 0x00013760
_Syn_filt
# 0x00013850
_Weight_Az
# 0x00013b60
_ACELP_Code_A
if( /^(0x[0-9a-fA-F]{8})\s+_(\w+)\s*$/ )
{
# Hash key is the address of the function and data is the function name
$map_table{ $1 } = $2;
}
}
# Close map file
close( $fin );
# Return a reference to the map table built
return \%map_table;
}
# builds the stack analyzer script. This script is named
stack_analyzer_module_name.sc
# and it will be executed by simsc100 to produce the log file
sub build_stack_analyzer
{
my $f;
my $module = shift; # Get the first parameter (module name)
my $function = shift; # Get the second parameter (function name)
my $num_frames = shift; # Get the third parameter (number of frames)
open ($f," >stack_analyzer_".$module.".sc")|| die("Cannot create
stack analyzer script");
Stack Measurement on StarCore™-Based DSPs, Rev. 2
Freescale Semiconductor
11
Appendix A
print( $f "display off\n");
print( $f "break off\n");
print( $f "output off\n");
print( $f "input off\n\n");
# display esp as unsigned decimal
print( $f "radix u esp\n");
print( $f "reset d m1\n\n");
# quit on errors (bad function name, for example)
print( $f "quit e\n");
print( $f "load ".$module.".eld\n\n");
# count frames
if ($num_frames > 0)
{
print( $f "break #1 _".$function." i1\n");
}
# execute frame_start script when entering the function
print( $f "break #2 _".$function." x
stack_analyzer_frame_start.sc\n");
# stop after num_frames frames
if ($num_frames > 0)
{
print( $f "break #4 cnt1>=".($num_frames+1)."\n");
}
# display modifications of esp
print( $f "break #5 w esp s\n");
# disable breakpoint 5
print( $f "break #5 d\n");
# stop at end of program
print( $f "break #6 stop\n\n");
# set log file
print( $f "log s stack_analyzer_".$module.".log -o\n");
# start simulation
print( $f "go\n");
# only breakpoint 4 or 6 can get us here
print( $f "quit\n");
close( $f );
}
=head1
The script parses the log file generated by the stack_analyzer simulator
script.
The output of this script are the maximum values for the stack size of the
analyzed
function and the stack trace.
The parameters received by this script represent the name of the .eld
file, the name
of the function and (optional) the number of frames to analyze
=cut
if ($#ARGV < 1)
{
die("Syntax: ".$0." program_name function_name
[number_of_frames]\n");
}
Stack Measurement on StarCore™-Based DSPs, Rev. 2
12
Freescale Semiconductor
Appendix A
# Get the name of analyzed module
my $module=<$ARGV[0]>;
# Get the name of analyzed function
my $tested_function=<$ARGV[1]>;
# Get the number of frames
my $num_frames=<$ARGV[2]>;
if ($num_frames eq "")
{
# run to the end of program
$num_frames = 0;
}
# build the stack analyzer script
build_stack_analyzer($module, $tested_function, $num_frames);
my $fin;
open( my $report_file,">stack_analysis_" . $module . ".txt" ) || die(
"Cannot create report file!!!" );
print($report_file "\nStatistics made for $module :\n\n");
# Run the module tester to log the stack evolution
system("simsc100 stack_analyzer_".$module.".sc > /dev/null") == 0
|| die ("Error while running simulator - please check the
parameters again\n");
# Open the stack log file of the module analyzed
open( $fin , "stack_analyzer_".$module.".log" ) || die( "Can’t open log
file : $!\n" );
my $stack_size = 0x0;
my $stack_base = 0xffffffff;
my $stack_top = 0xffffffff;
# This array will store the function call stack (pc values and not
function names)
my @functions;
# Parse the log file
# The stack pointer is esp. Typical display line for esp looks like:
#
esp={00000164264}
my
my
my
my
my
$max_stack_line;
$max_stack_start_line;
$stack_start_line;
$current_frame = 0;
$max_frame;
# First, keep the first value of the stack pointer in the $stack_base
# The first occurence of the stack pointer after a "display" line should
be at the enterance
# of the tested function. Then find the maximum of the other values =>
$stack_top
while( <$fin> )
{
# a line containing just "display" marks the beginning of the function
if( /\s*display\s*$/ )
{
# memorize the start of frame
$stack_start_line = tell( $fin );
Stack Measurement on StarCore™-Based DSPs, Rev. 2
Freescale Semiconductor
13
Appendix A
# update number of the current frame
$current_frame = $current_frame + 1;
# next line contains the value of esp
$_ = <$fin>;
/\s*esp=\{0*([0-9a-fA-F]+)\}\s*/;
$stack_base = $1;
$stack_base -= 8;
# next line contains the value of pc
$_ = <$fin>;
/^p:\$([0-9a-fA-F]{8})/;
# remember stack start for the current frame
}
elsif( /\s*esp=\{0*([0-9a-fA-F]+)\}\s*$/ )
{
# this line contains the value of esp
if( $1 - $stack_base > $stack_size )
{
$stack_size = $1 - $stack_base;
$stack_top = $1;
# next line contains the value of pc
$_ = <$fin>;
/^p:\$([0-9a-fA-F]{8})/;
# Store the next line in file where the maximum stack pointer appears
$max_stack_line = tell( $fin );
$max_stack_start_line = $stack_start_line;
# store function name
$functions[0] = "0x" . $1;
# store maximum stack frame number
$max_frame = $current_frame;
}
}
}
# Output stack dimension
print( $report_file "Maximum stack size for ".$tested_function." is ".(
$stack_size)." (in frame ".$max_frame.") with the following call stack:\n"
);
# Jump to the line that follows the line that contains the maximum stack
pointer
seek( $fin , $max_stack_line , 0);
my $function= 1;
# Parse log file to find where the stack pointer decreases and store the
value of program counter
# A function can appear more that one time in the array
while( <$fin> )
{
if ( /\s*esp=\{0*([0-9a-fA-F]+)\}\s*/ )
{
if( $1 < $stack_top )
{
$stack_top = $1;
$_ = <$fin>;
/^p:\$([0-9a-fA-F]{8})/;
$functions[ $function++ ] = "0x" . $1;
}
}
}
Stack Measurement on StarCore™-Based DSPs, Rev. 2
14
Freescale Semiconductor
Appendix A
my $function_name0="";
my $function_name1;
my $map_table = get_map_table( $module );
# Iterate the function array to search the function name corresponding to
each address
foreach $function ( @functions )
{
# For each address iterate the map table
foreach my $function_address ( sort keys %$map_table )
{
# If the current function has a lower address store its name.
# Otherwise quit loop because the function name was identified and is
stored in $function_name1
if( hex( $function ) >= hex( $function_address ) )
{
$function_name1 = $$map_table{ $function_address };
}
else
{
last;
}
}
# If the name of previous function differs from the current one display
the current function name
unless( $function_name0 eq $function_name1 )
{
print( $report_file $function_name1 . "\n" );
$function_name0 = $function_name1;
}
# If tested_function is reached, quit
if( $function_name1 eq $tested_function)
{
last;
}
}
# Close the report file
close( $report_file );
# create trace file for the frame that produced the maximum stack
open( my $trace_file,">stack_trace_" . $module . ".txt" ) || die( "Cannot
create trace file!!!" );
# Jump to the beginning of the stack trace
seek( $fin , $max_stack_start_line , 0);
# read base of stack
$_ = <$fin>;
/\s*esp=\{0*([0-9a-fA-F]+)\}\s*/;
$stack_base = $1;
$stack_base -= 8;
my $curent_size = 0;
$function_name0 = $tested_function;
$function_name1 = "unknown";
$map_table = get_map_table( $module );
Stack Measurement on StarCore™-Based DSPs, Rev. 2
Freescale Semiconductor
15
Appendix A
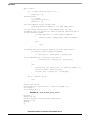
while( <$fin> )
{
if ( /\s*esp=\{0*([0-9a-fA-F]+)\}\s*/ )
{
$stack_top = $1;
# Read PC value
$_ = <$fin>;
/^p:\$([0-9a-fA-F]{8})/;
$function = $1;
# For each address iterate the map table
foreach my $function_address ( sort keys %$map_table )
{
# If the current function has a lower address store its name.
# Otherwise quit loop because the function name was identified and is
stored in $function_name1
if( hex( $function ) >= hex( $function_address ) )
{
$function_name1 = $$map_table{ $function_address };
}
else
{
last;
}
}
# eliminate multiple successive apparitions of the same function
if ($function_name1 eq $function_name0)
{
if (($stack_top - $stack_base) > $curent_size)
{
# store maximum value of stack for the function
$current_size = ($stack_top - $stack_base);
}
}
else
{
print($trace_file $curent_size."\t".$function_name0."\n");
$function_name0 = $function_name1;
$current_size = ($stack_top - $stack_base);
}
}
elsif (/\s*Break \#3.*$/)
{
last;
}
}
# print last record
print($trace_file $curent_size."\t".$function_name0."\n");
close( $fin );
close( $trace_file );
Example 10. stack_analyzer_frame_start.sc
break #5 e
change cnt2 esp
break #3 esp<cnt2 x stack_analyzer_frame_end.sc
display on esp
display
go
Stack Measurement on StarCore™-Based DSPs, Rev. 2
16
Freescale Semiconductor
Appendix A
Example 11. stack_analyzer_frame_end.sc
break #5 d
display off esp
break #3 off
go
Stack Measurement on StarCore™-Based DSPs, Rev. 2
Freescale Semiconductor
17
References
NOTES:
Stack Measurement on StarCore™-Based DSPs, Rev. 2
18
Freescale Semiconductor
References
NOTES:
Stack Measurement on StarCore™-Based DSPs, Rev. 2
Freescale Semiconductor
19
How to Reach Us:
Home Page:
www.freescale.com
E-mail:
[email protected]
USA/Europe or Locations not listed:
Freescale Semiconductor
Technical Information Center, CH370
1300 N. Alma School Road
Chandler, Arizona 85224
+1-800-521-6274 or +1-480-768-2130
[email protected]
Europe, Middle East, and Africa:
Freescale Halbleiter Deutschland GMBH
Technical Information Center
Schatzbogen 7
81829 München, Germany
+44 1296 380 456 (English)
+46 8 52200080 (English)
+49 89 92103 559 (German)
+33 1 69 35 48 48 (French)
[email protected]
Japan:
Freescale Semiconductor Japan Ltd.
Headquarters
ARCO Tower 15F
1-8-1, Shimo-Meguro, Meguro-ku,
Tokyo 153-0064, Japan
0120 191014 or +81 3 5437 9125
[email protected]
Asia/Pacific:
Freescale Semiconductor Hong Kong Ltd.
Technical Information Center
2 Dai King Street
Tai Po Industrial Estate
Tai Po, N.T. Hong Kong
+800 2666 8080
For Literature Requests Only:
Freescale Semiconductor Literature Distribution Center
P.O. Box 5405
Denver, Colorado 80217
1-800-441-2447 or 303-675-2140
Fax: 303-675-2150
[email protected]
AN2267
Rev. 2
11/2004
Information in this document is provided solely to enable system and software implementers to
use Freescale Semiconductor products. There are no express or implied copyright licenses
granted hereunder to design or fabricate any integrated circuits or integrated circuits based on
the information in this document.
Freescale Semiconductor reserves the right to make changes without further notice to any
products herein. Freescale Semiconductor makes no warranty, representation or guarantee
regarding the suitability of its products for any particular purpose, nor does Freescale
Semiconductor assume any liability arising out of the application or use of any product or
circuit, and specifically disclaims any and all liability, including without limitation consequential
or incidental damages. “Typical” parameters which may be provided in Freescale
Semiconductor data sheets and/or specifications can and do vary in different applications and
actual performance may vary over time. All operating parameters, including “Typicals” must be
validated for each customer application by customer’s technical experts. Freescale
Semiconductor does not convey any license under its patent rights nor the rights of others.
Freescale Semiconductor products are not designed, intended, or authorized for use as
components in systems intended for surgical implant into the body, or other applications
intended to support or sustain life, or for any other application in which the failure of the
Freescale Semiconductor product could create a situation where personal injury or death may
occur. Should Buyer purchase or use Freescale Semiconductor products for any such
unintended or unauthorized application, Buyer shall indemnify and hold Freescale
Semiconductor and its officers, employees, subsidiaries, affiliates, and distributors harmless
against all claims, costs, damages, and expenses, and reasonable attorney fees arising out of,
directly or indirectly, any claim of personal injury or death associated with such unintended or
unauthorized use, even if such claim alleges that Freescale Semiconductor was negligent
regarding the design or manufacture of the part.
Freescale™ and the Freescale logo are trademarks of Freescale Semiconductor, Inc. StarCore
is a trademark of StarCore LLC. Metrowerks and CodeWarrior are registered trademarks of
Metrowerks Corp. in the U.S. and/or other countries. All other product or service names are the
property of their respective owners.
© Freescale Semiconductor, Inc. 2002, 2004.