1
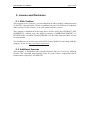
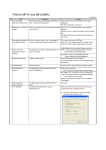
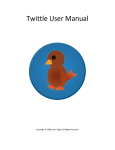
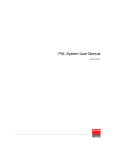
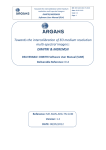
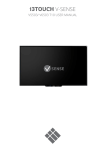
User Manual
V1.0.0
Glob Toolbox User Manual
Page 1 of 20
1. OVERVIEW..................................................................................................3
2. INSTALLATION...........................................................................................3
2.1. Microsoft™ Windows©...................................................................................................................3
2.1.1. Supported Versions....................................................................................................................3
2.1.2. Dependencies.............................................................................................................................3
2.1.3. Install Procedure ........................................................................................................................3
2.1.4. Uninstall Procedure....................................................................................................................3
2.2. Other Platforms ...............................................................................................................................4
2.2.1. Supported Platforms ..................................................................................................................4
2.2.2. Dependencies.............................................................................................................................4
2.2.2.1. Python and Python modules...............................................................................................4
2.2.2.2. GDAL and associated dependencies ..................................................................................4
2.2.3. Install Procedure ........................................................................................................................4
2.2.4. Uninstall Procedure....................................................................................................................4
3. USER INTERFACE .....................................................................................5
3.1. Launch..............................................................................................................................................5
3.2. Datasets.............................................................................................................................................5
3.2.1. Colour Tables.............................................................................................................................7
3.3. Data View .........................................................................................................................................7
3.3.1. View Menu ................................................................................................................................8
3.3.1.1. Show View Information.....................................................................................................8
3.3.1.2. Export Current View ..........................................................................................................9
3.3.1.3. Export Current Selection..................................................................................................10
3.3.1.4. Mode submenu.................................................................................................................10
3.3.2. Time Series ..............................................................................................................................11
3.4. Preferences .....................................................................................................................................12
3.4.1. Interface ...................................................................................................................................13
3.4.1.1. Background Colour ..........................................................................................................13
3.4.1.2. Selection Rectangle Colour..............................................................................................13
3.4.2. Log...........................................................................................................................................13
3.4.2.1. Log Level .........................................................................................................................13
3.4.3. Data..........................................................................................................................................13
3.4.3.1. Product Locations ............................................................................................................13
3.4.4. Image .......................................................................................................................................13
3.4.4.1. Background Colour ..........................................................................................................13
3.4.4.2. Colour Bar........................................................................................................................13
3.4.4.3. Country Boundaries .........................................................................................................14
3.4.4.4. Vector Data ......................................................................................................................14
4. SUPPORTED PRODUCTS........................................................................15
4.1. GlobCover ......................................................................................................................................15
4.1.1. Dataset options.........................................................................................................................15
4.2. GlobCarbon....................................................................................................................................16
4.3. Global Land Cover 2000 ...............................................................................................................16
Glob Toolbox User Manual
Page 2 of 20
4.4. Medspiration ..................................................................................................................................17
4.5. World Fire Atlas ............................................................................................................................17
4.6. GlobColour.....................................................................................................................................17
5. LICENSE AND DISCLAIMER ...................................................................19
5.1. Glob Toolbox..................................................................................................................................19
5.2. Additional licenses .........................................................................................................................19
Glob Toolbox User Manual
Page 3 of 20
1. Overview
Glob Toolbox is a visualization tool for previewing the data from different products of
the DUE Glob series of projects. It provides access to the datasets by geographic
region, time frame, or both, without the need for the user to be aware of the file
format and naming scheme of each product.
The previewing features include colour table selection, coverage exporting to file and
time series generation.
For additional information regarding the application or for support information
contact the DUE team at [email protected].
2. Installation
2.1. Microsoft™ Windows©
2.1.1. Supported Versions
The following versions of Microsoft Windows are supported:
•
Windows XP
Glob Toolbox might work on other versions but they are not officially supported.
2.1.2. Dependencies
Most Glob Toolbox dependencies are included in the provided installer. The Visual
Studio 2005 runtime libraries must also be present in the system, and can be obtained
from Microsoft at the following web page:
http://www.microsoft.com/downloads/details.aspx?familyid=200B2FD9-AE1A4A14-984D-389C36F85647
2.1.3. Install Procedure
Double-click on the installation program and follow the instructions.
By default, the software will be put in ‘%PROGRAMFILES%\Glob Toolbox.’ You
can choose another folder if you do not have write access to the default one, or simply
want to install the software at another location.
2.1.4. Uninstall Procedure
Go to the control panel, click on ‘Add/Remove Programs’ and select the Glob
Toolbox entry. Everything created during installation will then be removed.
Note that there is also a shortcut in the installation folder which you can click on to
get the same result.
Glob Toolbox User Manual
Page 4 of 20
2.2. Other Platforms
2.2.1. Supported Platforms
Although Glob Toolbox is not yet supported on platforms other than Windows, it
should be possible to run the software on the following platforms, as long as all
dependencies are met:
•
•
Linux
Mac OS X
2.2.2. Dependencies
2.2.2.1. Python and Python modules
Glob Toolbox is a Python application, and therefore requires Python version 2.4 or
2.5 installed on the system.
The following modules must be available to the Python interpreter:
•
•
•
GDAL modules
wxPython version 2.8
dateutil version 1.1 or higher
2.2.2.2. GDAL and associated dependencies
Glob Toolbox data access layer uses the GDAL library, version 1.4. The library must
be compiled with HDF4, netCDF and GEOS support.
The HDF4, netCDF and GEOS libraries must also be present on the system. The user
must also assure that the HDF4 library present in its system is compiled without
netCDF support.
2.2.3. Install Procedure
After installing all the dependencies, extract the source tarball to a suitable directory.
To launch the application, use the globstart.pyw script that resides in the base of the
source, using a command similar to the following:
$ python globstart.pyw
2.2.4. Uninstall Procedure
To uninstall the software remove the directory containing the source.
Glob Toolbox User Manual
Page 5 of 20
3. User Interface
3.1. Launch
When starting up, Glob Toolbox performs a search for supported data files in the
locations specified by the user. If the user specifies a large collection of files to
search, this process can take some time.
Upon search completion, the user is presented with the main window of the
application. The interface is logically split in two areas, one devoted to the dataset
selection and the other to data visualization.
Figure 3-1: Glob Toolbox main interface, with the dataset list on the left side and the data view
on the right.
3.2. Datasets
The dataset selection window displays a list of the available Glob products found
during the initial search. The first time the application is run, the product locations list
is empty, so only the default basic datasets are displayed. Instructions on how to edit
the locations list can be found in section 3.4.3.1 of this manual.
Each product contains a set of datasets that can be seen by double-clicking the product
name in the list.
Individual datasets can be activated and deactivated by double-clicking on them or by
selecting the Toggle option either on the dataset popup menu or on the Dataset
submenu of the main menu. The popup menu is shown when right-clicking the dataset
name in the list. Both menus provide the same operations, and will be referenced from
now on simply as the Dataset Menu.
Glob Toolbox User Manual
Page 6 of 20
Figure 3-2: Dataset popup menu with the Toggle Dataset option highlighted.
Active datasets are shown in the dataset order list. The list is ordered from top to
bottom. The relative position of each dataset can be adjusted by selecting it in the list
and clicking the ‘+’ or ‘-‘ buttons.
Dataset order can be important when visualizing data from multiple sources. The
default behaviour is to stack coverage images on the same order as they are shown in
the list.
The Dataset Menu can be used to adjust the configuration parameters for each dataset.
All datasets allow a custom time interval and a colour table to be set. Setting custom
time intervals for datasets overrides the time interval defined for the view. Further
details on time intervals can be found on section 3.3 of this manual. Details on colour
table selection can be found on section 3.2.1 of this manual.
Each dataset may also provide a custom set of extra configuration options. Most
datasets provide a simple default set of options:
•
•
•
Set data higher bound
Set data lower bound
Set data fill value
The data higher and lower bounds define the colour scale data range. Inverting the
high and low bounds results in colour scale inversion. The fill value is rendered as
transparent when producing coverage images, and is usually set to the dataset no-data
value.
A description of the different options available for some datasets can be found on
section 4 of this manual.
Glob Toolbox User Manual
Page 7 of 20
3.2.1. Colour Tables
The Colour Table Selection dialog can be accessed through the Dataset Menu. This
dialog displays the current colour table used by the dataset, and allows the user to
change it, either by selecting one from the list of included tables or by loading a file
with the appropriate format. Pressing the ‘Load’ button opens an Open File dialog that
can be used to select the desired file.
Figure 3-3: Colour table selection dialog with a custom colour table loaded
Colour table files are simple text files containing a list of values representing the red,
green and blue components for each colour in the table. So, to define a custom colour
table containing only two colours, black and white, the user would only need to create
and load a file containing the following text:
0,0,0,255,255,255
The Colour Table Selection dialog also allows setting the alpha value for the colour
table, enabling the creation of semi transparent coverage maps.
.
3.3. Data View
The data view area contains a set of entry fields to configure the desired view:
•
Time Span
Glob Toolbox User Manual
•
•
Page 8 of 20
Region
Image
The time span entry field defines the time interval for retrieved data. It is defined by a
pair of dates entered in ‘yyyy/mm/dd hh:mm:ss.ms’ format. The input fields for the
dates will turn red when an invalid date is entered. When requesting data, the time
interval is passed to the datasets which decide how to handle it. Details on how each
product deals with time intervals can be found on section 4 of this manual. Each
dataset can have an individual time interval that overrides the one defined for the
view.
The region entry field defines the geographical area for retrieved data. It is defined by
two latitude and longitude pairs. The input fields for the region will turn red when an
invalid coordinate is entered. When requesting data, the region is passed to the
datasets which decide how to handle it. Details on how each product deals with a
region can be found on section 4 of this manual.
The image entry field allows setting either the angular resolution or the width of the
output coverage grid. The resolution is specified in degrees, and is automatically
updated by actions like zooming. The width is specified in pixels, and the vertical size
of the image is automatically set so that the vertical and horizontal angular resolutions
match.
Besides the entry fields, the data view contains the following action buttons:
•
•
Update View
Generate Time Series
The ‘Update View’ button reads data from the active datasets and displays an image
of the read coverage values. Each dataset is rendered individually, and the final image
is a simple composition of the produced images, layered accordingly to the dataset
order. If no datasets are active, an error message box is displayed.
3.3.1. View Menu
Upon displaying the image, the View submenu is created in the main menu of the
application. This submenu provides the following operations:
•
•
•
•
Show View Information
Export Current View
Export Current Selection
Mode submenu
3.3.1.1. Show View Information
Selecting this option displays a text window containing information regarding the
coverage currently being displayed. The window contains the following information:
•
Time interval
Glob Toolbox User Manual
•
•
•
Page 9 of 20
Region
Angular resolution of the displayed coverage
Dataset count
Also, each active dataset is listed with the following information:
•
•
•
Name
Native angular resolution
List of read files
Figure 3-4: View Information dialog
3.3.1.2. Export Current View
Selecting this option opens the Data Export dialog which contains two entry fields:
•
•
File name
Output type
The file name entry field contains the name of the file to where the data should be
exported. Pressing the ‘Browse’ button next to it opens an Open File dialog that can
be used to select the file to use.
The output type entry field lists the available outputs:
•
•
PNG/JPEG/BMP/TIFF image
Text file
Upon pressing the ‘OK’ button, the data from the current view is written to the
specified file using the selected output type.
3.3.1.2.1. Image export
This option exports the rendered coverage as an image file of the selected format.
Glob Toolbox User Manual
Page 10 of 20
3.3.1.2.2. Text export
This option exports the rendered coverage as a comma-separated value (CSV) text
file. Each line contains the latitude, longitude and data values from all the active
datasets for each point in the coverage. A small header containing the time interval,
region, resolution and identification of each column is also included in the file.
3.3.1.3. Export Current Selection
This option is only available if there is an active selection. Details regarding selection
of data can be found on section 3.3.1.4 of this manual.
Selecting this option opens the Data Export dialog. Details regarding the options of
this dialog can be found on section 3.3.1.2 of this manual.
Upon pressing the ‘OK’ button, the data from the current selection is written to the
specified file using the selected output type.
3.3.1.4. Mode submenu
The mode submenu lists the available view interaction modes:
•
•
Area Selection
Zoom
Selecting a mode activates it.
Figure 3-5: View displaying a rendered coverage and a selected region
Glob Toolbox User Manual
Page 11 of 20
When in area selection mode, clicking with the left mouse button on the displayed
image will start the selection. The selection area is represented by a dotted rectangle.
Left-clicking again will complete the selection process. At this point the ‘Update
View’ button turns into the ‘Zoom to Selection’ button, and when pressed will
redefine the view region to the selected area and reread the active datasets. Leftclicking a third time clears the selection rectangle.
When in zoom mode, clicking with the left mouse button on the displayed image
redefines the region entry fields to a smaller geographic area centred on the clicked
point. Further left clicks redefine the region to ever smaller areas. Right-clicking the
image redefines the region entry fields to a larger geographic area centred on the
clicked point. Pressing the ‘Update View’ button rereads the active datasets and
displays the zoomed region.
Both selection and zooming modes require explicit action by the user to render the
data, given the possibly long dataset reading times.
3.3.2. Time Series
Time series creation is achieved by splitting the time interval defined for the current
view into periods of a specified length. Dataset data is read and exported for each of
these periods. The result may be a set of files or a single file with a temporal
dimension, like an animation or a graph. Currently only multi-file export options are
available.
Pressing the ‘Generate Time Series’ button opens the Time Series dialog, which
contains the following entry fields:
•
•
•
•
•
Period
Output type
File name
File path
Selection area restriction
Figure 3-6: Time Series dialog
The period is the amount of time used to split the time interval. The available periods
are:
Glob Toolbox User Manual
•
•
•
•
Page 12 of 20
Days
Weeks
Months
Years
Only one can be chosen at a given time, i.e. it is not possible to define a period of one
year and two days.
The output entry field lists the available export formats. Further information regarding
available outputs can be found on section 3.3.1.2 of this manual.
The file name entry field contains the name of the file to where the data should be
exported. To obtain a set of files, file name modifiers must be specified. If no
modifiers are inserted in the file name, output files will overwrite each other, and only
the last output will be available. The following table summarizes the available
modifiers:
%{count}
Index of the file being created, starting at 1
%{start}
Starting date of the interval used to create the file
%{end}
Ending date of the interval used to create the file
The file path entry field contains the folder to where the exported data should be
written. Pressing the Browse button next to it opens a Browse Folder dialog that can
be used to select the folder to use.
Checking the selection area restriction will only use the selected area to create the
time series. If no area is selected in the view, this option is disabled.
3.4. Preferences
The preferences dialog can be accessed by selecting the Preferences option of the Edit
submenu of the main menu.
Figure 3-7: Preferences dialog
Glob Toolbox User Manual
Page 13 of 20
To view the available options for each section, select it in the section list on the left
side of the dialog. Changes are applied when updating the view, except otherwise
noticed.
3.4.1. Interface
3.4.1.1. Background Colour
Colour of the view area background.
3.4.1.2. Selection Rectangle Colour
Colour of the selection rectangle outline.
3.4.2. Log
3.4.2.1. Log Level
Verbosity of the console log messages. Debug level displays a large amount of
runtime information, and Error will only generate output when errors are found.
Changes to this setting require a restart to be applied.
3.4.3. Data
3.4.3.1. Product Locations
List of locations on the local file system that are searched for supported datasets. A
location can be specified by pressing the “Add Directory” button and browsing for the
desired folder. Multiple locations can be specified. Specific locations can be removed
by selecting them in the list and pressing the “Remove Selected” button.
The load time of Glob Toolbox increases with the number of files present in the
specified locations.
Changes to this setting require a restart to be applied.
3.4.4. Image
3.4.4.1. Background Colour
Colour of the rendered coverage background.
3.4.4.2. Colour Bar
3.4.4.2.1. Active
When this setting is active, Glob Toolbox draws a colour bar at the bottom of the
image, representing the colour table being used by the top dataset. Not all datasets
support colour bar output, with the bar being suppressed in such cases.
Glob Toolbox User Manual
Page 14 of 20
3.4.4.2.2. Background Colour
Colour of the colour bar area background.
3.4.4.2.3. Text Colour
Colour of the line surrounding the colour bar and of its legend text.
3.4.4.3. Country Boundaries
3.4.4.3.1. Active
When this setting is active, Glob Toolbox draws the country boundaries described on
its default database on top of the rendered coverage.
3.4.4.3.2. Line Colour
Colour of the line used to draw the country boundaries.
3.4.4.3.3. Line Width
Pixel width of the line used to draw the country boundaries.
3.4.4.4. Vector Data
3.4.4.4.1. Active
When this setting is active, Glob Toolbox draws all simple geometries described in
the specified vector data files on top of the rendered coverage.
3.4.4.4.2. Files
List of shape files on the local file system. A file can be specified by pressing the
“Add File” button and browsing for the desired file. Multiple files can be specified.
Specific files can be removed by selecting them in the list and pressing the “Remove
Selected” button.
The file format can be any of those supported by the OGR library. More information
regarding supported formats can be obtained at the following web page:
http://www.gdal.org/ogr/ogr_formats.html.
3.4.4.4.3. Line Colour
Colour of line used to draw the geometries.
3.4.4.4.4. Line Width
Pixel width of the line used to draw the geometries.
Glob Toolbox User Manual
Page 15 of 20
4. Supported Products
Support for data products is intended to be as seamless as possible to the user. In most
cases, the procedure to enable access to the products within Glob Toolbox consists of
obtaining the product files and adding their location to the product locations list in the
Preferences Dialog.
Although details regarding the format and naming scheme of data files are not needed
for casual usage, interested users can obtain this information by consulting the
developer documentation provided with the application.
4.1. GlobCover
To access these datasets at least one copy of a data file from the product must exist in
one of the location folders configured in the application. GlobCover bimonthly,
annual, and GlobCover Landcover products are supported.
GlobCover data and specifications can be obtained at the following location:
http://ionia1.esrin.esa.int
The data must be in HDF4 format, uncompressed, and the file names must comply
with the GlobCover file naming scheme. Uncompressing downloaded tiles into a
known location should assure that all conditions are met.
When reading datasets from this product, the latest available data that intersects the
requested time interval is returned. This rule is applied on each read tile.
Each dataset returns the raw values stored in the files. For units and range information
consult the product specification.
4.1.1. Dataset options
The RGB Composite datasets provide a custom set of option in the dataset menu.
The 3-band RGB Composite dataset provides the following options:
•
•
•
Set Band List
Set Band Maximum Reflectance
Set Colour Adjustment Values
The band list option allows selection of the bands used to create the RGB composite.
It expects a comma separated list of three band numbers to use as the red, green and
blue components respectively.
The band maximum reflectance option allows definition of the higher bound of the
reflectance value for each of the bands.
The values specified using the colour adjustment option define the curve used to
convert reflectance values to colour component intensity. Each value adjusts the curve
of the respective colour component.
Glob Toolbox User Manual
Page 16 of 20
The n-band RGB Composite dataset provides the following options:
•
•
•
•
•
Set Red Band List
Set Blue Band List
Set Green Band List
Set Band List Maximum Reflectance
Set Colour Adjustment Values
Each of the band list options allows selection of the bands used to create each
component of the RGB composite. Any number of bands may be used for any of the
colour components.
The remaining options behave like their similar counterparts of the 3-band RGB
composite, described above.
4.2. GlobCarbon
To access these datasets at least one copy of a data file from the product must exist in
one of the location folders configured in the application.
GlobCarbon data and specifications can be obtained at the following location:
http://www.globcarbon.info
The file names must comply with the recognized file naming scheme. Copying
downloaded files into a known location should assure that all conditions are met.
Compressed downloaded files are uncompressed and read as needed.
When reading datasets from this product, the latest available data that intersects the
requested time interval is returned.
Each dataset returns the raw values stored in the files. For units and range information
consult the product specification.
4.3. Global Land Cover 2000
To access this dataset a copy of the GLC2000 global product must exist in one of the
location folders configured in the application.
GLC2000 data and specifications can be obtained at the following location:
http://www-gvm.jrc.it/glc2000/ProductGLC2000.htm
The data must be in img format, uncompressed, and the file name must comply with
the recognized file naming scheme. Uncompressing a downloaded img product into a
known location should assure that all conditions are met.
When reading datasets from this product, time interval information is ignored and the
available data for the specified region is always returned.
The dataset returns the raw values stored in the file. For units and range information
consult the product specification.
Glob Toolbox User Manual
Page 17 of 20
4.4. Medspiration
To access these datasets at least one copy of a data file from the product must exist in
one of the location folders configured in the application.
Medspiration data and specifications can be obtained at the following location:
http://www.medspiration.org
The file names must comply with the recognized file naming scheme. Copying
downloaded files into a known location should assure that all conditions are met.
Compressed downloaded files are uncompressed and read as needed.
When reading datasets from this product, the latest available data that intersects the
requested time interval is returned.
Each dataset returns the raw values stored in the files. For units and range information
consult the product specification.
4.5. World Fire Atlas
To access these datasets at least one copy of a data file from the product must exist in
one of the location folders configured in the application.
World Fire Atlas data and specifications can be obtained at the following location:
http://dup.esrin.esa.int/ionia/wfa
The file names must comply with the recognized file naming scheme. Uncompressing
downloaded files into a known location should assure that all conditions are met.
Individual monthly data files can remain compressed, as they are uncompressed and
read as needed.
When reading datasets from this product, the hot spot count for each point in the
requested region across the requested time interval is returned.
4.6. GlobColour
To access these datasets at least one copy of a data file from the product must exist in
one of the location folders configured in the application.
GlobColour data and specifications can be obtained at the following location:
http://www.globcolour.info
No support for binned or track products is available in this release. The file names
must comply with the recognized file naming scheme. Copying downloaded files into
a known location should assure that all conditions are met.
Compressed downloaded files are uncompressed and read as needed.
Glob Toolbox User Manual
Page 18 of 20
When reading datasets from this product, the latest available data that intersects the
requested time interval is returned.
Each dataset returns the raw values stored in the files. For units and range information
consult the product specification.
Glob Toolbox User Manual
Page 19 of 20
5. License and Disclaimer
5.1. Glob Toolbox
This program is free software; you can redistribute it and/or modify it under the terms
of the GNU General Public License as published by the Free Software Foundation;
either version 2 of the License, or (at your option) any later version.
This program is distributed in the hope that it will be useful, but WITHOUT ANY
WARRANTY; without even the implied warranty of MERCHANTABILITY or
FITNESS FOR A PARTICULAR PURPOSE. See the GNU General Public License
for more details.
You should have received a copy of the GNU General Public License along with this
program. If not, see http://www.gnu.org/licenses.
5.2. Additional licenses
This program is distributed with compiled binaries that are covered by different
licenses. The copyright and licensing terms for each of these components can be
found in their respective LICENSE files.