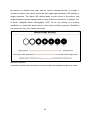
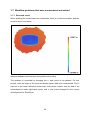
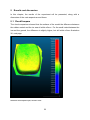
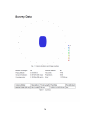
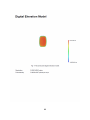
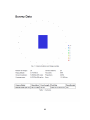
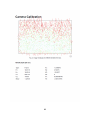
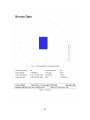
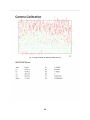
The differences are available as plots and graphs.
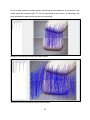
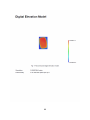
Illustration 33 Difference plot
Measurements in meters, colour scale ± 1 cm, white is within ± 3mm
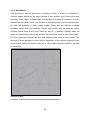
Illustration 34 Gauss distribution of comparison (in meters)
The mean is -0.3mm and the standard deviation is 2 mm
47