1
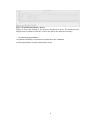
Openthinclient-solution, see appendix E. For detailed information regarding the tests
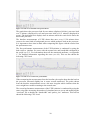
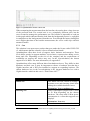
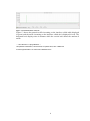
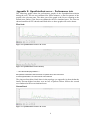
(see 4.4). This test has shown the following CPU-Load:
Figure 7: Openthinclient-Test#1: CPU-Load
When comparing the measurement from the baseline, the results show that the overall
load on the processor increased slightly but it during the performance test (the first
quarter of the graph), it seems largely unaffected. The peaks shown from the baseline
measurements seem a bit more irregular which indicates that the server might have
trouble returning to the normal state.
The second performance measurement of the Openthinclient-solution is conducted the
same way as on the LTSP-solution: The measurements are conducted by using the
same script after increasing the number of simulated users to seven and modifying the
“send.yml” file to double the “bandwidth” and “packet_size” attributes. This test has
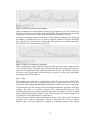
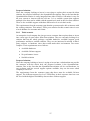
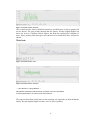
shown the following CPU-Load:
Figure 8: Openthinclient-Test#2: CPU-Load
When comparing the measurement from the first performance test, the results show
that the load on the processor has increased slightly. The graph shows that during the
test, the processor load increased by an amount that made the baseline hard to read
out.
The final performance measurement of the Openthinclient-solution is conducted the
same way as on the LTSP-solution: The measurements are conducted by increasing
the number of simulated users to 15 and by using the original script after modifying
the “send.yml” file to increase the “bandwidth” and “packet_size” attributes ten times.
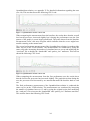
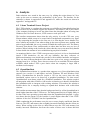
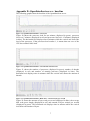
This test has shown the following CPU-Load:
24