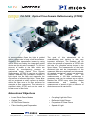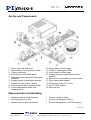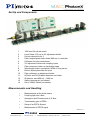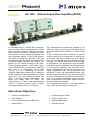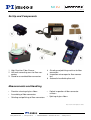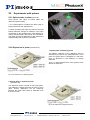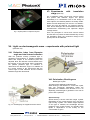
1
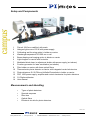
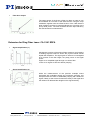
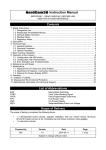
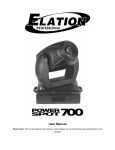
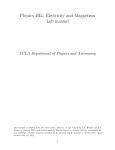
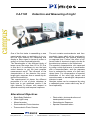
CA-1100 Detection and Measuring of Light One of the first tasks in assembling a new experimental setup or application is to select the right detector for measuring and display a laser signal in terms of power or energy or its time-resolved behavior. The wavelengths of the different kinds of lasers cover the range from UV to IR. Due to this fact it is necessary to use the best suited detector to get the best possible measurement result. The influence of the characteristics of the detector like wavelength gain, response time or sensitivity determine the selection. This experimental kit shows the different properties of a set of photo detectors to learn how to get optimized results if the right detector is chosen with respect to spectral sensitivity and temporal response. The set contains semiconductor and thermoelectric types which will be analyzed in their characteristics like spectral sensitivity or response time. Further, the effect of different kinds of electronic supply circuits for the detectors is shown in the experiment. The spectral characteristics are measured by using a white light source in combination with a monochromator, and the response time is evaluated by means of a fast modulated laser. For compensation of spectral distribution of the used light source and monochromator a wavelength independent detector is used. Absolute values can be measured by using a calibrated power meter which may be offered optionally. Educational Objectives Black Body Radiation White Light Lamp Monochromator Semiconductor Photo detectors Thermoelectric Photo Detector www.pimicos.com // [email protected] // 508.832.3456 East Photovoltaic, photoconductive and transimpedance mode Photodetector Response Spectral Characterization 949.679.9191 West // www.pi-usa.us Setup and Components 1 2 3 Flat rail 1000 mm modified, with scale Halogen light source 150 W with power supply Collimating and focusing optics in holder on carrier 4 5 6 Wavelength separator 450-1500 nm on rail Beam shaping and imaging optics in holder on carrier Light chopper on carrier with controller 7 8 9 Modulated diode laser in adjustment holder with power supply (not shown) Function generator for laser modulation (not shown) Filter holder on carrier with three optical filters 10 11 12 Thermoelectric photo detector on carrier with integrated control electronics Photo detectors: Si- Si-PIN and InGaAs-Photodiode in holder on carrier PDC 1000 power supply, amplifier and control electronics for photo detectors 13 14 3½ Digits multimeter User manual Measurements and Handling Types of photo detectors Spectral response Rise time Optical filters Electronic circuits for photo detectors Version 1/12 www.pimicos.com // [email protected] // 508.832.3456 East 949.679.9191 West // www.pi-usa.us CA-1400 Plastic Fiber Optics Optical data transmission is nowadays a standard technique in telecommunication. Glass fiber lines are widespread all over the globe. However, in multimedia systems, automotive systems, home networks or control systems plastic optical fiber (POF) networks can often be found. Reasons for the choice of POF can be the lower price, the need of only short transmission lines (50 – 100 m), environmental conditions not suited for glass fiber, or simply the easy way of installation of a POF network. Within this educational kit the basics of plastic fibers concerning fiber preparation as well as data transmission are treated. The preparation of a POF will be trained to the students. Stripping of a fiber, and as- sembling and polishing of a connector are practiced. The measurement of transmission losses of different lengths of POFs as well as the setup of a complete two channel low frequency data transmission system will be performed. All necessary components, fibers and control electronics like modulator, transmitter, receiver, demodulator and an audio amplifier with two speakers are included. Other signal sources like a CD player or a microphone can be connected to the transmitter. For the measurements a signal oscilloscope is necessary and can be ordered as an option. Educational Objectives LED Transmitter LED Signal Modulation Si Photo Detector Receiver Dichroic Beam Splitter www.pimicos.com // [email protected] // 508.832.3456 East Dual Wavelength Data Transmission Plastic Fiber Handling and Preparation Plastic Fiber Attenuation Signal Beating and Cross Talk 949.679.9191 West // www.pi-usa.us Setup and Components 1 Flat Rail 500 mm with scale 2 Controller for LED transmitter with frequency generator, photo diode receiver and demodulator 3 POF Y-coupler on carrier 4 FSMA coupler in holder on carrier 5 FSMA coupler in XY adjustment holder on carrier 6 Light receiver system with beam separation and detectors 7 3 POF cables with two FSMA connectors (length 10 m, 20 m, 30 m) 8 Pair of active stereo speakers 9 Set of tools for fiber preparation and assembling of FSMA connectors 10 Set of necessary BNC cables and adapters (not shown) 11 User manual www.pimicos.com // [email protected] // 508.832.3456 East 949.679.9191 West // www.pi-usa.us Measurements and Handling Some of the possible measurements are presented in the following list. Preparation of plastic fiber (POF) and assembling of POF connectors Although the setup comes already with terminated and polished fibers, a set of tools, a bare fiber coil and connectors are added to get experienced to prepare the fiber to be connected and subsequently to be polished. Since the FSMA connectors can be removed easily from the fiber it can be a first task of the students to assemble a pair of connectors to a piece of fiber, as well as grinding and polishing the fiber tip for optimum transmission. Attenuation of connector pair A two channel (red and green LED) transmission line with a short piece of POF is set up. The signal values of the two channels are detected and the attenuation of the two connectors is calculated. The attenuation of the short fiber piece may be neglected in first approximation. Attenuation of plastic fiber lines The attenuation of three measurement fiber lines (10 m, 20 m or 30 m) and their combinations is measured for both, the red and the green channel. The values are plotted as a function of the fiber line and the attenuation per meter and per km is calculated. The difference in the attenuation for the red and the green channel is figured out. The measurements are repeated for FM modulated signals. Is there a difference compared to the measurements with AM modulation? May there be some signals lost by the data transmission? Modulation and demodulation of LED light The transmitter and modulator unit of the Plastic Fiber Controller PFC 1000 converts electrical to optical signals which are launched into two plastic optical fiber channels by a red and a green LED. These signals can either be generated by a CD player, a microphone or other audio sources. Additionally, the transmitter contains an internal frequency generator for each of the two independent channels. A two position switch allows to set the modulation to amplitude (AM) or frequency modulation (FM) at a fixed carrier frequency. The receiver unit of the PFC 1000 receives and demodulates the signals transmitted by the POF setup. Each of the two channels are separately amplified and can be displayed on an oscilloscope via BNC outlets www.pimicos.com // [email protected] // 508.832.3456 East 949.679.9191 West // www.pi-usa.us Transfer of sinusoidal signals Some examples of signal outputs of the PLC 1000 displayed on a digital oscilloscope are given below. Modulator output at AM modulation Feeding the two modulated output signals to the oscilloscope the graph may look like the following picture. Here one signal frequency is chosen as about three times the frequency of the other signal. In an ideal case the demodulator output signals of the Receiver may look simmilar, but reduced in their amplitude. Modulator output and signal at FM modulation A sinusoidal signal (upper curve) is transmitted in the FM modulation mode like shown in the lower curve. A rectangular TTL signal is modulated in its frequency according to the sinusoidal input signal. After transmission via the POF setup the demodulator output signal should look like the upper curve again. However, there is a signal intensity threshold at which the demodulator is not working properly any more. Signal cross talk due to spectral overlap If one signal channel has a much higher amplitude than the other, the effect of cross talk may appear, i.e. the signal of one channel is more or less present at the other channel as well. This behavior is presented in the next graph which shows the “pure” signal from the modulator output in the upper curve and the same signal overlayed by the second channel’s signal from the demodulator output in the lower curve. Signal beating If the two input signals have almost the same frequency, one can observe a signal beating which is the result of alternating constructive and destructive interference of the two signals. This beating is nicely observed if the two signals are detected by one photo detector and the amplitudes of the two signals have the same heights. Version 2/10 www.pimicos.com // [email protected] // 508.832.3456 East 949.679.9191 West // www.pi-usa.us CA-1410 Glass Fiber Optics It was the communications technology that required an increase of data transfer rate and started the solution of this problem by sending signals down hair thin strands of glass fibers. It began about 40 years ago in the R&D labs (Corning, Bell Labs, etc.) and was first installed in Chicago in 1976. By the early 1980s, fiber networks connected bigger distances and in the 90s, TV started the use of fiber to enhance the reliability of their networks. Along the time, phone and Internet service, computers and LANs started using glass fibers. The continents became connected via glass fiber cable laid across the oceans. Applications in automobiles, aircrafts, ships and audio/video came up. Nowadays communica- tions technology without glass fiber optics is unthinkable. This education kit is excellently suited for a comprehensive introduction to theory and handling of glass fibers. The preparation of glass fibers by stripping and cleaving with appropriate tools are taught. The kit enables students coupling laser light into a multi- and singlemode fiber, respectively. The measurement of fiber parameters like numerical aperture and transmission losses are performed. All required mechanical, optical and electronic components for the setup are included. For time resolved measurements a 100 MHz oscilloscope is required and can be ordered as an option. Educational Objectives Characterization of Fibers Guiding of Light in Fibers Laser Diodes www.pimicos.com // [email protected] // 508.832.3456 East Photo Detectors Coupling Optics Communication 949.679.9191 West // www.pi-usa.us Set-Up and Components 1 2 3 4 5 Set of 2 flat rails 500 mm with scale Laser Diode in XY adjustment holder Control electronics LDS 1200 Collimator for laser diode beam XY adjustment holder for fiber coupling optics 6 Fiber holder on translation stage 7 8 9 10 11 12 13 Fiber holder on articulated connector Photo detector in holder 2 x ~1000 m Optical glass fibers (SM/MM) Fiber cleaver and stripper IR detector screen 0,8-1,6 µm Set of 3 BNC cables User manual Measurements and Handling Measurements of the diode laser Coupling light into a fiber Measurement of fiber parameters Runtime of light in fibers Stripping and cleaving of fibers Version 1/10 www.pimicos.com // [email protected] // 508.832.3456 East 949.679.9191 West // www.pi-usa.us CA-1420 Optical Time Domain Reflectometry (OTDR) In communication fibers the light is guided within a 'glass tube' of only a few micrometers. Reducing fiber transmission losses by using active fibers and finding the integrated optical device are the big aims nowadays. To find out sources of losses in the fiber which are induced by manufacturing process or mechanical stress Optical Time Domain Reflectometry (OTDR) is used as an efficient method. Basically this procedure couples a light signal into the fiber and measures the occurrence of reflected light blips. These blips will be produced at stray centers at defects within the fiber core or at fiber surfaces for example at fiber connectors. This behavior is exploited within OTDR and can be used to locate errors in fiber links. The goal of this educational kit is understanding and training in this very important technique. The students will be shown the principle of operation of OTDR with the help of a complete set-up shown in the figure below. The measurement of the back scattered light and the interpretation of the measured data are explained and discussed. All needed mechanical, optical and electronic components are included. For the measurements a 100 MHz oscilloscope is necessary and can be ordered as an option. Besides the OTDR many other fiber related measurements and handling like measurement of speed of light or behavior of diode lasers can be carried out. Educational Objectives • • • • Laser Diode Power Modes Optical Fiber Si PIN Photo Detector Fiber Handling and Preparation www.pimicos.com // [email protected] // • • • • 508.832.3456 East Coupling Light into Fiber Reflected Light Echoes Properties of Glass Fibers Speed of Light 949.679.9191 West // www.pi-usa.us Set-Up and Components 1 2 3 4 5 6 7 8 9 Set of 4 flat rails with scale Laser Diode in XY adjustment holder Control electronics Collimator for laser diode beam Adjustable beam splitter on articulated connector Imaging optics for start pulse detector Detector for start pulse in holder Quarter wave plate in rotation holder 5-axes adjustments holder with coupling optics 10 11 12 13 14 15 16 17 18 Fiber holder on linear stage ~1000 m Optical glass fibers Fiber holder on linear stage Imaging optics for measurement pulse detector Detector for measurement pulse in holder Fiber cleaver and stripper IR detector screen 0,8-1,2 µm Set of 3 BNC cables User manual Measurements and Handling • • • Measurements at the diode laser Coupling light into a fiber Measurement of fiber parameters • • • Runtime of light in fibers Cutting and stripping of fibers Set-up and alignment of OTDR Systems Version 1/09 www.pimicos.com // [email protected] // 508.832.3456 East 949.679.9191 West // www.pi-usa.us CA-1430 Erbium Doped Fiber Amplifier (EDFA) An important step in optical fiber technology has been done with the development of fibers which are able to amplify light through stimulated emission. Erbium is a metallic rare earth element that is used to amplify light signals sent along fiber-optic cables. If ions of this element are doped in a glass fiber and light of a suited wavelength is send through it, the result may be an Erbium-Doped Fiber Amplifier (EDFA), depending on the optical pumping of the fiber. These amplifiers provide a large gain, which occurs when the fiber is pumped by additional light input at a wavelength shorter than 1.55 µm, e.g. at a wavelength of 980 nm. Therefore large output power may be obtained. EDFAs enable the user transmitting an optical signal over very long distances without the need for electronic signal regeneration. Two bands are usually used for EDFA: the Conventional, or C-band, from approximately 1525 nm – 1565 nm, and the Long, or L-band, from approximately 1570 nm to 1610 nm. This educational kit teaches the principle of an EDFA by using an open frame setup which shows all single components instead of a closed 'black box'. A fiber coupled laser diode at 980 nm is used as pump source for an Er doped fiber of several meters length. This light is coupled into an Er doped fiber via a wavelength division multiplexer (WDM). The light of a 1,55 µm laser diode is used as signal to be amplified. The signal source is a free-space laser diode which is coupled in the WDM with help of a microscope objective. The interaction of the pump and signal laser with the Er fiber as well as signal amplification can be demonstrated and measured. Further, the characteristics (laser threshold and slope efficiency) of the two laser signals and the fluorescence of the active fiber can be studied. All necessary mechanical, optical and electronic components for the EDFA system shown in the figure above are included. The measurements require a 100 MHz oscilloscope, which can be ordered as an option. Educational Objectives: Emission and Absorption Coupling Light to Fibers Laser Diodes Erbium doped Fibers Laser Threshold and Slope Efficiency Optical Amplification Optical Fibers Optical Pumping www.pimicos.com // [email protected] // 508.832.3456 East 949.679.9191 West // www.pi-usa.us Set-Up and Components 1 2 3 4 5 6 7 8 9 10 11 12 13 14 1000 mm flat rail with scale Laser Diode 1,55 µm in XY adjustment holder Control electronics for 2 Fiber coupled pump laser diode (980 nm) in controller Collimator for laser diode beam XY adjustment holder with coupling optics Fiber connector holder on translation stage Wavelength division multiplexer WDM on long carrier Erbium doped glass fiber on spool Fiber collimator on adjustment holder InGaAs- and Si-PIN photo detectors on holder IR detector card 800 nm – 1600 nm Optics cleaning set (not shown) Set of 4 BNC cables (not shown) Measurements and Handling Measurements at the diode lasers Coupling light into a fiber Absorption and Fluorescence of Er fiber Transmission gain of EDFA Setup of an EDFA System Measurement of EDFA signal Version 1/11 www.pimicos.com // [email protected] // 508.832.3456 East 949.679.9191 West // www.pi-usa.us CA-1430 Erbium Doped Fiber Amplifier (EDFA) An important step in optical fiber technology has been done with the development of fibers which are able to amplify light through stimulated emission. Erbium is a metallic rare earth element that is used to amplify light signals sent along fiber-optic cables. If ions of this element are doped in a glass fiber and light of a suited wavelength is send through it, the result may be an Erbium-Doped Fiber Amplifier (EDFA), depending on the optical pumping of the fiber. These amplifiers provide a large gain, which occurs when the fiber is pumped by additional light input at a wavelength shorter than 1.55 µm, e.g. at a wavelength of 980 nm. Therefore large output power may be obtained. EDFAs enable the user transmitting an optical signal over very long distances without the need for electronic signal regeneration. Two bands are usually used for EDFA: the Conventional, or C-band, from approximately 1525 nm – 1565 nm, and the Long, or L-band, from approximately 1570 nm to 1610 nm. This educational kit teaches the principle of an EDFA by using an open frame setup which shows all single components instead of a closed 'black box'. A fiber coupled laser diode at 980 nm is used as pump source for an Er doped fiber of several meters length. This light is coupled into an Er doped fiber via a wavelength division multiplexer (WDM). The light of a 1,55 µm laser diode is used as signal to be amplified. The signal source is a free-space laser diode which is coupled in the WDM with help of a microscope objective. The interaction of the pump and signal laser with the Er fiber as well as signal amplification can be demonstrated and measured. Further, the characteristics (laser threshold and slope efficiency) of the two laser signals and the fluorescence of the active fiber can be studied. All necessary mechanical, optical and electronic components for the EDFA system shown in the figure above are included. The measurements require a 100 MHz oscilloscope, which can be ordered as an option. Educational Objectives: Emission and Absorption Coupling Light to Fibers Laser Diodes Erbium doped Fibers Laser Threshold and Slope Efficiency Optical Amplification Optical Fibers Optical Pumping www.pimicos.com // [email protected] // 508.832.3456 East 949.679.9191 West // www.pi-usa.us Set-Up and Components 1 2 3 4 5 6 7 8 9 10 11 12 13 14 1000 mm flat rail with scale Laser Diode 1,55 µm in XY adjustment holder Control electronics for 2 Fiber coupled pump laser diode (980 nm) in controller Collimator for laser diode beam XY adjustment holder with coupling optics Fiber connector holder on translation stage Wavelength division multiplexer WDM on long carrier Erbium doped glass fiber on spool Fiber collimator on adjustment holder InGaAs- and Si-PIN photo detectors on holder IR detector card 800 nm – 1600 nm Optics cleaning set (not shown) Set of 4 BNC cables (not shown) Measurements and Handling Measurements at the diode lasers Coupling light into a fiber Absorption and Fluorescence of Er fiber Transmission gain of EDFA Setup of an EDFA System Measurement of EDFA signal Version 1/11 www.pimicos.com // [email protected] // 508.832.3456 East 949.679.9191 West // www.pi-usa.us CA-1450 Workshop Glass Fiber Optics Within this workshop the probationer will learn to prepare fibers. Stripping by removing the plastic cladding is done by Miller pliers. After cleaving process the fiber face is perpendicular and of optical quality by defined breaking. This can be achieved by slightly scratching the fiber by means of a ceramic or diamond blade when it is bent and exposed to a defined force in direction of the fiber axis. Afterwards the fiber is married with the right connector by using a two component glue. A fiber inspection microscope is used to control centricity and optical quality of the fiber face. To improve the quality a polishing machine is used. Following content is splicing of fibers which means direct connecting of two optical fibers. The arc diffusion splicing is a kind of welding where both fiber ends are exposed to an electrical arc. Before both fibers are positioned visually or microprocessor controlled. In this experiment the fibers can be aligned " in the field" by precision V- grooves. The fiber position can be controlled by build-in vision control system. After alignment of the fibers can be spliced by a single button press. After a cleaning arc the quality of the fiber connecting will be tested concerning axis shift, angle errors and tensile strength. Finishing this workshop the student will be fit in glass fiber handling. Educational Objectives • Fiber Connectors • Fiber Polishing • Fiber Stripping • Fiber Inspection • Fiber Breaking • Fiber Splicing www.pimicos.com // [email protected] // 508.832.3456 East 949.679.9191 West // www.pi-usa.us Set-Up and Components 1 High Precision Fiber Cleaver 2 Holt melt cementing oven for fiber connectors 3 Stand for assembled fiber connectors 4 Grinding and polishing machine for fiber connectors 5 Inspection microscope for fiber connectors 6 Automatic handheld splicer unit Measurements and Handling • Precision cleaving of glass fibers • Assembling of fiber connectors • Grinding and polishing of fiber connectors • Optical inspection of fiber connector surfaces • Splicing of glass fibers Please note: The shown pictures are similar www.pimicos.com // [email protected] // 508.832.3456 East 949.679.9191 West // www.pi-usa.us CA-1240 CA-1241 Fiber Ring Laser Extension EDFA This fiber laser set offers a multitude of experimental performances. As a start-up measurement the characterization of the 980 nm pump laser concerning the diode current or the beam profile is recommended. Coupling the pump light in the erbium fibers, absorption and fluorescence properties can be investigated. With help of a resonator mirror a linear erbium fiber laser can be realized. Closing the resonator for a ring the fiber ring laser is built. Both types can be investigated with respect to several parameters, for example the active fiber length (four different lengths of erbium fibers are provided), the amount of losses (variable in 11 steps), the pump power, and so on. The ring laser can be www.pimicos.com // [email protected] // 508.832.3456 East operated bi-directional. An optical diode allows an unidirectional operation in or against the pumping direction as well. The pump diode controller contains an internal modulator which enables investigations of statical as well as dynamical laser processes. If a laser source of 1,55 µm is available (optionally offered by miCos: CA-1241 EDFA) then the interaction of this laser light with the erbium fibers can be studied. By simultaneously pumping of the fibers at 980 nm an erbium doped fiber amplifier (EDFA) is realized and can be investigated. Several EDFA measurements concerning the fiber length, pump laser power, signal laser power etc. are possible. 949.679.9191 West // www.pi-usa.us Educational Objectives • Absorption/emission of the gain medium • Laser spiking • Optical pumping • Introduction of losses • Fluorescence lifetime • Dynamic laser behavior • Laser threshold • With extension: erbium doped fiber • Slope efficiency amplifier (EDFA) Components The Fiber Ring Laser kit consists of: 1 2 3 4 5 6 Baseplate 700 x 500 mm Fiber coupled laser diode 980 nm / 100 mW Laser diode controller LDS 1200 with internal photo amplifier, current modulator and temperature control Wavelength division multiplexer 980/1550 nm Fiber drum with four erbium fibers (1 – 4 m) Optical diode 1550 nm 7 8 9 10 11 12 13 14 Pair of fiber collimators in θ,ϕ adjustment holders for free-beam line Step density filter with 11 steps on slide Pair of Si-PIN and InGaAs photodetectors in XY adjustment holders Plane mirror in mount Set of singlemode patch cables Infrared detector card 800 – 1600 nm Set for optics cleaning User manual The extension EDFA contains: 15 16 Fiber coupled laser diode 1550 nm / 1 mW Laser diode controller LDS 1200 with internal photo amplifier, current modulator and temperature control www.pimicos.com // [email protected] // 508.832.3456 East 949.679.9191 West // www.pi-usa.us Measurements and Handling Some of the possible measurements are presented. This presentation is by far not complete. • Pump diode output The output power of the pump diode laser at 980 nm is measured as a function of the diode current. For this purpose the ramp modulation mode of the LDS 1200 diode controller is used. The laser threshold and the slope efficiency are derived from this measurement. • Absorption of pump laser light The transmission of the pump light through erbium fibers is detected. When rectangular modulation of the diode current is applied, the absorption of the pump light (980 nm) by the fibers can be seen as a function of the fiber length. Upper curve: pump diode current as a function of time Lower curve: measured pump power through the 1 - 4m (up to down) erbium fibres as a function of time • Fluorescence at 1550 nm When pumping the erbium fibers the fluorescence of the active centers in the fiber is observed. This fluorescence can be measured as a function of the pump diode current and as a function of the fiber length. • Fiber laser oscillation When the fiber ring laser is closed and the pump diode current is rectangular modulated one can observe the start-up oscillation of the laser emission. Parameters like signal amplitude, damping strength, or signal onset can be investigated as a function of pump power, fiber length or output coupling ratio (gain/losses). Upper curve: pump diode current Lower curve: Erbium laser signal www.pimicos.com // [email protected] // 508.832.3456 East 949.679.9191 West // www.pi-usa.us • Fiber laser output The output power of the linear or fiber ring laser at 1550 nm can be measured as a function of the diode current. Using the ramp modulation together with the offset function of the LDS 1200 the laser emission can also be measured directly as a function of the pump diode power. The laser threshold and the slope efficiency are derived from this measurement. Extension for Ring Fiber Laser: CA-1241 EDFA • Signal amplification (1) Simultanous pumping of the erbium fibers at 980 nm and inserting a seeding signal at 1550 nm shows the physics behind erbium doped fiber amplifiers. The signal gain at 1550 nm is investigated as a function of the fiber length, the pump power or the signal power. Upper curve: amplified signal through 3 m erbium fiber Lower curve: signal at 1550 nm without pumping • Signal amplification (2) While the measurements of the previous example where performed with modulated signal and continuous pumping, this example shows the effect of modulated pumping with continuous signal. Clearly to see are the fluorescence decay of the signal and the influence of different fiber lengths on the signal intensity. www.pimicos.com // [email protected] // 508.832.3456 East 949.679.9191 West // www.pi-usa.us CA-2100 Optics-System Refraction and Reflection Transparent Setup, together with test and report templates as a unit Fig. E1: Transparent Setup with test and report templates – optical paths With the invention of the laser in 1960, the age of photonics has started. This innovation permeates the whole economy and requires that the education on secondary schools and on universities provides for this invention. Therefore, it is not just for physics students of great interest to understand the laws of optics. Also for biologists, physicians, engineering scientists, and in fundamental physics at the upper secondary education this knowledge is essential. Modern experimental setups are necessary to allow the experimental investigation of the since ages well known laws of refraction and reflection by means of the new source of radiation: laser. In this modern experimental system, the transparent platform and the so-called test and report templates belong together as a whole. In nature all processes appear in parallel. With the test and report templates the didactic reduction of the individual process and its respective learning content is realized. For each individual experiment, a special template is given to each student. The templates serve a triple function: The company miCos has set itself the task to produce this modern experimental setup for universities and colleges, and therefore has obtained a license from the developer, the Philipps-University Marburg. 3. Didactic reconstruction of the experiment by the student during the post processing phase With this setup, the phenomena of reflection, refraction and transmission, which always occur together, are individually assessed in a tight experimental time frame by a new educational concept. This modern training system is particularly well suited for physical training programs in medicine, biology, pharmacy and engineering. Another important field of application is secondary school physics teaching. www.pimicos.com // [email protected] // 1. Instruction of performance: the experiment is printed on the template 2. Experimental results are to be noted on the templates A qualified visualization of the ray traces are optimal conditions for learning of optical phenomena. 508.832.3456 East 949.679.9191 West // www.pi-usa.us The Optics System consists of a basic kit and extension kits Experiments with the basic kit: Experiments with extension kits: V 1.1 Optical paths in a plane-parallel plate – refraction and reflection on acryl glass V 1.6 Stronger reflection of metals V 1.2 Refraction on water V 1.3 Optical transition glass – water V 1.4 Parallel translation by a plane-parallel plate V 1.5 Total internal reflection on a planeparallel plate (optical wave guide) V 2.2 Dispersion of Prisms V 4.1 Index of refraction, determined via Brewster angle and compared to the determination via total internal reflection V 4.2 Properties of birefringent crystals and optical activity V 2.1 Refraction and reflection on a prism V 5.0 Investigation of slits and transmission gratings V 3.0 Investigation of ray traces in optical 2D bodies (prisms and lenses) V 6.0 Absorption by optical filters Fig. E2: Overview of the optical objects Beam design As a light source a green diode laser is used. Further, the beam design can be varied by a red diode laser, a polarizing filter and a slit for additional optical experiments. Fig.E3: Laser source with modular attachments: polarisation filter and optical slit www.pimicos.com // [email protected] // 508.832.3456 East 949.679.9191 West // www.pi-usa.us Setup and Experiments V1. Optical paths V1.1 Optical paths in plane-parallel plate (basic kit) At the beginning, the light paths in a plane-parallel plate are studied. In Figure 1.1a, the typical well known beam splitting in reflective and transmissive beams is observed at the front surface. In this experiment this representation is transferred to two interfaces. Fig. 1.1a: Beam splitting on a partially reflecting surface Next, the didactic reduction to the investigation of the reflection and refraction law at the plane-parallel plate is performed. The parallel translation of the transmitting beam is evaluated in the experiment V1.4, and will be neglected here. In experiment V1.1 a green laser mounted on a goniometer, the angular range from 0° to 80° is continuously scanned. The refraction and reflection at the two interfaces is observed. The refractive angle is read out at its point of origin of the planeparallel plate. This allows the tangent-scaled measure engraved in the exit face of the plane-parallel plate. Fig. 1.1b: Beam paths in a plane parallel plate Then, typically in 10° steps, the angle of refraction and reflection are noted in the table of the experimental protocol or directly on the test and report template. Further, the optical paths are sketched on the template. In this way, the reflection and refraction law (Snell's law) is verified. In the post processing phase these optical laws can be reconstructed by the student with help of the test and report template. V1.2 Investigation of refractive index of liquids (basic kit) At the test and report template of experiment V1.2 all beam paths are didactically reduced to the law of Snell. In this experiment liquids are investigated. The reflection at the front surface is not taken into account in this investigation. On the Template V1.2 "Snell’s Law - Air Water" also the experimental setup is shown. For the investigation of the refractive indices of liquids, the transmission tray is fixed on the transparent platform by the guiding pins. A tangentscaled measure is engraved on the exit face of the transmission tray, so the refractive angle can be read out at its place of origin. By experimental determination of the refractive indices different liquids can be identified. The observation that the refractive index changes when the liquid is filled in the tray, is didactically important for the understanding of this natural phenomenon. www.pimicos.com // [email protected] // 508.832.3456 East Fig. 1.2: Refraction at air – water transition surface 949.679.9191 West // www.pi-usa.us V1.3 Refraction law at acryl glass – water (basic kit) Based on the two previous experiments (determination of the refractive index of Plexiglas and water), now the ratio of two refractive indices is determined in this experiment. Here, the beam is investigated at the transition from the optically denser (Plexiglas) to the optically less dense medium (water). On the test and report template of V1.3 the experimental setup is printed. Here, the beam from the plane-parallel plate traverses to the transmission tray filled with water. The angle of the optically denser medium is adjusted to the plane-parallel plate and the angle in the optically less dense medium is read from the tangent-scaled measure of the transmission tray. This combination thus allows the investigation of the refractive index ratio at the transition of the laser beam from an optically denser (Plexiglas) to an optically less dense (water) medium. Fig. 1.3: Refraction at acryl glass – water transition surface Thereafter, the ratio of the refractive indices is calculated and compared with values from previous measurements from the experiments V1.1 and V.1.2. V1.4 Parallel translation at the planeparallel plate (basic kit) While the experimental setup (Fig. 1.4) shows all the phenomena of reflection and refraction at the same time, the didactic reduction to the parallel translation is achieved by the test and report template. The parallel translation of the beam transmitting through the medium is determined with help of the projection- and measuring screen. It is measured as a function of incidence angle of the light beam and verified by calculation. Fig. 1.4: Parallel translation of a laser beam at the transmission through an optically dense medium V1.5 Total internal reflection at the plane-parallel plate (basic kit) In case of irradiation of the laser on the short side of the plane-parallel plate, the beam is reflected on the long side without losses. This phenomenon is the total internal reflection which also occurs for example in fiber optics and endoscopes in medicine. Fig. 1.5: Totalreflexion in einer planparallelen Platte Mit der Versuchs- und Protokollvorlage erfolgt in diesem Versuch die didaktische Reduktion auf die Totalreflexion. The test and report template of V1.5 allows the didactic reduction to the total internal reflection.It is particularly important that on the projection screen no emergent light is observed. www.pimicos.com // [email protected] // 508.832.3456 East 949.679.9191 West // www.pi-usa.us V1.6 Reflection on metal compared to dielectric (extension kit) In this experiment, in simple terms the reflectivity of dielectric material is compared with the reflectivity of metal. For this purpose, the experimental setup V1.1 is used to start with. In addition, on the exit face of the plane-parallel plate, a metal mirror is arranged. The mirror reflects the transmitted beam with higher reflectivity, than the dielectric surface. Hence the resulting spot on the projection screen is much more intense than that generated by the reflection at the dielectric medium. Fig. 1.6a: Schematic presentation of the setup for comparison of reflectivity of dielectric media and metal www.pimicos.com // [email protected] // 508.832.3456 East Fig. 1.6b: Comparison of reflectivity of dielectric media and metal 949.679.9191 West // www.pi-usa.us V2. Experiments with prisms V2.1 Optical paths in prism (basic kit) Using prisms, two types of optical paths are observed experimentally 1. For small angles of incidence the laser beam is totally reflected on the opposite face 2. When increasing the angle of incidence, the total internal reflection changes to refraction. The angle of refraction in the transition from total reflection is verified experimentally determined and calculated. The angle of minimum deflection is also determined experimentally and verified by calculation. Fig. 2.1: Refraction and reflection in a prism V2.2 Dispersion in prism (extension kit) 1. Optical path in deflecting prism The didactic reduction to the deflection effect is achieved by a prism of very small dispersion. In the prism, the green laser is compared to a red laser. Here no difference in the deflection is visually observed. Thus it is demonstrated that crown glasses have almost no dispersion. Fig. 2.2a: Refraction in a deflecting prism 2. Optical path in dispersion prism (extension kit) The dispersion prism is made of heavy flint glass. The deflection is bigger than with the prism of acryl glass. Further, dispersion can be observed, because the green laser beam is deflected more than the red one. Fig. 2.2b: Refraction in dispersion prism www.pimicos.com // [email protected] // 508.832.3456 East 949.679.9191 West // www.pi-usa.us V3. Experiments stage (basic kit) with translation On a translation stage convex and concave lenses and prisms with different angles are placed individually or in combination. Due to the design of these objects, the radiation patterns are clearly visible. Fig. 3: Optical paths in transparent objects Dabei wird das Wirkprinzip von Konvex- und Konkavlinsen als auch die Wirkung von Prismen demonstriert. Durch Bewegen des Verschiebetischs kann die kontinuierliche Veränderung des optischen Weges verfolgt werden. Here, the principles of convex and concave lenses and the effect of prisms are demonstrated. By moving the translation stage, the continuous change of the optical path can be obtained. V4. Light: an electromagnetic wave – experiments with polarised light (extension kit) V4.1 Refractive index from Brewster angle and total internal reflection With the polarizer linearly polarized light is generated. Perpendicular or parallel polarisation states with respect to the incidence plane are adjusted. Now, the reflection of these states at the flat surface of the half-circular disk is measured. For parallel polarized light, no reflection is observed at the Brewster angle. For radiation at the curved surface of the half-circular disk the critical angle of total reflection and the internal Brewster angle are determined. V4.2 Polarisation, Birefringence Birefringent crystal The laser emits elliptically polarised light. When shining in the direction n1 ≠ n2 of the crystal, then two orthogonal polarization states are generated. For radiation in the direction of n1 = n2 elliptically polarized light is generated. This can be proven with a polarizer. Optical activity Fig. 4.2: Strahlengänge im doppelbrechenden Kristall www.pimicos.com // [email protected] // 508.832.3456 East Optical activity is shown with SiO2 single crystals. Depending on the crystal structure, they are left-or right turning crystals. The rotation angle depends on the type of material, the wavelength and the thickness of the crystal. Further, for optically active liquids a dependence of the activity on the concentration is given. 949.679.9191 West // www.pi-usa.us V5. Experiments with gratings (extension kit) In front of the laser, a slit is placed. In a sample holder optical gratings are mounted. On the big measuring screen, the diffraction patterns are observed. The monochromatic light typically provides only one line per diffraction order. From the spacing of the diffraction orders the grating parameters are determined. This experiment is performed with gratings of different line constants and with green or red monochromatic light. Fig. 5: Refraction by a grating V6. Experiments with Absorption (extension kit) Green or red laser light is passed through red, green or other filters. It is observed that the red filter absorbs the green wavelength while the green filter transmits the green light. With the red laser the behavior is different. Fig. 6: Absorption with color filters Material list of the Optics System Basic kit Extension kits 1 Transparent platform with projection screen 1 Filter holder 2 Laser module 532nm (1mW) at goniometer mount 2 Metal mirror 3 Laser module 650nm 3 Plane-parallel acrylic plate with tangent-scaled angle measure 4 Prism (heavy flint SF) 4 Transmission tray for liquids (water) with tangentscaled angle measure 5 Polariser 6 Half-circular disk Birefringent crystal 5 Prism 60° (material acrylic glass) 7 6 Translation stage with 2D elements: 90° Prism, 40° Prism, biconvex- , plano convex- and biconcave lense 8 Optically active crystal plates 9 Optical slit 10 Different gratings 7 Projection- and measuring screen with scale 11 Big measuring screen 8 Test and report templates (printed and pdf) 12 Color filters (red, green) 9 Instruction manual for students 13 Templates for extensions (printed and pdf) 10 Instruction manual for teachers 14 Instruction manual for students 15 Instruction manual for teachers Version 2/11 www.pimicos.com // [email protected] // 508.832.3456 East 949.679.9191 West // www.pi-usa.us USA (East) & CANADA USA (West) & MEXICO GERMANY PI (Physik Instrumente) L.P. 16 Albert St. Auburn, MA 01501 Tel: +1 (508) 832 3456 Fax: +1 (508) 832 0506 Email: [email protected] www.pi-usa.us PI (Physik Instrumente) L.P. 5420 Trabuco Rd., Suite 100 Irvine, CA 92620 Tel: +1 (949) 679 9191 Fax: +1 (949) 679 9292 Email: [email protected] www.pi-usa.us Headquarters: PI miCos GmbH Freiburger Strasse 30 D-79427 Eschbach GERMANY Call Us Today // [email protected] +49 7634 50 57 0 +49 7634 50 57 393 [email protected] www.pimicos.com Physik Instrumente (PI) GmbH & Co. KG Auf der Römerstraße 1 76228 Karlsruhe/Palmbach Tel: +49 (721) 4846-0 Fax: +49 (721) 4846-1019 Email: [email protected] www.pi.ws 508.832.3456 (East) 949.679.9191 (West) www.pimicos.com Phone: Fax: e-mail: home: // 508.832.3456 East 949.679.9191 West // www.pi-usa.us