1
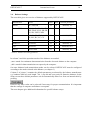
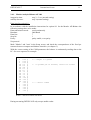
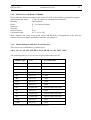
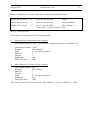
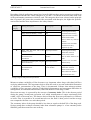
INFUSCALE Version 7 Instructions for Use INFUSCALE 7 Instructions for use 2 TABLE OF CONTENTS 1. INTRODUCTION ............................................................................................................................................. 5 1.1 1.2. 1.3. 2. ENHANCEMENTS TO VERSION 6.5................................................................................................................ 5 GENERAL INFORMATION ON THE INFUSION STANDARD............................................................................... 6 THE GRAVIMETRIC MEASUREMENT PROCEDURE ....................................................................................... 7 INSTALLATION............................................................................................................................................... 8 2.1. EQUIPMENT REQUIREMENTS ....................................................................................................................... 8 2.2. SOFTWARE INSTALLATION ........................................................................................................................... 8 2.3. CONNECTING THE BALANCE TO THE PC...................................................................................................... 9 2.4. BALANCE SETTINGS .................................................................................................................................. 10 2.4.1. Mettler Analysis-Balance AE 100 ....................................................................................................... 11 2.4.2. Mettler Precision Balance PM4000 .................................................................................................... 12 2.4.3. Mettler-Balances with SICS Serial Interface ...................................................................................... 12 2.4.4. Sartorius Balances .............................................................................................................................. 14 3. MAIN MENU AND SETUP ........................................................................................................................... 15 3.1. 3.2. 3.3. 3.4. 4. INFUSION PUMPS ACCORDING TO EN 60601-2-24 .............................................................................. 19 4.1. 4.2. 4.3. 4.4. 4.5. 4.6. 4.7. 4.8. 4.9. 4.10 5. TERMINAL................................................................................................................................................. 16 PRINTER SETUP ......................................................................................................................................... 17 TIMER-CALIBRATION ................................................................................................................................ 17 OPTIONS.................................................................................................................................................... 18 VOLUMETRIC INFUSION CONTROLLERS, VOLUMETRIC PUMPS AND SYRINGE PUMPS (50.102) ................. 19 DRIP RATE INFUSION CONTROLLERS AND DRIP RATE INFUSION PUMPS (50.103) ..................................... 19 INFUSION PUMPS FOR AMBULATORY USE TYPE 1 (50.104) ...................................................................... 20 INFUSION PUMPS FOR AMBULATORY USE TYPE 2 (50.105) ...................................................................... 20 INFUSION PUMPS FOR AMBULATORY USE TYPE 3 (50.106) ...................................................................... 20 INFUSION PUMPS FOR AMBULATORY USE TYPE 4 (50.107) ...................................................................... 20 INFUSION PUMPS FOR AMBULATORY USE TYPE 5 (50.108) ...................................................................... 21 OTHER MEDICAL PUMPS ............................................................................................................................ 21 OVERVIEW OF INFUSION PUMPS ACCORDING TO EN 60601-2-24.............................................................. 21 CLASSIFICATION OF PUMPS ....................................................................................................................... 21 PERFORMING THE MEASURING ............................................................................................................ 23 5.1. THE MEASURING SETUP............................................................................................................................ 23 5.2. DATA ACQUISITION ................................................................................................................................... 24 5.2.1 Entering data....................................................................................................................................... 24 5.2.2. Control of Data Transfer..................................................................................................................... 25 5.2.3. Terminal .............................................................................................................................................. 26 5.2.4. Start of measurement........................................................................................................................... 27 5.2.5. Event marker ....................................................................................................................................... 30 5.2.6. Storage of Graphics on File and to Clipboard.................................................................................... 30 5.3. SIMULATION.............................................................................................................................................. 30 6. EVALUATION OF THE MEASURED DATA ............................................................................................ 31 6.1. THE TRUMPET CURVE .............................................................................................................................. 33 6.1.1. The Meaning of the Trumpet Curve according to EN 60601-2-24 ..................................................... 33 6.1.2. Calculation of the Trumpet Curve according to EN 60601-2-24, 50.102........................................... 33 6.1.3. Calculation of the Trumpet Curve according to EN 60601-2-24, 50.104........................................... 35 6.1.4. Calculation of the Trumpet Curve according to EN 60601-2-24, 50.105........................................... 36 6.1.5. Calculation of an optional Trumpet Curve ......................................................................................... 37 6.1.6 Modified Trumpet Curve and Constancy Index................................................................................... 38 6.1.7. Other Commands ................................................................................................................................ 39 6.1.8. Data Output......................................................................................................................................... 40 INFUSCALE 7 Instructions for use 3 6.2. BOLUS EVALUATION ................................................................................................................................. 44 6.2.1. Evaluation according to EN 60601-2-24, 50.106 ............................................................................... 44 6.2.2. Bolus Evaluation with adjustable Time Range.................................................................................... 45 6.2.3. Other Commands ................................................................................................................................ 46 6.2.4. Data Output......................................................................................................................................... 48 7. MEASURING ACCURACY .......................................................................................................................... 52 7.1. EVAPORATION........................................................................................................................................... 52 7.2. INTERROGATION ERROR ........................................................................................................................... 54 7.2.1. Mettler Balance AE100 (Continuous Operation)................................................................................ 54 7.2.2. Sartorius Balance MC1 (automatic data transmission) ...................................................................... 55 7.2.3. Sartorius Balance MC1 (request mode) .............................................................................................. 56 8. SYMBOLS AND FORMULA ........................................................................................................................ 57 INFUSCALE 7 Instructions for use 4 Use of INFUSCALE It is not permitted to make copies or to sell Infuscale. It is permissible, however to make copies of the program disc to secure the data. Liability We endeavour to supply a perfect product but we cannot guarantee a perfect running of the software under all conditions. Despite of an exact program validation we cannot guarantee the reaching of a special purpose of use. Liability for any damage during use of this program is excluded as far as lawful. Contact: Dr. Gerd Juhl, Kreckestr. 10, 80997 Munich, Germany. Email: [email protected] INFUSCALE 7 1. Instructions for use 5 Introduction The Infuscale program serves for the exact evaluation of the delivery accuracy of infusion pumps and controllers by the gravimetric method according to the international standard IEC601-2-24 (EN60601-2-24). It operates with electronic balances and runs on IBM compatible computers on Windows 95, 98, ME, NT, 2000, XP and 7 operating systems. INFUSCALE provides powerful features including: - Acquisition of balance data and storage on file Storage of event markers Operation with Mettler-, Sartorius-, Ohaus-, Chyo-, Precisa-, and Kern balances Graphical and numerical display of data and event marks Evaluation of data according to the specifications of the harmonized standard EN606012-24 / IEC601-2-24 or to the user's own requirements Evaluation according to MDA Device Bulletin DB2003(02) Calculation of Trumpet Curves Calculation of the Constancy Index Graphical display of weight and flow curves Storage of graphics as BMP or JPG files and to the Clipboard Display of values as tables and test reports Screen printout, table printout, printout of test report Storage of test report as Microsoft Word and Excel file, and in the data file formats: TXT, WMF, HTML and CSV. Storage of table as Excel data file INFUSCALE has been used since many years in testing a large number of different pumps with different attributes demonstrating that it is a reliable tool. Data files stored with prior versions of INFUSCALE can be read and evaluated with the present version. 1.1 - Enhancements to version 6.5 Calculation of the modified trumpet curve and the constancy index Improved export to Microsoft Excel Improved entry of comments Improved setting of table print out parameters Storage of the name of the technician within the data file Optional operation of two balances on one PC. INFUSCALE 7 Instructions for use 6 1.2. General Information on the Infusion Standard In recent years work has been done by a working group of the VDE and IEC (International Electrotechnical Committee) on a new international standard for pumps and controllers. This worldwide recognised commission has completed the Norm IEC 601-2-24 „Particular requirements for safety of infusion pumps and controllers“, First edition 1998-02. In the same year the standard has been harmonised according to the European Directive on Medical Devices 93/42/EEC as EN 60601-2-24. As the graphics described in the above mentioned standards have to be part of any user manual for infusion pumps, a measuring system is necessary that the fulfils those requirements. The main task of INFUSCALE is to perform - together with the required hardware - and document accuracy measurements of infusion pumps according to sections 50.102, 50.104 - 50.108 of the standard. In addition INFUSCALE is useful during the development and the periodic safety checks of infusion pumps. INFUSCALE 7 Instructions for use 7 1.3. The Gravimetric Measurement Procedure The gravimetric method is used in determining the accuracy of delivery of infusion pumps. During the measuring procedure the quantity of liquid delivered by the pump under test is weighed in equal time intervals and transmitted to a computer, that stores it together with a timestring on a data file. In a second process the accuracy data are calculated and documented. Picture 1 – Measuring setup The measuring setup (picture 1) is made according to IEC standard requirements (see pictures 104a and 104b of the standard). It consists of the pump with disposable accessories, an electronic balance and the connected digital computer. The measuring is controlled and documented by INFUSCALE. Depending on the type of pump (See chapter 50.102 - 50.108 of the standard) the pump and the measuring devices are set and started. The pump delivers liquid (water for medical use according to ISO class III) into the container located on the balance plate. The weight of the container increases in proportion to the delivered volume and is in regular intervals transmitted to the computer and stored on file. The menu option for performing this procedure is started by clicking on “Data Acquisition” / “Measurement”. Note: Nutrition pumps must be tested with the specified nutrition solution instead of water. Before starting measuring, the density of the nutrition solution must be determined and entered into the respective field. After the measuring is finished, the data can be analysed by calling up the menu item “Evaluation”. With pumps of group 50.102 the evaluation according to EN 60601-2-24 is very easy. You just have to load the data file and click on key . Prerequisite is a time interval of 30 seconds between two data points and a duration of measurement of > 2 hours which is equivalent to at least 241 measuring points. With other pumps - i.e. pumps with bolus delivery or pumps with non continuous delivery characteristics - an automatic analysis is not recommended. In those cases the user's analysis is supported by different options in the menu “Evaluation”. INFUSCALE 7 2. Instructions for use 8 Installation 2.1. Equipment Requirements - Electronic balance with RS232-interface (uni- or bidirectional). - Picture 2 shows a list of balances supported by INFUSCALE. - PC with Windows 95, 98, NT, 2000, XP or 7 operating system - Colour Graphic Display of at least 800/600 pixel resolution. - RS232 computer interface installed as COM1 .. COM4 - Printer installed on LPT1 or LPT2. All printers which are accepted by Windows can be used. - Connection line between computer and balances - Accessories (container, cannula, oil) 2.2. Software installation Insert the program-CD into the CD-drive. Start the software installation with "Drive:\Setup-E.EXE" in the "run" mode and press the OK key. The installation routine transfers all program- and data files from CD to the computer and creates an icon symbol on the desktop. INFUSCALE 7 Instructions for use 9 2.3. Connecting the Balance to the PC The balance can be connected to any of the serial ports COM1 to COM4 of your computer. The specific port is selected in the INFUSCALE setup procedure (see chapter 3). As COM1 is normally used for the mouse, we recommend the selection of COM2 for connecting the balance. We recommend to start without using handshake, and the balance set to AUTO (continuous) mode. The following lines must at least be connected between the balance and the specified COM-port. 1. GND 2. Data line: Balance PC 3. Data line: PC Balance It could happen, that the connection of the data lines is initially incorrect and that no data appear on the computer screen. In this case most often it is sufficient to cross the lines 2 and 3. Please check the settings of baudrate, parity, data bits and stopbits on balance and computer (see chapter 3). Set the handshake option of the electronic balance to OFF and the transmission mode to continuous (CONT or AUTO). INFUSCALE 7 Instructions for use 10 2.4. Balance Settings The next table gives an overview of balances supported by INFUSCALE. Manufacturer Series Auto Abfr Default parameters Mettler AE, AM, PM X X 2400 Bd, 7E1 Mettler SICS AB-S, AG, AT, AX, MT, MX, PB-S, PG-S, PR, SB, SG, SR, UMT, UMX X X 2400 Bd, 7E1 Sartorius AC, BA, BL, BP, LA, LC, LP, MC, RC, SC, CP X X 9600 Bd, 7E1 Ohaus GA GA110, GA160 X 4800 Bd, 7E1 Ohaus GT GT-Series X X 9600 Bd, 7E1 Chyo MJ-Series X 4800 Bd, 8N1 Precisa Series 300S X 9600 Bd, 7E1 Picture 2 - Balances and setting parameters In column 3 and 4 the operation modes of the balances are marked. „auto“ stands for continuous data transmission from the electronic balance to the computer. „abfr“ stands for data transmission on request by the computer. On some balances both transmission modes can be selected. INFUSCALE must be configured according to the mode selected at the balance (see chapter 3) Column 5 of picture 2 contains the default parameters preselected by the balance manufacturer e.g. baudrate 9600 bd, word length 7 bit, 1 stop bit and even parity for Sartorius balances. In the Setup screen these default parameters can be automatically taken over from an internal table by pressing However any other value can be selected if necessary for proper communication. It is important that the settings of computer and balance correspond. The next chapters give additional information for specific balance setups. INFUSCALE 7 Instructions for use 11 2.4.1. Mettler Analysis-Balance AE 100 integration time: stability detector: step 2 = 3 sec (normal setting) step 2 (normal setting) Data interface option 011: In accordance with the installation instructions for option 011 for the Mettler AE-Balance the following settings have to be made: Data transmission mode: Baudrate: Data bits: Stop bit: Parity: No protocol send continuously 2400 Baud 7 1 parity enable, even parity Mark "Mettler" and "auto" in the Setup screen, and check the correspondence of the fixed parameters between computer and balance interface (see chapter 3). With the correct setting of the COM-parameters the balance is continuously sending data to the PC. See next sequence for example: S S S SD SD SD SD SD SD SD SD SD SD SD SD S S S S S S 0.00 0.00 0.00 0.5 2.6 4.8 6.1 6.7 7.0 7.1 7.1 7.2 7.20 7.20 7.20 7.20 7.20 7.20 7.20 7.20 7.20 g g g g g g g g g g g g g g g g g g g g g <--- weight 0.0 gramms <- 7.2 gramms put on balance, result not stable <---- result stable Picture 3 - Data from a Mettler AE balance During measuring INFUSCALE only accepts stable results. INFUSCALE 7 Instructions for use 12 2.4.2. Mettler Precision Balance PM4000 Please make the following settings in the sector "I-FACE" of the balance configuration register. data transmission mode: Baudrate: Parity: Data bits: Stop bits: Interval (pause): Calibration mark: "Cont" all values are transmitted automatically 2400 (default) E = even parity (default) 7 1 0 sec AU = on (or off) Mark "Mettler" and "auto" in the Setup screen, and check the correspondence of the fixed parameters between computer and balance interface (see chapter 3). 2.4.3. Mettler-Balances with SICS Serial Interface This section covers all balances of model types: AB-S, AG, AT, AX, MT, MX, PB-S, PG-S, PR, SB, SG, SR, UMT, UMX The following table gives an overview of port connections to the PC. Balance type Port PC-Connection AB-S RS-232C Cable AG LocalCAN Interface-Box with cable AT RS-232C Cable AX RS-232C Cable MT RS-232C Cable MX RS-232C Cable PB-S RS-232C Cable PG-S RS-232C Cable PR LocalCAN Interface-Box with cable SB RS-232C Cable SG LocalCAN Interface-Box with cable SR LocalCAN Interface-Box with cable UMT RS-232C Cable UMX RS-232C Cable Picture 4 - Mettler balances with SICS Interface connection INFUSCALE 7 Instructions for use 13 Balances with RS-232C port are connected according to the following scheme: Balance-Pin 13 (white) Pin 5 of 9 pol. PC-Plug GND Balance-Pin 12 (brown) Pin 2 of 9 pol.PC-Plug data from Balance Balance-Pin 2 (green) Pin 3 of 9 pol. PC-Plug data to Balance Connect Pin 1,7 and 8 of 9 pol. PC-plug Picture 5 - Connection scheme These balances can be operated in two different modes: a) continuous data transmission to the computer: The settings in sector “I-FACE” of the balance configuration register of the balance are: Data output condition: Baudrate: Parity: Data bits: Stop bits: Handshake: End of line mode: b) CONT 2400 (default) E = even parity (default) 7 1 OFF CRLF data transmission on request by the computer: Data output condition: Baudrate: Data bits: Stop bits: Parity: Handshake: End of line mode: ALL 2400 (default) 7 1 E = even parity (default) OFF CRLF The selection in the SETUP screen must be either "Mettler S", "auto" or "Mettler S", "abfr". INFUSCALE 7 Instructions for use 14 2.4.4. Sartorius Balances All Sartorius balances of types AC, BA, BL, BP, LA, LC, LP, MC, RC, SC, CP have a RS-232C-port. They can be operated in two different modes: a) continuous data transmission to the computer: data output condition: Baudrate: Data bits: Stop bits: Parity: stopbits: handshake: b) auto without standstill 9600 (default) 7 1 E = even parity (default) 1 hardware handshake with 2 figures after CTS data transmission on request by the computer: data output condition: Baudrate: Data bits: Stop bits: Parity: stop bits: handshake: without standstill 9600 (default) 7 1 E = even parity (default) 1 hardware handshake with 2 figures after CTS In accordance with the balance configuration the setup of INFUSCALE must be either "Sartorius", "auto" or "Sartorius", "abfr". INFUSCALE 7 3. Instructions for use 15 Main Menu and Setup After starting INFUSCALE the main menu appears on the screen. The options “Data Acquisition”, “Evaluation”, “Setup” and “Help” can be selected from here. Please click on Setup now: Picture 6 - Main menue At the very first call of the Setup routine, INFUSCALE tries to find an available serial port. If a suitable port has been found, the Setup screen appears: Picture 7 – Setup Screen If INFUSCALE has been installed on Windows 98 the checkbox must be marked. In case of Windows NT, 2000, XP or 7, this field remains empty. At next, the connected electronic balance is set by clicking on its name in the list "Balances". INFUSCALE 7 Instructions for use 16 A click on key selects the preset values "Baudrate", "Data bits", " Stop bits" and "Parity" of the highlighted balance according to the table in picture 2. In the frame "COM-Port" the computer port to which the electronic balance is connected can be selected. 3.1. Terminal After clicking on a VT100 compatible terminal screen opens. This terminal observes the data coming in from the balance to the PC in "auto" mode. These raw data can be recorded on file (extension "CAP") and played back afterwards. The following functions are implemented: Start: Stop: Capture: Play: Exit: Start of data display Stop of display Entering the name of the capture file and start recording Open and play a capture file Terminal switch off. On activating the capture function, a yellow light appears on the right side . Clicking on switches recording on and off. The seven green lights on the right side reflect the state of the port lines. Red means an active state. INFUSCALE 7 Instructions for use 17 3.2. Printer Setup The printer setup can be made in frame "Print" Picture 8 - Printer setup window by clicking on . The field next to it shows the set printer resolution, which is in this exam- ple 300 dpi. 3.3. Timer-Calibration The internal timer controls data acquisition very accurately. Its setting normally does not need to be changed. However, for calibration purposes, there is the possibility to accelerate or delay this timer by 5% compared to the internal PC-Clock. Picture 9 - Timer calibration window The timer can be adjusted by moving the track bar to the right or to the left side. A key-click on "Set" sets the new value. Clicking on sets the timer to 100%. Alternatively, an automatical timer calibration can be performed. The duration of this process is determined by setting the time in the field next to "Duration (min)". The test starts after clicking on "Start". In the green field the time difference between timer time and internal PC-time is continuously displayed in seconds. The deviation in percents is shown in the field above. When the test has ended or been interrupted with "Stop", the optimal timer value is displayed next to "Set". Clicking on the Set-key sets the new value. INFUSCALE 7 Instructions for use 18 3.4. Options In frame "Options" the following selections can be made: Picture 10 Log: During data acquisition an additional log file is created. This file documents the data acquisition process in detail. Its extension is ".LOG". OWarning: If this field is marked, an overwrite warning is displayed after starting the measuring in DATA ACQUISITION/MEASUREMENT if the set filename already exists. Check: If this field is marked, a horizontal scroll bar appears in table "Balances". By moving to the right, all other fields of this table can be viewed. They contain the setting parameters of each balance. Par: The 4 fields are related to the data format of the set balance. Field 1: Field 2: Field 3: Field 4: Number of balance type balance index First read digit of a received data string starting from left Number of read digits. If balance is marked, the user can enter values into field 3 and 4 (see above). This allows the adaptation of already not supported balances to INFUSCALE. Win98 Key If INFUSCALE has been installed on Windows 98 this checkbox must be marked. In case of Windows NT, 2000, XP or 7, this field remains empty. leads back to the main menu. INFUSCALE 7 4. Instructions for use 19 Infusion Pumps according to EN 60601-2-24 The following chapters refer to the respective chapters of the standard EN 60601-2-24. 4.1. Volumetric Infusion Controllers, Volumetric Pumps and Syringe Pumps (50.102) The following measuring conditions are defined in the standard: 30 sec Measuring interval: Set delivery rate: The measuring must be made at the following set rates: a) b) Measuring time: Volumetric pumps and controllers: - minimum adjustable rate, but at least 1 mL/h - intermediate rate: 25 mL/h Syringe Pumps: - minimum adjustable rate, but at least 1 mL/h - intermediate rate: 5 mL/h More than 2 hours For further details please refer to the standard or to picture 11. The evaluation with INFUSCALE is described in chapter 6.1.2. 4.2. Drip Rate Infusion Controllers and Drip Rate Infusion Pumps (50.103) The standard does not recommend the gravimetric method, but a drip counting method. INFUSCALE 7 Instructions for use 20 4.3. Infusion Pumps for Ambulatory Use Type 1 (50.104) Ambulatory pumps with continuous delivery characteristics are concerned. Measuring interval: 900 s = 15 min Set delivery rate: the measuring must be made at the following set rates : - minimum adjustable rate - intermediate rate specified as typical by the manufacturer For further details please refer to the standard or to picture 11. The evaluation with INFUSCALE is described in chapter 6.1.3. 4.4. Infusion Pumps for Ambulatory Use Type 2 (50.105) Ambulatory pumps with non continuous delivery are concerned, i.e. repetitive delivery of equal boli during the whole delivery period. The measuring must be made with 20 and subsequent 100 shot cycles at intermediate rate as specified by the manufacturer. Further details are described in the standard and in picture 11. The evaluation with INFUSCALE is described in chapter 6.1.4. 4.5. Infusion Pumps for Ambulatory Use Type 3 (50.106) Ambulatory Infusion and Syringe Pumps with Bolus Equipment are concerned (pumps that are able to deliver single, discrete boli) The measuring must be made with 25 consecutive boli at the minimum setting either demanded manually or by program. Further details are described in the standard and in picture 11. The evaluation with INFUSCALE is described in chapter 6.2.. 4.6. Infusion Pumps for Ambulatory Use Type 4 (50.107) Combination of non continuous delivery and bolus delivery. Testing shall be done according to subclauses 50.104, 50.105 and 50.106 of the standard as appropriate. Please refer to the standard or to picture 11. The evaluation with INFUSCALE is described in chapters 6.1.3., 6.1.4. and 6.2.. INFUSCALE 7 Instructions for use 21 4.7. Infusion Pumps for Ambulatory Use Type 5 (50.108) Only for parenteral nutrition or patient controlled infusion. Use subclause 50.102 to 50.106 of the standard as appropriate. For further details please refer to the standard or to picture 11. The evaluation with INFUSCALE is described in chapters 6.1.2., 6.1.3., 6.1.4. and 6.2.. Note: Nutrition pumps must be tested with the specified nutrition solution instead of water. Before starting measuring, the density of the nutrition solution must be determined and entered into the respective field. 4.8. Other medical pumps EN 60601-2-24 does not refer to implanted pumps or other pump systems in medical use. However INFUSCALE can be used for these pumps as well. 4.9. Overview of Infusion Pumps according to EN 60601-2-24 Sect. Type Min. Intemed. Intermed. Intermed. rate rate rate Rate >=1ml/h +100mmHg -100mmHg Intermed. Bolus Rate min. + container 0.5 m below Bolus max. 50.102 Vol. Contr. x 25ml/h 50.102 Vol. Pump x 25ml/h x x x x x 30 s 50.102 Syr. Pumpe x 5ml/h x x x x x 30 s 50.103 Drip Contr. x 20/min 1 min 50.103 Drip Pump x 20/min 1 min 50.104 Amb. Type1 x x 15 min 50.105 Amb. Type2 x Measur. Interval 30 s x 50.106 Amb. Type3 x x 50.107 Amb. Type4 x x x x 50.108 Amb. Type5 x x x x Picture 11 - Set delivery rates according to IEC601-2-24, sections 50.102 - 50.108 4.10 Classification of Pumps The British Health Ministery has published recommendations for users of medical infusion pumps. These publications are based on technical evaluations, user assessments, incident reporting and on own evaluations. Device bulletin 2003(02) addresses problems in the use and selection of infusion systems and the training of users. It raises awareness of the nature of infusion systems, their advantages and risks. INFUSCALE 7 Instructions for use 22 Regarding clinical application, pumps have been divided into three major categories according to the potential infusion risks. These categories A, B, and C are shown in the next table with a list of the performance parameters critical to each. The categories have been selected on the principle that, in general, the greater the potential risks associated with therapies, the higher the performance needed and the more important are the safety features. Therapy Category A B Therapy description Patient group Performance data Drugs with narrow therapeutic margin Any Drugs with short half-life (< 5 min) Any Any infusion given to neonates Neonates Good long-term accuracy Good short-term accuracy Rapid alarm after occlusion Small occlusion bolus Able to detect very small air embolus Small flow rate increments Good bolus accuracy Rapid start-up time Drugs, other than those with a short Any except neonates half-life (> 5 min) TPN Fluid maintenance Transfusions Volume sensitive except neonates Application of Diamorphin (long half Any except neonates life of metabolite) C TPN Fluid maintenance Transfusions Good long-term accuracy Alarm after occlusion Small occlusion bolus Able to detect small air embolus Small flow rate increments Bolus accuracy Any except volume sensi- Long-term accuracy tive or neonates Alarm after occlusion Small occlusion bolus Able to detect air embolus Incremental flow rates Therapy categories and performance parameters Minute-to-minute variability of flow becomes very important where drugs with short half-lives are being administered. The importance derives from the need to prevent undesirable fluctuation of effect-site concentration of the drug. There is documented evidence that minute-to-minute variability of flow can cause variation of physiological parameters and consequent difficulties in management, in both adults and neonates, where the half-life of the drug is short. Short-term accuracy is expressed by the concept of constancy index. This is the shortest period during the pump’s steady-state operation over which measurement of output consistently falls within ±10% of the mean rate. The data are derived from the flow tests performed over 24 hours at 1ml/h. Flow is recorded at 30 second intervals over the final 18 hour period. And the average rate compared with flow over each short period. The constancy index of the pump should be less than or equal to the half-life of the drug used. Syringe pumps have a shorter constancy index than volumetric pumps i.e. a low constancy index indicates good short-term flow rate accuracy. INFUSCALE 7 5. Instructions for use 23 Performing the Measuring Picture 12 - Measuring setup 5.1. The Measuring Setup The measuring setup consists of the following components: - Balance with RS232 interface Windows computer with RS232 interface COM1 .. COM4 connection line between computer and electronic balance liquid container silicon oil for the oil film cannula (G18 or G21) The balance must be installed perfectly plain, in a vibration free environment and must be calibrated. The container of the infusion pump that is to be tested must be filled with water (corresponding to ISO class III). The connected infusion line with a long cannula must be primed. In the liquid container placed on the measuring plate, a little amount of water is filled in with an oil film on the top (about 0.5 cm). This film reduces the evaporation of the water during the long measuring period. The tip of the cannula is placed directly under the oil film, so that a continuous water pillar between the infusion container, the infusion line and the liquid container on the balance is maintained. Thus an influence of the measuring accuracy by the drop formation on the end of the cannula is prevented. INFUSCALE 7 Instructions for use 5.2. Data Acquisition Data acquisition is started by clicking on : The following screen appears: Picture 13 - Measurement screen 5.2.1 Entering data In the upper part of the screen the following parameters can be entered: Pump: Technician: Serial no.: Disposable: Set flow rate: Name of the pump under test Name of the technician performing the measuring Serial number of the pump under test Used disposable Set flow rate of the tested pump Meas. Interval: Time interval between two measuring points in seconds 24 INFUSCALE 7 Evaporation: Density Total time: Instructions for use 25 Evaporation rate in mL/h Density of the test fluid in g/mL Measuring time in minutes (0 or - = no time limitation) When entering the parameters please regard the conditions, described in the IEC601-1-24 standard, and referenced in chapter 4 of this manual. By pressing TAB or ENTER the next field is highlighted for input. The shortest time interval is 1 second. Please note, that such a short time period will increase the measuring error (see chapter 7). Right to the "Pump" field the set balance is displayed. Next to it is a green light that changes to red, if a new data line is transmitted to the PC. The "Target" field shows name and path of the INFUSCALE file to be stored. By clicking on this field a new file name can be entered. 5.2.2. Control of Data Transfer The area displayed on the lower left part of the screen serves for measuring control. Picture 14 - Displayed values during data acquisition On the bottom line the data received from the balance are shown in ASCII code. For instance [32] represents the Space-letter, [48] stands for zero. Right to it the same data appear in normal readable form. In "auto" mode these two fields allow checking whether correct data are transmitted from the balance to the PC. INFUSCALE 7 Instructions for use 26 5.2.3. Terminal By clicking on the screen of a VT100 compatible terminal appears. It allows the observe the incoming balance data and the RS232-control signals. In mode "abfr" also the signals that are transmitted from the PC to the balance are displayed. Picture 15 - Terminal display during data acquisition These raw data can be recorded on file (extension "CAP") and played back afterwards. On activating the capture function with , a yellow light appears on the right side. Clicking on switches recording on and off. The seven green lights on the right side reflect the state of the port lines. Red means an active state. INFUSCALE 7 Instructions for use 27 5.2.4. Start of measurement When all parameters are entered, the measurement can be started by clicking on If the Tare option the balance to zero. was been marked, the computer sends out a Tare-command which sets Clicking on stops the measurement. Below the 7 file header lines, the created file contains in each line the time and the measured weight (see next picture). Additionally, events that have been marked by pressing the blank key on the PC keyboard, are stored in a separate line. The name of the technician is automatically stored in the last line. Example: TIME INTERVAL (SEC): 30 SET FLOW RATE(ML/H): 20.0000 EVAPORATION (ML/H): 0.0000 DENSITY (G/ML): 0.9982 NAME OF PUMP : Example 5 SERIAL NUMBER : DISPOSABLE : 13:26:33,25 0.00000 13:27:03,30 0.02041 13:27:33,29 0.12840 13:28:03,28 0.28762 13:28:33,27 0.45998 13:29:03,26 0.64032 13:29:33,25 0.80385 13:30:03,29 0.96463 13:30:33,28 1.12811 13:31:03,27 1.29109 13:31:33,26 1.44685 13:32:03,25 1.59950 13:32:33,29 1.74942 13:33:03,28 1.90455 13:33:33,27 2.06292 13:34:03,26 2.23061 usw. Picture 16 – Infuscale data file INFUSCALE 7 Instructions for use 28 During the program run the following values are shown on the screen: Upper line: 1. 2. 3. 4. 5. 6. Starting time Actual PC-time Measuring time Time difference between measuring time and starting time Event number Event time Middle line: 1. 2. 3. 4. 5. 6. Index Stored time string Stored weight Calculated mean flow rate since start of measurement (mean rate) Percentage deviation of the mean flow rate in relation to the set delivery rate Actual delivered volume in mL In the middle windows weight and flow rate are plotted in two graphs against time. By clicking on the keys below, the number of data points shown can be set. E.g. if key 100 is pressed, 100 measuring points are displayed. When exceeding this number, the curve is scrolling to the left. By clicking on "all" the maximum number of 10000 points can be seen. When the key is pressed down, the time format of the x-axis changes from minutes to hh:mm:ss. 1 minute is displayed as 00:01:00. INFUSCALE 7 Picture 17 – Data acquisition Instructions for use 29 INFUSCALE 7 Instructions for use 30 5.2.5. Event marker During measurement an event can be marked by pressing the blank key of the PC-keyboard. Such an event is displayed in the control area (see 5.2.2.), and is stored in the INFUSCALE file. Events are displayed on evaluation screens and tables. 5.2.6. Storage of Graphics on File and to Clipboard. When the cursors is pointing on a graphic, a click on the right mouse key shows the following pop-up menue: Clicking the left mouse key on one of the menue items stores the graphic on data file in either BMP or JPG format, or copies it to the clipboard from where it can be easily transferred to other programs e.g. Microsoft Word. 5.3. Simulation The option "Simulation" does not perform a real data acquisition. It simulates the measuring by using an already existing INFUSCALE data file as data source instead of a balance. It can be selected by clicking on "Data acqusition" and "Simulation": The source file can be opened by clicking on the input area on the top left side. The further operation is identical to chapter 5.2. By marking the field the speed of simulation can be increased 10 fold. INFUSCALE 7 6. Instructions for use 31 Evaluation of the measured Data To evaluate the measured data please return to the main menu and click on "Evaluation". The following screen appears: Picture 18 – Screen “Evaluation” At this moment, the keys on the right side can only be seen in outlines without a function. However if an INFUSCALE file is loaded by clicking on , their view changes to normal. In the frame "EN 60601-2-24, 50" only those keys are activated, which lead to a reasonable evaluation according to the IEC-standard. This will be explained later in this chapter. INFUSCALE 7 Instructions for use 32 For opening another file, please click on the field right to "filename". A selection window appears immediately in which the file can be marked and opened. Picture 19 – File has been loaded The list on the left side contains the raw file data and the line index. In the center part of the screen the file parameters, which have been entered before starting the measurement, are displayed. The name of the technician can be entered if necessary. The keys and can be used anyway. Clicking on these keys lead the user directly into the program modules "Trumpet Curve" , "Modified Trumpet Curve and Constancy Index" or "Bolus Evaluation". The calculations are made without restrictions regarding the minimum duration of measurement (> 2 hours). leads back to the main menu. INFUSCALE 7 Instructions for use 33 6.1. The Trumpet Curve 6.1.1. The Meaning of the Trumpet Curve according to EN 60601-2-24 In the trumpet curve the minimum and maximum deviation of the measured flow rate, which is averaged in 5 respectively 6 different observation windows, is plotted against the set delivery rate of the pump. The curve shows the mean flow rate deviation per time interval. The trumpet curve is a useful information for the physician who has to decide whether a certain infusion pump can be used together with an intended drug. Special drugs with short elimination half life demand high standards concerning delivery continuity. If a remedy with an elimination half life of e.g. one minute is used, flow variations of 15%/minute will cause corresponding changes of the plasma level. Thus a predictable, constant plasma level and a respective drug efficacy is hard to get. Example: Intravenous given insulin has an elimination half life of 15 minutes. Variations of the delivery rate of 15% in the average, during a period of 40 minutes will cause similar deviations in the plasma level and, as a result, unreliable efficacy. 6.1.2. Calculation of the Trumpet Curve according to EN 60601-2-24, 50.102 Click on key , if it is activated. This is the case, if volumetric infusion controllers or syringe pumps are to be evaluated (see chapter 4.1). The time interval has to be exactly 30 s and the duration of the measurement must be more than 2 hours. After clicking, INFUSCALE evaluates the data according to section 50.102 of the IEC-standard. For each observation period of 2, 5, 11, 19 and 31 minutes the program calculates the: - minimum flow rate Qpmin maximum flow rate Qpmax maximum negative deviation of mean flow rate Epmin maximum positive deviation of mean flow rate Epmax percentage error A resp. B related to the set delivery rate. These values are plotted as „Trumpet Curve. INFUSCALE 7 Instructions for use 34 The next picture shows the Trumpet Curve of the second hour of example file BSP2.PMP. Picture 20 - Trumpet Curve of the second hour In the window right to the flow rate graph the calculated values are displayed as numbers, e.g. the maximum and minimum flow rates (38.60 resp. 10.94). The total error A (resp. B) is shown in the window right to the Trumpet Curve (A=0.07 %). Note the row of keys on the bottom left: These keys allow the setting of the deviation range of the Trumpet Curve. The standard setting is 15 % deviation. Key on the upper left side of the flow rate graph changes the scaling of the ordinate. When this key is not pressed, the Y-range of the curve is identical to the range of Y-values of the data file. When this key is pressed, the maximum Y of the curve is rounded to the next even value above the maximum Y-value of the data file. Clicking on calculates and displays the Trumpet Curve for the last hour. INFUSCALE 7 Instructions for use 35 6.1.3. Calculation of the Trumpet Curve according to EN 60601-2-24, 50.104 Key is activated when infusion pumps for ambulant use of type 1 are to be evaluated. (see chapter 4.3). The measuring interval in this case is 15 minutes. The specifications of section 50.104 of the IEC-standard apply. Clicking on this key opens the input area The startup period T1 can be entered here. Clicking on terminates the time input. INFUSCALE evaluates the file data now and draws the respective graphs. Each point of the flow rate curve over T1 represents the average of two data points as required in the IEC standard. The observation periods of the trumpet curve calculated over T2 are 15, 60, 150, 330, 570 and 930 minutes. Picture 21 - Trumpet curve according to section 104 INFUSCALE 7 Instructions for use 36 6.1.4. Calculation of the Trumpet Curve according to EN 60601-2-24, 50.105 Key is activated when infusion pumps for ambulant use of type 2 are to be evaluated. (see chapter 4.4). The specifications of section 50.105 of the IEC-standard apply. Clicking on this key opens the input area The startup period T1 can be entered here as well as the measuring interval S. Clicking on terminates the input. INFUSCALE evaluates the file data now, calculates n (n = 30 minutes divided by S), and draws the respective graphs. Each point of the flow rate curve over T1 represents the average of n data points as required in the IEC standard. The observation periods of the trumpet curve calculated over T2 are 1S, 2S, 5S, 11S, 19S and 31S depending on the time interval S. Picture 22 - Trumpet curve according to section 105 INFUSCALE 7 Instructions for use 37 6.1.5. Calculation of an optional Trumpet Curve By clicking on INFUSCALE can calculate and draw a Trumpet Curve for any time range, which is in the limits of the acquired data. The observation periods are 2, 5, 11, 19 and 31 minutes. The calculations are made according to section 102 of the standard, however, without restrictions regarding the minimum duration of measurement (> 2 hours). The following input area opens immediately after clicking, in which the user can enter the desired time range for calculation. Clicking on terminates the input and starts the evaluation INFUSCALE 7 Instructions for use 38 6.1.6 Modified Trumpet Curve and Constancy Index Short-term accuracy is expressed by the concept of constancy index. The principle is that the constancy index of the pump should be less than or equal to the half-life of the drug used. The data from which the constancy index is calculated are derived from the flow tests performed over 24 hours at 1ml/h. Flow is recorded at 30 second intervals over the final 18 hour period. And the average rate is compared with flow over each observation window from 1,2,3,4,… 29,30 and 31 minutes. The constancy index is the shortest time period during the pump’s steady-state operation over which measurement of output consistently falls within ±10% of the mean rate. The maximum positive and negative deviations of flow rate in each time window form the points of the modified trumpet curve. In contrast to the classical trumpet curve according to EN 606012-24, this curve is based on 31 observation intervals instead of 5 or 6. Picture 23 - Modified trumpet curve and constancy index In this example the constancy index is 4 as shown in the upper edge of the trumpet curve. Graphically the index is represented by a vertical broken line. In this example Epmax is +8.2116%, Epmin is -8.2599%. INFUSCALE 7 Instructions for use 39 6.1.7. Other Commands 6.1.7.1. Set Time Range This key opens an input area for the readjustment of the time baseline (X-axis) of the graphics. Clicking on the key next to "Minute" sets the range back to a maximum. 6.1.7.2. Set Flow Rate Range This key opens an input area for the readjustment of the range of flow rate (Y-axis) of the graphics. Clicking on the key next to "Rate" sets the range back to a maximum. 6.1.7.3. Zoom Clicking on this key displays an enlarged area of the flow rate graph. To determine its position and size please pull a rectangle with pressed left mouse key from the upper left corner to the lower right corner of the enlarged graphic area you want to display. 6.1.7.4. Unzoom After clicking on this key, the original graphic before zooming is displayed. INFUSCALE 7 Instructions for use 40 6.1.7.5. Entering Comment lines After clicking on this key the following window opens: It contains 4 lines for entering comments, which are printed out in the graphic- as well as in the test report printout. Clicking on memory. hides all comment lines. The OK-key below stores all lines into the comment 6.1.8. Data Output 6.1.8.1. Printout of the Trumpet Curve After clicking this key a printout of the flow rate graph and the Trumpet Curve is made. 6.1.8.2. Screen Print After clicking on this key, a screen print is made. INFUSCALE 7 6.1.8.3. Instructions for use 41 Table Output After clicking on this key, the file header, the comment lines, the single measured weight values and the calculated flow rate values are displayed in three tables. The column "Error[%]" in table 3 shows the percentage error of flow rate in relation to the set delivery rate for each data point. In columns Q1 - Q62 the mean flow rates are contained. At the end of table 3 the calculations according to the standard are shown. Picture 24 - Table display Trumpet Curve You can scroll through the table by pressing the left mouse key and move the mouse pointer up and down the scroll bar. For printing table 3 please click on . A screen print can be made by clicking on The keys . The table data can be stored in an Excel file by clicking on are used for loading and storing the comment lines. INFUSCALE 7 Instructions for use 42 6.1.8.4. Test Report After clicking on this key, the INFUSCALE test report is displayed. Picture 25 - Test report of trumpet curve evaluation Clicking on prints out the test report. After clicking on the test report is stored on file in TXT, WMF, HTML, CSV, RTF, or XLS format. A data transfer to Microsoft Word and Excel is easily possible. INFUSCALE 7 Instructions for use 43 6.1.8.5. Storage of Graphics on File and to Clipboard. When the cursors is pointing on a graphic, a click on the right mouse key shows the following pop-up menue: Clicking the left mouse key on one of the menue items stores the graphic on data file in either BMP or JPG format, or copies it to the clipboard from where it can be easily transferred to other programs e.g. Microsoft Word. Note: Auxiliary lines are not stored. INFUSCALE 7 Instructions for use 44 6.2. Bolus Evaluation 6.2.1. Evaluation according to EN 60601-2-24, 50.106 After clicking on key the screen EVALUATION is called up, which is suitable for the as- sessment of pumps with bolus characteristics (section 50.106 of the standard). For this purpose weight and flow rate are simultaneously calculated and displayed. In the following example the data file BSP6.PMQ has been loaded in screen EVALUATION before clicking on key . The following graphic appears: Picture 26 - Bolus evaluation In the upper part the weight of the delivered liquid is displayed as a function of time with the weight at the beginning of the measurement on the lower left side and in the upper right corner the final value. On the right margin of the weight curve the minimum and the maximum values are shown as numbers (0,000 bzw. 44,73). The steps, which represent the delivery of limited liquid volumes (boli) with a high flow rate, can be clearly identified. In this example a total of 9 liquid boli have been delivered. The lower part of the screen shows the flow rate curve. The steep increase of the flow rate during a weight step and its decrease in the time between two boli can be seen very clearly. INFUSCALE 7 Instructions for use 45 On the right margin of the flow rate curve the minimum and the maximum rates are shown as numbers (-0,2 resp. 109,2). Key on the upper left side of the graphs changes the scaling of the ordinate. When this key is not pressed, the Y-range of the curve is identical to the range of Y-values of the data file. When this key is pressed, the maximum Y of the curve is rounded to the next even value above the maximum Y-value of the data file. If key is pressed, two dotted lines are drawn in the flow rate curve marking the minimum and maximum flow rates. The lists on the right side of the screen display the calculated values as numbers. 6.2.2. Bolus Evaluation with adjustable Time Range By clicking on key in screen "Evaluation" an INFUSCALE-file with adjustable time range can be calculated and displayed. The following input area opens immediately after clicking, in which the user can enter the desired time range for calculation. Clicking on terminates the input and start the evaluation. INFUSCALE 7 Instructions for use 46 6.2.3. Other Commands 6.2.3.1. Set Time Range This key opens an input area for the readjustment of the time baseline (X-axis) of the graphics. Clicking on the key next to "Minute" sets the range back to maximum. 6.2.3.2. Set Weight Range This key opens an input area for the readjustment of the weight range (Y-axis) of the graphics. Clicking on the key next to "Weight" sets the range back to maximum. 6.2.3.3. Set Flow Rate This key opens an input area for the readjustment of the range of flow rate (Y-axis) of the graphics. Clicking on the key next to "Rate" sets the range back to a maximum. 6.2.3.4. Zoom After clicking on this key an enlarged area of the flow rate graph can be displayed. To determine its position and size please pull a rectangle with pressed left mouse key from the upper left corner to the lower right corner of the enlarged graphic area you want to display. 6.2.3.5. Unzoom After clicking this on key, the original graph before zooming is displayed. INFUSCALE 7 6.2.3.6. Instructions for use 47 Curve Measuring After clicking on this key, the graphic curves can be measured. Holding the left mouse key pressed, at first the left vertical line that indicates the lower measuring limit is drawn to the point of curve where the calculation shall start. Then, in the same way, move the upper measuring limit line. INFUSCALE calculates all relevant values between these two borders and displays it in the two listing areas at the right side of the screen. Example: Picture 27 - Bolus measuring In this example at first an enlarged area of the graph based on file BSP6.PMQ between minute 60 and 80 was drawn after clicking on "Time". Then a measuring between minute 64,01 and 70,00 has been made. The upper list shows, that the mean flow rate between the two lines is 49,4039°mL/h. The bolus between the lines has a volume of 4.9404 mL. The maximum flow rate between the vertical lines is 103,4081 mL/h, and 105,9 mL/h in the total displayed area. INFUSCALE 7 Instructions for use 48 6.2.3.7. Entering Comment lines After clicking on this key the following window opens: It contains 4 lines for entering comments, which are printed out in the graphic- as well as in the test report printout. Clicking on memory. hides all comment lines. The OK-key below stores all lines into the comment 6.2.4. Data Output 6.2.4.1. Printout of the Graphs After clicking on this key a printout of the two graphs (weight and flow rate) is made. 6.2.4.2. Screen Printout After clicking on this key, a screen printout is made. INFUSCALE 7 6.2.4.3. Instructions for use 49 Table Output After clicking on this key, the file header, the comment lines, the single measured weight values and the calculated flow rate values are displayed in three tables. At the end of table 3 the evaluation results are shown. Picture 28 - Table display, Bolus evaluation You can scroll through the table by pressing the left mouse key and moving the mouse pointer up and down the scroll bar. For printing out table 2 please click on . A screen print can be made by clicking on . The table data can be stored on an Excel file by clicking on The keys are used for loading and storing the comment lines. INFUSCALE 7 Instructions for use 50 6.2.4.4. Test Report After clicking on this key, the INFUSCALE test report is displayed Picture 29 - Test report of bolus evaluation Clicking on prints out the test report. After clicking on the test report is stored on file in TXT, WMF, HTML, CSV, RTF, or XLS format. A data transfer to Microsoft Word and Excel is easily possible. INFUSCALE 7 Instructions for use 51 6.2.4.5. Storage of Graphics on File and to Clipboard. When the cursors is pointing on a graphic, a click on the right mouse key shows the following pop-up menue: Clicking the left mouse key on one of the menue items stores the graphic on data file in either BMP or JPG format, or copies it to the clipboard from where it can be easily transferred to other programs e.g. Microsoft Word. Note: Auxiliary lines are not stored. INFUSCALE 7 7. Instructions for use 52 Measuring Accuracy In this chapter we want to give you an overview about the influence of evaporation and the interrogation error, which results from the communication and data processing between electronic balance and computer. Other failures, like the cannula effect, that is based on the lift of the cannula, the influence of temperature and geographically latitude to the exactness of measuring are not as important and will be neglected here. 7.1. Evaporation The next two graphics show the effect of the evaporation: Picture 30 - Evaporation without oil film In this picture the evaporation container was a bucket, containing 4 litres of water without an oil film. Within 67 hours 122.75 mL water evaporated, which can be observed in the upper graphic as falling weight curve. Respectively the evaporation curve below moves between –2.284 and –1.443. This is equivalent to a mean evaporation rate of 1.83 mL/h. INFUSCALE 7 Instructions for use 53 Picture 31 - Evaporation with oil film The volume of the container used for the next picture was about 100 mL with an oil film on the liquid surface. Within 870 minutes only 0.02 mL of water evaporated. The equivalent mean evaporation rate is 0.0014 mL/h. The comparison of these pictures demonstrate, that evaporation can lead to large measuring errors. Therefore, it is recommended to work always with an oil film, when the measuring has to be very exact or during the measuring of pumps with low flow rates. Before this, the evaporation rate has to be measured in a first prospective run. This rate has to be entered into the program before starting the measuring (see chapter 5.2.1.). INFUSCALE 7 Instructions for use 54 7.2. Interrogation Error Provided, the operation system has been set, as described in section 3.1, the timer error of the computer is one to two orders of magnitude below the interrogation error and can, therefore, be neglected. 7.2.1. Mettler Balance AE100 (Continuous Operation) During continuous operation a data string is sent periodically to the computer by the Mettler balance AE100. The time distance between two data transmissions is maximally 440 ms. The interrogation by the computer is done whenever the set time interval has run out, and is not synchronised, so that the moment of interrogation may be delayed for a maximum of 440 ms. This means that the computer takes a weight value that was applied maximally 440ms before the correct moment of interrogation. With an average measuring interval of 30 sec the error is maximal 1.5%. During the determination of the trumpet curve 4 to 62 measuring values are averaged. So the error will be reduced to about 0.38%. The next table (picture 23) shows the max. interrogation error and the average errors for the smallest observation window p = 4 of the trumpet curve dependent from the time interval. The shown maximum errors are extreme values. Time interval max. interrogation error Mean error (p=2 min) 1s 44% 11% 3s 14.6% 3.7% 6s 7.3% 1.8% 10 s 4.4% 1.1% 30 s 1.5% 0.38% 60 s 0.73% 0.18% 100 s 0.44% 0.11% 300 s 0.15% 0.04% 600 s 0.07% 0.02% 900 s 0.05% 0.01% Picture 32 - - Maximum error dependent of the time interval, Mettler auto INFUSCALE 7 Instructions for use 55 7.2.2. Sartorius Balance MC1 (automatic data transmission) The Sartorius balance MC1 transmits periodically a data string to the computer (Sartorius auto). The time interval between two consecutive data transmissions is max. 220 ms. The interrogation by the computer is done whenever the set time interval has run out and is not synchronised, so that the moment of interrogation may be delayed by maximally 220 ms. This means that the computer takes a weight value that was applied maximally 220 ms before the correct moment of interrogation. The next table (picture 24) shows the maximum interrogation error and the average errors for the smallest observation window p = 4 of the trumpet curve dependent from the time interval. Time interval Max. interrogation error mean error (p=2 min) 1s 22% 5.5% 3s 7.3% 1.8% 6s 3.6% 0.9% 10 s 2.2% 0.6% 30 s 0.73% 0.18% 60 s 0.36% 0.09% 100 s 0.22% 0.06% 300 s 0.07% 0.02% 600 s 0.04% 0.01% 900 s 0.02% 0.005% Picture 33 - Maximum error dependent of the time interval, Sartorius auto INFUSCALE 7 Instructions for use 56 7.2.3. Sartorius Balance MC1 (request mode) In the request mode (Sartorius abfr) the Sartorius balance MC1 is requested by the computer periodically after the time interval has run out. As response a data string is sent back to the computer. The maximum measured error is 60 ms in a test situation. In normal operation a maximal error of 30 ms can be expected. The next table (picture 25) shows that this mode is more accurate than the automatic data transmission mode at least for measurements with short time intervals. Time interval max. interrogation error mean error (p=2min) 1s 6% 1.5% 3s 2% 0.5% 6s 1% 0.25% 10 s 0.6% 0.15% 30 s 0.2% 0.05% 60 s 0.1% 0.03% 100 s 0.06% 0.02% 300 s 0.02% 0.005% 600 s 0.01% 0.002% 900 s 0.005% 0.001% Picture 34 - Maximum error dependent of the time interval, Sartorius abfr INFUSCALE 7 8. Instructions for use 57 Symbols and Formula T = Total measuring time in minutes T = tk - t1 [min] k = Number of measuring points r = Set delivery rate [mL/h] i = Measuring index i = 1 to k t = Time interval [min] between two consecutive measuring points ti = Measuring time [min] at point i p = Observation window index with p = 4, 10, 22, 38, 62 tp,i = Observation window with tp,i = ti+p - ti = pt Wi = Weight [g] at the measuring point i corrected by the evaporation loss d = Density of water = 0.998 [g/mL] at 20 °C Qi = Flowrate [mL/h] between two consecutive measuring points 60 (Wi - Wi-1) Qi = dt Wp,i = Weight [g] delivered during the observation window tp,i Wp,i = Wi+p - Wi W = Total weight [g] delivered during the total time T corrected by the evaporation loss W = Wk - W0 Q = Average flowrate [mL/h] during the total time T 60 W Q = dT Qp,i = Average flowrate [mL/h] during the observation window tp,i Qp,i = 60 Wp,i d tp,i Qpmax = Maximum Qp,i [mL/h] for each observation window tp,i and each value of p Qpmin = Minimum Qp,i [mL/h] ] for each observation window tp,i and each value of p INFUSCALE 7 Epmax = Instructions for use Highest positive deviation of Qpmax for each p, expressed as percentage deviation from the set rate r. Epmax = Epmin = = Qpmax - r 100 % r Highest negative deviation of Qpmax for each p, expressed as percentage deviation from the set rate r. Epmin = A 58 Qpmin - r 100 % r Percentage total error of the average flow rate Q, related to the set rate r during the total time T. Q-r A = 100 % r