1
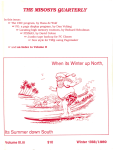
Visualizing Vectors on the Force Table
Royal High School Physics, Fall 2007
Purpose and Introduction
The following exercise, adapted from one of the PVAMU Physics laboratory exercises,
is meant to serve as a primer for vectors from an experimental perspective. Students
may want to perform this experiment before performing any of the hovercraft
experiments.
This activity meets State of Texas TEKS requirements from §112.42, IPC (c)(4)(A),(B);
§112.47, Physics, including items (c)(4)(C) to (E) and (5)(B) to (D).
http://www.tea.state.tx.us/teks/. More details about these and other national
science education teaching standards can be found at websites such as
http://www.nsta.org/
A vector is a mathematical object used to represent quantities, which have two (or
more) independent dimensions, such as magnitude and direction. We are going to
visualize vectors using two methods, experimental and graphical. The purpose of this
exercise is to familiarize the student with how vectors work and how they add together.
To investigate the nature of vector addition experimentally we will use a force table to
add two vectors by measuring the net effect of the forces when the system is at
equilibrium. Experimental steps:
Procedure
1. Case 1
♦ Put 150 grams on A and B (two vectors) and position them at 45 and 135
degrees.
♦ Add masses to the negative of the resultant, R (the vector that results when
you add the first two together) and vary the angle of the resultant until the
circle is balanced in the middle of the force table.
♦ Don’t forget to include the mass of the weight hanger (50g). When this occurs
a state of equilibrium exists and the sum of the vectors should be zero.
♦ Add these same two vectors graphically (scale their lengths so that 150g =
1.5cm on the graph, use a separate sheet of graph paper for this), measure
the angle and length of the resultant and compare that to the force table
resultant.
2. Calculate the force on each vector in SI units for Case 1. You will need to convert
measured values in grams to kg, and then remember that A is a force vector and so
must be in Newtons (A = mg). Values should be stated using 3 significant figures. D the
same for B and R and write your results in the space below.
3. Draw a picture of the force table top with all vectors used in part 1 labeled correctly.
4. Work the following cases, following the bulleted list of exercises for Case 1. Be sure
to convert all masses to Newtons (as described in #2) for the final answers.
♦ Case 2: A = 100 grams at 45 degrees; B = 100 grams at 110 degrees
A = _______N
B = _______N
R = _______N at _______degrees
♦ Case 3: A = 150 grams at 15 degrees; B = 200 grams at 60 degrees
A = _______N
B = _______N
R = _______N at _______degrees
♦ Case 4: A = 50 grams at 0 degrees; B = 150 grams at 90 degrees
A = _______N
B = _______N
R = _______N at _______degrees
♦ Case 5: A = 50 grams at 0 degrees; B = 150 grams at 75 degrees; C = 100
grams at 90 degrees
A = _______N
B = _______N
R = _______N at _______degrees
C = _______N
Visualizing Motion with PASCO’s Motion Sensor
Royal High School Physics, Fall 2007
Purpose
The purpose of this activity is to visualize motion with the PASCO motion sensor and to
use the sensor to match graphs of position versus time using the student as the object
in motion.
An important skill to have is to be able to look at a graph and to tell what it is
communicating. An excellent way to get practice with this is to make your own graphs.
Graphs are an excellent way to tell a lot of information without using a lot of words. We
will look at some graphs of position versus time. If the position stays the same, we see a
horizontal line on the graph. If the position changes, the line is tilted or curved,
depending on how it changes over time. The change in position over time is referred to
as “velocity” or “motion”. We will ultimately investigate position, velocity, and
acceleration and see how they are related to each other. However, we will stick to
position for this exercise.
This activity meets State of Texas TEKS requirements from §112.42, IPC (c)(4)(A),(C);
§112.47,
Physics,
including
items
(c)(4)(A),
(C),
and
(E).
http://www.tea.state.tx.us/teks/. More details about these and other national
science education teaching standards can be found at websites such as
http://www.nsta.org/
Equipment
The following will be needed to perform the experiment successfully.
♦ PASCO X-plorer GLX handheld data logger
♦ Digital adaptor for the datalogger
♦ Meter stick
♦ PASCO motion sensor
♦ Several sheets of graph paper
♦ Stopwatch or timer
Procedure
The Motion Sensor works by putting out pulses of sound and converting the travel times
to distance. It works with the knowledge of the speed of sound in air (331.4 m/sec.) and
the fact that the round-trip travel time multiplied by this speed value divided by two gives
the distance to an object. The object reflects the sound pulses back to the Motion
Sensor which makes it possible to calculate the distance to the object. The device
makes 10 measurements per second and usually plots these values on a distance
versus time graph.
The software that works with the motion sensor can also calculate velocity by taking the
differences between each consecutive reading of position and converting that to a
velocity value. It can also display acceleration by taking the differences between
consecutive velocity values. You will be studying the relationship between position,
velocity and acceleration in class, but we will start with position in this exercise.
It may be helpful to play around with the motion sensor for a few minutes before starting
this exercise. That way, you can get a feel for how it works and how changing your
position changes the appearance of the graph (of distance versus time) as it is being
plotted. Also, study the graphs, which both span 30 seconds, and plan how to move in
order to match these graphs
Match graph #1 with your own motion, holding the motion sensor so that it points toward
a wall (which will serve as the “object” which will reflect the sound waves, thus gauging
your distance from the wall). It may be helpful to have someone time you with a
stopwatch, calling out the time every five seconds (e.g. “5…10…15…20…”) so that you
can maintain your pace with the graph. Compare your results with the actual plot below.
Visualizing Position-Run #1
12.0
Distance (m.)
10.0
8.0
6.0
4.0
2.0
0.0
1
3
5
7
9
11
13
15
17
19
21
23
25
27
29
Time (sec.)
Repeat the procedure, now using Run #2 (below). Notice that this one is a bit more
complicated and will necessitate quick moves on your part.
Visualizing Position-Run #2
12.0
10.0
Distance (m)
8.0
6.0
4.0
2.0
0.0
1
3
5
7
9
11
13
15
17
19
21
23
25
27
29
Time (sec.)
Finally, make similar graphs for each other to follow, using pencil and ruler and graph
paper. Be challenging enough to make it interesting but be realistic as well (the motion
sensor has a range of 11.0 meters, and people can run only so fast…). When you are
finished with all this activity, answer the following questions (your teacher may have
additional questions to go with these).
Results and Conclusions
1. Comment on how difficult, or easy, it was to match the graphs that were provided
with this exercise and also by your classmates.
2. What was happening when the line was horizontal? Why?
3. What was happening when the line was tilted and how does the steepness of the
tilt relate to what happened?
4. How do these graphs show the relationship between position and velocity?
5. Is the Motion Sensor accurate? Place the sensor (preferably mounted on a
support rod / stand for steadiness) exactly 2.0 meters from the wall and activate.
Set the readout to “Digits” mode and take a few random numbers from the
readings (up to 5 numbers) and take the average of these. Does the average
equal 2.0? If not, why not? How far off was the Motion Sensor (if it read an
incorrect distance)?
Hovercrafts and Newton’s 3 Laws of Motion
Royal High School Physics, Fall 2007
Purpose
The purpose of this activity is to investigate Newton’s 3 Laws of Motion using a PASCO
force platform, motion sensor and hovercraft.
Introduction to the Activity
The hovercraft provides many fun opportunities to do demonstrations and experiments
involving brave student volunteers studying the concepts of momentum, collisions,
velocity, vectors, and forces. There are many real-world applications to the hovercraft,
as analogs of the laboratory model are used in daily life. Some everyday examples
include air-cushioned vehicles (or ACV’s) which travel atop a layer of compressed air
and can travel over land or water. These carry people, vehicles or freight, and can move
at speeds up to 80 mph.
The large PASCO hovercraft provides an excellent opportunity to investigate Newton’s
three laws of motion experimentally. The following exercise was adapted from the
experiment and user’s manual that came with the hovercraft. We have reproduced it
and changed it slightly for this exercise. Some of the activity involves drawing vectors
(you should complete the “Visualizing Vectors” exercise before starting this one…) and
the use of the force platform (you should complete at least the first part of the “Forces,
Motions, and Hovercrafts” exercise prior to starting this one…).
This activity meets State of Texas TEKS requirements from §112.42, IPC (c)(4)(A),(B);
§112.47, Physics, including items (c)(4)(C) to (E) and (5)(B) to (D).
http://www.tea.state.tx.us/teks/. More details about these and other national
science education teaching standards can be found at websites such as
http://www.nsta.org/
Equipment
The equipment needed for this activity is as follows:
♦ 1 PASCO Hovercraft with air supply
♦ 1 Meter stick
♦ Masking Tape
♦ Stopwatch
♦ 2 PASCO Xplorer GLX hand-held data loggers, fully charged
♦ 2 Digital adaptors for the GLX
♦ 1 PASCO motion sensor
♦ 2 PASCO Force Platforms
Procedure
In this experiment, we will investigate Newton’s three laws of motion. The activity is
adapted from PASCO’s Experiment and User Guide for the Hovercraft. These can also
be useful in exploring position, velocity and acceleration.
Newton’s First Law
• Several students will observe the motion, one will be the “catcher” to stop the
Hovercraft, and another will be the “marker” to mark the motion of the craft
with tape placed on the floor
• Set up the motion sensor, connected to an Xplorer GLX, so it will be able to
measure the distance and velocity of the person on the hovercraft. Press the
Play button when you are ready to put the rider in motion.
• Provide a brief push to the rider, then start the stopwatch
• The marker will then mark the position of the hovercraft each second, as well
as at the start and end of a 5-second interval
• After the last mark is placed, stop the Hovercraft
• Answer the questions in the final section.
Newton’s Second Law
• Assign the same roles from Experiment 1 to different students, and give
another student a chance to be the rider
• Place the motion sensor behind the rider, so as not to run over it when you
pull the rider. Press the Play button when you are ready to start.
• Using a rope, provide a constant force to the rider for about 3 seconds.
• Have the “marker” mark the position of the Hovercraft each second
• After moving across the floor for 5 seconds, stop the vehicle, then stop the
Motion Sensor
• Answer the questions in the final section
Newton’s Third Law
• Assign the same roles from Experiment 1 to different students, and give another
student a chance to be the rider (except that no markers will be needed in this
case)
• The “pusher” should hold the Force Platform perpendicular to the ground
• The “rider” should place the second Force Platform up against the pusher’s.
• The pusher should provide a force to the rider for about 1 second
• After moving across the floor for about 5 seconds, stop the vehicle
• Answer the questions in the final section.
Questions-Newton’s First Law of Motion
1. Describe the motion both during and after the push
2. Draw a force diagram for the rider both during and after the push
3. Describe the position versus time and velocity versus time graphs (you can print
them out as well…). Based on the appearance of the velocity graph, is the rider
traveling at a constant velocity?
4. Describe the spacing between the marks on the floor, and what is suggested about
the motion of the Hovercraft? Make a plot of the distance versus time based on
stopwatch and mark data. How does this compare with that of the Motion Sensor?
5. Describe the causes of motion that you observed throughout the motion of the
Hovercraft
Questions-Newton’s Second Law of Motion
1. Describe the motion both during and after the pull
2. Draw a force diagram for the rider both during and after the pull.
3. Describe the position versus time and velocity versus time graphs (you can print the
graphs as well…). Based on the appearance of the velocity graph, is the rider
traveling at a constant velocity?
4. Describe the motion of the hovercraft based on the spacing between the marks on
the floor. Make a plot of the distance versus time based on stopwatch and mark
data. How does this compare with that of the Motion Sensor?
5. Describe the causes of motion that you observed throughout the motion of the
Hovercraft
Questions-Newton’s Third Law of Motion
1. Describe the motion both during and after the push
2. Make a graph from the Force Platform data showing both the pusher’s force and the
rider’s force
3. Draw force diagrams for both the pusher and rider during the push
4. Formulate a general rule about the size and direction of forces between two objects
For Further Thought
You probably have done one or more activities in addition to this one which were meant
to illustrate one or more of Newton’s laws of motion. How are the activities similar?
What is different about them? Specifically describe the common features of all the
activities meant to show Newton’s Laws of motion.
Forces, Motions and Hovercrafts
Royal High School Physics, Fall 2007
Purpose
The purpose of this activity is to investigate several interrelated physics concepts using
a PASCO force platform and a PASCO hovercraft.
Introduction to the Activity
The hovercraft provides many fun opportunities to do demonstrations and experiments
involving brave student volunteers studying the concepts of momentum, collisions,
velocity, vectors, and forces. There are many real-world applications to the hovercraft,
as analogs of the laboratory model are used in daily life. Some everyday examples
include air-cushioned vehicles (or ACV’s) which travel atop a layer of compressed air
and can travel over land or water. These carry people, vehicles or freight, and can move
at speeds up to 80 mph.
We will be investigating two seemingly unrelated topics in physics, but we will ultimately
tie them together. This exercise is one of a series of related exercises involving the
large PASCO hovercraft (the original exercise which is a combination of these is on the
Internet, on the Project XLR8 Website). The first part of the exercise is actually a primer
to get the student used to the PASCO force platform. The students will have the chance
to see how jumps, stomps, steps, and leaps show up on a graph that shows the force
exerted versus time. By measuring the peak of the graph, the student will be able to
directly see the force (in Newtons) exerted on the platform during the action.
Next, we will use the hovercraft to see how straight-line or translational motion
compares to rotational or angular motion. We will look at these individually then put
them together to get a complicated motion called a cycloid. (To see a nice animation of
a cycloid, which shows a motion similar to what we will see with the Hovercraft, only
faster, go to http://www.ies.co.jp/math/java/calc/cycloid/cycloid.html, go to “Applet 1”
then click on “Animate”).
So…how do the two relate to one another? Consider the hovercraft moving at a
constant velocity across the gymnasium floor. The craft+person has a certain
momentum, p, which equals the total mass multiplied by the velocity. The more mass,
the greater momentum; the lower the velocity the smaller the momentum. Suppose the
hovercraft were allowed to continue until it bumped into a wall, and we could measure it
with the force platform. The momentum would be transferred into the wall, then back to
the hovercraft in the form of an Impulse which would likely result in the craft bouncing
off the wall and going another direction. This gets into a discussion of collisions which is
another laboratory activity altogether. For this exercise we will focus on the two parts,
and combine them later on.
This activity meets State of Texas TEKS
§112.47, Physics, including items
http://www.tea.state.tx.us/teks/. More
science education teaching standards
requirements from §112.42, IPC (c)(4)(A);
(c)(4)(B),(C),(E) and (5)(B) to (D).
details about these and other national
can be found at websites such as
http://www.nsta.org/
Equipment
The equipment needed for this activity is as follows:
♦ 1 PASCO Hovercraft with air supply
♦ 1 Meter stick
♦ Masking Tape
♦ Stopwatch
♦ 1 PASCO Xplorer GLX hand-held data logger, fully charged
♦ 1 PASCO Force Platform
Procedure
In this experiment, we will investigate forces, momentum, and motion, and how these tie
together. In the first part, we get acquainted with the force platform and find out how
simple actions, such as footsteps and jumps appear on a force versus time plot. We will
look at these plots a bit more closely to see which ones are more pronounced. Students
are encouraged to try a variety of steps, jumps, and exercises (including push-ups,
standing on one foot versus two, etc.) and see how these register on the time versus
force plot. We will then look more closely at the physics behind these actions.
Second, we will investigate motion, both the linear (also called “translational”) and the
circular (angular) forms. We will learn how they work together to produce a more
complicated motion as seen from a stationary reference point.
The Forces of Steps, Jumps, and Leaps
We will look at the force platform by itself first (this will be used again in a separate
exercise). Connect the platform to the Xplorer GLX and make sure it is displaying the
graph of force versus time. Once everything is set up properly, hit “play” on the GLX
and make sure a graph is plotting. Do a series of activities, one at a time, in a welldefined sequence so you can pick out one from another. It would be a good idea for a
group-mate to write down the nature of each activity that affects the force platform to
enable better correlation of activity to parts of the plot. The activity will include a footstep
while walking, a footstep while running, standing in place on both feet then on one foot,
horizontal and vertical jumps, pushups, and anything else you can think of. Make sure
there are several seconds of time to give the display a chance to “flat line” so you can
later tell one activity from another. Once you have all the activities, press the play button
on the GLX once more to stop it and fill in the table on the following page.
Activity
Measured value + comments on the activity
“Activity” is where you put the name of the activity, and “Measured value + comments
on the activity” are where you put the times and comments. For example, you can put a
value for the maximum force exerted by a single jump in place, and add the height of
the jump as measured by a group-mate.
You can use the “smart tool” application on the graphical portion of the GLX to find the
maximum force of a given action. Having written each action down as it happens, as
well as including “space” between each action to enable a distinction to be made
between each action, it will be much easier to correctly identify each and correlate the
correct value of force for each as measured by the GLX.
To think about: How can you use some of the above activities to further your knowledge
of energy, momentum, and impulse? You can include the use of the entire profile of a
given action, not just the top of the peak.
Rotation versus translation motion
Give the Hovercraft and rider a push, but add some spin to the vehicle. Try to get the
vehicle to move as straight as possible so as to not collide with the walls. Pick a point
on the edge of the craft and time how long that point (you can mark it with masking tape
or something that stands out) takes to make one rotation. Also mark the location of the
hovercraft at the start and end of the rotation. If you were a fly on the ceiling watching
what was going on below, what would the shape of the path of the masking tape marker
be (the one rotating on the edge of the craft)? Draw it in the space below:
Measure the diameter of the hovercraft and calculate its circumference, C = πD.
Calculate the angular velocity with the formula d = vt, where d is the circumference C.
How does this value compare with the value of straight-line velocity from point A to
Point B?