1
An Example
13-1
13. An Example
13.1 Parameter Estimation
13.1.1 Laboratory Data
This section takes you, step by step, through an example which demonstrates the application
of PEST to a practical problem. Once PEST has been installed on your computer, the files
cited in this chapter can be found in the pestex subdirectory of the main PEST directory.
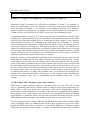
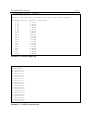
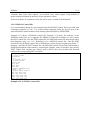
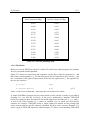
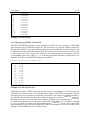
Table 13.1 shows the results of an experiment in which the specific volume of a soil clod (the
reciprocal of its bulk density) is measured at a number of water contents as the clod is
desiccated through oven heating. The data are plotted in Figure 13.1; see also file soilvol.dat.
We wish to fit two straight lines to this data. In soil physics parlance, the straight line
segment of low slope fitted through the points of low water content is referred to as the
“residual shrinkage” segment, whereas the segment covering the remainder of the data (with
a slope near unity) is referred to as the “normal shrinkage” segment. (Actually, another
segment of low slope is often present at high moisture contents, this being the “structural
shrinkage” segment; this segment is not apparent in the data plotted in Figure 13.1.)
Specific volume (cu m/Mg)
1.0
0.8
0.6
0.4
0.0
0.2
0.4
Water content (cu m/Mg)
Figure 13.1 Soil clod shrinkage data.
0.6