1
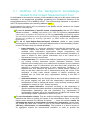
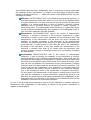
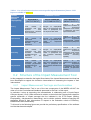
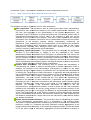
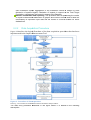
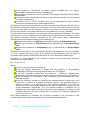
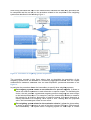
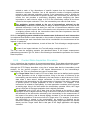
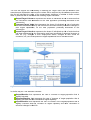
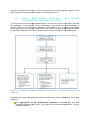
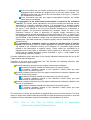
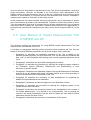
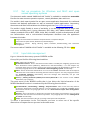
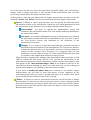
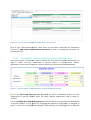
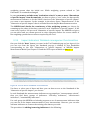
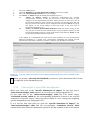
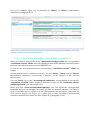
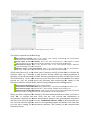
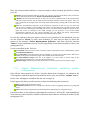
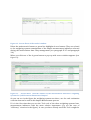
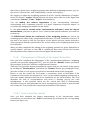
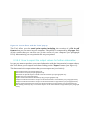
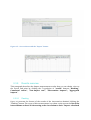
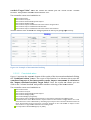
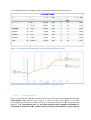
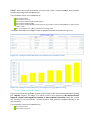
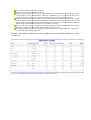
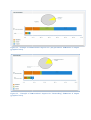
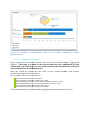
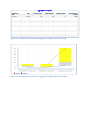
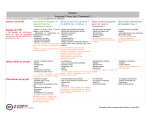
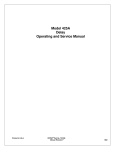
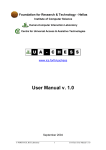
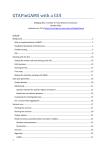
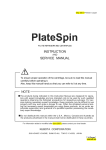
PART II – Software manual of the
Impact Measurement Tool of
MIREIA eI2-IAF
II.1 Outlines of the background knowledege
related to the Impact Measurement Tool
As anticipated in the executive summary to this handbook, this part of the report outlines the
description of the background knowledge constituting the foundational elements of the
Impact Measurement Tool of MIREIA eI2-IAF. The full theoretical framework is reported in
the IPTS report available at the following address: http://…
As discussed in the report, the key elements of the MIREIA eI2-IAF related to the Impact
Measurement Tools they are:
The set of dimensions of specific impact of employability that the IPTS Report
defines as follows: “… Skilling: improvement of ICT skills and capabilities; Empowerment:
enhancement of confidence and motivation for learning; Networking: strengthening network
ties and outreach potential (social capital bonding and bridging); Job-placement capabilities:
facilitate the possibility for accessing information on labour market and entrepreneurial
opportunities…”.
The set of Input-Output-Outcome-Impact indicators related to each specific
intervention to be considered in the Impact Measurement of the Intermediary’s action.
In the IPTS Report they are defined as follows: “….
Input indicators (i.e. resources allocated to provide the interventions, e.g.
financial, material and human resources). These indicators are normally
available within intermediary organisations budget, programming, and
financial/accounting documents, with relation to both resources allocated to or
spent in relation to each specific intervention and to the overall set of
interventions focusing on eInclusion.
Output Indicators (i.e. services and products produced by the interventions,
e.g. training courses; awareness actions; placement activities). These
indicators are normally easy to be defined and monitored as they represent
the immediate result of interventions and data about their progresses are
reported in monitoring documents of each intervention. However, it is
important that such indicators are defined in a shared manner (already exante) so that they reflect the unit of measurement during the course of the
evaluation. In many cases internal systems of outputs' monitoring are
available also for small and micro organisations working in the field of
eInclusion.
Outcome Indicators, they are distinguished in direct and indirect benefits that
the groups targeted can gain from the intermediary’s interventions (e.g.
enhancement of skills in Internet job search – direct outcome; leading to better
capabilities to search for a job - indirect outcome).
Specific Impact Indicators, structured according to the dimensions of
specific impact that have been identified as employability relevant (i.e. Skilling;
Empowerment; Networking; and Job placement) (e.g. improvement of
employability conditions due to the enhancement of Internet Job search skills
and resulting in better capabilities to search for a job)...”.
The set of evaluation criteria. They are useful for defining the impact measurement
indicators that allow to quantify the impact of the intermediary’s action. In the IPTS
Report these elements are defined as follows: “…. there are several criteria for
evaluating the degree of achievement of results of an intervention. Among them,
the criteria that have been chosen as part of the Impact Measurement Tool are:
efficiency, effectiveness and sustainability. Their purpose is to allow to assess in
an aggregate manner the measurement indicators in order to provide the
intermediaries and eInclusion stakeholders with an instrument to better understand
the capability of their interventions” in respect to the dimensions of specific impact
defined in the first bullet point. “… .Within the context of the MIREIA eI2-IAF they are
calculated as follows:
Efficiency (OUTPUT/INPUT ratio in the system of measurement indicators). It
describes the extent to which time, effort or cost is used for the implementation
of a given intervention. It is often used with the specific purpose of relaying the
capability of a specific application of effort to produce a specific outcome
effectively with a minimum amount or quantity of waste, expense, or
unnecessary effort. The measurement of the efficiency of a given intervention
can be produced immediately after the completion of the intervention itself as
soon as Output measures are made available.
Effectiveness (OUTCOME/OUTPUT ratio in the system of measurement
indicators). It provides a measure of the outcomes produced by a given
intervention in relation to the output generated by the intervention itself. The
measurement of the effectiveness can be done only when outcomes are
available. As already introduced in the discussion of the Measurement
Indicators, the measurement of the outcome of a given intervention have to be
conducted after a certain period of time after the end of the intervention.
According to the experience of the case studies the measurement of the
outcomes is normally done three to six months after the intervention with
surveys involving a sample of beneficiaries that have successfully completed
the interventions.
Sustainability (IMPACT/OUTPUT ratio in the system of measurement
indicators). It aims at defining the capability of the intervention to produce
structural changes in the conditions of the beneficiaries. Also in this case the
measurement of the degree of sustainability of a given intervention needs to be
done after a certain period of time after the end of the intervention itself. In this
case the time lag between the intervention and the measurement of impact
indicators need to be higher that the measurement of outcome indicators. This
is due to the fact the sustainability of an intervention is evaluated based on
impact indicators that seek to provide evidence of such structural changes
(e.g. in the employment status of the beneficiaries of a specific intervention).
For this reason, the measurement of the impact is usually done at least one
year after the completion of a given intervention. However the decision of at
what time to conduct impact measurement and assess the sustainability of the
intervention can vary according to the nature of the intervention itself and the
availability of resources to conduct the evaluation.
In Table 1 are provided some examples of how to use the indicators to measure efficiency,
effectiveness and sustainability of interventions in respect to the specific dimensions of
impacts on employability.
Table 1 - Use of evaluation criteria to assess specific impact dimensions (Source: IPTS
Report available at http://…)
Specific
dimension
of
impacts
on
Employability
Skilling
Empowerment
Networking
Job-placement
Evaluation Criteria
EFFICIENCY
(OUTPUT/INPUT)
Total
number
of
participants that have
improved
their
skills/resources allocated
to the intervention
Total
number
of
empowered
participants/resources
allocated
to
the
intervention
EFFECTIVENESS
(OUTCOME/OUTPUT)
SUSTAINABILITY
(IMPACT/OUTPUT)
Changes
on employability
status of the participants/ total
number of participants that
have improved their skills
Change
of
the
employment conditions of
the
empowered
participants/ total number
of participants that have
improved their skills
Changes
on employability
status of the participants/ total
number
of
empowered
participants
Total
number
of
participants that have
increased
networking
capability/resources
allocated
to
the
intervention
Changes
on employability
status of the participants/ Total
number of participants that
have increased networking
capability
Total
number
of
participants that have
increased job-placement
capability/resources
allocated
to
the
intervention
Changes
on employability
status of the participants/ Total
number of participants that
have increased job-placement
capability
Change
of
the
employment conditions of
the
empowered
participants/total number
of empowered participants
Change
of
the
employment conditions of
the
empowered
participants/ Total number
of participants that have
increased
networking
capability
Change
of
the
employment conditions of
the
empowered
participants/ Total number
of participants that have
increased job-placement
capability
II.2 Structure of the Impact Measurement Tool
In this paragraph we describe the logical flow charts of the Impact Measurement tool that has
been developed to support the eInclusion intermediaries in assessing the impacts of their
interventions.
II.2.1
Impact Measurement Tool logic and functionalities
The Impact Measurement Tool is one of the two components of the MIREIA eI2-IAF, the
other one is the Counterfactual Handbook presented in the Part I of this report.
In particular it aims at supporting the intermediaries in elaborating sets of Input-OutputOutcome-Impact (I-O-O-I) data collected in relation to their eInclusion interventions related to
specific dimension of impact amongst the four indicated in the IPTS Report (Skilling,
Employability, Job-placement, Networking), and to obtain synthetic indexes measuring the
aggregate effects of their interventions in respect to the evaluation criteria of Efficiency,
Effectiveness and Sustainability.
To this end in the following figures we provide the preliminary specifications of the software
tool that has been developed.
In particular, Figure 1 provides the breakdown of main components of the tool.
Figure 1 -
Main components of the Impact Measurement Tool
The software tool will be organized into five main procedures:
Data acquisition. This
his procedure aims at acquiring the data of the Intermediary’s
interventions that constitute the bases for the impact measurement
measurement elaboration. To
this end, and according to the specifications of the Impact Measurement Tool
described in the IPTS Report, for each intervention the Tool asks for specific sets of
Input-Output-Outcome--Impact (I-O-O-I) data or the sub-sets of data that
tha will be
available at the moment of the analysis. Each set of data represents the relevant
information of an eInclusion intervention and it is associated to one of the four specific
dimensions of the analysis (namely: skilling, employability, networking, job
placement). Then, according
ccording with the completeness of the data set the procedure
asks the intermediary which evaluation criteria have to be used for the impact
measurement, selecting them amongst those there
there defined in the IPTS report
(namely: efficiency, effectiveness and sustainability).
Weighting system acquisition.
acquisition This
his procedure aims at acquiring the preference
structure of the intermediary in relation to the key variables of the Impact
Measurement Modell described in the IPTS Report. In particular the Tool asks to the
intermediary the preference structure for the following sets of variables: dimensions of
specific impacts; evaluation criteria; intermediary’s interventions used for the impact
measurement. For each set of variables the preference structure of the intermediary
will be represented as a weighting system showing the degree of relative importance
of each variable belonging to the set under consideration.
consideration
Context data acquisition.
acquisition This procedure aims at guiding the intermediary in
understanding the context in which
whi is operating and to acquire information useful to
measure the impacts of the intermediary’s interventions in relation to the target
population at risk of digital exclusion. In particular
particula the Tool supports the intermediaries
in defining the Target Value of each intervention. It represents the total population at
risk of exclusion belonging to the area of influence
influence of the intermediary that could be
addressed if there aren’t
aren budget constraints
nts in providing the intervention under
assessment.. The other context variable
v
that the Tool guides the intermediary to
calculate is the Baseline of each intervention.
intervention It represents the proportion of Total
Population at risk of exclusion interested to the intervention that is already digitally
included. Therefore the Target Value is also equal to Total Population minus the
Baseline. For example if the eInclusion intervention is related to the skill
improvements of young persons between 18 and 35 years old, the Total Population
related to the intervention are all the young persons in the area of influence of the
intermediary with an age in this range; the Baseline is represented by the individuals
of the Total Population with a skill similar or superior to those
those that could be acquired
with the intermediary’s intervention; the difference between the Total Population and
the Baseline represents the Target Value that the intervention could address without
any budget constraints.
Impact measurement elaboration.
elaboration This
is procedure aims at elaborating the impacts
of the intermediary’s interventions and it is composed by the following steps:
calculation of impact measurement indicators (per each intervention are considered a
maximum number of 2 indicators per each evaluation
ion criteria); aggregation of the
impact measurement indicators (in this case the weighting system is fixed and equal
to 0.5
5 per each couple of indicators); aggregation of the interventions in relation to
each evaluation criteria; aggregation of the evaluation
evaluation criteria in relation to each
dimension of specific impact; calculation of impacts in respect to the Total Target
Population;; calculation of the impact in respect to the Baseline;
Results visualization and exporting.
exporting This
his procedure aims at presenting the results
of impact measurement elaboration in graphic and numeric formats and to allow the
intermediary to export the input data and the results in a format suitable for future
elaborations.
II.2.2
Data Acquisition
cquisition Procedure
Figure 2 describes the logical flowchart of the data acquisition procedure that has been
implemented in the Impact Measurement Tool.
Figure 2 - Procedure of data acquisition
Note: k, j, i are counters to number the boolean variables in the procedure.
The data entry procedure described in the figure above it is based on the following
assumption:
Fixed numbers of dimensions of specific impacts (variable D in the figure):
Employability; Skilling; Networking; Job placement.
Fixed number of evaluation criteria (variable C in the figure): Efficiency; Effectiveness;
Sustainability.
Undefined number (variable N in the figure) of inclusion interventions to be considered
for Impact measurement.
Pre-defined sets of I-O-O-I variables that can be associated to each inclusion
intervention considered for the impact measurement.
According to the procedure described in the figure, the data entry starts from the selection of
the dimensions of specific impacts to be measured. Per each of the selected dimensions the
systems will ask which are the evaluation criteria to be used for the impact measurement
and, for each criterion, the system asks for the most suitable set of I-O-O-I variables.
The last activity of this procedure is the calculation of the measurement indicators. This starts
from the sets of I-O-O-I registered by the procedure per each intervention and per each of
the selected evaluation criterion. According to the IPTS Report these measurement
indicators will be calculated according to the following logic:
Measurement indicators of Efficiency will be calculated as an Output/Input ratio.
Measurement indicators of Effectiveness will be calculated as an Outcome/Output
ratio.
Measurement indicators of Sustainability will be calculated as an Impact/Output
ration.
Therefore the calculation of the measurement indicators will depend by both the availability
of I-O-O-I variables provided as input of the system by the Intermediary and the types of
evaluation criteria that the intermediary will decide to use in the impact measurement.
Per each run of the application the maximum number of the measurement indicators
(variable I in the figure) will be:
IMAX = D x C x 2 x N
where:
I are the maximum number of indicators.
D are the specific dimensions of impact that are maximum 4 (Employability,
Sustainability, Skilling, Networking) as indicated in the IPTS Report.
C are the evaluation criteria that are maximum 3 (Efficiency, Effectiveness,
Sustainability) per each dimension of specific impact as indicated in the IPTS Report.
N are the number of interventions to be considered by the intermediary per each
evaluation criteria.
2 are the maximum number on measurement indicators that is foreseen per each
intervention in relation to a specific evaluation criterion. The procedure allows to
define a maximum of 2 indicators per each criterion (maximum 6 in total per
intervention if the intermediary selects all the three measurement criterion for the
impact assessment calculation). The Tool already contains a predefined set of
indicators per each criterion that can be selected for the assessment. Moreover, new
indicators defined by the intermediaries can be stored in the indicators’ database of
the Tool for future use.
After having selected the indicators the procedure proceeds to the calculation of the
corresponding impact values on the bases of the I-O-O-I data sets retrieved.
II.2.3
Weighting System Procedure
After having calculated the value of the measurement indicators the data entry procedure will
be completed and the tool will run the procedure related to the acquisition of the weighting
systems as described in the following Figure 3.
Figure 3 - Procedure of weighting systems acquisition
The procedure reported in the figure above aims at describing the acquisition of the
weighting systems that are needed for constructing aggregated indexes from the impact
measurement indicators calculated with the data acquisition procedure described in th
the
Figure 2.
In particular the procedure allows the intermediary to specify three weighting systems:
The
he weighing system related to the dimension of specific impacts.
impacts It allows to
define the relative importance of each dimension of specific impact.
impact For facilitating the
choice, the tool presents
present a predefined weighting structure assigning the same weight
to the selected dimensions. For example in case the intermediary decides
dec
to measure
the impacts for all the four dimensions of specific impacts, then each dimension is
initially associated to a weighting value equal to 0.25. Starting from the proposed
value, the intermediary
diary can make its final choice.
The
he weighting system related to the evaluation criteria. It allows
allow the intermediary
to assign a relative importance to each of the three criteria of Efficiency, Effectiveness
and Sustainability. The system asks a weighting system for each triple of criteria
related to each of the dimensions of specific impacts that the intermediary has
decided to measure. Therefore, four is the maximum number of weighting systems
related to each selected evaluation criterion if the intermediary want to assess the
impact of all the four dimensions of specific impact. Also in this case, per each triple of
criteria, the tool provides a preliminary weighting system assigning the same
importance to each criterion equal to 0.33 if the intermediary selects all the three
criteria for the impact evaluation. Then, the intermediary can make its final choice;
The weighting system related to the set of interventions selected by the
intermediary. It allows the intermediary to assign a relative importance to each of the
selected intervention. It will be done per each set of interventions related to each
dimension of specific impact. Also in this case the tool will present to the intermediary
a weighting system were all the interventions have the same importance, than the
intermediary can make the final choice.
While the weighting system related to the measurement indicators of each intervention
is considered fixed and the value depends on the number of impact measurement indicators
that will be selected per each intervention that will be considered in the measurement of the
impacts. In particular:
In case of two impact indicators, to each of them the Tool will assign a weight equal to
0.5.
In case of one impact indicator, the Tool will assign a weight equal to 1.
The Tool uses the weighting systems just described above in the impact measurement
elaboration presented in §.II.2.4, while in the following is described the procedure for Context
Data Acquisition.
II.2.4
Context Data Acquisition Procedure
Figure 4 describes the procedure of context data acquisition. These data refers to the context
in witch the intermediary operates and they have been widely described in the IPTS Report.
Although the IPTS Report describes a long list of context data that the intermediary could
analyse, for the specific purpose of the Impact Measurement of the intermediary’s
interventions, the Tool only considers two types of context data:
The Target Value data of each I-O-O-I set of data, that can be defined as the portion
of total population at risk of digital exclusion living in the area of influence of the
intermediary and that could be affected by the intervention to which the set of I-O-O-I
data refers if there weren’t budget constraints. In other words each intervention
selected by the intermediary for the measurement of impacts of its activity, addresses
a specific portion of target population at risk of exclusion. For example, if the
intervention is related to employability, the total population considers all the persons
at working age, living in the area where the intermediary operates. While, the Target
Value is that part of the target population that is digitally excluded.
The Baseline each I-O-O-I set of data, that can be defined as the portion of target
population at risk of digital exclusion living in the area of influence of the intermediary
and affected to the intervention selected by the intermediary for the measurement of
the impact of its activity, that is already digitally included. It can be calculated as the
total target population in the area minus the Target value. For example, if, as above,
the intervention is related to the employability, the baseline is obtained as the
difference between the total population at working age (target population as defined
above) and the Target Value that is that part of the target population still digitally
excluded.
The tool will support the intermediary in defining the Target Value and the Baseline with
examples and explanation and once the values will be acquired by the software procedure,
the tool will calculate the value of the measurement indicators in relation to these context
data. In particular will be calculated the following impact indicators:
Output/Target Value that represents the share of individuals at risk of exclusion
exclusio that
the intervention has addressed on the total population potentially interested to the
intervention.
Outcome/Target Value that represents the share of individuals at risk of exclusion
that have been addressed by the intervention and have shown permanent
perman
changes in
their digital capabilities, on the total population potentially interested to the
intervention.
Impact/Target Value that represents the share of individuals at risk of exclusion that
has been addressed by the intervention and have benefitted of structural changes in
their life (e.g. changes in their employment status, changes in their social life
conditions, etc.) due to acquisition of digital capabilities due to the intervention.
Figure 4 - Procedure of context data acquisition
In similar way the Tool allows to calculate:
calculate
Output/Baseline that represents the rate of increase of target population
popula
that is
digitally included.
Outcome/Baseline that represents the rate of increase of target population that is
digitallyy included and has increased
i
its digital capability.
Impact/Baseline that represents the rate of increase of the target population that is
digitally included and has increase its digital capability and have benefitted of
structural changes in their life.
All these indicators will be used in the final procedure for measuring the impacts of the
intermediary’s interventions as described in the following Figure 5.
II.2.5
Impact
Measurement
Elaboration
Visualization and Exporting
E
Procedures
and
Results
The last procedure of the Impact Measurement Tool has
has two aims: on one side it provides
the elaboration of the impacts of the intermediary’s intervention per each dimension of
specific impact;
pact; on the other side it allows the intermediary to see in numeric and graphic
format the results of the impact measurement and, finally, to export the data and the results
of the impact measurement in a format that could be used for further off-line
line elaborations.
elaborations
Figure 5 - Procedure of impact measurement elaboration and results visualization and
exporting
According to the figure above, the procedure provides three levels of aggregation of the data
collected:
The aggregation of the measurement indicators,
indicators, calculated with the data
acquisition procedure (see Figure 2),
), in respect to the measured intervention. This will
be done as follows:
If the intervention has two impact measurement indicators, it is calculated an
aggregated value obtained as weighting sum of the two impact values. The
weighting system that it is used is the one described in the Figure 3 related to
the measurement indicators.
If the intervention has only one impact measurement indicator, the impact
value remains unchanged.
The aggregation of the measurement intervention in respect to the evaluation
criterion. The impact values calculated in the previous bullet point and that can be
associated to a specific evaluation criterion, it is aggregated in a synthetic impact
value through a weighting sum where the weighting system is that one described in
the Figure 3 and related to the set of interventions associated to a dimension of
specific impacts. The procedure calculates the synthetic impact for each of the
evaluation criterion of each of dimension of specific impact selected by the
intermediary during the data acquisition procedure described in Figure 2. At the end of
this aggregation process can be obtained a maximum number of 12 synthetic impact
values related to the evaluation criteria: they are obtained multiplying the evaluation
criteria (max 3 per each dimension of specific impact) and the dimensions of specific
impact (max 4).
The aggregation of evaluation criteria in respect to the dimension of specific
impact. The procedure allows to further aggregate the synthetic impact values (max
12) related to the evaluation criteria, up to maximum of 4 synthetic impact values
related to the dimensions of specific impact. These values are calculated as a
weighted sum of the triple of evaluation criteria related to a dimension of specific
impact and the related weighting system described in Figure 3 and related to the
corresponding evaluation criteria.
A similar elaboration will be also done for the impact indicators obtained with the use of the
Target Values and the Baselines.
Therefore at the end of the elaboration the Tool provides the following maximum total
numbers of synthetic impact values:
Synthetic indicators derived from the impact measurement indicators:
4 synthetic indicators related to the dimensions of specific impact.
12 synthetic indicators related to the evaluation criteria (three per each
dimension of specific impact).
Synthetic indicators derived from the impact measurement indicators obtained with
the use of the Target Values:
4 synthetic indicators related to the dimensions of specific impact.
12 synthetic indicators related to the evaluation criteria (three per each
dimension of specific impact).
Synthetic indicators derived from the impact measurement indicators obtained with
the use of the Baseline:
4 synthetic indicators related to the dimensions of specific impact.
12 synthetic indicators related to the evaluation criteria (three per each
dimension of specific impact).
The three sets of results are presented in graphical and numeric formats and the Tool also
allows to export them and the data acquired with the data acquisition procedures in a format
suitable for further elaboration that the intermediary could decided to do off-line.
II.2.6
Use of the Tool for Policy Actions or Aggregate
Intervention Impact Measurement
Until now we have described the characteristics of the Tool and its functionalities if used by a
single intermediary. However, as indicated in the Final Report, other stakeholders of the
digital inclusion could be interested in the use of the tool. In particular we are referring to the
networks of intermediaries or founders and the local authorities that could be interested in
measuring the impacts of eInclusion of their policy actions.
In this perspective we should consider that each policy action can be associated to specific
sets of interventions provided by the intermediaries. Therefore in these case, before to use to
Tool the organization that what to proceed with the impact measurement of they e-inclsion
intervention has to prepare the input data in advance and proceed to the aggregations of
homogeneous interventions underpinning the policy action under analysis before to run the
Tool.
II.3 User Manual of Impact Measurement Tool
of MIREIA eI2-IAF
This Chapter contains the instructions for using MIREIA Impact Measurement Tool and
represents the User Manual of the Tool.
It is divided in 9 paragraphs describing all the procedures that constitutes the Tool, they are
based of the logical flowchart presented in the previous chapter, and in particular:
•
Paragraph 3.1 describes the installation procedure of the Tool in relation to the
different operating systems. At the moment the Tool can be used with Windows and
Mac, and it is also compatible with existing open sources operating systems such as
Linux.
•
Paragraph 3.2 describes the Input Data management procedure.
•
Paragraph 3.3 describes the procedure for defining the weighting system related to
the Evaluation Criteria (Efficiency, Effectiveness and Sustainability) of each
dimension of specific impact.
•
Paragraph 3.4 describes the databanks related to the Impact Measurement Indicators
and how it can be updated whit further indicators defined by the users according to
the three Evaluation Criteria considered by the Tool
•
Paragraph 3.5 describes the procedure of data management for preparing the
dataset for Impact Measurement elaboration.
•
Paragraph 3.6 describes the data management of the Evaluation Criteria.
•
Paragraph 3.7 describes the procedure for defining the weighting system of the
impact measurement indicators.
•
Paragraph 3.8 describes the procedure related to the management of the results of
the Impact Measurement. In is divided in two sub-procedure, one for printing the
results of the Impact Assessment, and the other to export the input data for further
elaboration that can be done off-line.
•
Paragraph 3.9 describes the procedure of visualization of the results.
II.3.1
Set up procedure for Windows and MAC and open
sorces operating systems
The electronic toolkit named “MIREIA eI2-IAF Toolkit” is available in stand-alone executable
files for the most common operative systems , namely Windows, Mac and Linux.
The toolkit is built upon Apache Flex an open source application framework for traditional
browser and desktop applications as well as innovative mobile applications. Community,
documents and SDKs are available at the following web site (http://flex.apache.org/).
The toolkit is highly flexible in terms of scalability, it can be integrated with all major back
ends server including Java™, Spring, Hibernate, PHP, Ruby, .NET, Adobe ColdFusion®, using
industry standards such as REST, SOAP, JSON, JMS, and AMF, as well as development of addons functionalities with a user-oriented development workflow since the application
framework includes:
A large set of skinnable user-interface components with a component lifecycle.
A set of services (HTTP Service, Web Service, Remote Object).
Managers to handle: Styling, Skinning, Layout, Animation, Module-loading, User interaction
management.
The source code of “MIREIA eI2-IAF Toolkit” is available at the following FTP link: XXXXX
II.3.2
Input data management
Figure 6 shows the data entry system of MIREIA toolkit.
On top left you find the following functionalities:
“File”. That is the exit button.
“Evaluation Criteria”. That is the function which allows to modify the weighting system for the
three Evaluation Criteria (Efficiency, Effectiveness and Sustainability – see also Chapter II.2,
paragraph II.2.3) that are used to measure the impacts produced by intermediary’s projects. See
also next paragraph II.3.3 for the “Evaluation criteria weighting system” functionality.
“Data”. That is the function which allows to access to the MIREIA “databank” with all the impacts
indicators that can be used for measuring the interventions’ impacts. See next paragraph II.3.4 for
the “Databank updating” functionality. The Tool manages four databanks, one per each
dimension of specific impact.
/Users/…./library/Preference/Main/Local Store/mireia.db is the location of the MIREIA
databank in your computer.
The main menu of the MIREIA toolkit that is just below the link information of the
MIREIA databank location is constituted by the following functionalities:
“Job Placement”; “Networking”; “Skilling”; “Empowerment”. That are the data entry buttons
for the four “dimensions of specific impacts” (see also Chapter II.2) considered in MIREIA Impact
Measurement Model. See paragraph II.3.5 for the “Intervention’s input data management”
functionality.
“Results”. That is the button to launch the execution of the impact measurement once you have
imported in the tool all the interventions’ input data. See paragraph II.3.9 for the “Management
of results” functionality.
“Help”. This is the button for directly accessing to this manual in html format.
To insert a intervention in the Tool dataset you have to select one of the specific
dimensions of impact that are present in the main menu.
If it is the first time that you select the dimension of specific impact, the “interventionbudget” table is empty, otherwise it will contain all the interventions that you have
previously considered for the impact measurement.
At this point to create the new dataset for the Impact measurement you have to use the
functions “Insert” and “Delete” that are present below the main menu. In particular:
“Insert”. It allows to open a pop-up where you can specify the following three
information related to the intervention, which are all of them mandatory to add
the intervention in the dataset for a new Impact Measurement. They are:
“Intervention”. You have to specify the alphanumeric string that
constitutes the intervention name. The Tool doesn’t make any limitation to
the intervention name.
“Acronym”. It is another alphanumeric string. It allows the user to identify
the intervention results that will be elaborated by the Tool. Also in these
the Tool doesn’t foresee any limitation in the definition of the
intervention’s Acronym.
“Budget”. It is a numeric string that represents the economic resources
allocated to the intervention for its development. The Tool doesn’t allow to
include any character that it is not numeric, however it doesn’t make any
control on the currency used. Therefore it is suggested that you pay
attention to use the same currency for all the interventions that you want
to consider in the Impact Measurement session you run.
When you have completed the editing of the intervention’s data, you have to click
“ok” to confirm the data entry and the Tool records the information in the
interventions’ datasets for future elaboration. In this case the intervention’s data
will appear in the “intervention-budget” table at the bottom of the list of the
interventions inserted during the time. From that time you can start editing its
measurement impacts, just clicking on the intervention’s name.
If you want to modify the above data once inserted or for another Impact
Measurement run, you have to move the mouse of your computer on the
intervention name that you what to modify and select it. A “double click” allow
you to modify the intervention’s data in the “pop-up”.
“Delete”. It allows to cancel a intervention from the current session of Impact
Measurement. To this end you have to move the mouse of your computer on the
intervention name that you what to delete and select it. Once selected the “delete”
function remove the intervention’s data from the dataset of the current Impact
Measurement session.
Figure 6 - Screen shoot of MIREIA toolkit data entry system
budget” table there are the table related to the Evaluation
Next to the “intervention-budget”
Criteria. To add Impact Measurement indicators to new or existing interventions see
paragraph II.3.5.
II.3.3
Evaluation criteria weighting system management
Once you click the “Evaluation Criteria” button, the Tool shows a window like the one in
Figure 7 where for each “dimension of specific impact” is specified the relative
importance of the three Evaluation Criteria: Efficiency; Effectiveness; Sustainability.
Sustainabilit
Figure 7 - Screen Shoot of the evaluation criteria weighting system
If it is the first time that you use the tool,
tool the three Evaluation criteria of each
“dimension of specific impact” have the same relative importance, that is equal to
33,33%.
You can modify the relative importance of the evaluation criteria per each “dimension
of specific impact” as you prefer by changing
changing the numbers in the boxes as showed in
Figure 7, where for exemplificative purpose “Networking” and “Skilling” have a different
weighting system than the initial one. While weighting system related to “Job
Placement” is remained unchanged.
In case you want to exclude some “evaluation criteria” or one or more “dimensions
of specific impact” from the analysis, you have to place a “zero” value for that specific
measurement indicator or for the whole criterion of the “dimension of specific impact”
you want to not measure. In the example in the above figure “Empowerment” is the
“dimension of specific impact” that is excluded from the Impact Measurement session.
The MIREIA tool checks the consistency of the weighting system you choose by
summing up the value of the three criteria of each “dimension of specific impact”. If the
sum is not equal to 100 per each “dimension of specific impact” the MIREIA tool gives
you an advice and you cannot proceed to other operation before the correct values of
the weighting systems have not been acquired by the Tool.
II.3.4
Impact Indicators’ Databank management functionalities
One you click the “data” button you enter in the Tool Databank pop-up (see Figure 8). As
you can see from the figure, the Databank pop-up is divided in four Databanks
corresponding to the four “dimensions of specific impacts” of MIREIA Impact
Measurement Model (see Chapter II.2 and the IPTS report available at http://…).
Figure 8 - Screen Shoot of MIREIA Tool Databank
You have to select one of them and thus you can have access to the Databank of the
“dimension of specific impact” you chosen.
In each Databank the measurement indicators are grouped per “measurement criteria”,
thus you find three groups of indicators: “efficiency indicators”; “effectiveness
indicators”; “sustainability indicators”.
Per each group the MIREIA tool already proposes a set of measurement indicators that
you can use in the impact measurement of your interventions. However, you can also
add now indicators or remove the existing ones that as you wish.
The procedure for adding/removing indicators is the following:
1.
2.
3.
4.
Select the “data” button.
Select the Databank of “specific dimension of impact” you want to update.
Select the “measurement criterion” you want to update.
Use “insert” or “delete” button for modify the Databank. You can:
4.1
“insert” or “delete” classes of indicators underpinning the selected
“measurement criterion”. In this case you have to move the mouse of your
computer on the “measurement criterion” where you have to add a new class of
measurement indicator. If the criterion is selected is row become deep blue and
then you can move the mouse of your computer to the function “Insert”. A pop-up
will appear on the screen asking to insert the name of the new class of
measurement indicator. Or:
4.2
“Insert” or “Delete” measurement indicators inside one of the classes. In this
case you have to select the class with the mouse of your computer and the row will
become of deep blue. Then you can move the mouse to the function “Insert” to add
the new measurement indicator in the class.
In the Figure 9 is exemplified the screen shoot of the insertion of a new measurement
indicators belonging to a specific class (“intervention combining ICT training and Job
Placement Activity”) of the “efficiency criterion” related to “Job Placement” Databank”.
Figure 9 - “Pop-up” of the insertion of a new Measurement Indicator to be included in the
Databank
X
When you want to exit from the Databank you have to press this button that is at the
up-right side of the Databank pop-up..
II.3.5
Intervention’s input data management
When you select one of the “specific dimensions of impact” for the first time a
“interventions-budget” table appears on the screen (see also paragraph II.3.2).
On the right side of the “interventions-budget” table the Tool shows empty
“evaluation criteria” tables for the corresponding Evaluation Criteria of the selected
“dimension of specific impact” that is not placed equal to “zero” during the weighting
system management (see paragraph II.3.3).
If it is not the first time that you open the “specific dimension of impact”, the
“interventions-budget” table and the correspondent “evaluation criteria” table
contain all the interventions’ information you have already available in the tool’s dataset
(see as an example Figure 10). In particular to “Insert” or “Delete” interventions’
datasets see paragraph II.3.2.
Figure 10 , Screen Shoot of the interventions’ input data management of MIREIA Tool with
already available interventions’ datasets
II.3.6
Intervention Evaluation criteria data management
When you select a intervention in the “intervention-budget” table, the correspondent
“evaluation criteria” tables show the already measurement indicators and their values
that you have edited in previous run of MIREIA Tool.
In case of the new intervention the correspondent “evaluation criteria” tables are
empty.
At that point per each “evaluation criterion” you can “Select”, “Insert” and/or “Delete“
measurement indicators representing a measure of the impacts of the selected
intervention.
You can “Select” up to two “measurement indicators” corresponding to the specific
“evaluation criterion” which weight is different to “zero” in the “evaluation criteria
weighting system” (see paragraph II.3.3).
When you click “select measurement indicator” the Tool opens the correspondent
Databank and you can navigate in it until you find the desired indicator. You have to
click on the indicator to register it in the intervention’s dataset At the same time the
Tool opens a pop-up (see Figure 11) to allow you to enter the Impact measurement
Indicator’ measurement value (see also Chapter II.2, paragraph. II.2.4).
Figure 11 - Screen Shoot of the “evaluation criteria” table
The values required are the following:
Intervention’s baseline.. That is the impact value already achieved by the measurement
indicators before the intervention’s intervention.
Actual values of the intervention.
intervention. That is the value measured for a intervention’ s impact
indicator during an on-going
going measurement campaign or at the end of the intervention.
Intervention’s target.. That is the expected value of the intervention’s impact indicators
calculated during an ex-ante
ante evaluation.
Absolute target of the intervention.
intervention. That is the potential impact that the intervention’s
indicators
icators could achieve with unlimited resources allocated to the intervention.
All the data have to be in the same unit of measure and all of them have to include the
baseline value. e.g. if baseline is 200 persons already skilled on a total population of
influence
nfluence of the intermediary of 1000 and the training intervention is expected to train
300 individual in 3 years, and at the end of the first year of the intervention the trained
person are 100, we would insert the following data measuring the impact of the
t
efficiency indicator related to the person having completed the training course:
Intervention’s baseline:: 200 persons already skilled.
Actual values of the intervention.
intervention. 300 (200 baseline + 100 trained) skilled person after 1 year.
Intervention’s target.. 500 (300 baseline + 300 trained) skilled persons after 3 years.
Absolute target of the intervention:
intervention: 1000 persons that represent the total population potential
interested to the training course in the area of influence of the intermediary.
When you have completed the editing of the measurement indicator’s data, you have to
click “ok”” to confirm the data entry and the Tool records the information in
intervention’s datasets for Impact Measurement purpose. The measurement indicator’s
that has been selected appears in the “evaluation
“
criteria” table in correspondence to
the selected criterion together with its corresponding impact measures. From that time
you can start editing its measurement indicator, just clicking on the measurement
indicator’s name.
Once the measurement indicator is inserted and you have already specified its values,
you can:
“Delete” the measurement indicator. In this case you have to select the indicator that you want to
cancel and then click the button “Remove measurement indicators”.
“Modify” the measurement indicator. In this case you have to double click on the measurement
indicator’s name and the pop up with the measurement indicator’s data will appear. Once you
have completed the changes in the data, they will be registered by clicking “ok” on the data entry
pop up.
“Sort” the measurement indicators of one Evaluation Criterion. In this case you can move the
mouse of your computer on the heading of the table corresponding to the selected criterion. Than
you have to select which type of heading you want to sort and a small triangle will appear on the
right side of the it. Clicking on the small triangle you can produce a sort of the related
measurement indicator for the selected heading. You can “Sort” the Impact Measurement
indicator in relation to their name and the values of their impact values.
In case the indicator that you want to insert is not contained in the Databank you can
use the function “Insert” to add a new indicator. To this end you have to move the
mouse of the function “Select Measurement Indicator” and then click the function
“Insert” of the Databank’s pop-up. For the specificity of this function please refer to the
paragraph II.3.4.
Errors controlled by the Tool are:
The baseline value have to be lower or equal to all the other impact values considered for a given
“measurement indicator”.
The actual value of the intervention has to be higher or at least equal to the baseline. However it
should not be greater of both the target value and the Intervention’s target.
The intervention’s target value has to be higher or at least equal to actual value of the
intervention and it has not to overcome the absolute target.
Absolute target should be grater than all the other or at least equal to Intervention’s target.
II.3.7
Impact Measurement
management
Indicators’
weighting
system
Once all the interventions for all the “specific dimensions of impact” are edited in the
Tool together with their impact measurement values, you can click the “results” button.
In this case will appear a window like the one in Figure 8.
In the upper-left side you will continue to have the following three buttons:
“File” button for the exit from the Tool.
“Evaluation Criteria” button to modify the evaluation criteria weighting systems (see paragraph
II.3.2).
“Data” button for the Impact Measurement Indicators’ Databank (see paragraph II.3.4).
Just below there is the pathway specifying the location of “mireia.db”, and immediately
after there are the 6 buttons related to the main menu that are already described in the
paragraph II.3.2.
Figure 12 - Screen Shoot of the results’ window
Below the main menu’s buttons, a green line highlights 4 new buttons. They are related
to the weighting systems management of the impact measurement indicators selected
during the interventions data entry management (see paragraph II.3.5 and paragraph
3.6).
When you click one of the 4 green buttons a pop-up with a new window appears (see
Figure 13).
Figure 13 - Screen Shoot with the window of the measurement indicators’ weighting
systems for “Job Placement dimension of impact”
As you can see in the figure the weighting systems are three, one for each evaluation
criterion that can be used in this Impact Measurement process.
If it is the first time that you use the Tool each of the three weighting systems have
measurement indicators with the same relative importance (e.g. see the case of
“efficiency” criterion in the figure). In case you have already used the Tool it might be
that some or all the three weighting systems have different weighting structure (e.g. see
the case of “effectiveness” and “sustainability” criteria in the figure).
We suggest to adjust the weighting systems of all the “specific dimensions of impact”
before to click the “results” button placed in the lower menu (the one in the figure that
contains the “Results”; “Print”, “Export” functionalities).
You can modify the relative importance of the “measurement indicators”
underpinning each “evaluation criterion” of a given “dimension of specific impact” as
you prefer by changing the numbers in the boxes.
In case you want to exclude some “measurement indicators” from the impact
measurement, you have to place a “zero” value for that specific indicator you want not
to measure.
The MIREIA tool checks the consistency of the weighting system you choose by
summing up the value of the “measurement indicators” of each “evaluation criterion”. If
the sum is not equal to 100 the Tool gives you an advice and you cannot proceed to
other operation with the system before the correct value of the weighting system is not
been inserted.
When you have completed the editing of the weighting systems of a given “dimension of
specific impact”, you have to click “ok” to confirm the data entry and the Tool records
the information in its dataset for the current Impact Measurement.
II.3.8
Management of Results of the Impact Evaluation
Once you have completed the adjustment of the “measurement indicators” weighting
systems (see previous paragraph II.3.7), you can click the “Results” button just below
the green line of the four “indicator weight system” buttons.
Then the Tool provides Impact measurement results that you can watch on the screen
by clicking the “Results menu” just below the “Results” button (see paragraph II.3.9);
print the results or even export in excel file as described below in this paragraph.
Before to run the results the Tool make a consistency check to determine if the
Evaluation Criteria that are not placed to “zero” in the related weighting system have at
least one impact indicator that has been considered for the measurement. The Tool
identifies the lack of correspondence and raises a warning pop-up per each
misalignment. It also specifies which are the criteria that lack of measurement
indicators. However, this information is just a warning and if you decide to proceed with
the results, the Tool provided the required measurement of the impacts.
II.3.8.1 How to print the results
Once you have obtained the Impact measurement of the interventions under
assessment, you can choose the “Print” functionality by clicking on the corresponding
button (see Figure 14).
Figure 14 - Screen Shoot with the “Print” pop up
The Tool offers you the usual print option including the creation of a file in pdf
format that you can store in your computer. The pdf file is composed by 15 pages with
all the results that you can also see on the screen of your computer (see paragraph
II.3.9). Alternatively you can print the file on your printer.
II.3.8.2 How to export the output values for further elaboration
In case you want to produce your own elaboration with the Intervention’s output values,
the Tool allows you to export such data clicking on the “Export” button (see Figure 15).
The Intervention’s output values that you can export are (see Table 2):
Intervention name (see paragraph II.3.2).
Intervention acronym (see paragraph II.3.2).
Dimension of specific impact related to the intervention (see paragraph II.3.2).
Budget in € (see paragraph II.3.2).
Impact of the Intervention’s Baseline (in %) (see paragraph II.9.4).
∆ Impact of the Intervention in respect to the Intervention’s Actual Values (see paragraph II.9.4).
∆ Impact of the Intervention in respect to the Intervention’s Target Values (see paragraph II.9.4).
Impact of the Intervention in respect to the Intervention’s Target Values (see paragraph II.9.4).
The missing valued (in %) to reach the Impact of the Intervention’s Target Value (see paragraph
II.9.4).
Figure 15 – Screen shoot with the “Export” button
Table 2 - Example of excel file containing interventions’ impact values exported
II.3.9
Results overview
This paragraph describes the Impact measurement results that you can obtain, view on
the screen and print by clicking the 5 typologies of “results” buttons: “Ranking”;
Cumulated values”; “Cost-Impact rate”; ”Intervention impacts”; “Aggregated
impacts”.
II.3.9.1
Ranking
Figure 16 presents the format of the results of the intervention obtained clicking the
“Ranking” button. The scope of this measurement is to show on the screen the list of the
interventions ordered in decreasing order in relation to their “Impact calculated
on their Target Value”.. Once the results are shown you can “click” on the “column
headers” and produce another interventions’ sort.
You can make a new sort in relation to:
Intervention name.
Intervention acronym.
Intervention’s dimension of specific impact.
Intervention’s Budget (in €).
Intervention’s impact calculated
calcu
on the Intervention Target Values.
Intervention’s impact calculated of the Baseline.
Intervention’s impact calculated on the Intervention Actual Values.
All this data are also available for being exported in Excel (see paragraph II.3.8.2).
Figure 16- Example of Interventions Ranking
II.3.9.2
Cumulated value
Figure 17 presents the numeric format of the results of the intervention obtained clicking
the “Cumulated values”” button. The scope of this function is to show on the screen the
cumulated impacts of the interventionss under impact assessment in relation to
the “Impact calculated on their Target Value”. Once the results are shown you can
click on the “column headers” and produce another ordering of the interventions.
You can make a new sort in relation to:
Intervention name.
Intervention acronym.
Intervention’s dimension of specific impact.
Intervention’s Budget (in €).
Intervention Budget (in €/1000).
Intervention’s impact based on Intervention’s Target Values ordered in decreasing order.
Cumulated value of the Intervention’s impact based on Intervention’s Target Values. Per each
intervention the value is obtained by summing up its impact value and the cumulated valued of
those interventions that are placed in an upper position in the
the rank based on Impact of the
Intervention ‘s Target Values ordered in decreasing order.
Correspondent cumulated budget (in €/1000).
The same information is also provided in graphical format as shown in Figure 17.
Figure 17 - Example of Interventions’ cumulated values (numeric view)
Figure 18 - Example of Interventions’ cumulated curve (graphic view)
II.3.9.3
Cost-Impact
Impact rate
Figure 19 presents the numeric format of the results of the intervention obtained clicking
“Cost-impact rate”” button. The scope is to show on the screen which is the best
performing intervention in relation to the rate between allocated costs and generated
impacts. The “Cost-impact
impact rate”
rate of the interventionss under impact assessment is
calculated in relation to the “Impact based on their Intervention’s
Intervention Target Impact
Value”.. Once the results are shown you can click on the “column headers” and produce
another ordering of the interventions.
You can make a new sort in relation to:
Intervention name.
Intervention acronym.
Intervention’s dimension of specific impact.
Intervention’s Budget (in €).
Intervention’s impact based on Intervention Target impact’s Values multiplied by an impact factor
equal to 1000.
The “Cost-Impact
Impact rate” values ordered in increasing order.
The same information is also provided in graphical format as shown in Figure 20.
Figure 19 - Example of Interventions’ Cost-Impacts
Cost
rate (numeric view)
Figure 20 - Example of Interventions’ Cost-Impacts
Cost Impacts rate (graphical view)
II.3.9.4
Interventions’
s’ Impacts
Figure 21 presents the numeric format of the results of the intervention obtained clicking
the “impact”” button. The scope is to show on the screen which are the intervention’s
impacts (actual and target)
t) in relation to intervention’s
’s baseline. Once the results
are shown you can click on the “column headers” and produce another ordering of the
interventions.
You can make a new sort in relation to:
Intervention name.
Intervention acronym.
Intervention’s dimension
imension of specific impact.
Impact of the Intervention’s Baseline (in %).
∆ Impact of the Intervention in respect to the Impact of the Intervention’s Actual Values. In this
view the Impact of the Intervention is obtained as difference of the overall impact
impa due to the
Actual Intervention’s Impact Values and the Impact of the Intervention’s Baseline (in %).
∆ Impact of the Intervention in respect to the Impact of the Intervention’s Target Values. In this
view the Impact of the Intervention is obtained as difference
difference of the overall impact due to the
Impact of the Intervention’s Target Values and the sum of Impact of the Intervention’s Baseline
with the Impact Value obtained in the previous bullet point (in %).
Impact of the Intervention in respect to the Impact
Impact of Intervention’s Target Values. In this view
the Impact includes the impact of the Intervention’s baseline (in %).
The missing value (in %) to reach the Impact of the Intervention’s Target Value. It is calculated as:
1-(actual
(actual value+baseline)/target value.
va
The same information is also provided in graphical format as shown in Figure 22, Figure
23, Figure 24.
Figure 21 - Example of Interventions’ impacts (numeric view)
Figure 22 - Example of Interventions’ impacts for “Job-placement”
“Job placement” dimension of impact
(graphical view)
Figure 23 - Example of Interventions’ impacts for “Networking” dimension of impact
(graphical view)
Figure 24 - Example of Interventions’ impacts for “Skilling” dimension of impact
(graphical view)
II.3.9.5
Aggregated Impacts
Figure 25 presents the numeric format of the results of the interventions’
intervention “Aggregated
Impacts”. The scope is to show on the screen which are the contribution of each
“dimension of specific impact” to the achievements of the objectives for which the
interventions have been implemented.
implemented
Once the results are shown you can “click” on the “column headers” and produce
another ordering of the interventions.
intervention
You can make a new sort in relation to:
Name of the specific dimension of impact.
Specific dimension of impacts’ budget (in €/1000).
Expected Aggregated Impact of each Specific dimension of impact. (in %)
Actual Aggregated Impact of each Specific dimension of impact
impa (in %).
Baseline of each Specific dimension of impact (in %)
Specific dimension of impacts’ budget (in €/1000).
The same information is also provided in graphical format as shown in Figure 26.
Figure 25 - Example of Interventions’ aggregated impacts (numeric view)
Figure 26 - Example of Interventions’ aggregated impacts (graphical view)