1
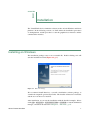
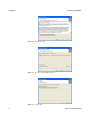
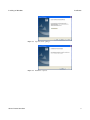
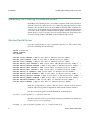
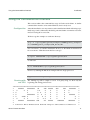
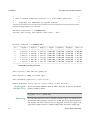
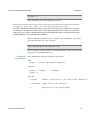
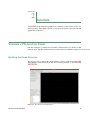
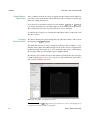
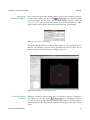
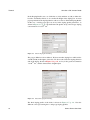
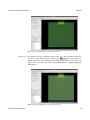
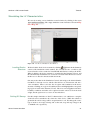
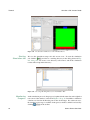
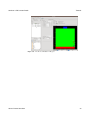
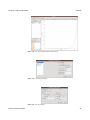
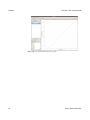
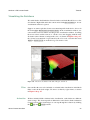
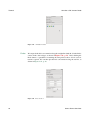
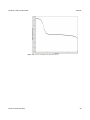
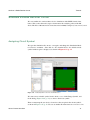
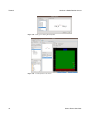
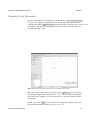
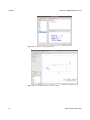
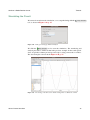
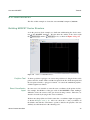
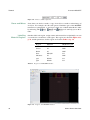
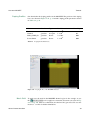
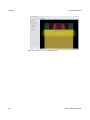
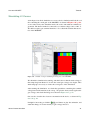
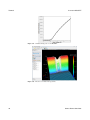
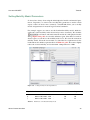
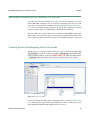
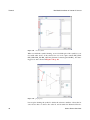
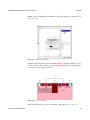
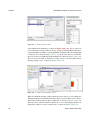
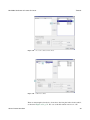
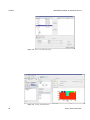
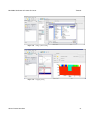
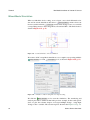
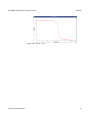
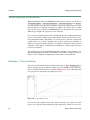
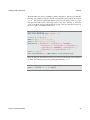
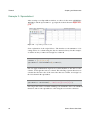
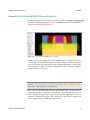
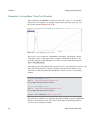
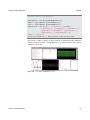
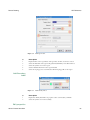
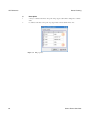
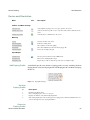
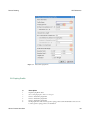
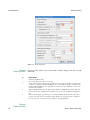
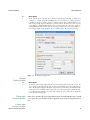
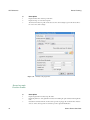
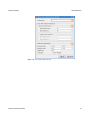
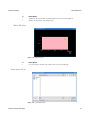
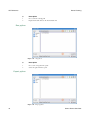
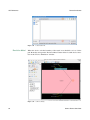
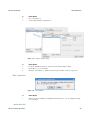
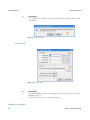
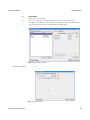
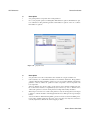
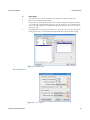
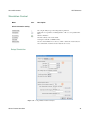
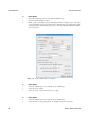
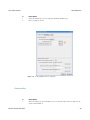
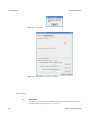
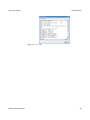
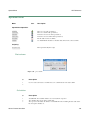
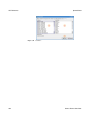
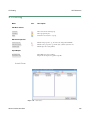
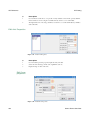
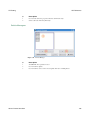
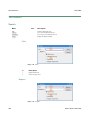
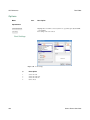
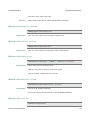
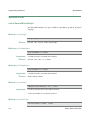
A 0.18um MOSFET
Tutorials
Simulating I-V Curves
As in the previous diode simulation, we create a device simulation and load the.tif
file containing the mesh grid of the MOSFET. As shown in Figure 2.36, p. 41,
we are in the steady-state simulation mode, the source and substrate terminals are
grounded. The drain terminal is connected to a constant voltage source of 0.1 V.
We shall sweep the gate terminal from 0 to 2 V to obtain the transfer characteristics of the MOSFET.
Figure 2.36 Simulation setup for calculating the Id-Vg curve of the MOSFET.
We submit the simulation for running, and shall observe that the drain voltage is
first ramped up from 0 to0.1 V, before the actual gate voltage scan begins. This
drain ramp-up is necessary to ensure the convergence of the simulation.
After running the simulation, we obtain the spreadsheet containing the terminal
voltage/current information in the sweep. We plot the drain current against the
gate voltage, and obtain the Id-Vg curve shown in Figure 2.37, p. 42.
One can also visualize the electron concentration in the device, as shown in Figure 2.38, p. 42.
It might be interesting to click the
Play tool-button to play the animation, and
watch the change of electron density as gate voltage increases.
Genius Device Simulator
41