1
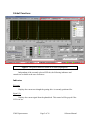
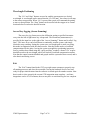
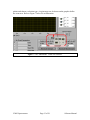
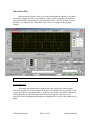
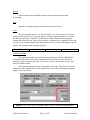
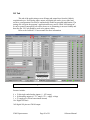
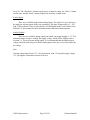
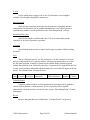
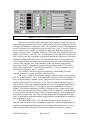
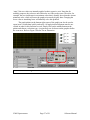
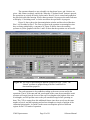
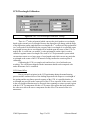
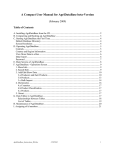
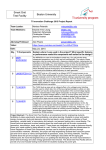
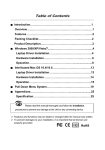
VM92 VUV Spectrometer Software Manual
Prepared by Mike Taras
www.resonance.on.ca
Table of Contents
Installation & Requirements ............................................................. 1
Overview .............................................................................................. 2
Stepper Motor Drive System .......................................................................... 2
Gear Lash & Positioning Accuracy ................................................................ 2
Photodiode Vs. CCD Mode ............................................................................ 3
Photodiode Input Gain .................................................................................... 3
Settings File (Settings.ini) ............................................................................... 4
Error Log ......................................................................................................... 4
Global Functions ................................................................................. 5
Indicators......................................................................................................... 5
Stepper Zeroing ............................................................................................... 6
Wavelength Positioning .................................................................................. 7
Arrow Key Jogging (Arrow Scanning) ........................................................... 7
Exit .................................................................................................................. 7
Photodiode Mode ................................................................................ 8
Photodiode Tab ............................................................................................... 8
Time Series Tab ............................................................................................ 14
Chart Recorder Tab ....................................................................................... 17
I/O Tab .......................................................................................................... 20
LabJack DB25 Pin Diagram ......................................................................... 21
CCD Mode ......................................................................................... 23
CCD Tab ....................................................................................................... 23
Data Manipulation ............................................................................ 28
Settings Tab ....................................................................................... 30
Spectrometer Wavelength Calibration .......................................................... 31
Conversions Section...................................................................................... 32
CCD Wavelength Calibration ....................................................................... 33
Photodiode Acquisition Settings ................................................................... 34
Various Settings ............................................................................................ 34
Installation & Requirements
TheVM92 software can be installed on any PC running Windows XP, Vista, or 7
in both 32-bit and 64-bit modes. The only driver required is also compatible with all these
systems, and automatically detects the correct driver to install when launched. The
software has very minimal requirements and can run on netbooks, laptops, and desktops
with processors > 1 GHz. More than 2 GB of RAM is recommended if the software is to
log data for a long time, on the order of days, otherwise any amount of memory will do as
long as it is greater than 512 MB. In order to successfully install the VM92 software,
locate the installation package (found on the Resonance website,
http://www.resonance.on.ca/), “unzip” it if necessary, and follow these steps:
1. Make sure all USB cables are unplugged from the USB port of the computer you
are installing the software on.
2. Install the virtual COM port driver by running the “FTDI Setup.exe” file and
following its instructions.
3. Install theVM92 software by running the “setup.exe” package that came with the
installation package. You should notice that shortcuts have been added to the
desktop and start menu. Do not start the software at this time.
4. Plug the USB cables of the CCD, stepper drive, and LabJack into USB ports on
the PC. Windows will find the hardware and look for a suitable driver. If it asks to
look online, tell it not to. Windows will scan its driver directories, and
automatically find and install the driver which was placed by the executable run
in step 2.
5. Restart your computer before attempting to launch the VM92 software.
VM92 Spectrometer
Page 1 of 36
Software Manual
Overview
The software written for the VM200 VUV Spectrometer is a complete control
application combining wavelength scanning, time series recording, chart recording
functions, digital I/O control, data manipulation, and file saving. There are two choices
for the detector; a photodiode or a CCD - which allows for two main modes of operation.
The software is designed to offer the user a complex set of functions without the complex
graphical user interface. The various functions are organized into their own respective
tabs, grouped with their supporting options and controls. In this way, the various
functions can be cycled through simply by selecting the desired tab. The software is
interlocked to prevent the user from erroneously changing parameters or causing conflicts
with the control motors while certain functions are active. For example, the system
cannot be moved to a certain wavelength until it has been “zeroed”, to ensure the stepper
motor will not drive the diffraction grating into a hard stop.
Stepper Motor Drive System
The system uses a very precise stepper motor to control the angle of the
diffraction grating of the spectrometer. The motor is driven by a microprocessor in the
electronics case which communicates via serial commands with the software. The
software therefore needs to have the correct COM port selected to interface with the
stepper driver. COM ports are automatically searched on startup, and unless the
instrument wasn’t found the user does not need to manually select it. The software
controls the stepper motor by commanding discrete numbers of steps to occur for the
various scanning operations and wavelength positioning. There are 3rd-order polynomial
wavelength calibration coefficients which are used to produce a relationship between the
step position and wavelength of the system. In this way the steps will be transparent to
the user, who will always be dealing with wavelength, but to understand the operating
principles of some of the commands explained later in the manual this background
information is necessary.
Gear Lash & Positioning Accuracy
The diffraction grating drive stepper motor is very precise; however it is geared
and therefore incurs a certain amount of mechanical “lash” that is present when changing
directions. In order to prevent this “lash” from affecting wavelength positioning, the drive
will always arrive at its intended position from the same direction only. Going from a
shorter wavelength to a longer wavelength is the preferred direction. That is, if the drive
is stepped from 200nm to 300nm, it will arrive at its location and there will be no lash. If
the opposite is performed – the drive stepped from 300nm to 200nm – the motor will
change directions and some lash will be encountered. In this case the software
automatically steps below the intended wavelength by a certain amount, and then steps
VM92 Spectrometer
Page 2 of 36
Software Manual
back up to arrive from the “positive” direction. In this way the mechanical lash is taken
up and accurate wavelength positioning can be expected.
Photodiode Vs. CCD Mode
Upon initialization of the software, the user is prompted to select the detector used
for the session (photodiode or CCD). Once a selection has been made functions, tabs, and
controls relevant to the other detector will be grayed out. Furthermore, the mode of
operation cannot be changed during the current session, and therefore the executable
must be exited and restarted if another detector is to be chosen.
The photodiode is a single-element detector which outputs a voltage proportional
to the incident intensity of light. Its signal is read using a LabJack U12 analog-to-digital
converter in differential mode, which allows for a programmable gain to better utilize the
available 12 bits of resolution. Being a single element, only one wavelength at a time can
be measured and therefore positioning accuracy directly depends on the grating drive’s
accuracy.
The CCD detector is a 1 x 2048 pixel array which allows an entire spectrum to be
acquired and displayed without moving the diffraction grating. The span is approximately
70 nm, but if repeatable results are an absolute must there is no better alternative than a
fixed hardware setup such as this. The grating can of course be moved to different
wavelengths so the CCD can display different regions of the full capable spectrum of the
spectrometer. These different regions can even be stitched together as one continuous
spectrum using the software’s multiple graphing abilities, where up to 4 plots can be
graphed at once.
Photodiode Input Gain
The input signal for the photodiode (BNC connector) is a differential voltage
reading connected to the programmable instrument amplifier of the analog-to-digital
converter inside the LabJack case. This allows the user to select various gains. The gains
are listed in the chart below, and can be selected in the “Settings” tab.
Gain
1
2
4
5
8
10
16
20
Signal Range (V)
+/- 20
+/- 10
+/- 5
+/- 4
+/- 2.5
+/- 2
+/- 1.25
+/- 1
Figure 1: The various gains and paired voltage ranges available for the signal input.
VM92 Spectrometer
Page 3 of 36
Software Manual
Settings File (Settings.ini)
The software uses a single settings file to store important parameters. The file is
found in the program’s root directory (which changes depending on your operating
system but for Windows XP by default is C:\Program Files\VM200\) and is named
“Settings.ini“. It can be edited in notepad (simply by double-clicking) and the various
parameters directly changed. In the program’s graphical user interface (GUI), the tab
called “Settings” allows the user to edit and save all the program’s parameters without
manually opening the INI file.
Whenever the settings file is written to from within the “Settings” tab of the GUI,
a backup copy is placed in the program’s \data directory and given a date and time stamp.
The \data directory is a folder named “data” contained in the path to the program
executable (by default C:\Program Files\VM200\data\). If for any reason the existing (or
missing!) settings file needs to be corrected, replaced, or if the user needs to revert to
older settings one of the files found in the \data folder can be opened in notepad and its
values copied to the active “Settings.ini” file. Alternatively, one of the backup files can
simply be renamed to “Settings.ini” and copied to the program’s root directory,
overwriting the existing file.
Error Log
The program’s error log can be found in the “Settings” tab. When errors occur
during the operation of the software, they are reported and appear with a timestamp in the
error log. The log is also written to a text file, stored in the program’s data directory (the
same folder the executable resides, as explained above), in a folder called “data”. When
errors occur they are automatically appended to the error log text file. There can only be
1 error log file per day, and each file is given a file name with a time stamp. This is to
prevent the log from reaching an unmanageable length if they fill with too many errors
over time. Typical errors have to do with serial handshaking and transmission. Do not be
alarmed if errors appear in this section. The software is designed to respond to errors and
keep any operations active. Unless the program becomes unresponsive or behaves
erratically the error log can usually be ignored, otherwise it becomes an invaluable
debugging tool.
VM92 Spectrometer
Page 4 of 36
Software Manual
Global Functions
Figure 2: The global controls available at all times (highlighted).
Independent of the currently selected GUI tab, the following indicators and
controls are available to the user at all times:
Indicators
WL (nm)
Displays the current wavelength the grating drive is currently positioned for.
Signal (V)
Displays the current signal from the photodiode. This control will be grayed if the
CCD is in use.
VM92 Spectrometer
Page 5 of 36
Software Manual
CCD Timer
Displays the amount of time remaining before the next CCD acquisition (and
screen refresh) is due, based upon the selected integration time and number of averages.
This control will be grayed if the photodiode is in use.
Status:
Displays useful information while the software performs various operations. For
example, it will indicate if the system is zeroing, if the CCD is running, if an “exit”
command has been given etc.
LEDs
The software interfaces with 3 main hardware systems: the stepper
microprocessor, the data acquisition board (LabJack), and the CCD camera. Each of these
systems has their own indicator LEDs on the front panel which gives the user a
convenient and quick way of determining if they are functioning properly. Note that
systems not in use will appear as grayed.
Figure 3: The 3 hardware indicator LEDs.
The “Stepper” LED is lit when a valid serial handshake has been made to the
microprocessor driving the stepper motors. The “Photodiode” LED is lit when
communication has been established with the LabJack board and valid data has been
processed. Finally, the “CCD” LED is lit when valid pixel data has been processed.
Depending on the mode of operation, the relevant LEDs should all appear green after
successful initialization, which occurs automatically.
Stepper Zeroing
Before any functions or operations can be carried out, the spectrometer must first
be zeroed. The user will find that all other buttons are grayed out until zeroing has been
completed. Invoking this function asks the stepper motor to search for a limit switch in
order to calibrate itself to a known position. The location of the switch is defined as the 0
step position, which is converted to a wavelength according to the 3rd order polynomial.
The wavelength at the zero position will be negative to indicate the grating is actually
rotated below 0th order.
VM92 Spectrometer
Page 6 of 36
Software Manual
Wavelength Positioning
The “Go” and “Stop” buttons are used to send the spectrometer to a desired
wavelength. A wavelength can be entered into the “Go WL (nm)” box where it will snap
to the nearest step position. When “Go” is pressed the system will command the grating
to move to that position. The “Stop” button can be used to halt the stepper at its current
location before it reaches the desired location.
Arrow Key Jogging (Arrow Scanning)
The arrow key jog feature moves the diffraction grating a specified increment
every time the left or right arrow key is depressed. The increment (in nanometres) is
specified by the input box to the right of the “Arrow Scanning?” button and is called “Jog
(nm)”. The arrow keys can be held down to continually scan the system, and simply
released to stop scanning. Setting the system on a wavelength peak is made easy using
this mode in conjunction with the chart recorder. Note that in this mode, no backlash
compensation will take place, leaving the system susceptible to positioning inaccuracy.
Once a peak has been found using this “quick and dirty” method, a formal “Go” request
should be made to the wavelength, which will include a backlash compensation routine.
Note that the control remains disabled and grayed until the system has been zeroed, and is
also deactivated during a scan.
Exit
The “Exit” button found in the GUI’s top-right corner attempts to properly stop
all running processes and close the executable, leaving the hardware devices in a state
ready for proper initialization when the software is started again for another session. Note
that in order to close properly the current CCD integration must complete – and since
integrations can be 10’s of minutes, the user may have to wait that long for it to complete.
VM92 Spectrometer
Page 7 of 36
Software Manual
Photodiode Mode
If the user selects the photodiode as the detector after being prompted at program
initialization, the software will run in “photodiode mode”. This means the CCD tab will
be grayed out, and all functions pertaining to the CCD will be disabled. This leaves the
user access to the “Time Series”, “Chart Recorder”, and “I/O” tabs (“Settings” is always
available). Each of these tabs will be explained below.
Photodiode Tab
From this tab the spectrometer can be positioned to any precise wavelength, or
also scanned from a fixed starting wavelength to a fixed ending wavelength. The
photodiode signal is plotted on the graph.
Figure 4: The “Photodiode” tab.
VM92 Spectrometer
Page 8 of 36
Software Manual
Scan Minimum
This parameter sets the minimum wavelength the system will start at when
performing a scan.
Scan Maximum
This parameter sets the maximum wavelength the system will end at when
performing a scan.
*Note that to produce scans that are an even number of resolution increments, the
minimum and maximum wavelength values will snap to the nearest step increment.
Speed (nm/s)
The scan speed is controlled essentially by changing the number of steps the
grating increments per loop of the control software. That is, the time between each step is
not uniform. The time between a groups of steps, is uniform. The “Speed” control
presents the user with the option of how many steps are in a group, in the units of nm/s.
The higher the value, the more steps are in a group and therefore the faster the instrument
will scan.
Resolution
The resolution is closely related to the Speed. It displays the minimum increment
of travel of the diffraction grating at the selected Speed in the units of nanometre (nm).
Start Scan
Initiates a scan using the currently entered parameters of Scan Minimum, Scan
Maximum, Speed, and Resolution as explained above.
Stop Scan
Will stop a scan in progress and record the end wavelength as the wavelength the
scan indeed stopped at, and not the intended maximum wavelength which was never
reached.
Add Comment?
During a scan the user can input comments that are written to an array attached to
the scan data. When the scan is saved to file, a column is dedicated to any comments that
were entered while the scan was running. Once a comment has been written, the “Add
Comment?” button un-clicks. To write the same comment for every consecutive
increment use the “Latch” button. When “Latch” is selected, the comment button will not
VM92 Spectrometer
Page 9 of 36
Software Manual
unclick until “Latch” is un-clicked. This is useful for indicating certain periods of data
over many increments of a scan.
Save
The save function writes a .csv file renamed to a .xls file extension so it opens
natively in Microsoft Excel. A pop-up window will appear prompting the user to enter
the file name and path. A header is written which contains all the pertinent program
settings that affect the scan, followed by the data. A comment box is supplied for the user
to enter in any pertinent information about the data to be saved, and will appear in the file
header. The column format is displayed below:
Wavelength (nm)
Signal (V)
Signal Averaged
Step Positions
Comments
Calculate Result
Launches another window in which mathematical operations can be applied to
various plots to generate a result spectrum. The new spectrum will be graphed
automatically when the window is closed. See the section “Data Manipulation” for more
information.
Revert
Restores the plots that were visible before “Calculate Result” was pressed.
Cursors
Cursors can be added or removed and told to snap to a plot or to be freely
movable. The X and Y columns indicate the position of the cursor and can also be edited
to place the cursor at an exact location. A context menu allowing the user to change
cursor attributes such as point style, colour, and X/Y scales can be accessed by rightclicking in the cursor window (Figure 5 below).
VM92 Spectrometer
Page 10 of 36
Software Manual
Figure 5: The “Photodiode” tab cursor controls.
Graphing Controls
The software is tailored for repeating scans and therefore allows the user to plot
up to 4 scans on the same graph, as well as a “Result” plot, which is explained later in the
section “Data Manipulation”.
Figure 6: The “Photodiode” graphing controls.
VM92 Spectrometer
Page 11 of 36
Software Manual
The area is structured around 4 static plots, each assigned a colour. Note that the
colour and other parameters such as line width and point style can be changed by directly
clicking on the black box with the plot colour icon; to produce a menu. Each plot displays
a scan, as denoted in the scan box directly to its right, in the “Scan #” column. Whenever
the user initiates a scan, even if it is stopped, the application holds it in memory and
assigns it an index, from 1 to infinity. Therefore, if 100 scans were performed, Plot 1 can
display a scan from 1 to 100. The “Vis?” column directly to the right selects whether the
plot is visible or not. By clicking the round green button the user can choose which plots
to display (and therefore which scans). The “Scan Parameters” to the right of the “Vis?”
column displays the parameters associated with a given scan, selectable by the vertical
“radio selection” box. These parameter fields will show the values for the selected plot. If
the 3rd radio button is selected, the parameters for the 3rd plot will be shown, and
remember, the 3rd plot is not necessarily the 3rd scan, it is whatever scan is selected in the
respective “Scan #” column.
The “Auto ++” column, when checked, will automatically increment the scan
number box to its immediate left after a scan has been completed. This will bump out the
previous scan and increment to the next. When all boxes are checked, it will make sure
only the 4 latest scans are always shown. Deselecting a box will mean that unless the user
changes it manually, performing a new scan will never increment the scan assigned to its
respective plot. This is very useful to designate a certain plot to hold a reference scan.
The “Avg?” column selects whether to apply a running average to the respective
plot. The sample length, or “Avgs” as denoted in the software, is how many samples are
to be averaged together to produce a point. This parameter can only be an odd integer,
and the software will filter even entries. A side effect of a typical running average is a
shift in data by ½ the sample length rounded down. That is, if a peak was displayed on a
graph and a running average of 11 was applied, the peak would shift to the right by 5
samples. The software compensates for this by deleting the first 5 points on the graph.
This is the reason only odd numbers are permitted. The user should be aware that during
a scan, if the plot is being averaged, no data will appear until there are more data points
than half the average value, since they are being chopped off the beginning of the data
array. It could appear as though nothing is happening until enough points are acquired to
have something to graph.
The bottom right of the “Photodiode” tab allows the user to set the autoscale or
manually applied limits for the wavelength and signal axes. When in manual mode, the
limits can be changed using the increment arrows on the controls themselves or a new
value can be typed in. When focus is lost from the control (preferably by pressing
“enter”) the new values are instantly applied to their respective axis. Note that for
usability purposes, the values are not checked to see if they make sense. Therefore, for
example, the user could enter in a maximum value that is actually lower than the current
minimum value, which will cause the graph to incorrectly display data. Changing the
lower value to something lower will naturally solve this problem.
The graph palette (at the bottom right corner of the graph) can also be used to
zoom in on a section data quickly and easily. All apply/autoscale buttons must be unclicked in order for this function to work. Simply click on the middle button on the
VM92 Spectrometer
Page 12 of 36
Software Manual
palette and choose a selection type. A region may now be drawn on the graph to define
the zoom area. Refer to Figure 7 below for an illustration.
Figure 7: The “Photodiode” zoom area controls.
VM92 Spectrometer
Page 13 of 36
Software Manual
Time Series Tab
In this mode the system can be set to record the photodiode signal at a set sample
rate and wavelength over time. It is similar to a chart recorder, but handy for situations
where little chunks of data need to be recorded and saved as “official” records. Overall
this tab is very similar to the “Photodiode” tab, with a few changes to the graphing
controls.
Figure 8: The “Time Series” tab.
Sample Rate (ms)
The sample rate controls the acquisition rate, and is specified in milliseconds
(ms). Note that there is no lower limit to the sample rate and therefore it is possible to use
a value the software loop cannot achieve. In this case the sample rate will be at the mercy
of the application speed (somewhat related to the host computer’s processor) and
therefore will be asynchronous and unknown. Anything below 30 ms will probably be too
quick.
VM92 Spectrometer
Page 14 of 36
Software Manual
Record
Starts recording the photodiode signal at the specified sample rate and
wavelength.
Stop
Stops the recording in progress and denotes the end of a scan.
Save
The save function writes a .csv file renamed to a .xls file extension so it opens
natively in Microsoft Excel. A pop-up window will appear prompting the user to enter
the file name and path. A header is written which contains all the pertinent program
settings that affect the scan, followed by the data. A comment box is supplied for the user
to enter in any pertinent information about the data to be saved, and will appear in the file
header. The column format is displayed below:
Elapsed Time (min)
Signal (V)
Signal Averaged
Comments
Graphing Controls
The graphing controls are exactly the same as those used for the “Photodiode”
tab, and therefore that section of the manual should be referenced. Instead of being
labeled as scans, the data acquired in “Time Series” mode is with respect to time, and
therefore called records.
One important change from the “Photodiode” tab to the “Time Series” tab is the
addition of some controls in the bottom-right corner which affect the manually applied
graph x-axis (time) limits.
Figure 9: The “Time Series” graphing controls with x-axis modifiers highlighted.
VM92 Spectrometer
Page 15 of 36
Software Manual
Auto Max
The “Auto Max” button will continually set the time axis limit to the total elapsed
time, so the graph will always show the most recent information. Note that this will only
take effect if “Apply Time Scale” is enabled.
Recent
This toggle, in conjunction with the input box “Mins” will set the time axis lower
limit to a value such that only the recent x minutes of data will be displayed, where x is
the time in minutes entered in “Mins”. Note that this will only take effect if “Apply Time
Scale” is enabled.
VM92 Spectrometer
Page 16 of 36
Software Manual
Chart Recorder Tab
The “Chart Recorder” mode is always functioning, and is meant to aid the user in
wavelength positioning and also to log data in a given session in one graph. It acquires a
signal reading at a rate specified by the “Update Interval”. It is recommended that this
interval kept above 500 ms since all data is stored in memory, and after an hour of usage
the program may slow down if the graph is not cleared.
Annotations are used to show events, and whenever a scan or record is made in
the “Photodiode” or “Time Series” tabs the start and end of the scan is annotated directly
onto the graphed chart recorder data. The user can also add annotations at any time using
the “Add Comment” button.
Figure 10: The “Chart Recorder” tab.
Update Interval (ms)
This specifies the length of time between signal acquisitions, in milliseconds
(ms).
VM92 Spectrometer
Page 17 of 36
Software Manual
Add Comment?
The user can add comments to the chart record data. When the record is saved to
file, a column is dedicated to any comments that were entered during the recording. Once
a comment has been written, the “Add Comment?” button un-clicks. To write the same
comment for every consecutive increment use the “Latch” button. When “Latch” is
selected, the comment button will not unclick until “Latch” is un-clicked. This is useful
for indicating certain periods of data over many increments of a scan.
The colour of comments can be changed by clicking the box to the left of the
“Colour” label, and will only affect future comments. All comments can also be shown or
hidden by using the “Visible?” button.
Clear Graph
This flushes the saved chart recorder data held in memory and will reset the
recorder to start over. All annotations will also be cleared. This function may have to be
performed if the application has been open for hours or if the update interval is set to be
low such that large amounts of data accumulates in memory, which could slow down the
application.
Average?
Like all the other tabs, this function applies a running average to all the plotted
data on the chart recorder graph. The “Samples” as denoted in the software is how many
data points are to be averaged together to produce an averaged point. This parameter can
only be an odd integer, and the software will filter even entries. A side effect of a typical
running average is a shift in data by ½ the sample length rounded down. That is, if a peak
was displayed on a graph and a running average of 11 was applied, the peak would shift
to the right by 5 samples. The software compensates for this by deleting the first 5 points
on the graph. This is the reason only odd numbers are permitted. The user should be
aware that during a scan, if the plot is being averaged, no data will appear until there are
more data points than half the average value, since they are being chopped off the
beginning of the data array. It could appear as though nothing is happening until enough
points are acquired to have something to graph.
Save
The save function writes a .csv file renamed to a .xls file extension so it opens
natively in Microsoft Excel. The user has the option of saving all or a selection of data. If
“Selection” is chosen, the user must enter a minimum (starting) and maximum (ending)
time to define the region of data to be saved. A pop-up window will appear prompting the
user to enter the file name and path. A header is written which contains all the pertinent
program settings that affect the scan, followed by the data. A comment box is supplied
for the user to enter in any pertinent information about the data to be saved, and will
appear in the file header.
VM92 Spectrometer
Page 18 of 36
Software Manual
The column format is displayed below:
Time Elapsed Time (min)
Signal (V)
Signal Avgd Wavelength (nm)
Comments
Graphing Controls
The graphing controls are exactly the same as those used in the “Photodiode” and
“Time Series” tabs, and therefore either of those sections of the manual should be
referenced.
One important addition (also present in the “Time Series” tab) is the addition of
some controls in the bottom-right corner which affect the manually applied graph x-axis
(time) limits.
Figure 11: The “Chart Recorder” graphing controls with x-axis modifiers highlighted.
Auto
The “Auto Max” button will continually set the time axis limit to the total elapsed
time, so the graph will always show the most recent information. Note that this will only
take effect if “Apply Time Scale” is enabled.
Recent
This toggle, in conjunction with the input box “Mins” will set the time axis lower
limit to a value such that only the recent x minutes of data will be displayed, where x is
the time in minutes entered in “Mins”. Note that this will only take effect if “Apply Time
Scale” is enabled.
VM92 Spectrometer
Page 19 of 36
Software Manual
I/O Tab
This tab of the application governs all input and output lines from the LabJack
acquisition device. Each analog input, output, and digital pin can be given a label and
saved to a configuration file which is automatically loaded on program initialization. The
settings file is kept in the program’s application directory and is called “IO Settings.ini”.
It can be opened in notepad to edit values, however its formatting is not user friendly and
therefore the “I/O” tab should be used as its primary editor.
Refer to the LabJack U12 user manual for more information.
Figure 12: The “I/O” tab.
Features include:
4 x 12-bit single-ended analog inputs (+/- 10V range)
2 x 10-bit analog outputs (0 – 5V range) *5V = supply voltage
1 x 5V supply pin (500 mA maximum current)
16 x Digital I/O lines:
*All digital I/O pins are CMOS output.
VM92 Spectrometer
Page 20 of 36
Software Manual
*Ports IO0 - IO3:
*Ports D0 – D12:
*Ports D13 - D15:
TTL Input, Short-Circuit & Overvoltage Protected
TTL Input, No Protection
Schmitt Trigger Input, No Protection
LabJack DB25 Pin Diagram
The following displays the assignment of each of the 25 pins for the DB25 case
connector:
Figure 13: The LabJack DB25 connector pin diagram.
Pin
1
2
3
4
5
6
7
8
9
10
11
12
13
Assignment
Digital IO: D0
Digital IO: D1
Digital IO: D2
Digital IO: D3
Digital IO: D4
Digital IO: D5
Digital IO: D6
Digital IO: D7
No Connection
+5 V
+5 V
+5 V
+5 V
Pin
14
15
16
17
18
19
20
21
22
23
24
25
Assignment
GND
GND
GND
GND
Digital IO: D8
Digital IO: D9
Digital IO: D10
Digital IO: D11
Digital IO: D12
Digital IO: D13
Digital IO: D14
Digital IO: D15
Figure 14: The LabJack DB25 connector pin assignments.
Digital I/O
The digital I/O lines are fully controllable; the direction can be changed to either
input (read) or output (write). In output (write) mode, the pins can be set high (5 V) or
VM92 Spectrometer
Page 21 of 36
Software Manual
low (0 V). The “Direction” column sets the pin as an input or output, the “Write” column
sets the state, and the “Read” column displays the state only in input mode.
Analog Inputs
There are 8 available single-ended analog inputs. The signal wire goes directly to
the input pin, and the ground to the case ground pin. The input voltage range is +/- 10V
with 12-bit resolution. These 8 inputs become 4 if differential mode is used. Refer to the
LabJack U12 user manual for more information about differential measurements.
Analog Outputs
There are two available analog output pins which can supply roughly 0 – 5V. The
maximum output voltage is actually the supply voltage, which will be slightly more or
less than 5 V. For an accurate analog output, it is recommended that the analog output
voltage should be read using an available analog input so the user can exactly control the
set voltage.
Note:
*Analog output ranges from 0-5 V, 10-bit resolution, with 5 V being the supply voltage.
*5 V pin supplies a maximum current of 500 mA
VM92 Spectrometer
Page 22 of 36
Software Manual
CCD Mode
This mode employs the CCD as the detector for the spectrometer. The tab is
structured similarly to the “Photodiode” and “Time Series” tabs. The wavelength
scanning / recording functions are replaced with store / subtract dark functions, and the xaxis can be toggled to display pixel number or wavelength.
CCD Tab
Figure 15: The “CCD” tab.
Store Dark
Stores the latest spectrum in memory. This spectrum can be subtracted from any
future or stored spectra by toggling the “Subtract Dark” button.
Subtract Dark
Subtracts the saved “dark” spectrum from a stored or realtime (current) spectrum.
The button affects all graphed spectra simultaneously.
VM92 Spectrometer
Page 23 of 36
Software Manual
X Axis
Selects which units to apply to the x-axis. Pixel number or wavelength is
available. Wavelength is displayed in nanometres.
Store Spectrum
Stores the latest spectrum in memory for the purposes of graphing and data
manipulation. Stored spectra can be graphed simultaneously over current spectra or
operated on to produce a result spectrum (see the “Data Manipulation” section).
Integration Time (ms)
Specifies the length, in milliseconds, the CCD waits until reading out the
intensities of its pixels to produce a spectrum.
Averages
Specifies how many spectra to acquire and average to produce a final resulting
spectrum.
Save
The save function writes a .csv file renamed to a .xls file extension so it opens
natively in Microsoft Excel. A pop-up window will appear prompting the user to enter
the file name and path. A header is written which contains all the pertinent program
settings that affect the scan, followed by the data. A comment box is supplied for the user
to enter in any pertinent information about the data to be saved, and will appear in the file
header. The column format is displayed below:
WL Intensity Intensity Intensity (Dark
(nm) (Counts) Averaged Subtracted)
Avg Intensity
(Dark Subtracted)
Pixel
Dark
Number (Counts)
Calculate Result
Launches another window in which mathematical operations can be applied to
various plots to generate a result spectrum. The new spectrum will be graphed
automatically when the window is closed. See the section “Data Manipulation” for more
information.
Revert
Restores the plots that were visible before “Calculate Result” was pressed.
VM92 Spectrometer
Page 24 of 36
Software Manual
Cursors
Cursors can be added or removed and told to snap to a plot or to be freely
movable. The X and Y columns indicate the position of the cursor and can also be edited
to place the cursor at an exact location. A context menu allowing the user to change
cursor attributes such as point style, colour, and X/Y scales can be accessed by rightclicking in the cursor window (Figure 16 below).
Figure 16: The “CCD” tab cursor controls.
Graphing Controls
The software is tailored for repeating scans and therefore allows the user to plot
up to 4 scans on the same graph, as well as a “Result” plot, which is explained later in the
section “Data Manipulation”.
VM92 Spectrometer
Page 25 of 36
Software Manual
Figure 17: The “CCD” tab graphing controls.
The area is structured around 4 static plots, each assigned a colour. Note that the
colour and other parameters such as line width and point style can be changed by directly
clicking on the black box with the plot colour icon; to produce a menu. Each plot displays
a scan, as denoted in the scan box directly to its right, in the “Spec. #” column. Whenever
the user initiates a scan, even if it is stopped, the application holds it in memory and
assigns it an index, from 1 to infinity. Therefore, if 100 scans were performed, Plot 1 can
display a scan from 1 to 100. The “Vis?” column directly to the right selects whether the
plot is visible or not. By clicking the round green button the user can choose which plots
to display (and therefore which scans). The “Spectrum Parameters” to the right of the
“Vis?” column displays the parameters associated with a given scan, selectable by the
vertical “radio selection” box. These parameter fields will show the values for the
selected plot. If the 3rd radio button is selected, the parameters for the 3rd plot will be
shown, and remember, the 3rd plot is not necessarily the 3rd scan, it is whatever scan is
selected in the respective “Spec. #” column.
The “Realtime” check box toggles whether plot 1 should display the latest
acquired spectrum or a stored spectrum of specified index.
The “Avg?” column selects whether to apply a running average to the respective
plot. The sample length, or “Avgs” as denoted in the software, is how many samples are
to be averaged together to produce a point. This parameter can only be an odd integer,
and the software will filter even entries. A side effect of a typical running average is a
shift in data by ½ the sample length rounded down. That is, if a peak was displayed on a
graph and a running average of 11 was applied, the peak would shift to the right by 5
samples. The software compensates for this by deleting the first 5 points on the graph.
This is the reason only odd numbers are permitted. The user should be aware that during
a scan, if the plot is being averaged, no data will appear until there are more data points
than half the average value, since they are being chopped off the beginning of the data
array. It could appear as though nothing is happening until enough points are acquired to
have something to graph.
The bottom right of the “CCD” tab allows the user to set the autoscale or
manually applied limits for the wavelength and signal axes. When in manual mode, the
limits can be changed using the increment arrows on the controls themselves or a new
value can be typed in. When focus is lost from the control (preferably by pressing
VM92 Spectrometer
Page 26 of 36
Software Manual
“enter”) the new values are instantly applied to their respective axis. Note that for
usability purposes, the values are not checked to see if they make sense. Therefore, for
example, the user could enter in a maximum value that is actually lower than the current
minimum value, which will cause the graph to incorrectly display data. Changing the
lower value to something lower will naturally solve this problem.
The graph palette (at the bottom right corner of the graph) can also be used to
zoom in on a section data quickly and easily. All apply/autoscale buttons must be unclicked in order for this function to work. Simply click on the middle button on the
palette and choose a selection type. A region may now be drawn on the graph to define
the zoom area. Refer to Figure 18 below for an illustration.
Figure 18: The “CCD” zoom area controls.
VM92 Spectrometer
Page 27 of 36
Software Manual
Data Manipulation
One feature of the software is the ability to apply mathematical operations to 1 or
more plots to produce a “result” spectrum. This function allows the user to perform
mathematical operations on any of the 4 displayed plots. All 4 plots can be involved in
the operation, or just 1 or more plots with or without constants. The calculation follows
the mathematical order of operations, respecting the parentheses around the values.
To access this function, “Calculate Result” needs to be pressed on the
“Photodiode” or “CCD” tabs. A separate window will pop up asking the user for the
parameters of the operation.
Figure 19: The “Data Manipulation” pop-up window invoked by pressing
“Calculate Result” on the “Photodiode” or “CCD” tabs.
There are two list boxes that hold savable constants in case the user needs to add,
subtract, multiply, or divide by the same number from session to session. The list boxes
can be edited by triple-clicking the values and typing a new number. Pressing the “Save”
buttons beneath them will write the constants to files in the application root directory
called “constant1.txt” and “constant2.txt”. These are simple text files which can be
manually edited if needed. The sliding switch to the right of each box allows the user to
use a value from the list box or a manually entered temporary constant above.
VM92 Spectrometer
Page 28 of 36
Software Manual
The operators themselves are selectable via drop-down boxes, and 4 choices are
given: add, subtract, multiply, and divide. When the “Calculate Result” button is pressed,
the operations are carried out on the 4 plots and a “Result” plot is created and graphed on
the tab which called the function. When a data operation is in progress the status indicator
will display “Calculating result” to let the user know the operation is in progress.
Figure 19 above shows the data manipulation window and the selected function:
Plot 1 is to be added to Plot 2. The First two plots in the equation are meaningless since
they are being multiplied by a constant of 0. Figure 20 below shows the resulting
spectrum in yellow graphed with Plot 1 and 2 to show that the operation was successful.
Figure 20: The result of performing an addition operation of Plot1 + Plot2. The
“Result” spectrum is graphed along with Plot 1 and Plot2 for
demonstration purposes.
The result spectrum is also padded according to the source scans used in the
operations. That is, if the start and end wavelengths of the scans do not match the result
spectrum will range from the lowest of the scan wavelengths to the highest of the scan
wavelengths, and will pad the scans so they all match this range before operating on
them. The CCD is exempt from this additional feature since there are always the same
number of pixels, and the beginning and end wavelengths are simply a function of the
calibration polynomials. It wouldn’t make sense to manipulate spectra of different
regions for the CCD mode of operation.
VM92 Spectrometer
Page 29 of 36
Software Manual
Settings Tab
This section of the application allows the user to modify some very important
parameters essential to the proper operation of the instrument. Each setting will be
explained below.
Figure 21: The “Settings” tab.
Save Settings
Saves all entered parameters in this tab to an “.INI” file in the application’s root
directory. See the “Overview” section at the beginning of this manual for more
information.
Find Instrument
This is where the stepper COM port is selected if the program could not find it
automatically. When the software is started, it pings all available COM ports to identify
the control electronics box. If nothing is found, the “Find Instrument” button becomes
available after a dialogue notifies the user. The user should ensure the USB connection
from the computer to the electronics case is properly mated and click “Find Instrument”
again. If the COM port of the device is known, but the software still cannot find it, the
VM92 Spectrometer
Page 30 of 36
Software Manual
user can manually select the COM port using the drop-down box and try to zero the
device. If the electronics case is connected and the software still cannot find it, try
disconnecting the USB connection, closing the software, plugging the USB back in, and
re-loading the software.
Error Log
As can be seen from Figure 21 above, the error log contains information about an
error that occurred during operation of the instrument. In this case, the error was caused
by a physical interruption of the USB cable from the instrument’s stepper control
electronics to the laptop computer running the software. The error window allows the
user to scroll through past messages which are all time stamped. Refer to the “Error Log”
section under the “Overview” heading for more information about where the logs are
automatically saved.
Spectrometer Wavelength Calibration
Figure 22: The “Spectrometer Wavelength Calibration” settings.
This section contains the 3rd order polynomial coefficients used to convert the step
position of the diffraction grating drive motor to wavelength, in nanometres. Whenever
the coefficients are changed a “Zero” routine must be performed. The software locks out
all controls until zeroing has been completed.
The calibration coefficients are calculated from 3 wavelengths and 3
respective step positions. During calibration, the user would scan until a known peak is
found. The actual wavelength of the (hence “known”) peak would be entered as one of
the three calibration wavelengths. The step position reported at the peak is then entered to
pair the two values together. This is repeated for two more wavelengths and then
coefficients can be generated and applied. Utilization of the “Conversions” section of the
“Settings” tab is needed for this part (found directly after this section). Use cursors to
obtain the exact x-value (wavelength) of the peak in question. Enter it into the
VM92 Spectrometer
Page 31 of 36
Software Manual
“Conversions” section of the “Settings” tab, and press “Convert” to obtain a step
position, and then copy it into the “Step @ λ” box.
Alternatively, the “Grab” buttons can be used to facilitate this process. These
buttons will take the wavelength value of a selected cursor (from the “Grab Cursor” dropdown box) convert it to a step position, and automatically copy this value to the “Step @
λ“ box. In order to calibrate, then, the user simply has to choose 3 known wavelengths,
position 3 cursors at each peak corresponding to the wavelengths, and press grab for each
wavelength making sure to select the right cursor between each “grab”.
Calculate
This button takes the entered 3 wavelengths and 3 step positions and calculates 3
coefficients. These coefficients are held in the column directly to the right of the 3
wavelengths and step positions box. Make sure to zero after the coefficients are changed!
Conversions Section
This section is meant to be an aid for the wavelength calibration section, and
allows the user to convert step positions to wavelengths, and vice versa.
Figure 23: The “Conversions” section of the “Settings” tab.
Convert
This button, as explained above, will take a wavelength or step position and
convert it to its complement using the active coefficients entered in the far-right column
of the “Spectrometer Wavelength Calibration” section of the “Settings” tab.
VM92 Spectrometer
Page 32 of 36
Software Manual
CCD Wavelength Calibration
Figure 24: The “CCD Wavelength Calibration” settings.
There is a 3rd-order polynomial which converts the pixel number to wavelength,
based on the currently set wavelength. Because the dispersion will change with the angle
of the diffraction grating (and therefore wavelength) the 1st coefficient of this polynomial
(ax Coeff) needs to be modified by the current (centre) wavelength. It is called the centre
wavelength because the set wavelength will be incident upon the centre of the CCD. To
modify this 1st coefficient, yet another 3rd order polynomial (on the right) is used to
calibrate it against centre wavelength. The result is a CCD-spectrometer system which
can remain accurate over a large range of wavelengths, and which can set any particular
wavelength to the centre of the CCD instead of being confined to certain regions of
calibration.
Calibrating the CCD is a complex task and involves a lot of trial-and-error
tweaking. The coefficients shipped with the instrument should not be tampered with
unless Resonance Ltd. is consulted.
CCD Centre Offset
Due to potential variations in the CCD positioning during the manufacturing
process and the combined effect of the shifting dispersion with respect to wavelength of
the grating and the non-linear spectral response of the CCD, it is possible that the set
wavelength may not fall on the centre pixel of the CCD as expected. If this occurs, a shift
in the wavelength calibration may be observed when scanning to various spectral regions
with the CCD. To compensate for this a CCD centre offset option has been included in
the software to allow the user to compensate for this effect. The entered offset is in
nanometres.
VM92 Spectrometer
Page 33 of 36
Software Manual
Photodiode Acquisition Settings
Figure 25: The “Photodiode Acquisition” settings.
This section allows the user to select the acquisition channel and gain of the
LabJack acquisition device to which the photodiode signal line is connected. Note that
the built-in BNC connector on the LabJack is connected to AI0 only, so the default “0-1
Diff” setting is recommended. The gain for the chosen channel can also be selected here.
The user should choose a signal range that corresponds with the expected maximum
signal levels to get the most out of the available 12-bit resolution. Note that the gain only
applies to differentially wired inputs.
Various Settings
Figure 26: The “Various Settings” section of the “Settings” tab.
Hard Limit Min
This is the absolute minimum offset, in steps, from the zero position the stepper
motor is allowed to go. After the zero routine the stepper motor goes to a park position
somewhere above the limit switch. During normal operation it is not only impractical to
operate the grating drive close to the limit switch for optical reasons (since it is in a
negative order anyways) but also for mechanical reasons. The limit switch is close to the
hard stop and telling the motor to step in this region risks bumping the grating drive into
the hard stop. The value has been set at Resonance Ltd. to a default of 500 steps.
VM92 Spectrometer
Page 34 of 36
Software Manual
Anything below less than this number risks potentially running the grating into a hard
stop. When a wavelength is entered for the beginning, end, or “Go” location, this limit
determines the minimum wavelength it snaps to.
Hard Limit Max
This is the absolute offset, in steps, from the zero position the stepper motor is
allowed to go. This is set as a filter to prevent the grating drive motor from driving it into
a hard stop. It has been set at Resonance Ltd. to a default value of 20,000. Anything
greater than this number risks potentially running the grating into a hard stop. When a
wavelength is entered for the beginning, end, or “Go” location, this limit determines the
maximum wavelength it snaps to.
Backlash
The stepper motors used, as explained in the “Overview” section at the beginning,
incur a certain amount of mechanical “lash” when changing direction due to their
gearing. The software ensures the lash is taken up by always arriving at a position from
the same direction. The “Backlash” parameter is the number of steps to go below a
wavelength when scanning from a longer wavelength to a shorter wavelength, before it
steps back up to the intended wavelength. If there appears to be some repeatability issues
with wavelength positioning a greater backlash value can be used. The default set at
Resonance Ltd. and tested to be sufficient is 5000 steps.
Start Scans From “Hard Limit Min”?
This toggle overrides the backlash setting, and applies the maximum amount of
backlash possible at the start of every scan or “Go” command. This option is meant to
provide the greatest repeatability by forcing the drive system to start from the same
position every time a new position or scan is requested.
Step Period (ms)
This parameter controls the rate at which the application sends serial commands
to the microprocessor controlling the stepper grating drive motor. A value as short as
possible will result in the fastest scan rates, however a value too low will result in missed
serial transmissions and therefore uneven step rates. The default value set at Resonance
Ltd. was set to 100 ms. It was observed that 50 ms could potentially work, however this
was cutting it close and some serial commands were not sent to the control case properly,
which caused pauses while scanning. A longer value could be used to perform a scan that
must be extremely uniform, and a longer value would allow the stepper motor and
mechanical drive to “settle” before a reading is taken.
VM92 Spectrometer
Page 35 of 36
Software Manual
Measured Step Period (ms)
Useful while setting the “Step Period” parameter, this value is the actual
measured time the application took from one loop to the next. If the measured step period
is greater than the set step period, the application is being asked to execute faster than it is
able to, and therefore may drop some serial transmission commands, which will delay the
stepper motor from time to time. This value should always be equal to the set step period,
and indicates proper operation.
VM92 Spectrometer
Page 36 of 36
Software Manual