1
Module
11
Module Subject:
Geographic Information
Systems (GIS) for Planning
Deutsche Gesellschaft
fϋr Internationale
Zusammernarbeít (GIZ) GmbH
Copyright © 2013 Deutsche Gesellschaft fϋr Internationale Zusammernarbeít (GIZ) GmbH.
Published by
Deutsche Gesellschaft
fϋr Internationale
Zusammernarbeít (GIZ) GmbH
9/F PDCP Bank Centre, cor. V. A. Rufino and L.P. Leviste Sts.
Salcedo Village, Makati City, Metro Manila, PHILIPPINES
Telephone: +63 02 812-3165 loc 17
Website: http://www.giz.de
CITATION: GIZ (2013). SIMPLE Trainers Toolkit. Module 11: Geographic Information System.
Deutsche Gesellschaft fϋr Internationale Zusammernarbeít (GIZ) GmbH.
GIS Tailor-made Inc.
Ubo Pakes
Antonio Yap
530 Holy Name Street
Mabolo, Cebu City
www.GIS-TM.com
Module Subject:
Geographic Information Systems (GIS) for Planning
Module Contents
Module 11
Geographic Information System (GIS) in the Context of
SIMPLE
11.1
Module Overview
Objectives
Duration
Scope and Coverage
Training Methods
Resources Needed
References
Activity Flow
11.1
Understanding GIS And Its Role in Land Use and Development
Planning
11.3
Session Overview
Objectives
Content and Activity Plan
11.2
What is Geographic Information System (GIS)?
Session Overview
Objectives
Content and Activity Plan
11.7
11.3
Introduction to Manifold System
Session Overview
Objectives
Content and Activity Plan
11.37
Data Entry
Session Overview
Objectives
Content and Activity Plan
11.63
Editing
Session Overview
Objectives
Content and Activity Plan
11.115
Analysis
Session Overview
Objectives
Content and Activity Plan
11.141
11.4
11.5
11.6
11.7
Map Design
Session Overview
Objectives
Content and Activity Plan
11.169
New Developments
Session Overview
Objectives
Content and Activity Plan
11.198
11.8
Lecture Points
11.2.1:
11.2.2:
11.2.3:
11.2.4:
11.2.5:
11.2.6:
11.2.7:
What is GIS?
Elements of GIS
GIS as a Tool
Confusion
GIS software
How GIS works
The Connection Between Map and Database
11.3.1:
11.3.2:
11.3.3:
11.3.4:
Installing Manifold System GIS
The User Interface
Adding Data into Manifold System
Create Overlays of Components (Images,
Drawings)
11.4.1:
11.4.2:
11.4.3:
11.4.4:
11.4.5:
What is GPS?
Importing GPS Data Into Manifold System
Coordinate Reference Systems
Map Georegistration
Data sources in the Philippines
11.5.1: Editing of Maps
11.5.2: Merging Map Layers
11.5.3: Creating New symbols
11.6.1:
11.6.2:
11.6.3:
11.6.4:
11.6.5:
Description
Advanced Selection: Using SQL
Analysis Using the Transformation Toolbar
Preparation of a Barangay Base Map
Analytical Maps
11.7.1:
11.7.2:
11.7.3:
11.7.4:
Formatting Drawings
Preparing a Layout in Manifold System
Creating a layout
Preparing for a Large Scale Print
11.8.1: New Developments in GNSS
11.8.2: Depth Sounders and Coastal Zone Mapping
11.8.3:
11.8.4:
11.8.5:
11.8.6:
11.8.7:
Tools for Participatory Data Collection
Open Street Map Philippines
Data collection using Android devices
Open Data Kit
Provincial Map Viewer
MODULE GUIDE
Module 11
Geographic Information System (GIS) in the
Context of SIMPLE
OVERVIEW
Land use and development planning plays a critical role in the development and
implementation of Sustainable Integrated Management and Planning of Local Government
Ecosystems (SIMPLE). From the creation and establishment of the Trainer Pool up to the
management and implementation of the zoning ordinance and annual investment plan and
budget, physical and development planning figures prominently from both ends of the
planning and management spectrum, clearly indicating the importance of this tool in the
context of the local planning and development process. The formation of the provincial
trainer pool for instance involves the enhancement of knowledge and skills of selected key
individuals and even institutions in the areas of land and water use and development
planning, including such cross cutting issues as climate change, protected area
management, conflicts, and disaster risks, to name a few. This intends to build up
capacities of the trainer pool as a technical service provider for municipalities and cities
relative to the implementation of the SIMPLE planning framework.
Undertaking a land use and development planning initiative requires however an intensive
use of Geographic Information System (GIS) as a tool for processing varied forms of spatial
and planning information. While SIMPLE heavily employs participatory approaches and
processes in most stages of the planning framework, it still depends on computer-based
information system to be able to gather, process, and analyse information more
efficiently for local decision making. With GIS, key stakeholders and development actors
are provided with strategic and issue-focused information that could facilitate productive
discussion and generate informed decision.
OBJECTIVES
At the end of this module, the participants shall be able to:
i.
Understand and further appreciate SIMPLE as an integrated ecosystem and
management framework designed to help local government units manage effectively
their entire territory;
ii.
Highlight the importance of the use of Geographic Information System (GIS) as a tool
for informed decision making; and
iii.
Identify and appreciate the importance of GIS as a tool relative to the implementation
of SIMPE at varied phases and levels of planning scales.
DURATION
At most, two (2) hours.
CONTENT AND ACTIVITY
PLAN
Topics
to be covered:
SIMPLE as a planning and management framework
GIS as a tool for decision making
Importance of GIS relative to the implementation of SIMPLE
Procedure:
i.
Prepare and present a PowerPoint which provides a detailed but succinct description
of SIMPLE as a planning and management framework. It has to be emphasized that
some of the participants to the training are most likely technical personnel who have
limited exposure to the field of physical and development planning. It therefore
follows that care must be taken in the preparation of the PowerPoint presentation and
even during lecture discussion that concepts and principles are explained in a way
that can easily appreciated by the participants;
ii.
This is to be followed by an introduction on Geographic Information System (GIS) and
its role in facilitating the process of land and water use planning and development;
iii.
A video presentation may follow demonstrating the use of GIS in physical and
development planning;
iv.
Finally, PowerPoint slides will be presented situating the role of GIS in the entire
SIMPLE framework and explaining the types of information that can be processed and
generated using GIS.
SUGGESTED METHODOLOGY
PowerPoint Presentation; Video Presentation.
Lecture-Discussion method
RESOURCES NEEDED
Laptop computer, LCD projector and screen
Videos on GIS and its sample applications
Hand-outs and photocopies of printed materials and documents
REFERENCES
Deutsche Gesellschaft fur Internationale Zusammenarbeit (GIZ).2010.Sustainable Integrated
Management and Planning for Local Government Ecosystems (SIMPLE). Facilitators
Guidebook.Manila.GIZ
Housing and Land Use Regulatory Board.2007.CLUP GIS Guidebook. A Guide to
Comprehensive Land Use Data Management. Quezon City. HLURB
Lange, Andreas, C.Astilla, D. Nuevas, M. Moyano.2012. SIMPLE. Sustainable Integrated
Management and Planning for Local Government Ecosystem. Manila. GIZ
11.2
SESSION GUIDE:
Module 11
Session 11.1
Understanding GIS and Its Role in Land
Use and Development Planning
OVERVIEW
The increasing use and application of Geographic Information Systems (GIS) in the field of
Land Use and Development Planning emanates from the need to have better and more
reliable information for informed decision-making. Planning, in whatever form, scale, and
dimension undertaken, requires a significant amount of data and information to support the
analysis of the existing situation, formulate development goals, objectives and targets, and
identify, evaluate, and select spatial strategies. In addition, land use and development
planning also covers other critical aspects aside from the usual plan formulation/making,
and these include general development administration and development control and
management. These aspects of physical and development planning requires a specific
mechanism that would allow for the effective processing, analysis, and visual presentation
of information to facilitate active discussions with stakeholders and guide officials in making
policy decisions. These mechanisms fall within the ambit of GIS. GIS is considered as one of
those formalized computer based information systems that has the inherent capability to
process a multitude of data from various sources in order to provide strategic information
for decision-making.
OBJECTIVES
By the end of this session, the participants shall be able to:
i.
ii.
iii.
iv.
v.
Understand the rationale and the objectives of undertaking land use and development
planning by the local government units;
Appreciate the history of the development of GIS and its close relationship with
physical and development planning;
Take cognizance of the use of GIS as a support system for land use and development
planning; and
Recognize the many dimensions, functions, scales, sectors, and stages of land use and
development planning and the role that GIS plays in each of these aspects;
have insight in the role of maps in planning
DURATION
At most, two (2) hours.
11.3
CONTENT AND ACTIVITY
PLAN
Topics to be covered:
i.
ii.
iii.
Nature, rationale, and basis of land use and development planning
Use and functions of GIS in support of land use and development planning; and
Role of GIS in the different dimensions and functions of land use and development
planning.
Procedure:
i.
Prepare PowerPoint presentation providing a brief and basic information on the basis
of land use and development planning. Information may be culled from the 1991
Local Government Code including an elaboration of the dual role of LGUs as a body
politic and body corporate. From these information, one can easily generate the
primary goals and objectives of land use and development planning;
Discuss GIS and its contribution to the development of the physical and development
planning field. Describe the practice of planning prior to the onset of computer-based
information system, particularly the use of paper maps in depicting base and
thematic maps for land use planning. Explain also the process of land use and
suitability analysis using the hand drawn map overlay technique and how the process
has evolved into a computer-based geographic information system;
Present and explain the different functions and technical contributions of GIS in local
development planning. These include spatial tool-box for physical planning and
database management. GIS as a spatial tool box provides planners and local technical
staff to undertake spatial analysis functions such as map overlay analysis,
connectivity, and buffer. Database management function allows for the storage of
spatial and attribute data and links these two vital information sources using georelational models;
The final part of the presentation centers on the role of GIS vis-à-vis dimensions and
functions of land use and development planning. GIS and its various functionalities
are relevant not only in terms of its contribution to the formulation of the plan itself
but also in the areas of general development administration and development
control. Examples include management of land use records, building permit
application, land use monitoring, locational clearance application, land availability,
etc.
ii.
iii.
iv.
SUGGESTED METHODOLOGY
PowerPoint Presentation
Lecture-Discussion
RESOURCES NEEDED
Laptop/desktop computer, LCD projector and screen;
Hand-outs and photocopies of printed materials and documents.
11.4
REFERENCES
Housing and Land Use Regulatory Board.2007.CLUP GIS Guidebook. A Guide to Comprehensive
Land Use Data Management. Quezon City.
Yeh, Anthony GarOn.2008.GIS as a Planning Support System for the Planning of Harmonious
Cities. Nairobi, Kenya.UN Habitat.
Chang, Kang-Tsung (2006) - Introduction to Geographic Information Systems, McGraw-Hill
Higher Education
Demers, Michael M.(2009) - GIS for dummies
ESRI Inc. (1997) - Understanding GIS: The ARC/INFO Method, Version 7.1 for UNIX and
Windows NT, Environmental Systems Research Institute
Sutton, T., O. Dassau, M. Sutton (2009) - A Gentle Introduction to GIS, Chief Directorate:
Spatial Planning & Information, Department of Land Affairs, Eastern Cape, South
Africa. (Downloadable from QGIS.org)
Galido-Isorena, Trina (2009) -Mapping Guidebook 1: Guidelines in Preparing and Analyzing
Maps for Forest Land Use Plan. Published with assistance from the American people
through the U.S. Agency for International Development’s (USAID) Philippine
Environmental Governance (EcoGov) project.
Wikipedia – Geographic Information System
http://en.wikipedia.org/wiki/Geographic_information_system
11.5
11.6
SESSION GUIDE:
Module 11
Session 11.2
What is Geographic Information System (GIS)?
OVERVIEW
This Session will give you a theoretical background of GIS and therefore you may call this
“GIS minus the computer”. This background will help you in better understanding the
concepts of GIS and by that you will be able to use the system to it full capacities. Since
you will not be using the computer for now, there will be no difficulty as in having to know
and remember specific commands and instructions from the software.
There will be exercises that will focus on the core principles of GIS that when taken apart
and discussed one by one, are actually not that complex. If you have an understanding of
these principles then it will be easier for you to design your own GIS analysis and know
what you can do, and what you cannot do with your data.
This Session will start with a short introduction on what GIS is and will continue with the
different elements of GIS.
OBJECTIVES
At the end of the session, the participants are able to:
1. describe a GIS in conceptual terms and can define the different elements of GIS;
2. describe the difference between confusing terms such as GIS, GPS, CAD and RS;
3. draw insight in the most important data types in GIS;
4.
obtain insight in some of the most used GIS packages;
5. gain insight in possible uses of GIS in LGU’s worldwide;
6. know how a GIS works through the layer model,
7. describe the most important data types of GIS data, raster, vector, surface image
8. know the difference between geographic and attribute data and have knowledge on
the importance of the connection between these
CONTENT AND ACTIVITY
PLAN
1. Introduction: Getting to know each other
2. Expectations
3. Movie
4. Topics for discussion:
What is GIS?
11.7
Elements of GIS
GIS as a Tool
Confusion
GIS software
How GIS works
The Connection between map and Database
Summary
5. Wrap-up and Synthesis
11.8
LECTURE POINTS:
Module 11
Session 11.2.1
What is GIS?
What is GIS?
GIS stands for Geographic Information System or a program
that can combine a variety of mapping and editing functions
together with database capability. Although for many
people, GIS appears to be new, GIS has been around for
about thirty years, but only recently have GIS applications
appeared on desktop machines. Manifold® System was
deliberately created to focus exclusively on Wintel (Windows
– Intel) PCs and laptops, to leverage mass-market standards
like Microsoft scripting languages and Windows interfaces,
and to attack sleepy traditional markets with a mix of very
high performance and very low cost.
A GIS can be seen as a word processor for maps in the same
way you can use Microsoft Office Word to create elaborate
text documents. In both cases, you can create new items,
you can edit existing items, and you can import items
already created from other documents. A GIS allows us to:
Import existing maps from many different file
formats.
Create new maps, and edit existing maps. This
includes adding new items to a blank map, or to
change the shape and position of items already in the
map or delete items from a map.
Change the appearance of items in a map by changing
their formatting.
You can also do more with GIS such as:
You can specify the geographic location of the map
and the items in it.
Link the items in the map to a database table. This
allows the graphics in the map to act like visual
"handles" to reach into the database.
Process the data and visual items in a map to create
new items or to analyse the data. For example, you
might create a "buffer zone" that shows all regions
within 100 meters of a road or stream, or you might
automatically add up populations of a given species
of tree within a set of tree stands in a forestry
application.
Because you can link the items on the map to the database,
you can create intelligent maps and have them positioned at
the exact right location of the earth. For example, you can
imagine that you have a map with streets which is linked to
a database which has for each street a record in a database
table that would have fields storing the name of the street,
11.9
when it was last paved, what paving material was used and
so on. Now, using our GIS, with you could find all streets
within a mile of a given location that have been repaved in
the last three months and then you could sort the database
records for those streets by which street was most recently
repaved. You could use Standard Query Language (SQL) to
find all the streets in the map that were last paved with
concrete and highlight them in the drawing. You could
automatically calculate our costs for different time periods
when paving will be necessary in the future. Once the
system has a handle on both visual appearance and shape,
location and database information the possibilities are
virtually endless.
A GIS can work with many different maps. Just as you can
use Microsoft Office Word to open any document in a file
format understood by Word, you can use GIS to open maps
saved in any file format understood by the GIS. You can
create our own maps and you can save them for later use or
you can use maps created by others. This is a very good thing
since the whole process of creating maps from scratch can
be a big and expensive project. In many cases you will find
that the maps you need may exist somewhere else, in the
internet or with other organizations. You can then use GIS to
change that map, format it with the standard colours, add
new features, combine it with other maps, or cut and paste
features from the map into other maps. Editing and cutting
and pasting are a lot easier than creating something from
scratch.
An atlas is a collection of maps; usually of the earth or a
region of earth and they are usually into book form but today
many atlases are in multimedia formats as well. In addition
to presenting geographic features and political boundaries,
many atlases often feature geopolitical, social, religious and
economic statistics. They also have information about the
map and places in it. (Wikipedia). In an atlas all maps are
static. They have their set colours, coding themes etc.
which, as a user, you can see, but not alter. In contrast, a
GIS can be used to view many different maps from many
different sources and create entirely new maps or to edit
and combine existing ones. GIS is an active system. This is
one of the major differences between a true GIS program
and an atlas program.
There is an increasing trend to use the term geospatial
instead of GIS. What is the difference between geospatial
and GIS? Although some may use the terms geospatial and
GIS interchangeably, there is a distinctive difference
between the two. GIS refers more narrowly to the traditional
definition of using layers of geographic data to produce
spatial analysis and derivative maps. Geospatial is more
broadly use to refer to all technologies and applications of
geographic data. For example social media sites such as
Facebook allow us to "check-in" at specific places, or, that
allow us to geographically tag their statuses. While those
11.10
applications are considered to be geospatial, they don't fall
under the stricter GIS definition.
Other quotes to answer "What is GIS?"
"In the strictest sense, a GIS is a computer system capable
of assembling, storing, manipulating, and displaying
geographically referenced information, i.e. data
identified according to their locations. Practitioners also
regard the total GIS as including operating personnel and
the data that go into the system." USGS
“A geographic information system (GIS) is a computerbased tool for mapping and analysing things that exist and
events that happen on earth. GIS technology integrates
common database operations such as query and statistical
analysis with the unique visualization and geographic
analysis benefits offered by maps." ESRI
"GIS is an integrated system of computer hardware,
software, and trained personnel linking topographic,
demographic, utility, facility, image and other resource
data that is geographically referenced." NASA
11.11
LECTURE POINTS:
Module 11
Session 11.2.2
Elements of GIS
Elements of
GIS
The next step in understanding GIS is to look at each area of
GIS and how they work together. These components are:
• Hardware
• Software
• Data
• People
• Procedures
Together these elements form a working network that can be
called GIS. In the following picture this is symbolized where
GIS forms the core of the wheel and the different elements
form the spokes that enable the wheel to function. If one or
more of these elements are under developed (or not
present), the GIS wheel will have a hard time in turning. The
elements of a successful GIS will be described in the
following paragraphs.
Hardware
11.12
Hardware comprises the equipment needed to support the
many activities of GIS ranging from data collection to data
analysis. The central piece of equipment is the workstation,
which runs the GIS software and is the attachment point for
ancillary equipment. Data collection efforts can also require
the use of a digitizer or a scanner for conversion of hard
copy data to digital data and a GPS unit to collect data in
the field. The use of handheld field technology is also
becoming an important data collection tool in GIS.
Software
Different types of software are important for GIS. Central to
this is the GIS application. Such software is essential for
creating, editing and analysing spatial and attributes data;
therefore these packages contain a myriad of GIS functions.
Extensions or add-ons are software components that extend
the capabilities of the GIS software package. Component GIS
software is the opposite of application software. Component
GIS seeks to build software applications that meet a specific
purpose and thus are limited in their spatial analysis
capabilities. Utilities are either stand-alone programs or
plug-ins that performs a specific function. For example, a
file format utility that converts from on type of GIS file to
another. There is also web based GIS software that helps
serve data and interactive maps through Internet browsers.
Data
Data is the core of any GIS. There are two primary types of
spatial data that are used in GIS: vector and raster data.
Vector data is spatial data represented as points, lines and
polygons. Raster data is cell-based data such as aerial
imagery and digital elevation models. Coupled with this data
is usually data known as attribute data. Attribute data
generally defined as additional information about each
spatial feature housed in tabular format. The spatial data
describe where the feature is located while the attribute
data describe what it is. Documentation of GIS datasets is
known as metadata. Metadata contains such information as
the coordinate system, when the data was created, when it
was last updated, who created it and how to contact them
and definitions for any of the attribute data.
People
Well-trained GIS professionals knowledgeable in spatial
analysis and skilled in using GIS software are essential to the
GIS process. There are three factors to the people
component: education, career path, and networking. The
right education is the key; taking the right combination of
classes. Selecting the right type of GIS job is important. A
person highly skilled in GIS analysis should not seek a job as
a GIS developer if they haven't taken the necessary
programming classes. Finally, continuous networking with
other GIS professionals is essential for the exchange of ideas
as well as a support community.
Procedures
In every organization there are procedures which should be
followed to ensure the quality and the status of the work
done. GIS is not different in this. Also at points where this is
not apparent at first, it is important to describe procedures
and stick to them. For instance we would like to follow the
same procedures and classify the same elements when doing
11.13
a survey of features in a barangay. If all barangays will be
surveyed in a different way, the results may vary greatly
within one municipality. Also for data that may have legal or
financial consequences (CLUP, tax mapping) procedures may
be of great help.
11.14
LECTURE POINTS:
Module 11
Session 11.2.3
GIS as a Tool
GIS as a Tool
In most of our work, GIS is not a goal in itself, but a tool to
be used to solve problems with a spatial content. Since the
problems on our world are often complex, a GIS user needs to
be able to combine his or her field of expertise with the
technical skills of GIS, both software and concepts. These
skills should be founded on a solid understanding of
geographical and attribute data. Additional value can be
obtained if the GIS expert is able to translate problems,
proposals and policies into a step by step GIS approach and
present the answers (or elements for discussion) using maps,
tables and graphs. This process can be visualized as follows:
As with all skills, these are best learned by doing, so
therefore we propose to have a number of exercises and
examples in the toolkit which range from step by step
exercises to more complex questions where only an approach
and necessary data will be given.
With this in mind, typical GIS questions can be defined in
terms of their location on our earth:
11.15
Using a GIS you can find do many things related to the space
around us:
11.16
Find geographic features. You can search a GIS
database to find point, line, area, and surface
features by their descriptions or measurements and
then you can measure them based on their lengths,
widths, areas, and volumes, and compare sizes from
one feature to another.
Group geographic features and define their
distributions based on how much space they use, how
close they are to each other, and where they are
relative to other features.
Calculate all sorts of statistics on your geographic
features from the simplest descriptive statistics (for
example, mean, median, and mode) to very complex
spatial statistics in order to report on the features.
Find routes based on time, distance, or other factors.
You can route buses to reach the maximum number of
people and use this population density information to
locate stores near your customers.
Compare map layers. You can compare the locations
of features from one map layer (or theme) to another.
This powerful feature helps you overlay the layers,
and shows you the relative location of features from
one layer to another.
LECTURE POINTS:
Module 11
Session 11.2.4
Confusion
W
hen we are talking about geographic data and planning, there is
sometimes some confusion with respect to terms as GIS and GPS (Global
Positioning System), RS (or Remote Sensing) and CAD (Computer Aided
Design). Some characteristics of these terms will be explained in the following
paragraphs.
GPS
The Global Positioning System (GPS) is a space-based
satellite navigation system that provides location and time
information in all weather, anywhere on or near the Earth,
where there is an unobstructed line of sight to four or more
GPS satellites. It is maintained by the United States
government and is freely accessible to anyone with a GPS
receiver. The GPS program provides critical capabilities to
military, civil and commercial users around the world. In
addition, GPS is the backbone for modernizing the global air
traffic system.
In addition to GPS, other systems are in use or under
development. The Russian Global Navigation Satellite System
(GLONASS) was in use by only the Russian military, until it
was made fully available to civilians in 2007. There are also
the planned European Union Galileo positioning system,
Chinese COMPASS navigation system, and Indian Regional
Navigational Satellite System (IRNS). More on GPS will be
given in Session 3.
Remote
Sensing
Remote Sensing (RS) is the acquisition of information about
an object or phenomenon, without making physical contact
with the object. In modern usage, the term generally refers
to the use of aerial sensor technologies to detect and classify
objects on Earth (both on the surface, and in the atmosphere
and oceans) by means of propagated signals (e.g.
electromagnetic radiation emitted from aircraft or
satellites).
There are two main types of remote sensing: passive remote
sensing and active remote sensing. Passive sensors detect
natural radiation that is emitted or reflected by the object
or surrounding areas. Reflected sunlight is the most common
source of radiation measured by passive sensors. Examples of
passive remote sensors include film photography, infrared,
charge-coupled devices, and radiometers.
Active collection, on the other hand, emits energy in order
to scan objects and areas whereupon a sensor then detects
and measures the radiation that is reflected or
backscattered from the target. RADAR and LiDAR are
11.17
examples of active remote sensing where the time delay
between emission and return is measured - establishing the
location, height, speed, and direction of an object.
CAD
Computer Aided Design (CAD), also known as computer-aided
design and drafting (CADD), is the use of computer systems
to assist in the creation, modification, analysis, or
optimization of a design. Computer-aided design describes
the process of creating a technical drawing with the use of
computer software. CAD software is used to increase the
productivity of the designer, improve the quality of design,
improve communications through documentation, and to
create a database for manufacturing. CAD output is often in
the form of electronic files for print or machining
operations. CAD software uses either vector based graphics
to depict the objects of traditional drafting, or may also
produce raster graphics showing the overall appearance of
designed objects. CAD often involves more than just shapes.
As in the manual drafting of technical and engineering
drawings, the output of CAD must convey information, such
as materials, processes, dimensions, and tolerances,
according to application-specific conventions. CAD may be
used to design curves and figures in two-dimensional (2D)
space; or curves, surfaces, and solids in three-dimensional
(3D) space. (Wikipedia)
Traditionally CAD is strong in design, but not so strong in
analysis which is strength of GIS. However with recent
developments in software and databases these differences
are getting smaller. In normal use a GIS will be used to an
analysis (for instance building site selection) and then CAD
will be used to design the building.
11.18
GIS examples all over the world:
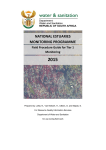
Example Increasing Government Revenues
In most countries there is a tension between the government that wishes to
collect the right amount of real property tax and the owners of properties
who would like to expand their properties without the added burden of
paying more tax and/or applying for the correct permits. This example from
the Netherlands will demonstrate how the use of GIS and aerial images can
be used to monitor where there are undocumented extensions to buildings.
The start is a city base map which shows the buildings and lots in purple
and orange and municipal properties (roads, sidewalks) in black. When this
map is overlaid with a high resolution aerial photograph, it shows the extent
of the building footprint (as known by the Office of the Building Official), in
combination with the actual size of the building. Using these two images,
the situation can be compared (the building footprints have been made
yellow for better visibility). The extent of the undocumented expansion to
the building is now measured and since the owner of the property is known,
records in City hall can be checked and if desired, the owner will be invited
to offer an explanation and may be requested to pay additional taxes.
Even though this example comes from the Netherlands and focuses on the
building footprints. The same method can be used in the Philippines to
determine where people are encroaching on government property or,
especially in subdivisions, see where people have been improving their
property without the right permits.
Example terrain modelling
11.19
For Cebu City the elevations are known as they are digitized from the
topographic maps. The first image shows the elevation of the City, low lying
at the coastal zone and high in the mountains. IF the elevations are known
and available in raster format, then a GIS can also calculate the slope at
each given location.
The second image gives an indication of the steepness of the slopes. The
steepness is indicated from green (flat) to red (very steep). Steep and very
steep slopes can pose a hazard for development and habitation. Sadly
enough, in a highly urbanized area these areas are also intensively used and
accidents happen. It should be considered whether or not these areas are
suitable for development and if so, under which conditions. After
calculating the slope, it is also possible to calculate the orientation of the
slope (north, east etc.). With these two data combined, it is possible to
derive the natural flow of rain water down the slopes as is shown with the
small areas in the third picture. These natural flow paths give a good
indication of flood hazard
Example fire hazard mapping
In many urban areas in the Philippines there is a recurring hazard of fires,
especially in urban poor areas. These areas are often characterized by the use of
light, highly flammable materials and the absence of wide roads. This means that
in case of fire, the fire trucks often do not have access to all the areas to put out
the fires. In this example we assume that the fire trucks are limited to the main
roads (red) and that they have an operational reach of 50 meters.
11.20
The yellow zones show those areas where a fire can be put out from the
main roads. The other areas cannot be reached and other measures (like fire
hydrants) are necessary.
Example hazard mitigation
This example shows how real property data can be overlaid with natural hazard
maps to give an indication for the susceptibility to natural hazards. The image
from the Provincial Map Viewer shows the assessed market values (test data) in
combination with the tsunami hazard. This gives the City planner an indication of
the possible economic damage in case of a tsunami
This image gives similar information, but in more detail. Here a parcel map with
land use information is combined with a flood map
11.21
Example Land use plan
This map shows the comprehensive land use plan for Silago (Southern Leyte)
11.22
LECTURE POINTS:
Module 11
Session 11.2.5
GIS software
There are many GIS software packages in the world and many of them are used in
the Philippines as well. This paragraph wants to give you short background
information on some of the most used GIS software.
Arcview 3.x
ArcView 3.x was a geographic information system software
product produced by ESRI. It was replaced by ArcGIS in 2000
and is no longer available ArcView started as a graphical
program for spatial data and maps made using ESRI's other
software products. Over time more and more functionality
was added to ArcView and it became a real GIS program
capable of complex analysis and data management. Its
simple user interface was preferred by many over the less
user friendly, more powerful ARC/INFO. Although ArcView
was relatively easy to use, it had some limitations as the
difficult procedures with projections and its own
programming language.
ArcGIS
ArcGIS is the flagship from ESRI, recognized as the leader in
GIS software. It's been estimated that about seventy per
cent of GIS users use ESRI products. In addition, ESRI has
developed plug-ins called extensions which add to the
functionality of ArcGIS. Demo and light versions of ESRI
software are available for downloading. You can also find
free data to use with ESRI products. A big disadvantage of
the ESRI products for the Philippines is the pricing of the
licenses which is very high. (The price in the U.S. is around
USD 1500 for the simplest version)
Manifold System GIS
Manifold System provides affordable comprehensive,
professional grade GIS software that includes a very wide
array of features. Manifold System imports data from over
80 different GIS formats, including all formats used by
Federal government sites for free Internet downloads, and
Manifold System allows seamless, simultaneous work with
vector drawings, raster images, terrain elevations and
raster data sets either as 2D displays or 3D terrain
visualizations. Manifold System includes exceptional DBMS
11.23
capabilities, full development facilities and includes a
built-in Internet Map Server for fast and easy publication of
GIS projects to the web without programming. (Manifold
can be obtained for USD 295.)
MapWindow GIS
The MapWindow GIS 4.x application is a free open source,
extensible geographic information system (GIS) that can be
used in many ways:
• As an open-source alternative desktop GIS
•
To distribute data to others
•
To develop and distribute custom spatial data
analysis tools.
MapWindow includes standard GIS data visualization
features as well as DBF attribute table editing, editing, and
data converters. Dozens of standard GIS formats are
supported, including Shapefiles, Geo-TIFF, ESRI Arc-Info
ASCII and binary grids. MapWindow is more than just a data
viewer. It is an extensible geographic information system.
This means that advanced users or developers can write
plug-ins to add additional functionality (models, special
viewers, hot-link handlers, data editors, etc.) and pass
these along to any number of the users clients and end
users.
Quantum GIS
Quantum GIS (QGIS) is a powerful and user friendly Open
Source Geographic Information System (GIS) that runs on
Linux, Unix, Mac OSX, Windows and Android. QGIS supports
vector, raster, and database formats. QGIS is licensed
under the GNU Public License. It offers. For many of the
advanced raster operations it is dependent on the
integrated GRASS GIS.
Using plug-ins a whole range of official and community
developed extra functionality is available. Customizing of
QGIS is done using Python scripts.
11.24
Why Manifold System?
All software is subject to changes and development, but at this time GIZ in
the Philippines made a choice for Manifold System GIS because:
It is much cheaper than the ESRI ArcGIS or ArcView products but offers
the same or even more GIS functionality;
Easy to learn and most calculating extensions are already built-in unlike
ESRI were you have to order extensions at a very high cost;
ESRI GIS files can be imported into Manifold System and also GIS files
within Manifold System can be exported to any GIS software file type
(ex. Shapefiles, CAD drawings, etc.);
Manifold System can download GPS data directly and does not need
third party software to do the downloading task;
Google Earth data (*.kml / *.kmz) can be imported into Manifold System
and also drawings within Manifold System can be exported to Google
Earth for visualization and verification of the data;
Has a built-in query tool that can to certain calculations (for
programmers);
Good database/attribute table capabilities;
Good in 3D-Modelling for surfaces and terrains;
The Manifold Project map file contains all data stored, such as
drawings, tables, images, queries, scripts, etc.;
Government agencies as NAMRIA and DENR’s Land Administration and
Management Project (DENR-LAMP) use Manifold System for data
synergy;
11.25
LECTURE POINTS:
Module 11
Session 11.2.6
How GIS works
The layer
model
It is not easy to put our surroundings in a computer. You
need to transform the complexity of our environment into
a model and a language that computers can comprehend.
You can do this by means of spatial data modelling:
“The process of defining and organizing data about the
real world into a consistent digital dataset that is useful
and reveals information” (Goodchild, 1992)
The model is a simplified representation of only those
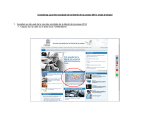
features that are of importance to the user. For instance
in the following picture you see an image of the world that
has been organized (or dissected) into layers. Each layer
represents a specific type of information about the world
that is important to us in our GIS project.
Figure 1: the GIS layer model (ESRI)
In this example you can find information on
zones, elevation, parcels, rivers and
addresses. Please note that the layers you
are not necessary visible in the real world.
An example is the zoning information in the
example above, but you can also think of
barangay and municipal boundaries etc.
Within a GIS every description of the
environment has two different types of
spatial or geographic information attributes
(where is the object situated) and nonspatial attributes or descriptive attributes.
These attribute data describe the features
on the map (the geographic data). Only if
both spatial and non-spatial attributes are
available, you can perform a useful analysis
in a GIS.
The model is a simplified representation of
only those features that are of importance
to the user
11.26
Types of
GIS data
Vector and raster are the two basic data structures for storing and
manipulating geographic data on a computer.
Vector data comes in the form of points, lines and polygons that are
geometrically and mathematically associated. Points are stored using
the coordinates, for example, a two-dimensional point is stored as (x,
y). Lines are stored as a series of point pairs, where each pair
represents a straight line segment, for example, (x1, y1) and (x2, y2)
indicating a line from (x1, y1) to (x2, y2).
Raster images come in the form of individual pixels, and each spatial
location or resolution element has a pixel associated where the pixel
value indicates the attribute, such as colour, elevation, or an ID
number. Each pixel or cell also has a specific size. When increasing
the spatial resolution by 2 times, the total size of a two-dimensional
raster image will increase by 4 times because the number of pixels is
doubled in both X and Y dimensions. The same is true when a larger
area is to be covered when using same spatial resolution.
In general, vector data structure produces smaller file size than
raster image because a raster image needs space for all pixels while
only point coordinates are stored in vector representation. This is
particularly true in the case when the graphics or images have large
homogenous regions and the boundaries and shapes are the primary
interest. Vector data is also easier to handle on a computer because
it has fewer data items and it is more flexible to be adjusted for
different scale, for example, a projection system in mapping
application. This makes vector data structure the apparent choice for
most mapping applications. For many data entry processes (scanning,
Remote Sensing etc.), raster data are the prime solution, so in a GIS
we have to work with both.
Point
The first thing you need to realize when talking about point
features is that what you describe as a point in GIS is a matter of
opinion, and often dependent on scale. Let’s look at cities for
example. If you have a small scale map (which covers a large area),
it makes sense to represent a city using a point feature. However
as you zoom in to the map (moving towards a larger scale) it makes
more sense to show the city limits as a polygon which has an area.
When you choose to use points to represent a feature is mostly a
matter of scale (how far away are you from the feature),
convenience (it takes less time and effort to create point features
than polygon features), and the type of feature (some things like
electricity posts just don’t make sense to be stored as polygons).
11.27
As shown in the Illustration above, a point feature has an X, Y and
optionally, Z value. The X and Y values will depend on the
Coordinate Reference System (CRS) being used. You are going to
go into more detail about Coordinate Reference Systems in Session
3. For now let’s simply say that a CRS is a way to accurately
describe where a particular place is on the earth’s surface. One of
the most common reference systems is Longitude and Latitude.
Lines of Longitude run from the North Pole to the South Pole. Lines
of Latitude run from the East to West. You can describe precisely
where you are at any place on the earth by giving someone your
Longitude (X) and Latitude (Y). If you make a similar measurement
for a tree or a telephone pole and marked it on a map, you will
have created a point feature. Since you know the earth is not flat,
it is often useful to add a Z value to a point feature. This describes
how high above sea level you are (or for instance how high a
telephone post is).
Line
Where a point feature is a single vertex, a line has two or more
vertices. The line is a continuous path drawn through each vertex,
as shown in Illustration 3 above). When two vertices are joined, a
line is created. When more than two are joined, they form a ’line
of lines’, or line. A line is used to show the geometry of linear
features such as roads, rivers, contours, footpaths, flight paths and
so on. Sometimes you have special rules for lines in addition to
their basic geometry. For example contour lines may touch (e.g. at
a cliff face) but should never cross over each other. Similarly, lines
used to store a road network should be connected at intersections.
In some GIS applications you can set these special rules for a
feature type (e.g. roads) and the GIS will ensure that these lines
always comply with these rules. If a curved line has very large
distances between vertices, it may appear angular or jagged
depending on the scale at which it is viewed (see the figure below).
Because of this it is important that lines are digitized (captured
into the computer) with distances between vertices that are small
enough for the scale at which you want to use the data.
The attributes of a line describe its properties or characteristics.
For example a road line may have attributes that describe whether
11.28
it is surfaced with concrete or asphalt, how many lanes it has,
whether it is a one way street, and so on. Manifold System can use
these attributes to display the line feature with a suitable colour or
line style.
From QGIs: an easy introduction into GIS
Polygon
Polygon features are enclosed areas like lakes, islands,
administrative boundaries and so on. Like line features, polygons
are created from a series of vertices that are connected with a
continuous line. However because a polygon always describes an
enclosed area, the first and last vertices should always be at the
same place! This has also as consequence that you can calculate
and use the area and perimeter of polygons. Points have (by
definition) no dimensions and from lines you can only calculate the
length. Polygons often have shared geometry - boundaries that are
in common with a neighbouring polygon. If you look at real
property maps, one part of the polygon is the boundary of both its
own as well as its neighbouring lot.
In Manifold System you have the capability to ensure that the
boundaries of neighbouring polygons exactly coincide. You will
explore this later in Session 4. As with points and lines, polygons
have attributes to describe each polygon. For example a map with
barangay boundaries may have attributes for its name, population,
etc.
Raster
In the previous paragraphs you have taken a closer look at vector
data. While vector features use geometry (points, lines and
polygons) to represent the real world, raster data takes a different
approach. Rasters are made up of a matrix of pixels (also called
cells), each containing a value that represents the conditions for
the area covered by that cell (see Figure on next page). Every cell
has the same size. In this topic you are going to take a closer look
at raster data, when it is useful and when it makes more sense to
use vector data.
11.29
A raster dataset is composed of rows (running across) and columns
(running down) of pixels (also known as cells). Each pixel
represents a geographical region, and the value in that pixel
represents some characteristic of that region.
Raster data is used in a GIS application when you want to display
information that is continuous across an area and cannot easily be
divided into vector features. In exercise 1.1 we showed you a
Google map image and asked you to identify Point, line and
polygon features. There are however other features that have no
clear boundaries and these are difficult to map put in discrete
units. Think for instance on elevations. On a slope every millimetre
may have a different height. Drawing a boundary around this is
very difficult. You can draw a line around a single elevation (for
instance between 10 and 20 meters MSL) but all the info on
elevation in between would be lost in the process of simplifying the
features to a single polygon. This is because when you give a vector
feature attribute values, they apply to the whole feature, so
vectors aren’t very good at representing features that are not
homogeneous (entirely the same) all over or that do not have
discreet boundaries. Another approach you could take is to digitize
every small variation of height and cover as a separate polygon.
The problem with that approach is that it will take a huge amount
of work in order to create a good vector dataset.
Using raster data is a solution to these problems. Many people use
raster data as a backdrop to be used behind vector layers in order
to provide more meaning to the vector information. The human eye
is very good at interpreting images and so using an image behind
vector layers, results in maps with a lot more meaning. Raster data
is not only good for images that depict the real world surface (e.g.
11.30
satellite images and aerial photographs); they are also good for
representing more abstract ideas.
For example, rasters can be used to show rainfall trends over an
area, or to symbolize the fire risk on a landscape. In these kinds of
applications, each cell in the raster represents a different value
e.g. fire hazard on a scale of one to ten.
An issue with rasters is that the more you zoom in, the more
difficult the image will be to interpret (same as if you zoom in too
much in your digital photo).
Similar as to the vector data, raster data comes in many forms and
shapes and under different names. For instance an image, usually
used as a digital photo or element from Remote Sensing, is
basically a raster dataset
Exercise 1.1
The layer principle and line, point, and polygon data
11.31
Summary
Method
Raster
At times it can be confusing when to use vector and when to
use raster data. There may be instances when there is no
choice. If satellite images are purchased or a paper map is
scanned,, the data are always in raster form. These can be
used as basis for tracing and drawing vector data. Also
Manifold System has options to convert vector to raster and
vice-versa.
Advantages
Simple data structure
Compatible with remotely
sensed or scanned data
Simple spatial analysis
procedures
Disadvantages
Vector
Requires less disk storage
space
Topological relationships
are readily maintained
Graphical output more
closely resembles handdrawn maps
11.32
Requires greater storage space on
computer
Depending on pixel size, graphical output
may be less pleasing
Projection transformations are more
difficult
More difficult to represent topological
relationships
More complex data structure
Not as compatible with remotely sensed
data
Software and hardware are often more
expensive
Some spatial analysis procedures may be
more difficult
Overlaying multiple vector maps is often
time consuming
LECTURE POINTS:
Module 11
Session 11.2.7
The Connection between map and Database
A
ttributes for a vector feature are stored in a table. A table is like a spread sheet.
Each column in the table is called a field. Each row in the table is a record.
Table 4 shows a simple example of how an attribute table looks in a GIS. The
records in the attribute table in a GIS each correspond to one feature. Usually,
the information in the attribute table is stored in some kind of database. The GIS
application links the attribute records with the feature geometry so that you can find
records in the table by selecting features on the map, and find features on the map by
selecting features in the table.
Table 4: An attribute table has fields (columns) and records (in rows)
Records/fields
YearBuilt
RoofColor
Terrace
Record 1
1998
Red
no
Record 2
2000
Red
no
Record 3
1984
Brown
yes
Each field in the attribute table contains a specific type of data - text, numeric or date.
Deciding what attributes to use for a feature requires some thought and planning. In the
house example earlier on in this topic, roof colour, presence of a terrace and year of
construction as attributes of interest were chosen. Just as easily, any of the following
could have been chosen:
•
•
•
•
•
•
•
number of levels
number of rooms
number of occupants
type of house (row house, city house, bahay kubo etc.)
market value of the property
area of floor space in the house
and so on....
With so many options available, how does one make a good choice as to what attributes
are needed for a feature? It usually boils down to what you plan to do with the data. If you
want to produce a colour coded map showing houses by age, it will make sense to have a
’Year Built’ attribute for your feature. If you know for sure you will never use this type of
map, it is better to not store the information. Collecting and storing unnecessary
information is not efficient because of the cost and the time that is required to research
and capture the information. Very often, vector data is obtained from companies, friends
or the government. In these cases it is usually not possible to request specific attributes
and one has to make do with what is available.
11.33
In a GIS, the table is always stored in a database which can be, relatively simple to very
complex. The advantage of this is that items in the table can be used to design the colours
and look and feel of the map layer. Alternatively, one can also select a geographic element
(on the map) and study the records of the database. You can also do this in reverse, select
specific features in the database and present them in the map. This is one of the main
features of the GIS.
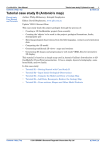
This principle is demonstrated again in the following image where the
corresponding elements in the map and database are colored blue
The element in the map with the blue outline is described in the database as barangay
Guadalupe in Cebu City with zip code 6000 and vice versa (the record in the database is
located in the map at the exact location of the blue outline. The barangay is colored red
because in 1998 it has a big amount of dengue cases which are represented per barangay
from white (no dengue, via yellow, green and pink) to red, many cases of dengue.
Exercise 1.2
Geographic and attribute data
11.34
Summary
In this Session we have presented a number of principles of
GIS. As a Geographic Information System it is a combination of
hard- and software which is operated by people that use data
and procedures to work with geographic data. Geographic data
are simplifications of the world in which we live and depending
on your needs and insights the real world can be divided into
many different map layers, each describing a specific element
of the world. These data can come in many forms and shapes
but two most important types for our work are the vector and
raster data. We have presented some of the most used GIS
software packages in the Philippines and described the
difference between sometimes confusing terms as GIS, GPS,
CAD and RS. The maps in our GIS present the location of a
feature on the earth where the attribute data describe this
feature. Using the information in the attribute table (or
database) we can again format and display our map.
In the following Session we will discuss Manifold System as a
tool to use, prepare and present maps for planning.
11.35
11.36
SESSION GUIDE:
Module 11
Session 11.3
Introduction to Manifold System
OVERVIEW
Manifold System is a Geographic Information System (GIS) software package. A GIS package is
different than an "atlas" package, such as Microsoft's Streets and Trips that can display only
one, built-in, read-only map. A GIS can work with many different maps and can be used to
create new maps, to edit maps and to combine maps with database information.
Manifold System is a "word processor for maps" that will let you create new maps or edit
existing maps. It is also a "database system for maps" that will allow you to embed database
information into a map so that the map can be used as a visual interface into the data.
Anyone can use Manifold System interactively to create new maps or to explore database
information displayed within a map. In the hands of experienced users with programming
skills, Manifold System may be used to create new applications to work with maps, images,
surfaces and databases.
OBJECTIVES
After this Session you will:
1
2
3
4
Have a basic knowledge of the Manifold System functionality
Know how to add drawings and images and how to change the colours of the drawings
Know how to create maps and add labels
Have insight in the main components of Manifold System as panes, toolbars and the
status bar
DURATION
6 hours
CONTENT AND ACTIVITY
PLAN
Topics to be covered:
1.
2.
3.
4.
Installing Manifold System GIS
The user interface
Adding Data into Manifold System
Create overlays of components (Images, Drawings)
11.37
SUGGESTED METHODOLOGY
Presentations
Exercises
Demonstrations
RESOURCES NEEDED
For this session you need a computer with a working Manifold System license and the data
for the exercises from the DVD. In order to have no problem with read/write access to the
data, please copy the exercises from Lesson 2 to a place on your computer. The exercises
from this Lesson are described in the exercise manual.
REFERENCES
Deutsche Gesellschaft für Internationale Zusammenarbeit (GIZ) GmbH, Existing PowerPoint
and documents on Manifold GIS trainings, mostly compiled by Jay-ar Ragub and Jerson
Sala
MANIFOLD System GIS Help,
MANIFOLD System GIS User manual, accessed on:
http://www.georeference.org/doc/whnjs.htm
Geerling, Gertjan, - Draft Manifold Hands-on Manual, not published
11.38
LECTURE POINTS:
Module 11
Session 11.3.1
Installing Manifold System GIS
I
f Manifold System is not yet installed in your computer, this needs to be
installed . This session contains the steps to install the software. For users
who are using Microsoft Vista or newer, a true administrator rights to install
or activate Manifold System is needed.
Some versions of Vista make it difficult for users to login with true Administrator
rights. However, that can be bypassed sometimes by running programs using a "Run
as Administrator" option. Here is a shortcut that works in most cases.
TO INSTALL
MANIFOLD
SYSTEM:
Right-click on the Manifold System .msi installation file and choose
"Run as Administrator."
To activate
Manifold
System:
Launch Manifold System by right clicking on the Manifold System icon
and choose "Run as Administrator."
For example, suppose after downloading Manifold System from the Product
Downloads page and unzipping the zip file you have an installation file
called Manifold System-8.0.12.msi. [Note that depending upon your
Windows Explorer settings Vista may or may not show you the three letter
".msi" extension.] With your mouse, right click onto the Manifold System8.0.12.msi file and choose Run as Administrator from the context menu
that pops up. This will cause the Manifold System installation to be run
with true Administrator privileges.
Suppose you have installed Manifold System by using the shortcut
above. Now it's time to launch Manifold System with true Administrator
privileges so you can provide your serial number and, optionally,
activate the installation. The default Manifold System installation
places a Manifold System program icon on your desktop. With your
mouse, right click onto the Manifold System program icon and choose
Run as Administrator from the context menu that pops up. This will
launch Manifold System with true Administrator privileges. The
Activation dialog will pop open and you can now add a serial number
and optionally get an Activation key and activate Manifold System with
true Administrator privileges.
Important:
!
If your Windows system has been altered from
defaults, the above shortcuts might not work. In
that case you'll have to use the full procedure
as given at this website: http://www.Manifold
System.net/tech/vista_admin.shtml.
11.39
Entering the
Serial
Number and
Activation
Key
All Manifold System licenses are copy protected using one of two
mechanisms:
•
Authorization using a Serial number and Activation keys
that locks each license to a single computer system.
Manifold System licenses acquired in small quantities or
acquired for use on portable devices use this mechanism.
•
Authorization of floating licenses using a License Server.
Manifold System licenses acquired in larger quantities will
frequently use this mechanism, which requires licensing of
the Manifold System License Server product. See the
Manifold System License Server topic for discussion of
License Servers.
In most cases, the first option will be relevant for use.
Login as Administrator (or alternatively run as Administrator).
Install Manifold System and then launch Manifold System. In the
Activation dialog that pops open, provide the serial number
emailed to you for the Manifold System edition you have
licensed. Copy the serial number from the original serial number
email message and paste it into the dialog.
For the first 30 days after your serial number was issued, you can
run on the serial number alone. After 30 days you will have to
get an Activation key as well. When the Activation dialog
launches, enter your serial number and then press the Get
Activation Key via the Web button and then press Accept.
Getting an Activation key terminates any return privileges you
may have.
If you have licensed Business Tools, Geocoding Tools or Surface
Tools extensions: launch Manifold System and choose Help Activate Extension. Enter the serial number for the extension.
Get an Activation key if it is more than 30 days since the serial
number was issued. Press Accept. Do this for each extension that
you have. If you have licensed Universal Edition or Ultimate
Edition, all three extensions get turned on automatically when
you activate your main Manifold System serial number. No need
to use the
Help - Activate Extension dialog with Universal Edition or
Ultimate Edition.
Important:
!
Manifold System is licensed for use on one machine at
a time. You get five Activation keys per serial number to
allow re-installs if necessary, not to allow simultaneous
use on five machines. Don't waste Activation keys.
Read this entire topic carefully for tips on getting the
most out of your license.
If any problem is encounterd,please refer to this webpage http://www.Manifold
System.net/tech/activation_troubleshooting.shtml.
11.40
LECTURE POINTS:
Module 11
Session 11.3.2
The user interface
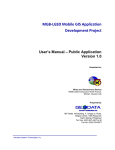
After starting the MANIFOLD SYSTEM, either from the desktop computer, or through
start -> all programs -> Manifold System systems -> Manifold System 8.xxx (where
xxx stands for the version number of your Manifold System License), the start-up
screen will appear, as shown below::
3
The menu bar shows the
available menu items for your
project. The amount of menu
items and which items are
shown at a specific moment
is dependent on your
Manifold System version and
with what kind of data or
activities you are working.
The menu will only show the
options that are available to
you at that specific moment.
Please take note of the help
menu item. The Manifold
System Help is elaborate and
very well organized. You can
get help on technical issues,
all features of Manifold
System and on GIS concepts
as well. The help is indexed
and can be both browsed and
searched. The help can also
be activated using the
“F1”button.
5
2
The
name
bar
which also shows
the name of the
project you are
working with.
1
4
The button bar adds functionality which is sensitive to
the context where you are working with. The amount
and which buttons show is therefore variable and
different if you are working with layers, tables etc. You
can influence which button bars are shown using the
menu option tools – customize.
Main Window. In this, now grey,
area will appear the layer that
you open, the tables and maps
that you will be working with. It is
the big graphic area where
‘things will happen’.
The project pane shows all components we have in our project. Open/close the project pane
with SHIFT-ALT-P or with View - Panes - Project. In the default hierarchical view used for
the project pane, components that are linked to other components will be shown indented
below their parent component. Drawings, for example, always are linked to a table that
contains the data fields for the objects in the drawing. Images that are palette images will
have a palette linked to the image. Surfaces will have a terrain component created by default
for the surface and may have one or more subsidiary terrain components.
Names of components are marked with an asterisk * if they have been added to the project
or changed since the last Save command. Manifold System works with only one project at a
time. To work with different projects (say, for example, to copy and paste data between
projects) we can launch two Manifold System programs and switch between them. More
details on the project components will be given in the following paragraph.
6
System Activity Indicator. The
System Activity indicator in the
status bar at the lower right
hand of the screen changes
shape whenever Manifold
System is busy executing a
command. When the system
is busy it will show a 3D
"bump". If desired, un-checking
the Quiet system activity
indicator in the Tools - Options
User Interface page will change
the indicator to use colors.
11.41
Hint
11.42
Sometimes you don’t need all the panes, but you
would like to have more space to work with the
layers or tables. In that case, Manifold System GIS
has the option for View - Full Screen Display main
Manifold System window using the entire monitor
screen, eliminating the title bar and menu bar. Press
F11 to enter full screen mode. Press F11 again to
exit full screen mode. If toolbars are hidden using
Tools - Customize and a window is maximized the
result is a "full screen" display.
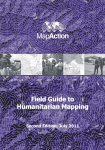
The Help
function
Contents tab
Index tab
Search tab
The help function is very important to be able to work with
Manifold System and many other GIS packages have such a
vast array of functions, that it is almost impossible to
remember the exact workings of all of them. It is common
that the user has an idea of what he/she wants to do and
needs manuals or help files to find the correct procedure.
By pressing F1, or going to menu Help > Contents, the help
window opens. Help can be accessed in three ways by
clicking on the tabs contents, index and search that are
located in the top left of the help window. Should more
information about a topic discussed in this manual is
needed, remember that help on all the words printed in
Bold can be found by typing that word in the Index tab.
Information is grouped according to topic, for example all about drawings can be
found in topic drawings.
Index allows you to type an index keyword. For example the name of a button or a
function you encounter in a menu, pane or toolbar. This takes you directly to its
description, similar to the index of a book.
Search allows you to search for all keywords, like using Google on the internet. All
help texts containing the search term are shown as a result. Sometimes this can give
a lot of results and is therefore not always useful.
The help window.
Exercise 2.1
The Manifold GIS help functions
11.43
Panes and
Toolbars
Many controls of Manifold System are accessed through
Panes and Toolbars. Panes are windows that give
information about something. For example the ‘Project
Pane’ in the figure below. It gives information about what
components are available in the project.
The ‘Project pane’.
Toolbars are small windows that contain buttons linked to
tools. Depending on what type of data window is active
(like drawings, tables or images) different toolbars are
visible. Examples of toolbars are shown below.
11.44
Examples of toolbars.
To show or hide panes and toolbars you can go to menu
item Tools > Customize. Here you can select which panes
and toolbars are shown (see figure above). You can select
and deselect items to let them appear and disappear (just
try!). The functions of the different panes and toolbars will
be gradually explained throughout this manual.
The customize windows (from the Tools > Customize menu).
All panes and toolbars can be docked or floating. Figure
above shows docked (to the sides) and floating panes and
toolbars. To move a pane, drag it by clicking on or just next
to its name, you will see the mouse pointer change into an
arrowed cross. When dropped in the middle or outside the
main window, it will float. When dropped close to an edge
of the main window, it will dock again. To move a toolbar,
just click on the small vertical bar on the left and move the
toolbar. When you want to dock it again, drag it in next to
another toolbar and drop it.
Remember, when you close it by pressing the [x] in the top
right corner, you can open it again through the menu item
Tools > Customize!
11.45
Projects
Manifold System's main documents are projects, which use
Manifold System .map project file format (".map" =
Manifold System Project). Within Manifold System the
standard Windows menu items File→New, File→Open and
File→Save commands will create, open and save .map
project files. Projects contain a portfolio of components.
Components are images, drawings, tables, labels, charts,
maps and other items.
The ‘Project pane’.
Some components always have subsidiary components.
Whenever a drawing is added to a project a subsidiary table
for the drawing will also be automatically created. The
table stores data fields for objects in that drawing.
Surfaces will be created by default with a subsidiary
terrain. The terrain shows the contents of the surface in a
3D window.
11.46
The Project Tree.
Names of components are marked with an asterisk * if they
have been added to the project or changed since the last
Save command. Manifold System works with only one
project at a time. To work with different projects (say, for
example, to copy and paste data between projects) we can
launch the Manifold System program two times and switch
between them.
11.47
Project
components
A project may consist of several components, and it is
saved as a map file. Components can be, for example,
drawings of roads, rivers, administrative borders, but also
tables, excel data or a layout.
The following will give an overview of the most used
components:
Drawings
Drawings are made up of objects that may be points, lines
or areas based on specific coordinates (see also Lesson 1).
Every Manifold System drawing is linked to a table. Every
object in the drawing corresponds to one record in the
table. Manifold System can import drawings from a vast
array of different GIS and CAD formats. Drawings that are
automatically created from database tables are called
linked drawings and are shown using an icon that includes a
yellow "database" cylinder.
Themes
Themes are displays of a drawing shown using different
formatting. Manipulating a theme is just the same as
manipulating its parent drawing. Themes make it possible
to show drawings colored or presented in different ways
without having to duplicate the drawing.
Images
Images are composed of pixels arranged in orderly rows and
are often referred to as rasters in older GIS systems. Most
of us know images as the familiar pixel-based images we
edit in Microsoft Paint or so. Images in Manifold System can
also be multi-channel raster data as well as visual images.
Images are normally imported into a Manifold System
project. One special type of images, compressed images,
may be linked into a Manifold System project from external
files or compressed image servers. Linked images may also
be created from queries and database tables as well as
from image servers such as TerraServer or OGC WMS
servers, in which case they are indicated with an icon that
incorporates a "database" cylinder.
Tables
Database tables may be included either within a project or
linked from external database providers so that the data
they contain is fetched "on the fly" as it is needed. Tables
linked from external sources are shown with an icon that
includes a yellow "database" cylinder. Manifold System
includes an immense array of database capabilities that
work with tables and which may be used for database
manipulation of tables from almost any database
11.48
management system.
Labels
Labels components show text labels that are either entered
manually or are automatically created from data fields
linked to drawings. Labels components may be created in a
variety of ways, such as making a Copy of drawing objects
and then Paste As a Labels component.
Maps
Maps show drawings, images and labels as layers in a map
window. An important function of maps is showing the data
they contain in projected form, where the native
coordinates of drawings are transformed into a desired
geographic or other projection and where images are
referenced into the desired coordinate system and shown in
projected form. Map windows are the main user interfaces
within Manifold System. Maps are used not only for
geographic presentation but also for working with nongeographic images and drawings in many layers.
Surfaces
Surfaces are raster data sets that contain data values, such
as elevations, for each location. They are almost exactly
analogous to images except that instead of a colour value
for each "pixel" they contain a data value. The default way
to show a surface is as a shaded relief 2D image. Surfaces
are called "grids" in some GIS packages. Surfaces may also
be linked from queries or tables, in which case they are
indicated with an icon that incorporates a "database"
cylinder.
Terrains
Terrains are surfaces shown in three-dimensional views.
Every terrain has a parent surface. Terrains are most often
used to show 3D views of the surface of the Earth based on
terrain elevation data; however, they may also be used to
see abstract data such as population gradients,
temperatures or other data as 3D surfaces. Each surface
can have an unlimited number of terrain views created for
it.
Exercise 2.2
Get familiar with Manifold System
11.49
Customizing
Manifold
System
As with most software, Manifold System GIS has a number
of options to customize the application so that it fits more
to the needs of the user. In order to do this, go to Tools - >
Options and the following menu appears:
The following are important features:
Automatic updates:
Manifold System can be set to check the internet for
automatic updates or after a specific amount of days. This
can be switched off to prevent any re-installation issues.
Locations to be used by default for files can be specified in
File Locations. Locations that may be specified include
those of many Manifold System features (take care when
changing these) and the default locations of your projects.
For a complete overview of the functions, please go to
Help→Index and type “options”
If the default location of GIS data is changed, it may be
useful to prepare a folder structure in the project that may
help in storing and organizing the data. One option is to use
the same structure as Manifold System does for its project
components. There are however more options for this and,
select one that is functional for one’s own needs.
Below is a suggestion of folders that can be created. These
are borne out of tested practices:
•
11.50
Admin - this is where project documents etc. are
stored
•
Base data – All original data is placed in the same
projection etc. These data can be used for
backgrounds etc., but not for editing
•
Final: contains all the final finished products
•
Original – stores the data in its original form as
received and has not in any way been edited.
•
Tmp – stores all temporary data
•
Work –place the data currently being worked on .
Completed work is transferred to to the folder, final
data
•
Reports – where documentation and reports are kept
11.51
LECTURE POINTS:
Module 11
Session 11.3.3
Adding Data into Manifold System
Through clicking on the menu items File > Import > Drawing the import windows opens,
see figure below.
Example of Import Drawing
Navigate through the map (directory)
containing the drawing. Be sure to select
the correct file type in the drop-down
menu Files of type located in the bottom
of the window. In this case SHP Files
(*.shp) is selected. When a drawing is
opened, choose what ‘fields’ from the
attribute table will be imported (left
figure). Fields contain the properties of
the drawing elements, such as names,
length, surface area, or any database
entry thinkable.
Import SHP File, field selection.
11.52
After the drawing has been imported, it
appears as component in the project
pane. The drawing consists of the drawing
itself and the connected table that
contains the fields (See Project Pane on
the left in Import SHP File Figure). By right clicking on the component’s entry in the
project pane and choosing Open (or double clicking on the component) the data becomes
visible on the main screen. Just as in normal windows, the drawing can be moved and
resizes using the normal window controls.
Active component (drawing) in window.
In Manifold System, the toolbars and available menu items vary according to what type of
component is active. Notice that after opening the drawing, several ‘toolbars’ with buttons
to access functions appears and the menu items changes. Now go to the ‘project pane’ and
press the ‘+’ sign in front of the drawing ( ). You should see the table appear. Double
click on the table icon ( ). The table appears in the main window, like figure1-6. Notice
again that the menu items and toolbars have changed!
To close a component
window, just press
the red cross (
) in
the corner to close
the window. To see
how many windows
are open, choose
menu item window→
windows (F12) or
press F12.
To delete a drawing
from the project:
Select it in the
Project pane, right
click it and choose
Delete or press the
Delete button in the
Project Pane (
).
Showing a drawing’s table.
11.53
Loading and
deleting an
image
Similar to loading a drawing, an image can be loaded.
Now not every step is shown in pictures. Do the following
steps:
1. Go to file > import > image
2. Locate the file; remember to choose the right file
type in the bottom of the window! (See figure
below).
3. Press open or double click the file. It can take some
time to load an image.
4. The file should appear in the project pane having
this ( ) icon.
5. Right-click and choose open or double click on the
image to show it.
6.
Press the red cross (
window.
) in the corner to close the
Notice again that the menu items and toolbars have
changed.
Showing a drawing’s table.
To delete an Image from the project. Select it in the
Project pane, right click it and choose Delete or press the
Delete button in the Project Pane (
11.54
).
Exercise 2.3
Import drawings and observe map and database
a.
Exporting data
All data in the project pane can be exported to be kept as
separate files outside a project. You can export all
components such as tables to excel files, Images, Drawings
to various kinds of output files.
1. Open the component to export by double clicking it in
the project pane.
2. Go to File > Export, choose the export type.
3. The Export window opens. Browse to the location you
want to save to file to.
4. Select the desired file type in the Save as type list
box and specify a name
5. Press save.
Important:
!
In contrast to some other GIS software, Drawings in
Manifold System can contain points, lines and areas
(polygons) at the same time. When such a drawing is
exported to for example Manifold System shape, one
drawing is exported as 3 separate shape files, one
containing points, one lines and one areas.
Exercise 2.4
b.
Saving and sharing your data
11.55
LECTURE POINTS:
Module 11
Session 11.3.4
Create overlays of components (Images, Drawings)
Map windows are the most frequently used windows in Manifold System. A
map is a projected view that contains layers. Each layer is a separate
drawing, image, surface or labels component. Maps are the only view
windows in Manifold System with layers. They are used to see drawings,
images, surfaces and labels components in combined, layered views.
Creating a
New Map
We can create a new map using whatever source materials we
like:
1. Create a new project using File > New. This opens a project
view window.
2. Using File > Import, import any drawings or other
components into the project the new map will use.
3. Create a new map in the project using File > Create > Map.
We must specify the name of at least one drawing or image
this map will use. In the Create Map dialog, check all the
drawings or images from the project you would like to
appear in this map.
4. Double-click on the new map in the project view window to
open it in a map view.
5. Drag and drop any additional components from the project
view window into the map view window. This adds them to
the map.
6. If images (or any other components) are not already
georegistered, they must first be georegistered so that they
appear in the proper geographic location at the correct size.
See session 3: Map projections and Transformations.
7. If desired, use Edit > Assign Projection to change the
projection used by the map.
8. By activating View > Panes and choosing the Layers pane,
one can see what layers are present and which are active
using the tick box, see the Layers pane in the lower right
corner of figure in next page.
9. Option: To change the order of the layers you click on the
layer’s tab and drag it past another layer’s tab. Remember
that points or lines can easily be hidden behind areas.
10. Option: By right clicking a layer’s tab a lot of functions
become available: You can delete the layer from the map.
Or Zoom to the layer.
11.56
11. Very useful is the Opacity option by which for example
images such as map scans can become see-through to show
underlying layers. This is often used to combine elevation
maps (called surfaces in Manifold System) with other data.
12. Maps are also used to create (digitize) and edit drawings and
images by using multiple layers for edits.
Example of a map view
11.57
Navigation
toolbar
The navigation toolbar (figure below) is used to navigate in
geographical data, such as drawings or images. This is only active
when the geographical data window is open. Normally it is
‘docked’ in the main window of Manifold System looking like
.
Navigation toolbar.
Docked navigation toolbar.
Hint
When you hover your mouse arrow above
the buttons without clicking, the function of
the button appears in a text bar. The scale
indicates the current scale, when it is
empty you should check the projection of
the active window (see further in Map
projections and transformations).
Below the functions of the buttons are summarised, you activate
a button (function) by clicking it once; by clicking it again you
turn it off. Try them after you have imported and opened a
drawing or image.
Back - Go back one view in the current component
window.
Forward - Go forward one view in the current component
window.
Zoom scale combo - Choose a zoom scale
from a variety of even zoom scales, or enter the scale
11.58
you want.
Zoom To Fit - Zoom so that the component fits within the
current window size.
Zoom In - Magnify the view as if seen from a closer
distance.
Zoom Out - Reduce the view as if seen from farther away.
Zoom Box - Zoom to the size of the cursor box drawn with
the mouse.
Center Point - Pan the view so that the spot clicked is
centred.
Grabber - Interactive pan: click and drag with the grabber
hand. The scene will be panned so that the initial point
is moved to the spot where the drag is released.
Tracker - Provides interactive distance and area
measurements.
Hint
Important:
!
Formatting a
component
The saved map file contains the
data of all the components
except for the linked components
such as Google earth data.
Therefore by copying the.map file
only, you can take or email your
work to another place
In contrast to some other GIS software, Drawings in Manifold
System can contain points, lines and areas (polygons) at the
same time. When such a drawing is exported to for example
Manifold System shape, one drawing is exported as 3
separate shape files, one containing points, one lines and
one areas.
Once a drawing has been imported and opened, we can
change the way it looks using the format toolbar. Used with
drawings or drawing layers in maps, the Format toolbar
controls the colour, style and size of areas, lines and points.
Used with text components the Format toolbar controls the
11.59
colour and appearance of text labels in that layer. Used
with images, the Format toolbar controls the colour, style
and size of painting tools. Note that the contents of this
toolbar depend on what component window or map layer is
active.
For drawings the following options are available:
Areas Format - Foreground / background colours, Style and size for all areas in this
drawing.
Area Borders Format - Foreground / background colours, Style and size for all area
borders in this drawing. While the 1/20th of a point value for border size works well for
screen display it is wise to increase the thickness of area borders for printed materials
since 1/20th of a point results in lines that are too thin for good visibility with most
printers.
Lines Format - Foreground / background colours, Style and size for all lines in this
drawing.
Points Format - Foreground / background colours, Style and size for all points in this
drawing
Foreground
Colour
The colour of solid points and lines and the foreground
colour of two-colour area styles or of two-colour area
border styles. Choosing a transparent colour for foreground
colour for an area will turn off display of that area. This is a
short-cut way of turning off areas when desired.
Background
Colour
The fill colour in most styles used for points, lines, areas
and area borders.
Style
The pattern or icon used to draw points, lines, areas or area
borders.
Size
The relative size to use for patterns used to draw points,
lines, areas and area borders. Does not apply to bitmapped
images used for points.
Rotation
Angle
Allows rotating the symbols used for points to a given angle.
11.60
Exercise 2.5
c.
Change the colors of drawings
Exercise 2.6
d.
Prepare a map and change look and feel
Summary
In this Lesson you have set your first steps in working with Manifold
System GIS. We have discussed the main panes and toolbars and
you now know how to import your data and change the colours of
your drawings. More advanced colouring options will be presented
in the Lesson on making and printing layout. One of the most
important components in Manifold System is the map where you
can combine drawings and images into a more complex
presentation where then there are also more and different options
available. This Lesson focuses on working with existing data. The
next Lesson will focus on collecting and preparing your own maps.
11.61
11.62
SESSION GUIDE:
Module 11
Session 11.4
Data Entry
OVERVIEW
In starting to use GIS, one will find that in many cases, the data needed are not available,
or if they are, not in the shape or format that are usable. In this case, one has to come up
with ways of preparing its own data. This session presents, the three ways of collecting
baseline data for a project. These are, conducting GPS survey, georegistration, and using
data from tables. In many cases these data may be based on different geographical reference
systems or projections and working with the wrong projection may cause errors in data or in
analysis. This session provides an overview of how to work with the GPS and how to download
data into Manifold System. Using these data and a scanned image, this session will deal with
how to correctly position the said image on the world so by using GIS.. This will also give an
insight into coordinate systems and where in the Philippines the GIS data may be obtained
OBJECTIVES
After this lesson you will have:
• Insight in and experience with the working of a GPS
•
Gained experience in doing a GPS survey
•
Know how to transfer the data from a GPS unit into Manifold System
•
•
•
obtained insight in and working knowledge of coordinate systems
Know how to geo-register a paper map or (scanned) image
insight in possible other data sources in the Philippines
DURATION
1 day (8 hours) mostly depending on the line needed for a GPS survey
CONTENT AND ACTIVITY
PLAN
Topics to be covered:
1. What is GPS?
2. Importing GPS data into Manifold System
3. Coordinate Reference Systems
11.63
4. Map Georegistration
5. Data sources in the Philippines
SUGGESTED METHODOLOGY
•
Presentations, demonstrations, exercises, movie
RESOURCES NEEDED
•
Laptop/desktop computer, LCD projector and screen;
•
Hand-outs and photocopies of printed materials and documents.
•
GPS unit & cables
REFERENCES
DENR – Mines and geosciences bureau – GIS website http://gdis.denrr.gov.ph/mgbviewer
DNRGPS - http://www.dnr.state.mn.us/mis/gis/DNRGPS/DNRGPS.html,
Department of Natural Resources
Minnesota
DOST – PhilVocs – http://www.philvocs.dost.gov.ph
Deutsche Gesellschaft für Internationale Zusammenarbeit (GIZ) GmbH, Existing
PowerPoint and documents on Manifold GIS trainings, mostly compiled by Jay-ar
Ragub and Jerson Sala
Garmin – About GPS – http://www8.garmin.com/aboutGPS/
Garmin – Etrex Vista HCx Owner’s Manual
Garmin – GPSmap 76CsX Owner’s manual
HLURB
–
Housing
Land
Use
http://www.cookbook.hlurb.gov.ph
Regulatory
Board
Cookbook
–
MANIFOLD System GIS Help,
MANIFOLD
System
GIS
User
manual,
http://www.georeference.org/doc/whnjs.htm
accessed
McNamara, Joel McNamara (2008) GPS for dummies
Namria Website – http://www.namria.gov.ph
Open Street Map Philippines – http://www.openstreetmap.org
Roadguide Philippines – http//www.roasdguide.ph
WIKIPEDIA – GPS - http://nl.wikipedia.org/wiki/Global_positioning_system
11.64
on:
LECTURE POINTS:
Module 11
Session 11.4.1
What is GPS?
T
he Global Positioning System (GPS) is a space-based satellite navigation
system that provides location and time information in all weather, anywhere
on or near the earth, where there is an unobstructed line of sight to four or
more GPS satellites. It is maintained by the United States government and is freely
accessible to anyone with a GPS receiver. The GPS program provides critical
capabilities to military, civil and commercial users around the world. In addition,
GPS is the backbone for modernizing the global air traffic system.
The GPS system is a satellitebased
navigation
system
made up of a network of 24
satellites placed into orbit by
the U.S. Department of
Defence. GPS was originally
intended
for
military
applications, but in the
1980s, the government made
the system available for
civilian use. GPS works in any
weather conditions, anywhere
in the world, 24 hours a day.
There are no subscription
fees or setup charges to use
GPS.
A GPS system consists of
three elements:
1. The space segment
consists
of
the
satellites circling the
earth and emitting
signals to the earth
2. The control segment is responsible for the quality management of
the system by constantly monitoring satellite health, signal
integrity and orbital configuration from the ground.
3. The user segment consists of the user and the GPS unit to collect
the signal from the satellites and use it for your purposes. Four
satellites are required to compute the four dimensions of X, Y, Z
(position) and Time.
GPS satellites circle the earth twice a day in a very precise orbit and transmit signal
information to earth. GPS receivers take this information and use trilateration (a
three dimensional process of triangulation) to calculate the user's exact location.
Essentially, the GPS receiver compares the time a signal was transmitted by a
11.65
satellite with the time it was received. Since we
know the speed in which the signal travels, the
time difference tells the GPS receiver how far
away the satellite is.
Distance = Velocity * Time (radio waves travel
at the speed of light, roughly 186,000
miles/second. If it takes 0.06 seconds for a GPS unit to
receive
a
signal
then
the
distance
is
186,000*0.06=11,160 miles)
Now, with distance measurements from a few more
satellites, the receiver can determine the user's
position and display it on the unit's electronic map.
The 24 satellites that make up the GPS space segment
are orbiting the earth about 12,000 miles above us. They
are
constantly moving, making two complete orbits in less than 24 hours. These
satellites are travelling at speeds of roughly 7,000 miles an hour. GPS satellites are
powered by solar energy and have backup batteries to keep them running in the
event of a solar eclipse, when there's no solar power or where the sun’s solar
radiation is blocked by the earth if the satellites are located behind it. Small rocket
boosters on each satellite keep them flying in the correct path.
I.D. CODE
EPHEMERES
DATA
ALMANAC
DATA
A GPS receiver must be locked
on to the signal of at least three
satellites to calculate a 2D
position (latitude and longitude)
and track movement. With four
or more satellites in view, the
receiver can determine the
user’s 3D position (latitude,
longitude and altitude). Once
the user's position has been
determined, the GPS unit can
calculate other information,
such as speed, bearing, track,
trip distance, distance to
destination, sunrise and sunset
time and more.
GPS satellites transmit a signal which will travel by line of sight,
meaning they will pass through clouds, glass and plastic but will
not go through most solid objects such as buildings, mountains and
dense foliage. A GPS signal contains three different bits of
information - an I.D. code, ephemeris data and almanac data.
1. The I.D. code identifies which satellite is
transmitting information. You can view this
number on your Garmin GPS unit's satellite page,
as it identifies which satellites it's receiving.
2. Ephemeris data, contains important information
about the status of the satellite (healthy or
unhealthy), current date and time. This part of the
signal is essential for determining a position.
11.66
3. The almanac data tells the GPS receiver where
each GPS satellite should be at any time
throughout the day. Each satellite transmits
almanac data showing the orbital information for
that satellite and for every other satellite in the
system.
There are factors that can degrade the GPS signal and thus affect accuracy. The most
important are:
Ionosphere and troposphere delays - The satellite signal slows as it passes
through the atmosphere. The GPS system uses a built-in model that calculates
an average amount of delay to partially correct for this type of error.
Signal multipath - This occurs when the GPS signal is reflected off objects such
as tall buildings or large rock surfaces before it reaches the receiver. This
increases the travel time of the signal, thereby causing errors.
Receiver clock errors - A receiver's built-in clock is not as accurate as the
atomic clocks on board the GPS satellites. Therefore, it may have slight timing
errors.
Orbital errors - Also known as ephemeris errors, these are inaccuracies of the
satellite's reported location.
Number of satellites visible - The more satellites a GPS receiver can "see," the
better the accuracy. Buildings, terrain, electronic interference, or sometimes
even dense foliage can block signal reception, causing position errors or possibly
no position reading at all. GPS units typically will not work indoors, underwater
or underground.
Satellite geometry/shading - This refers to the relative position of the satellites
at any given time. Ideal satellite geometry exists when the satellites are
located at wide angles relative to each other. Poor geometry results when the
satellites are located in a line or in a tight grouping.
Intentional degradation of the satellite signal - Selective Availability (SA) is an
intentional degradation of the signal once imposed by the U.S. Department of
Defence. SA was intended to prevent military adversaries from using the highly
accurate GPS signals. The U.S. Government turned off SA in May 2000, which
significantly improved the accuracy of civilian GPS receivers.
With a GPS unit we always know where we are on the earth with an accuracy of usually up
to 2 meters. Since it is basically also a small computer, we can also save the location of
any point of interest and use it in GIS. This makes GPS a very valuable tool for collecting
data on site that we can use in many GIS applications. In the following paragraphs you will
be given hands on experience with location or the use of GPS, survey and how to import
the data into Manifold System.
11.67
Functions of
the GPS
For a hands-on demo and exercises to work with your GPS,
please refer to the exercises manual. The description in this
paragraph is based on the Garmin 76CsX GPS unit. A short
manual on this unit and the Garmin eTrex Vista HCX are
given on the DVD. For other units, please refer to the manual
of your GPS. The principles will be the same, but the
locations and appearance of buttons and functions may
differ.
A GPS has many options, ranging from playing games to doing a
survey or checking optimal times for fishing or hunting. With
respect to this toolkit, the following options are important, so
please read this before we start with the exercises.
GPS settings
1. After switching on your GPS unit, go to the Main Menu
page. The Main Menu page is accessible from any page by
pressing Menu button twice.
2. Select Setup
. Navigate to the Setup until it is
highlighted using the Rocker Key
3. From the Setup Menu select Units. The following tabs will
be
displayed:
Position
Format,
Map
Datum,
Distance/Speed, Elevation, Depth, and Temperature. From
the Position Format tab, adjust the format by highlighting
the proper format. By default the format is hdd.ddd
(decimal degrees), try to use the hdd mm ss.ss (degrees
minutes seconds) format. Then press Enter
after selecting the proper format.
key
4. Navigate to the Map Datum tab. By default if the GPS is
new, the datum would be WGS 84 (World Geographic
System of 1984), change the datum to Luzon Philippines
if you are navigating using a NAMRIA Topographic Map.
But for this exercise we will just keep it as default the
WGS 84 datum. Then press Enter key. For the
Distance/Speed, Depth, and Temperature try to change
the units to the Metric System (meters/kilometres, etc.).
Setting up the Map Page
By default the Map Page is setup to its factory setting: every
time you navigate using the GPS, the Map Page turns and orients
to where the navigator is heading.
1. In the Map Page, press Menu > Setup Map. The top of the
page contains icons for each setup page. Use the Rocker
key to select a page and move up and down the feature
fields of each page.
11.68
2. With the Map Setup feature selected, press Enter key to
show the list of options for that feature. Each page has a
sub-menu of general options. To access this menu, press
Menu with the preferred setup page displayed.
3. For our purpose, we will just set up the General tab in the
Map Setup page. The General tab contains the setting for
Orientation, Below, Auto Zoom, Detail, and Lock on Road.
4. Use the Rocker key to select the Orientation and press
Enter > North Up. This will always show the Map page
oriented to north as you travel or do your survey. Press
Quit button to Exit.
Starting the GPS
When you start the GPS unit, the first activity will be that the
GPS will search the sky for available satellites and will try to
make fix (connect to available satellites). This is shown in the
satellite screen. This screen provides a lot of information.
The centre of the screen is a
representation of the sky around
with the location of the available
satellites. These are marked with
their name (number) and location
in the sky. The outer circle
represents the horizon and the
inner circle represents the sky at a
45 degree angle.
At the bottom of the screen are
the names (number) of the
available satellites. The longer the
bar, the stronger the signal of this
satellite is, if the bar is white, the
satellite has been found, but a fix has not yet been
computed. If a fix has been made, then the top part of the
screen shows the current location and the accuracy of the
GPS measure in meters. Once a fix has been made, the GPS
is ready to use.
11.69
Please note the indication of the accuracy of the GPS
position in the top right corner. Under good condition, this
should be 5m or less.
Waypoints
Waypoints (also known as Point of Interest or POI) are specific
locations that have been marked with a GPS and can be found
back using your GPS. A waypoint can be anything you want, a
house, a well, a barangay hall, a road intersection, etc. Using a
GPS we can mark a specific location and save it as a waypoint.
The GPS then stores the coordinates of the location and some
other data (time, elevation etc.).
Using a separate logbook or notebook you can note down any
other relevant characteristics and combine these later in your
GIS. Once a waypoint has been saved, we can also use the GPS
to find back the exact location, even if there are no specific
landmarks in the area.
If you make a mistake by placing a waypoint at a wrong location,
instead of editing it, you can also just delete it.
1. From the Waypoints page, select the waypoint you
want to delete > DELETE.
OR
2. If you want to delete all waypoints stored in the
GPS: on the Waypoints page press Menu > Delete
by Symbol (this will delete waypoints of the same
symbol), then press DELETE.
11.70
Note:
Be careful in deleting waypoints, especially
if they have not been downloaded to the
computer. Deleted waypoints cannot be
recovered from the GPS unit.
Tracks
The track feature creates an electronic bread crumb trail or
“track log” on the Map page as you travel. The track log
contains information about points along its path, including time,
location elevation, and bearing (direction). The track log starts
recording as soon as the unit gets a location fix. The percentage
of memory used by the current track log appears at the top of
the Tracks page.
The track features
can be used if
surveying
line
features like roads,
trails, or rivers. It
can also be used to
calculate
the
approximate area of
a certain field (ex.
Area of a rice field,
coconut area, abaca,
marine sanctuary, or
a settlement area)
on site, a feature
that is very useful in
Land Use Mapping. Take note that the GPS must be clear of any
track log data.
The process is simple; just take note that your starting point
must also be your end point of the survey to close the area. You
can also calculate the area later after processing in your GIS
Navigate to a location
Using a GPS we can navigate to a known location or coordinate
11.71
that has been stored in the GPS. Proper Map Datum must be set
and the exercise will involve editing of waypoints.
Note: You can input or edit waypoints even in “GPS
Off” mode.
1. Press and hold the Enter/ Mark key to capture a
waypoint.
2. Do not press Enter again just in the conventional
capturing of waypoint. We have to edit first the
values of the waypoint.
3. Move the Rocker key up and down, left or right to
highlight the desired values to be edited. This will
take a while to learn but just think of it as learning
how to use a new gadget (a new cell phone).
4. Always press Enter key if you are done in editing a
certain value.
5. Input the desired coordinates and name of the
waypoints that the trainers will give.
6. Press OK if you are done editing to save the
coordinate.
7. Now you are ready to navigate.
Navigating:
Go outside where there are no overhead obstructions (an open
field) and turn the GPS unit On. Hold the GPS unit in a proper
way that the receiver will not be blocked so as to have an
accurate GPS satellite signal. Once you have GPS satellites signal
displayed on the Satellite page and a good accuracy (<10
meters), press Find key > Waypoints. The Waypoints list page
will be displayed, select the waypoint that has been saved
earlier. Highlight Go To.
Hint
Many GPS units have a
‘proximity’ option. This feature
sets an alarm when you are
nearing a selected waypoint.
Very useful in finding back
features.
1. Try to use the other GPS pages that can be very helpful in
navigating: the Compass page, the Map page and the
Highway page (the Highway page is automatically
activated once you are navigating to a location).
2. Depending on your actual and derived location and
transport, select either on road (GPS will navigate over
road in your map) or off-road (as the bird flies).
11.72
The
compass
page
guides you to your
destination
with
a
graphic compass and a
bearing course pointer.
The rotating compass
ring
indicates
the
direction
you
are
heading.
You
may
choose between the
bearing pointer and
course pointer. The
bearing pointer indicates the direction to your destination, and
the course pointer indicates your relationship to a course line
leading to the destination. To select between bearing pointer
and course pointer, while in the Compass page press MENU ->
highlight the bearing or course pointer option and press ENTER
to start. Using the boon in your GPS you can get a warning
(beep) when you are nearing a location that you want to find
back. To turn off the navigation, while in the Compass page,
Map page, or Satellite page, press Menu -> Stop Navigation.
11.73
Doing a GPS
Survey
(after HLURB Cookbook at
http://www.cookbook.hlurb.gov.ph)
Know your receiver
A GPS receiver is a new device for many people and you
should familiarize yourself with it. This can save time, resolve
problems in operation, and prevent accidental data loss. Read
the manual. Know the specifications of the GPS model, setup, functions, usage, and the limitations of the gadget. Find
out what operations would result in data loss (reset, delete,
clear track records, etc.), in order to prevent accidental data
loss. Take time to practice using the receiver before
conducting an actual survey. Practice set-up procedures, data
collection, transfer and deletion. Observe battery life of the
GPS receiver. This is important in planning the survey and in
case there are no available spare batteries for the unit.
Plan the survey
A GPS survey will consume time and resources (gasoline for
the vehicle, manpower, etc.). Here are some things to do in
planning the survey.
1. Prepare a map of the area to be surveyed and have it
printed in a size that can be easy to write on and read
while in a moving car or outside the field.
2. Find source persons (local guides or coordinate with the
LGU) for the places to be surveyed if you are not
familiar with the places and plan the survey routes on
the map together.
3. If working in teams, assign which areas to cover and
alternate areas to survey in case the survey is
completed early or if problems arise for primary areas.
4. Consider hazards and risks that may be encountered in
the survey areas (flash flood areas, road conditions,
etc.) to avoid delays and prevent any untoward
incidents from happening.
5. Plan who to bring with the team, what type of vehicle
to use in certain areas (model, marked or unmarked,
11.74
etc. ) to avoid physical (rough road) and social
(presence of insurgents or areas controlled by rival
political parties) constraints. Bring along a resource
person for the areas during the survey if possible.
6. Plan which information you also need to collect aside
from the location (item like description, size, land use,
building type, etc.)
Prepare materials before conducting the
Survey
•
Prepare data sheets for the GPS readings. This serves as
the backup for the data and a much easier way to write
down notes. Use a clipboard folder for writing data in
the field. An example of a GPS data capture sheet is
found in session 6.04 of the HLURB GIS Cookbook. (see
http://www.cookbook.hlurb.gov.ph)
•
Bring spare batteries; otherwise make sure to fully
charge the battery before going to the field.
•
Bring a digital camera if available and take pictures of
the areas being surveyed.
Before leaving for the survey
•
Check the weather if GPS survey is possible.
•
Check if all materials are good and ready to go to avoid
any delays.
•
Initialize and set-up the instrument before going out to
the field
•
Turn on the GPS receiver and apply appropriate
settings. Find an open space with a good view of the sky
and wait for the GPS to set-up. Once the GPS is set-up,
take some test readings. Take note of the accuracy of
the test readings. This will serve as an estimate for the
next readings.
Getting the readings
•
Locate an open area on the area to be surveyed. If the
area is a small building (less than or equal to two
floors), find an area near the structure that will still
have a good view of the sky. Note that thick canopy for
trees are also contributing to the low GPS signal
strength.
•
Get GPS readings on the area and observe the accuracy.
Wait for the accuracy to stabilize, at least to a meter
level and take note of the highest accuracy level
possible. Many GPS devices have an option for averaging
(AVG). This feature takes many readings from one
location and by doing so improves the accuracy of your
reading. Save the reading when the accuracy is within
11.75
the highest stable reading possible.
•
Record the readings on the data sheet and the point
number recorded in the GPS.
•
Take pictures of the area using a digital camera and
record the photo number/s in the data sheet for the
corresponding point.
Notes
11.76
•
Be consistent in what you mark: take readings from the
same area per feature type. (e.g., flagpole for all
schools, front of building for all Barangay Halls).
•
Stay away from tall buildings and sources of strong
electrical current or interference (e.g., transmission
lines, substations, electrical generators, cell sites);
•
Track reading is a feature common to GPS receivers. It
records the route of the survey as points that can also
be downloaded into the computer. Turn this feature on
whenever available. Clear track readings in the receiver
whenever starting a new day for survey but before doing
so, make sure it is already downloaded and saved in a
computer.
•
Take note that track readings (called ‘track logs’ in
some models) is different from point readings
(‘waypoints’ in some GPS models) to prevent any
accidental deletion of other data stored;
•
Set-up the GPS using the above procedure whenever it is
turned off (e.g. lunch break);
•
Download the readings (points and tracks) to a
computer after a day’s work.
•
If you are doing a big survey, it may be good to let the
GPS take care of the numbering of your waypoints. Do
not change these since the GPS will automatically
increment and add unique numbers. In your log file or
datasheet you can add descriptive information on the
waypoints (attribute data).
•
Make sure that you collect all the information you need
in one lesson since going back to collect additional
information is bothersome, expensive and time
consuming.
•
The compass page also is activated during navigation,
but you must be in motion to let the GPS satellites
calculate where you are heading to give you the bearing
towards the desired location.
Hint
Your GPS unit comes with some free data from the Philippines.
However, this free data is low in quality and completeness. In order
to receive a good base map of the Philippines (for Garmin users),
you can join the free GPS mapping project Roadguide Philippines at
http://www.roadguide.ph/. After registration you can download a
good GPS map of the Philippines. Using MapSource you can upload
it to your device. You are also invited to contribute your own data. If
you do that you can place your municipality on the map (and
stimulate tourism because suddenly GPS users can find roads,
restaurants, resorts etc.) and in return you can download an even
better map. A win-win situation!
Another source of update for your internal base map of your GPS
device
is
through
this
link
http://esambale.wikispaces.com/osmphil_garmin. This site provides
the road data from openstreetmaps - a free worldwide map, created
by people like you. The data is free to download and use under its
open license. You can create a free account if you register to
http://www.openstreetmap.org/ and start adding your own data set
to map out your area. The site regularly updates its data so it is
better to check from time to time if there is one.
Now it’s time to go outside for a demo and do a number of
GPS exercises:
•
Check the GPS settings
•
Mark a location with a waypoint
•
Change the characteristics of a waypoint
•
Set up a track
•
Find back a location
•
Delete a waypoint
•
Collect waypoints for georeferencing
Exercise 2.1
Introduction to GPS
e.
LECTURE POINTS:
Module 11
Session 11.4.2
Importing GPS data into Manifold System
11.77
T
here are a number of ways to import data from the GPS into the GIS and
with developing technologies and insights these methods are changing. This
manual will describe two different methods. These methods are necessary
since not in all cases does Manifold System GIS recognize the GPS if it is connected
to a computer. The first method is by directly importing data from the GPS into
Manifold System GIS, the second one is by using a free support program called
DNRGPS.
Working
method using
Manifold
System GIS
To use the data collected with our GPS in Manifold System,
they have to be imported. In order to do this we have to
open the GPS pane using tools→customize→GPS console.
The following pane will appear
Next connect the USB unit to the computer using the USB
cable and switch on the GPS.
When the GPS is connected, use the first button
to
connect to the GPS (or to disconnect). If the GPS unit does
not automatically appear, then press the properties button
and change the settings
Make sure to select the right device (GARMIN USB GPS) (for
other brands these settings may change. Please refer in
those cases to the Manifold System help on how to connect a
11.78
GPS).
Hint
If your Garmin GPS unit is not
automatically discovered by Manifold
System, make sure that you have the
correct USB drivers installed. Please refer
to the CD with the Garmin software for
those drivers. Alternatively, if you install
Map Source from Garmin, the correct USB
drivers will be installed.
If the GPS is connected, download the survey data using the
download
appears:
waypoints
button
.
The
following
menu
Check all (download waypoints, routes and tracks) and click
OK. Wait until the DATA DOWNLOAD is complete and
automatically your GPS Data will be on the Project Pane.
Then press the connect/disconnect button to safely remove
your GPS device and then switch OFF the GPS to conserve
battery. Press the connect/disconnect button before
physically disconnecting the unit to avoid data corruption
and error to your device.
11.79
In the project pane, there is a new Drawing component
named GPS Data and if desired, this can be renamed to a
more logical name. To rename the dataset use the right
mouse button on the component and select Rename
Make sure that the box for “Adjust names of dependent
components” is checked so that the renaming is done
consistently for all components. After this, it is good practice
to make sure that the data are set in the right coordinate
system (more on that in Lesson 4). In Manifold System this is
a two-step process. First make sure that the current
projection is assigned correctly the next step is to change it
into a new one.
1. To do so, again right mouse click on the name of the
component in the project pane, and select Assign
Projection.
11.80
2. Click Ok to assign the projection and then right click
again on the name of the component in the Project
pane, but now select Change Projection. Change
from the current Latitude/Longitude to UTM
(Universal Transverse Mercator).
3. Click on the checkbox in front of standard to close
this tab and open the tab for Universal Transverse
Mercator
4. Navigate to Universal Transverse Mercator – Zone 51
(N)
5. In the field underneath Just leave the Datum as is,
World Geodetic 1984 (WGS84)
6. It should look like this (see next page):
11.81
And click OK
To finalize the Projection: Right click again GPS Data, then
click Assign Projection…and click OK.
Your drawing with GPS data is now ready for use.
Depending on the data of the survey it may contain the
following data:
•
Waypoints (as points)
•
Tracks (as lines)
•
Routes (as lines)
Exercise 2.2
Import GPS data into Manifold
f.
11.82
Working
method using
DNRGPS
DNRGPS is an Open Source program that provides users with
the ability to transfer data between handheld GPS receivers
and GIS software. DNRGPS: accommodates newer GPS
models; and is available for the Open Source community to
modify and share. The program can be downloaded here:
http://www.dnr.state.mn.us/mis/gis/DNRGPS/DNRGPS.html
Note:
If you don’t have internet, a version can
also be found in the software folder on the
DVD that comes with this toolkit
Installation is simple: DNRGPS is a self-contained program
which means it can be run from anywhere – a hard drive,
an usb drive, a network location. Simply unzip the DNRGPS
folder and place in the location of your choice.
11.83
The working procedures are as follows:
1.
2.
3.
11.84
Connect your GPS unit to the computer through a USB cable
and turn the GPS unit ON.
On your desktop shortcut icons, double click the
dnrgps program which is installed in your computer.
The DNR GPS program will open; click File → Set Projection…
4.
5.
The DNR GPS Properties window will appear.
Select WGS 84 as Datum and UTM zone 51N as
Projection.
Close the DNR GPS Properties window. Click File again → Load
From → File… to browse your GPS data.
11.85
6.
7.
11.86
The Load From File window will appear, go to Removable Disk
which is your GPS internal memory, click on the dropdown arrow at
the right side lower part and select GPS Exchange Format (*.gpx) as
the default file format of the GPSMAP 78s, then find the Garmin
folder and double click to Open.
Under Garmin folder, double click GPX folder to Open.
8.
Now, the saved data are in this folder from the GPS unit
indicating the dates being modified. For example, select
Waypoints_24-APR-12.gpx as the latest GPS waypoint data and
click OPEN button.
9.
The Load From File(s) Complete dialogue box will appear. Click OK.
11.87
10.
11.
11.88
Click File again → Save To → File…
The Save to File window will appear, navigate to the desired directory for
saving from gpx converted to shape file data. Then put a File name e.g.
GPS Data_April242012_Waypoints, and the Save as type: must be ESRI
Shape file. Click Save button.
12.
The Save to File successfully…dialogue box will appear, click OK.
The downloading of tracks and routes can be done in a similar way as the waypoints.
Exercise 2.3
g.
Import data using DNRGPS
Hint
Both Manifold GIS and DNRGPS can also
be used to upload your GPS Roads to be
checked and location to be visited can be
prepared in GIS and used in your GPS
11.89
Possible
errors
When GPS points don’t align with GIS Data:
It’s most likely a projection issue if:
•
There are huge errors…data points do not overlay
•
Features could be displayed in wrong state or
hemisphere!
It’s most likely a datum issue if:
•
GPS data overlays with GIS data, but off by several
meters
•
Differences between Luzon 1911 and WGS 84 can
be as much as 200 meters
This creates problems when doing analysis especially with
Land Use and Parcellary information.
11.90
LECTURE POINTS:
Module 11
Session 11.4.3
Coordinate Reference System
D
rawings and images can be utilized in Manifold System from many different sources.
Drawings come in many different sizes using different scales. Images can be
everything from a photograph scanned on a desktop scanner at 1200 DPI, where one
pixel is less than a thousandth of an inch in size, to a data set acquired by satellite
where every pixel is representing a square kilometre of the Earth’s surface. It may be clear
that if we want to use different drawings or images together in a map we will often ask the
system to enlarge or reduce them in some way so their scales match up. If we want to use
drawings or images together in a map, we will also need some way of specifying the
desired geographic position of the images so that Manifold System can draw them correctly
aligned together with drawings or other images in a map window.
Drawings are for the most part simply lists of the X, Y coordinates needed to draw the
objects they contain. If we make a drawing on a piece of graphing paper with a fine grid,
we could measure the X, Y coordinate of every corner point of every rectangle by counting
the little boxes from the origin in the lower left corner of the paper, just like we do with
graphs. This means that every location in our map can be described with a pair of X and Y
coordinates.
The list of coordinates will allow us to reproduce the drawing in the future, but it does not
tell us the size of the paper used or what each "unit" is intended to represent in real life.
For example, if we originally used a graphing paper with a one millimetre mesh to measure
coordinates and then one day re-created our drawing using graph paper that had a 1/8-th
inch mesh the two drawings would not be the same size. Likewise, it makes a big
difference if each unit is supposed to represent one inch or one centimetre.
We could add some metadata ("data about the data") to the drawing by writing in a note:
"one drawing unit equals one inch" to tell us the scale. This would allow us to make
measurements in our drawing and to compare those measurements to real life. "Smart"
drawing formats used to save digital drawings will save the intended scale together with
the lists of coordinates. This allows programs that read such formats to automatically have
the correct scale into account. Surprisingly many formats fail to take this simple step. We
can specify which way our drawing faces in "real life" by assuming that North is always up
in the drawing. By doing this, we can assume that Y coordinates going in the positive
direction are headed North and that positive X coordinates are headed East. We could also
add metadata that specify where the drawing is located on the Earth. Such a metadata is
called a projection.
Geographic projections are a way of showing the curved surface of the Earth on a flat
surface like a piece of paper or a computer monitor. Imagine we make a globe out of a
flexible material with a world map painted onto the material. Now, let’s cut the material
and try to flatten it. If you’ve ever tried to flatten a deflated ball you know this is not
possible to do without stretching the flexible material in some areas and compressing it in
others. If we deform the peeled "skin" of our atlas globe in this way to make it flat we will
end up changing the shape of continents and other items illustrated in our world map.
11.91
The earth (as a globe) peeled to present as a flat area (from nonprofitgis.org)
There is no single way of projecting the curved surface of the Earth onto a flat sheet that
does not cause some distortion, and there is no one projection that is suitable for all
purposes for which people use maps. However, for virtually every usage there are
projections that minimize distortions of importance for that task. For example, if one
needs to measure areas in a flat map there are projections that will guarantee the area
contained by various shapes is correct even if the shapes of the objects shown appear quite
differently than they do on a globe. Other projections do a good job of showing continents
in a shape similar to that seen on a globe even though they do not allow for accurate
measurement of areas.
Any shape that is curved in only one direction can be unrolled into a flat map without
distorting the appearance of objects drawn on it. For example if we take a cylinder and cut
it lengthwise we can unroll the cylinder into a flat map. The trick to any elementary
projection is to place the Earth within such a shape and to "project" lines out from the
Earth onto the shape to show where to draw the projected outlines of items on the globe.
We can then "unroll" the shape and see our projected map on a flat surface.
The first and most obvious such projection to use is a simple Cylindrical Projection. Place
the Earth inside a big cylinder that touches the Equator and then transfer points on the
globe to the cylinder. The simplest way to do this is to imagine the cylinder is graph paper
with 360 boxes in circumference and 180 boxes up and down. If we use the longitude and
latitude coordinates in degrees of a place on the sphere and transfer it to our cylindrical
roll of graphing paper, we end up with a map like the above (above figure). Since one
11.92
point needs to be the centre of the unrolled cylinder, nearly universal usage is to use the
intersection of the Equator with the zero Meridian running through Greenwich, England.
We can then count degrees plus and minus 180 degrees in longitude and plus and minus 90
degrees in latitude. This is called the Geographic or Latitude / Longitude projection. We
can think of it as our default projection. It produces a good effect in areas near the
Equator, but results in immense distortion close as measurements approaches the poles.
There are other ways of transferring points from the surface of the globe onto an enclosing
cylinder. Most of these, such as the Mercator Projection, use some mathematical formula
to alter the ratio between degrees of latitude on the globe and vertical measurements on
the cylinder. What they all have in common is that accuracy is good near the Equator
where the cylinder is very close to the globe. To a greater or lesser degree all cylindrical
projections centred on the Equator fall off in accuracy as distance from the Equator
increases. If we wish to make maps of places along the Equator we could use a cylindrical
projection and just show those regions. What would be shown in those maps would be
relatively free of distortion. One problem with this is that the Equator for the most part
lies over water whereas the greatest demand for maps is in populated zones. A quick
glance at a world map shows that most populated zones occur in a North-South direction.
Turning the cylinder so that it is tangent to the
Earth along a meridian (longitude line) instead of
tangent to the Equator results in what is called a
Transverse Cylindrical Projection. We can now
make local maps anywhere along the darker,
North-South line of tangency and if the maps are
not too big they will be relatively free of
distortion. However, this only works along the
line of tangency. If we pick a North-South line
running through Athens we can make maps all the
way from Scandinavia down the length of Africa,
but any maps using this projection in North and
South America would be hopelessly distorted.
One possible solution is to use not one projection, but many transverse cylindrical
projections with the cylinder rotated slightly along the Equator. In fact, one scheme of
mapping the Earth called the Universal Transverse Mercator (UTM) does exactly this. UTM
maps the Earth with a transverse cylinder projection using 60 different lines, each of which
is a standard "UTM Zone". By rotating the cylinder in 60 steps (six degrees per step) UTM
assures that all spots on the Earth will be within 3 degrees of the centre, tangent line of
one of the 60 cylindrical projections. To map any spot on Earth in UTM, one picks the UTM
Zone centreline that is closest to it and then makes a map using that cylindrical projection.
The illustration above shows a small section of
the earth near the tangent line projected onto
the cylinder, and then the cylinder being
unrolled into a flat sheet. If we want to save
the X, Y locations of points on our flat sheet we
can now measure them as though the flat sheet
were graph paper and use the resulting
coordinates in a digital, flat map.
There are many more projections in the world,
but for this manual, we will not discuss them.
The Manifold System Help Menu has more
information on these projections.
11.93
Apart from the projection, we also need a Datum in our GIS to make sure our maps are an
accurate representation of the world. While a projection is used in mapping to define the
earth on a flat surface, a datum is used to describe the actual shape of the earth in
mathematical terms.
Datums in the
Philippines
Where the projection describes the way the round earth is
transformed on a flat or two dimensional medium, these
parameters are valid for the whole earth or large parts of it.
In order to make this model fit better to the real world at a
specific location, we need to add detail and this is done using
a datum. A datum is a model of the earth that is used in
mapping. The datum consists of a series of numbers that
define the shape and size of the ellipsoid and it's orientation
in space. A datum is chosen to give the best possible fit to
the true shape of the Earth. There are a large number of
datum in use. Many of them are optimized for use in one
particular part of the world. An example, familiar to GPS
users, is the WGS-84 datum. WGS-84 is an example of a
datum that is used globally, but there are many locally or
nationwide used datums as well.
Latitude and longitude are commonly used to refer to a
specific location on the surface of the Earth. It is important
to keep in mind that latitude and longitude are always
specified in terms of a datum. The latitude and longitude of
your current position are different for different datums.
However, some information has been provided. Please see
Modules 2 for integration of climate change adaptation into
local development planning, 3 for disaster risk reduction and
management, 8.1 for integrating FLUP into CLUP and CDP,
and 8.2 for CFRM-CLUP integration.
There are four common datums that are widely used in the
Philippines:
Luzon 1911 is the most commonly used in the Philippines
and most of the maps produced by NAMRIA are in this datum.
It uses the Uses Clarke 1866 ellipsoid and its origin is located
just south of Luzon at Balanacan, Marinduque Island.
Luzon Philippines, uses the baseline data as Luzon 1911, but
is also adapted for use with GPS.
Luzon Philippines (excluding Mindanao), Luzon-Mindanao is
not a separate datum; it is the Luzon 1911 datum with
different WGS84 transformation parameters. Extreme care
should be taken to ensure the use of the correct
transformation. Since a point from the Luzon (sometimes
called Luzon-Philippines) datum transformation will be
approximately 10 meters north and 1 meter west of the same
point transformed using the Luzon-Mindanao transformation.
Some software programs identify Luzon-Mindanao as a
11.94
separate datum. This is incorrect.
WGS 84 is a commonly used worldwide datum and it has been
developed from satellite measurements of the earth. Since
satellite images are often published using this datum and the
growing use of GPS, it is rapidly becoming the preferred
datum around the world. Unlike most datums, the origin for
WGS84 is the centre of the earth. Transformation parameters
to convert from most national or local datums to WGS84 are
published and can often be found in GIS software.
Apart from this there is the Philippine Reference Datum of
1992 or PRS92. This was developed in 1992 by NAMRIA and it
is not technically a new datum but an adjustment of the
Luzon datum. PRS92 uses a total of 467 GPS locations, of
which 330 are first order accuracy. The Luzon datum location
network consists of survey data of second order accuracy or
below. NAMRIA has published transformation parameters for
PRS92 to WGS84 but there is no published accuracy
assessment. This datum is gaining in popularity in the
Philippines and the PRS92 can be installed in MANIFOLD
SYSTEM GIS using the data in the DVD with additional
information. The parameters and instructions have been
downloaded from the NAMRIA website.
11.95
Projection
Transformation/
Changing
Projections
When a drawing or image is loaded that does not contain
projection information, the software always asks to verify
the original projection. After this, Manifold System is able to
combine images and drawings having different projections in
one map component “on the fly” – that is, the GIS software
will automatically translate the internal drawing or image
coordinates into whatever Projection is being assigned to the
Map component without the need in changing the
component’s actual Projection.
To verify the original projection:
1. Right click the component in the Project pane,
choose Assign projection.
2. The assign projection window opens:
3. Choose the original projection from the list. Press OK.
4. Be sure to verify if the coordinates make sense after
assigning another projection. Check the coordinates
of the mouse pointer in the Status bar portion which
is located at bottom of the main Manifold System
window. In the figure below it is in degrees minutes
seconds.
11.96
When desired, the projection of the source data can also be
changed after the original project has been verified.
1. Right click the component in the Project pane,
choose Change projection.
2. The assign projection window opens and then choose
the target projection.
3. Press OK.
More information can be found in the help files:
Help > Index > type georegistration
Information on projections can be found on:
Help > Index > type Projections Tutorial
Note:
Without the correct projection, your data
may be projected incorrectly or may even
turn out to be unusable! Therefore it is
always important that you make sure that
you know the projection, especially if you
download data from the web.
Exercise 3.4
h.
Change the projection of a drawing.
11.97
LECTURE POINTS:
Module 11
Session 11.4.4
Map Georegistration
W
hen we obtain a dataset that we want to use in GIS, we have to make sure
that it is located at the right location of the earth and that it is in the right
coordinate system. In some cases (purchased data) this will be the case,
but in others we have to do this ourselves. For instance if we want to use scanned
paper maps, data exported from AutoCAD and screen captures from the PC. The
process to fix these data on the earth is called geo referencing or georegistration
and can be described as the process of adjusting one drawing or image to the
geographic location of a "known good" reference drawing, image, surface or map.
For a quick discussion, this topic and other georegistration topics use images as
examples. However, the same procedures apply when georegistering other
components such as drawings or surfaces.
The drawing, image, surface or map being used as a reference is called the reference
component. The drawing, image or surface being adjusted is called the target
component. The example below shows the general idea.
Control points are used geo-register images, surfaces, drawings and labels components.
During geo-registration the target image will be re-projected to match the reference
drawing using the control points as a guide. The image above shows conceptually how
control points in a reference drawing are matched up with equivalent control points in a
target image.
Use the Control Points pane to add new control points to a drawing, image or map. Control
points are used to georegister a target image or drawing to the same geographic location
and projection used by a reference image or drawing. The Control Points pane can be
opened with Tools -> Customize - > Control Points. When opened, it looks like this:
11.98
The Control Points pane always
shows a list of control points
defined for the active image or
drawing
together
with
their
coordinates. When we click on a
different window the Control Points
pane will switch context to show
any control points defined for the
active window. The Control Points
pane is also used to rename control
points or to change their location by
changing their coordinates. We can
click into the Name field to change
the name from the defaults, if
desired. To change the coordinates
of a control point we click into their
X / Longitude or Y / Latitude fields.
The following are the main options in the Control Points Pane
New Control Point - Add a control point by clicking with the mouse in the
component window. A new control point will be added in the Control Points pane.
New Control Point - Add a control point by clicking with the mouse in the
component window. A new control point will be added in the Control Points pane.
New Control Point - Add a control point by clicking with the mouse in the
component window. A new control point will be added in the Control Points pane.
New Control Point - Add a control point by clicking with the mouse in the
component window. A new control point will be added in the Control Points pane.
For more information, please use the help and search for Control Points
Control points are matched by their name. For example, the spot marked by a
control point named "ControlPoint2" in the reference drawing will be matched to
the location in the target image marked by a control point that is also named
"ControlPoint2." Control points may be called by any names so long as the names
used for control points within the reference component or target component
correspond to the same location. For example, we could use the name "Church
entrance" for control points in both the reference component and the target
component. These two points with the same name will be matched during the
geo-registration process. The choice of names is free. Some users prefer long,
descriptive names while others prefer short names.
11.99
Adding a Control Point to a Component using the Mouse:
1.
Import both the image to be geo-registered (target component) and the
reference (either drawing or image).
2.
Then go to View-> Panes-> Control Points. This opens the Control point
pane.
3.
Open one of the components. Zoom into the location where the control point
is to be located if greater accuracy is required. Use the Navigation toolbar for
these OR the wheel mouse button for faster zooming.
4.
Click on the New Control Point button (
toolbar.
5.
Click the location in the component where the control point should be. It will
appear in the drawing and a new control point row with coordinates will
appear in the Control Points pane.
6.
If the name assigned to the control point by default is not logical, double click
onto the name to change it.
7.
Now do this alternately for both the source and the target component until
you have at least 3 (more is better) matching points. Best is to scatter the
points across the image and around all the borders.
8.
When enough points have been entered, press the registration button (
)
and the Georegistration Dialog opens. Enter: Reference - The name of the
drawing or image to be used as a source of control points to be used as
reference points.
9.
Method – Choose the algorithmic method used for triangulation: Affine
(triangulation), Affine (scale, shift, rotate), Simple (scale, shift) or Numeric
(polynomial). For less distorted mass Affine (scale, shift, rotate) is normally
sufficient. In case it does not give good results try numeric (polynomial) with
order 2.
) in the Control Points pane's
10. Press OK or refer to Help-> Index-> type control points for more advanced
settings.
11. The image is being registered, this can take a while.
12. It will assume the coordinate system of the reference image/drawing.
Exercise 3.5
Georeference a map to GPS obtained coordinate points.
i.
Exercise 3.6
Georeference a scanned (or downloaded) topographic
map using known coordinates.
j.
11.100
Adding online images in Manifold
With the growth of online images like Google Earth and Bing Maps, there are now also
options to have a live connection with these services in Manifold System. The relevant data
can even be saved and used as background image when you are not on-line.
1. Open a drawing of the area
2. Change the scale to a relative large scale (i.e. from 1:8,000 to 1:15,000) in
order to prevent too long loading times
3. Select file→link→image from the menu. A Link Image window will open. From the
Files of type box select Manifold Image Servers:
4. A Link Manifold Image Server Data dialog box will open showing the latitude and
longitude of map image that will be downloaded. Note: the values of longitude
and latitude can be changed.
11.101
5. Under the Server box select Virtual Earth Satellite Image or any other server of
preference:
6. Press the refresh button at the far right of the box and wait until the connection
to the internet server is established.
7. When the connection is complete press OK tab. The linked image layer (named
Virtual Earth Satellite Image) will appear in the project pane. Double click the
linked image layer (Virtual Earth Satellite Image) to view the image. Note: The
linked image below is non-editable, however can still be used for overlays. The
projection is fixed to Mercator with WGS84 datum.
8. Zoom-in a small area of the image to increase its resolution and Pan around the
image to increase its overall resolution.
In order to create an offline copy of the image, you can copy the image (in the project
panel, right mouse click on the layer and select save as and then past as image). An
editable image will appear named Virtual Earth Satellite Image 2. Note: Change the
projection and datum of the image to match that of the drawing layers.
11.102
Sideline:
When collecting data from sources on the internet like Google maps, Yahoo Maps or
Bing Maps, in many cases you end up with many screen captures that need to be
combined. To prevent this you can use a tool like Mappuzzle where you can give
coordinates of a centre point and a level of detail and it automatically gives you the
Image that can be directly used. It is even possible to search can even give the name of
a city (although that often leads to errors). It looks then like this:
Mappuzzle can be downloaded here:
http://www.softpedia.com/get/Multimedia/Graphic/Graphic-Others/Map-Puzzle.shtml
The disadvantage is that Mappuzzle only downloads rectangular areas. If a more
flexible area is needed, than stitching the images together is the only option. The
following makes use of Microsoft Image Composite Editor as an example. Microsoft ICE
can be downloaded free from the following link:
http://research.microsoft.com/en-us/um/redmond/groups/ivm/ice/.
Microsoft Image Composite Editor is an advanced panoramic image stitcher. Given a set
of overlapping photographs of a scene shot from a single camera location, the
application creates a high resolution panorama that seamlessly combines the original
images. Microsoft ICE is available for both 32- and 64-bit Windows Operating Systems.
continue next page…
11.103
…continued from last page
In Microsoft Image Composite Editor either drag and drop all of the four (4) scans OR
into one (1) single image. To do it, follow these steps:
1. In Microsoft ICE , Click on File -> New Panorama and select the 4 scans
as shown in the picture below
Click on Open button and instantly, the software will merge/stitch the
scans together.
This will take a while in merging the scans together depending on your
computer’s performance.
2. After the process, a new file will be displayed in the screen. Note that
this is not yet permanently saved; please save this merged image so you
can access it later in other applications. Otherwise, repeat the process
of Merging/Stitching. In the Export portion set the slider bar to 100 so
that the image quality will remain as how it has been scanned.
3. Save the new merged image by clicking the Export to Disk button
located in the right portion of the Microsoft ICE window.
11.104
LECTURE POINTS:
Module 11
Session 11.4.5
Data sources in the Philippines
E
ven though the use of GIS is growing strongly in the Philippines, lack of
quality data is big hindrance for the further development of the field. This
means that in almost all cases a GIS project starts with the collection and
processing of the data. Many of the data that are needed for a CLUP need to come
from different Government Agencies and more often than not, more than one trip
to these Agencies is needed to collect the relevant data. For this reason it is
important to have knowledge of those agencies where GIS data can be obtained
GIS data. The succeeding discussion will give a short introduction to those
organizations, but we would like to emphasize that the GIS field is growing fast
and this data may be outdated relatively soon.
There is not (yet) a standard GIS data warehouse in the Philippines although steps are now
being taken. This means for now that the sharing of data (and therefore also the data
collection) is not yet standardized. It may therefore payoff to ask around with co-workers
and other GIS users if they have data available before venturing into expensive trips and
requests. Most GIS users are willing to share data and knowledge! Please check the extras
on the DVD for an article of the development of a GIS clearing house in the Philippines.
General data
NAMRIA
The National Mapping and Resource Information Authority
(NAMRIA) surveys and maps the land and water resources of
the Philippines. One of its major mandates is to provide both
the public and private sectors with mapmaking services as
well as geographic and resource information. Apart from the
topographic map, NAMRIA is also a source for satellite images
and all kinds of different maps such as elevation maps, land
cover maps and nautical charts. An overview of maps and
services can be found in their catalogue on their website
(http://www.namria.gov.ph/).
NAMRIA
also
provides
trainings and a number of services with respect to GPS and
surveying. The NAMRIA topographic maps can be downloaded
as high quality JPG from
http://www.namria.gov.ph/topo50Index.aspx.
By using the coordinate information on the corners of the
map and the projection which is defined in the legend, they
can easily be georegistered them. For practical use, it may
be wise to use a photo editing program to cut off the borders
of the map so that only the actual map areas remain.
11.105
Natural
Hazards
DENR - Mines and Geosciences Bureau
The DENR-MGB, as steward of the country's mineral
resources, is committed to the promotion of sustainable
mineral resources development, aware of its contribution to
national economic growth and countryside community
development. The DENR-MGB is maintaining a GIS based
website where a number of natural hazard maps for the
whole country http://gdis.denr.gov.ph/mgbviewer/ can be
reviewed.
Below are the Maps that are included in the Geological
Database Information System, and the Layers that are
included in each.
Barangay Point
o
Barangay Points
Index
o
1:50,000 scale Geohazard Map Index
o
1:50,000 scale Geological Map Index
Index Labels
o
Geohazard Map Index Labels
o
Geological Map Index Labels
Geohazard
o
Flooding
o
Landslides
Geology
o
Geological Map of the Philippines
o
Drains
o
Roads
o
Shoreline
o
Water bodies
o
Mining Tenement Map
o
Mineral Resources
From (the MGB viewer manual,
http://gdis.denr.gov.ph/mgbviewer/MapViewerManual.aspx)
The Maps can be downloaded, but as a bitmap or image and
for use in GIS, these needs to be georegistered and then
traced. It is advisable to contact your regional MGB office
first to see if the GIS data are available.
11.106
PHIVOLCS
The Philippine Institute of Volcanology and Seismology
(PHIVOLCS) is a service institute of the Department of
Science and Technology (DOST) that is principally mandated
to mitigate disasters that may arise from volcanic eruptions,
earthquakes, tsunami and other related geotectonic
phenomena. From the main page of the website from
PhilVocs, there is a tab where for reviewing and downloading
maps with natural hazard data. As with the MGB, these data
are not yet in GIS format, but need to be geo registered and
traced. Also here, please contact your regional office first for
the availability of these maps in GIS format. The website
(http://www.phivolcs.dost.gov.ph/) contains the following
maps:
Standards
Other Data
Sources
Philippine Fault Zone Maps
Active Faults and Trenches
Earthquake-Induced Landslide
Liquefaction Susceptibility Map
Tsunami Prone Areas
HLURB (http://www.cookbook.hlurb.gov.ph). The Housing
and Land Use Regulatory Board has prepared a cook book for
Local Government Units which can be considered a manual on
how to create Comprehensive Land Use Plans. It also
describes some standards for the use of colours in maps. Even
though the standard is not complete we strongly advice to
adhere to these standards. The SIMPLE procedures also
adhere to the guidelines as set by HLURB.
Most of the national government agencies are now using GIS
and have data that are needed or useful with respect to the
preparation of Comprehensive land use plans. Please contact
the NGA in your region for details and availability of data.
Many of these data are prepared for use at provincial or
regional level and therefore may also be available at or
through the PPDO in your province.
Also the internet is a source of many GIS (related) data and a
Google search on GIS data Philippines may reveal many
sources of data. However useful (and in many cases free), the
quality of these data is in many cases revealed by their price.
For instance many free datasets of the Philippines show a rail
road in Cebu which is no longer operational since the 2nd
World War. These data from the internet can therefore be
only considered for reference purposes and in no way as
correct.
11.107
NAMRIA and DENR have taken the lead in preparing a proposal
for a National Spatial Data Infrastructure (NDSI). The
Philippines’ National Spatial Data Infrastructure (NSDI) is a
national initiative to provide better access for all Filipinos to
essential geographic information. The primary objective of
the NSDI is to ensure that users of geographic information,
who require a national coverage, will be able to acquire
complete and consistent datasets to meet their
requirements, even though the data is collected and
maintained by different agencies. The National Spatial Data
Infrastructure helps ensure all such agencies concern
themselves with the national interest, thereby maximizing
government’s return on investment in data collection and
maintenance. The NSDI will help achieve better outcomes for
the country through better economic, social and
environmental decision-making. If this project pushes through
it would be a huge boost in stimulating GIS through improved
data availability.
11.108
For now, the FLUP Mapping Guide Book by Galido-Isorena at al. gives the following
overview of possible data sources when starting a GIS based CLUP:
Data/Map Name
Source
Scale
Date
Key features
Reprints of 1950s
aerial photographs
with some of its
features updated
Elevation, river, roads,
political boundaries,
location of towns, name
of barangays
Sub watershed & Drainage Map
Topographic map
NAMRIA office in Fort
Bonifacio and
sales offices at selected
DENR offices
1:50,000
Bigger Watershed Map
Topographic map
NAMRIA
1:250,000
Elevation, river, roads,
political boundaries,
location of towns, name
of barangays
Various scale
The boundaries are
indicated as technical
description. Only a few
of these proclamation
or RAs have
accompanying maps
Political boundaries,
location of town
centers and barangays
Administrative Map
Proclamations or
Republic Acts
creating new
municipalities or
provinces
Philippine Gazette
Copies from Congress
or Malacañang
archives
Provincial and
regional maps
NAMRIA
Most printed in
the 1990s
Land Classification Map
Land
classification
NAMRIA Land
Classification Division
Project control map of
the Community
Environment and
Natural Resources
Office (CENRO) and
Provincial Environment
and Natural Resources
Office (PENRO) of
respective areas
Scale ranging
from
1:20,000,
1:50,000
and 1:250,000
1:50,000
1:100,000
Depending on the
date of Ground
survey
Extent of alienable and
disposable (A&D) and
the
forestlands (FL)
1:250,000
1988
The two maps from the
SSC and JAFTA show
about 20 land cover
categories; however,
the two map data
cannot be directly
compared because they
Land cover
Map from SPOT
satellite images
classified by SSC
(Swedish Space
Corp.)
NAMRIA
11.109
Data/Map Name
Source
Scale
Map from 1993
Landsat
(produced by
JAFTA (Japan
Forest
Technology
Association)
NAMRIA (available only
for Luzon and Visayas
1:100,000
Vegetative cover
map for
Mindanao
EcoGov2 Project
1:50,000,
Mindanao Maps
1:100,000 and
(available also in digital 1:250,000
form)
Date
1993
2004
Key features
do not have similar
categories
This map is a colour
composite of bands of
Landsat images used
for land cover
assessment and are not
presented as classified
polygons
Land cover categories
used by EcoGov are
largely based on the
SSC map although some
of the categories were
aggregated
Land allocation and tenure
Protected Areas
proclamation
or Republic Acts
Copies from Congress
or Malacañang archives
Various
Scales
• Websites of law
resources in the
internet
• Protected Area
Wildlife Bureau
(PAWB) office
• Philippine Gazette
CADC/CADT
areas
• Certificate of
Ancestral Domain
Titles (CADTs) are
available at the
National Commission
for Indigenous
Peoples (NCIP)
central office or its
provincial offices
• Certificate of
Ancestral Domain
Claim (CADC) issued
under DENR could be
found also in the
project control
• maps of CENROs and
PENROs
• Digital copy also
available from the
Philippine
Association for
• Intercultural
11.110
Various scales
The boundaries are
indicated as technical
description, sometimes
accompanied by maps.
Data/Map Name
Source
Scale
Date
Key features
Development
• Project control maps
in the CENRO and
PENRO offices
Updated by the
CENRO and PENRO
offices yearly or
when new tenure is
issued
DENR issued
tenure
Settlements
Topographic map
NAMRIA
1:50.000
Existing
Community maps
or
spot maps
• Community maps
that are produced
• Usually
done per
barangay
• from other
development projects
in the area
Reprints of 1950s
interpretation of
aerial
photographs, some
features are
updated in the
reprints
Individual houses are
shown as small black
box symbols
Community maps
usually represent the
settlement areas by
individually drawing
the houses
• The Barangay Health
Center of the
• city/municipal LGUs
also map the location
of settlements as part
of their annual
census update
Community
Management and
Development
Plan (CMBP)
Part of the
requirements of the
CMBP is to conduct
community mapping
Infrastructure
Roads
Namria
1:50,000
Municipal and
barangay roads
and other social
infrastructure
LGU physical and
socioeconomic
profile in their CLUPs
Prepared in
varied
scales
Reprints of 1950s
interpretation of
aerial
photographs, some
roads are updated
in the reprints
Most of the national
highways and
provincial roads are
indicated
11.111
Data/Map Name
Source
Water Permits
Issued
List is updated by the
National Water
Resource Board
(NWRB)
Irrigation related
infrastructure
and irrigated
areas
Data from the reports
of National Irrigation
Administration (NIA)
and Department of
Agriculture (DA)
Scale
Date
Key features
Coordinates of water
permits locations is
available from the list
which includes name
of permittee, permit
type, charges etc.
Elevation
Topographic Map
Namria
1:50,000
Bureau of Soils and
Water Management
(BSWM)
1:250,000
Reprints of 1950s
interpretation of
aerial
photographs, some
roads are updated
in the reprints
Elevation data are
represented every 20
meter contour interval
Slope
Slope Map
Slope categorized into
0-3,
3-8. 8-18, 18-30, 30-50
and
50% and above
Geohazards
GeoHazards
Mines and Geosciences
Bureau
Mining Rights and Claims
Mining
tenements
11.112
Mines and GeoSciences
Bureau
(MGB) and in the land
management services
office in the Regional,
PENRO or CENRO
offices
Prepared in
varied scales
Updated as the
need arises
Indicate extent and the
name of the claim
holder
Online sources for GIS data are:
1. Philippine GIS Data Clearinghouse - http://www.philgis.org/
2. GEOFABRIK for road data http://www.geofabrik.de/
3. Consultative Group on International Agricultural Research Consortium for Spatial
Information (CGIARCSI) for updated version of SRTM http://www.cgiar-csi.org/
4. Global Administrative Boundaries - http://www.gadm.org/
5. Perry-Castañeda Library Map Collection of University of Texas at Austin for
Historical Maps - http://www.lib.utexas.edu/maps/
6. Environmental Science for Social Change (ESSC) for the same Geohazard Map that is
available from MGB - http://geohazard.essc.org.ph/
7. Department of Social Welfare and Development (DSWD) Map Viewer for KML data of
their programs and projects, health facilities of DOH, and School Facilities of DepEd
- http://m.dswd.gov.ph/
8. Not strictly GIS, but many government websites contain information on a barangay,
municipal, or provincial level. This data can easily be copied into a spread sheet or
a table and then combined with GIS map to create new data sets.
Summary
In this lesson you have learned the steps needed to collect the data
you need for the CLUP based on your own survey, paper maps or
the data from the Lot Data Computation. For a good understanding
of the GIS data, we have described the most important coordinate
reference systems and map datum of the Philippines and possible
other data sources where data can be obtained. This step is a first
step, since most (if not all) cases you will need to edit these data.
The editing of the data, both geographic and attribute data will be
the topic for the next lesson.
11.113
11.114
SESSION GUIDE:
Module 11
Session 11.5
Editing
OVERVIEW
The data we create during our surveys or those that we purchase or get from others are
rarely exactly what we want. In many cases we may want to add, change or modify
these data. For instance, you may want to use a geo-registered image to create a new
drawing of roads or buildings. Not only the geographical data (the map), but also the
attribute data may be subject to change. In this Session we will describe ways how to
create new, or edit existing datasets.
To do this correctly, this Session also deals with the way spatial data are stored in GIS.
You will have a close look at the basis of data storage, which is accomplished by means
of tables. You will view, create and fill tables. In addition you will also join and relate
tables. The first part deals with data storage in a vector model environment. The second
part deals with storage in a raster environment. In addition, you will digitize points as a
method of data capture. Digitizing is the process of using a mouse to automate the
locations of geographic features by converting their map positions to series of x, y
coordinates stored in computer files.
OBJECTIVES
After this Session, you will:
1. Have insight in and experience with the process of editing drawings
2. Know how to create new drawings
3. Know how to modify existing drawings
4. Know tips and tricks with respect to editing
5. Have experience with and insight in working with tabular data
6. Have gained practical experience by combining these elements using realistic
exercises
DURATION
6 hours
CONTENT AND ACTIVITY
PLAN
11.115
Topics to be covered:
1. Editing of maps
2. Working with tabular data
3. Merging Map layers
SUGGESTED METHODOLOGY
•
Presentations
•
Exercises
•
demonstrations
•
group discussions
RESOURCES NEEDED
For this Session we assume that you have a working version of Manifold System installed on
a computer and that you have insight in the basics of Manifold Systems presented in
Session 1. Experience with the data collection as presented in Session 3 is an advantage,
but not necessary. The necessary data for the exercises can be found on the DVD.
REFERENCES
Deutsche Gesellschaft für Internationale Zusammenarbeit (GIZ) GmbH, Existing
PowerPoint and documents on Manifold GIS trainings, mostly compiled by Jay-ar
Ragub and Jerson Sala
Geerling, Gertjan, - Draft Manifold Hands-on Manual, not published
MANIFOLD System GIS Help,
MANIFOLD
System
GIS
User
manual,
http://www.georeference.org/doc/whnjs.htm
accessed
on:
Ragub, Jay-ar (2012), Manifold System Manual for iTAX Digital Parcellary Mapping,
Deutsche Gesellschaft für Internationale Zusammenarbeit (GIZ) GmbH
http://www.methodfinder.net/example87_1.html
11.116
LECTURE POINTS:
Module 11
Session 11.5.1
Editing of maps
T
racing or digitizing is the process of creating drawings from images. By using
the pixels of an image as a guide we can trace over the image and create
points, lines and areas in a drawing. The tracing process is like laying a sheet
of tracing paper onto a photograph and then drawing lines with a pen to outline
what is seen in the photo. The photo image is thus converted into a line drawing.
To trace an image we use a map where the drawing layer in which objects are
created appears about the image layer. We can then see both the drawing as well
as the image being traced. There are two main methods of tracing within Manifold
System:
•
Freehand Tracing: At any time we can draw points, lines and areas freehand
using the pixels within an image as a guide.
•
Tracing Tools: Tracing tools use pixels in the image layer as a guide to create
objects in the drawing layer semi-automatically. For example, the Trace Point
command will create a point at the centre of a pixel cloud.
When tracing an image we will usually use a combination of the above methods. When
working with compressed images we can use freehand tracing only, since compressed
images do not allow any manipulation as is necessary with tracing tools.
SIDELINE
In a GIS we see a MAP as a combination of a table with a map. One of the most used
formats for this is the shape file. While the term "shapefile" is quite common, a
"shapefile" is actually a set of several files. Three individual files are mandatory to
store the core data that comprises a shapefile: ".shp", ".shx", ".dbf", and other
extensions on a common prefix name (e.g., "lakes.*"). The actual shapefile relates
specifically to files with the ".shp" extension, but alone is incomplete for
distribution, as the other supporting files are required.
There are a further eight optional files which store primarily index data to improve
performance. Each individual file should conform to the MS DOS 8.3 filename
convention (8 character filename prefix, period, 3 character filename suffix such as
shapefil.shp) in order to be compatible with past applications that handle
shapefiles, though many recent software applications accept files with longer
names. For this same reason, all files should be located in the same folder.
continue next page…
11.117
…continued from last page
Mandatory files:
•
.shp — shape format; the feature geometry itself
•
.shx — shape index format; a positional index of the feature geometry to
allow seeking forwards and backwards quickly
•
.dbf — attribute format; columnar attributes for each shape, in dBase IV
format
•
Optional files:
•
.prj — projection format; the coordinate system and projection information,
a plain text file describing the projection using well-known text format
•
.sbn and .sbx — a spatial index of the features
•
.fbn and .fbx — a spatial index of the features for shapefiles that are readonly
•
.ain and .aih — an attribute index of the active fields in a table or a theme's
attribute table
•
.ixs — a geocoding index for read-write shapefiles
•
.mxs — a geocoding index for read-write shapefiles (ODB format)
•
.atx — an attribute index for the .dbf file in the form of
shapefile.columnname.atx (ArcGIS 8 and later)
•
.shp.xml — geospatial metadata in XML format, such as ISO 19115 or other
schemas
•
.cpg — used to specify the code page (only for .dbf) for identifying the
character encoding to be used
(from Wikipedia)
Individual GIS software packages may add more files and extensions to the
shapefile. For this reason, always make sure you copy all the files if you want to
share GIS data (or safe them in a Manifold System project file).
11.118
Creating
Drawings
and digitize
Make a new empty drawing through File > Create > Drawing.
Give it a name and it will appear in the project pane. Import or
Link base data set to be digitized. This could be the Google
Earth/Virtual Earth data or scanned maps etc. Be sure to check
the projection of the scanned map; register (i.e. georeference)
the map first if needed. Create a Map: File > Create > Map and
add the empty drawing and the base data. Make sure the drawing
is on top by dragging its tab to the left side, see figure below.
Switch on the appropriate button in the tools toolbar to create
points, lines or areas. In the figure below, the create lines and
the insert lines buttons are switched on. See Help > Index and
type Tool toolbars for detailed information on the functions of
the buttons.
For inserting lines, the line starts at the first click. At every click
an additional node (also called vertex) is placed. A right click
ends the current line sequence.
For inserting areas, click create areas in the Tools Toolbar. Click
Insert Area. The Tools buttons should look like in the figure.
The area is formed by subsequent clicking. Right clicking finishes
the area.
If CTRL is hold during the last click, the area is not finished but
can be continued starting with the first left click. A normal right
click finishes the area definitively. This method can be used to
create islands in areas, such as in the example below.
11.119
Important:
!
11.120
In contrast to some other GIS software, Drawings in Manifold
System can contain points, lines and areas (polygons) at the
same time. When such a drawing is exported to for example
Manifold System shape, one drawing is exported as 3
separate shape files, one containing points, one lines and
one areas.
•
pressing Esc quits drawing the current object.
•
A useful tool is auto complete with ALT. When editing
maps we often would like to create a new area that fits
exactly into an existing area. Manifold System provides an
autocomplete capability within the Insert Area and Insert
Line tool to make this easy. See Help > Index type
autocomplete.
•
When points, lines or areas have to be changed, you can
use the Edit Toolbar. The Edit Toolbar provides
commands for editing objects in drawings. If not already
displayed, the edit toolbar will appear when an object is
selected for editing with a CTRL-ALT clicking the object.
The figure below shows the Edit Toolbar and an area
clicked while pressing CTRL-ALT. See Help > Index and
type Edit Toolbar for more information on its use.
Hint
When you are editing, you may find that you need to look up and get an
overview of the bigger picture or just zoom in for more detail. A good way
to do this is to use the + and - keyboard keys to zoom in and out even in
the middle of the Insert Areas command. Pressing + on the keyboard will
cause a zoom in. Using the + and - keys we can zoom in where greater
precision is required and then zoom out where less precision is required.
Another option is to use a mouse with a scroll wheel to zoom in and out.
This works even in the middle of commands such as the edit toolbar
editing commands. By default the zoom will be centered on the mouse
position. Holding the CTRL key while operating the scroll wheel will force
the zoom to be near the center of the opened window.
Note:
In order to create holes in polygons (as the island in the
above picture), Such areas are called branched or
complex areas. To create such areas in Manifold System,
use a CTRL-click between several sequences of boundary
line clicks. We would then click once at a new starting
point and click to the first position to change direction.
Just as before, as we click our way around the periphery
of the "hole" the boundary preview line will "rubber band"
from the starting position to the current mouse position.
Manifold System knows that after the CTRL click we have drawn a
figure within a figure, so it knows this is to be a hole or an island
and creates the complex area accordingly. Had we drawn the
second figure outside the first figure, it would have been drawn
as an "island." In fact, we can draw complex overlapping figures
by CTRL clicking between them to create new areas of great
topological complexity. Note: to keep things reasonably obvious
it is usually best to create complex areas with holes or islands but
not with complex internal overlaps.
11.121
Digitizing
using snap
tools
For precise drawing, the Snap Tools are useful. When
snapping is turned on, the cursor snaps to the nearest item
defined as snap-to-item. This ensures seamless continuation
of the digitized object.
Snap Tools can be turned on through menu Edit > Snap to.
One can choose to snap to Graticule, Grid, Areas, Lines, and
Points. Additionally the snapping can be limited to segments
and selection. Once the Edit > Snap to menu is activated, the
Snap Toolbar appears. Facilitating access to the tools.
Example of use
In the practise of digitizing long lines, you may want to
continue a line exactly at the same spot the last one
ends. We use snap to lines and snap to segments, as can
be seen in the figure above.
Turn on snapping of lines through Edit > Snap to > Lines.
In the toolbar click on snap to segments. Now the cursor
is fixed to the closest line, moving the mouse results in a
moving cursor along the line. See figure.
When we click the new line will start on the old line. To
move beyond the old line, we can press SPACE to turn
snapping off temporarily. Pressing SPACE again turns
snapping on, if we want to continue another line later.
More information in the help file: Help > Index > type snap to
Exercise 4.1
Editing a new drawing.
k.
11.122
Attributes and
Tables
Table show data organized into rows and columns. Every record
is linked to an element in the drawing and every field describes
a specific part of that element. Every row in a table is a record.
Every column in a table is a field. We will use the words "row"
and "record" interchangeably. We will also use the words
"column" and "field" interchangeably. Column and Fields of
drawings describe attributes of that drawing, such as the length
or area of features, names, etc.
Every drawing in Manifold System has a table associated with it.
Each object in the drawing (that is, every point, line or area
object in the drawing) is linked to a row in the table. Drawings
have a table even if there is no data saved for each object. In
that case, the drawing's table is mostly empty. It has only one
field, the object ID field, for each row. The object ID field is
used to link each row to its associated object and cannot be
edited. It is indicated as the key field with a small key icon in
the column name. Deleting an object in a drawing will delete
the object's record in the drawing's table. Deleting a record in a
drawing's table will delete the associated object in the
drawing, see figure for a selected municipality in the map and
the associated table.
In the following example
2 parts of a road have
been digitized as lines.
The two lines show up in
the table, see figure
below. Next we would
like to add a column for
their names.
11.123
1. To add a column for inputting their names go to Table >
Add > Column.
2. Type the name, in this case type Name for road name.
Choose the Type, depending on your needs, in this case
Text (ANSI, fixed length) and give the expected length
of the longest name. Alternatively you can choose Text
(ANSI, variable length) as Type. For an overview and
description of all the Field types in Manifold System go
to Help -> Index and type field types
3. Press OK.
4. Now the Field is added to the table, you can double
click on it and type to input data.
5. Option: to delete a column / field, right click on the
Field name and choose Delete.
Calculating length and surface area of items
in drawings
Tables from Drawings have intrinsic fields which store basic
data on the objects of that drawing. These intrinsic fields are
prepared by and maintained by Manifold System and as a user
you cannot change, edit or alter these. If you want to use them
in calculations, then copy the field into a new one and use this
new field in your calculations. Length and Area are two of
those intrinsic fields. To show the length or area of lines or
areas, go to View > Columns and click Length (I) in the popup
window, see figure below. Now the Length will appear in the
table. The same procedure can be followed for Area (I).
Changing values in tables can be done using the transformation
toolbar, through active columns and through Viewbots. From all
three options an example is given in the following paragraphs.
11.124
Exercise 4.2
l.
Working with tables.
Computing using fields of tables (active
columns)
To compute new fields using existing fields of tables, similar to
formulas in MS excel, Manifold System uses Active Columns.
Functions have to be written in a scripting language. In the
following example we will use an active column to
automatically calculate the population data in a barangay for
2005 based on the population from 2000. For this example we
just assume a uniform growth of 5%.
11.125
TO CREATE AN ACTIVE COLUMN:
1. Open the table.
2. Right click on a column head and choose Add > Active Column or
choose Table > Add > Active Column from the main menu.
3. Specify the function name, the name to appear on the column head
and the data type returned by the function, see figure below. Set
Language to VBScript. The data type requires special attention. If you
expect decimals (smaller than 1), be sure to select floating-point
(single) or floating-point (double). Single or Double refers to the
amount of decimals. In case of doubt refer to Help > Index and type
field types.
In the example above a function with the name Func2005 has been
created and this is used in the active column with name pop2005.
4. Make sure the Compute option is set to on user request. Press OK.
5. A script component will be created and opened for editing; the script
appears in the Project pane linked to the table.
6. Write the function to be used by the Active Column. In the following
example the population of 2000 (field POP2k) will be added with 5%
(or multiplied with a factor 1.05)
Function Func2005
POP20005 = Record.Data("POP2k") * 1.05
End Function
11.126
Another example: to divide two columns (named Column1 and
Column2) use the following code
Function Divide
Divide = Record.Data(“Column1”) /
Record.Data(“Column2”)
End Function
7. Verify the script by right-clicking on the column header and pressing
recompute. The column should be filled with values.
8. In case the script works and you want to recompute automatically, set
the computation mode to on the fly. To do this, open the table; right
click the header of the active column and choose edit. Use of on the
fly mode will prevent most script editing operations in the script
window, therefore to change the script again, reset the compute
option to on user request.
Active Columns can contain programs written in any ActiveX scripting
language or any .NET language available in your system. Mostly the
standard setting of Visual Basic Script (VBScript) will do. More information
help > index > type active columns or look at the following example on
the internet for automatically calculating the area in acres for parcels :
http://www.georeference.org/doc/show_area_of_a_parcel_in_acres.htm
Exercise 4.3
m.
Active Column
11.127
Computing using fields of tables (transformation
toolbar)
Another way to calculate values in fields is to use the transformation
toolbar. If you open the table of a drawing, the transformation toolbar also
opens. We can use this to do many calculations. For instance if I have a
drawing with municipalities and that has the area in square meters, but I
want to have the area in hectares, I will take the following steps:
1. Open the table
2. From the menu select table - > Add Column. Name it area-Ha and
make sure it has a floating format
3. Next in the table open the transformation toolbar and add the areas
from the field area into the new column:
This will have the effect that the areas (still in m2) are copied in the
new column. In the second step we will divide them by 10.000 in
order to generate hectares. This is done again in the transformation
toolbar.
The advantage of using the transformation toolbar is that you do not need
any programming experience. However if you have many (or frequent)
changes, then you need to repeat the calculations after every change
where the active column will perform
Exercise 4.4
n.
11.128
Calculations
Computing using fields of tables (ViewBots)
ViewBots are one-line analytic instruments used to dynamically compute a
statistical or comparative measure over a subset of records and are
extremely useful for analysing tables. They are one of the most popular
functions in Manifold System for experienced users. When a ViewBot is
configured for a drawing's table it continues to function when the drawing
has the focus. For example, if we configure a ViewBot to show the average
of a given field for selected items it will continue reporting the average of
the selection whether or not we select items from a drawing's table or by
using mouse selection commands to select objects in the drawing.
Turn on the ViewBots pane with a SHIFT-ALT-B ("B" for "ViewBots") or with
a View - Panes - ViewBots command.
ViewBots are bound to the tables for which they were created. When a
drawing window is active, the ViewBots pane will list all ViewBots created
for the drawing's table. When a drawing layer in a map is active, the
ViewBots pane will list all ViewBots for the active drawing's table.
11.129
TO CREATE A VIEWBOT
1. Open the ViewBots pane and press the New ViewBot button. A new
ViewBot line will be added to the ViewBots pane.
2. Double click onto the saved ViewBot fields to choose analytic functions and
the scope of the ViewBot.
3. Press the Refresh button to update the results in that ViewBot if the
ViewBot auto refresh option is not on in Tools - Options.
4. For instance if I want to calculate the average area (in hectares)
from my (selected) municipalities, I would take the following steps:
5. In the ViewBots pane, select new viewbot
6. And in the new window, set the correct parameters:
7. After pressing OK, for every selection of municipalities the average
area will be automatically calculated. You can have more than one
viewbot for every table!
11.130
Exercise 4.5
o.
Viewbots
11.131
Joining
external tables
(like MS excel
files)
Relations are connections between two tables in a Manifold
System project that allow one table to show columns from
another table. A relation between tables uses a key field with
unique values common to both tables to connect the two
tables. This allows data that appears in one table to also
appear in another table without having to physically
duplicate the data. Most often this is used to add data from
external sources such as excel files to an existing
(administrative) drawing.
TO FORM A RELATION BETWEEN TWO TABLES
1. If needed use File > Import > Table to import an (excel) table. Be sure to
select the right type (excel, csv, ..) while looking for the file.
2. Open the table that is to display the additional fields and click on Table >
Relations.
3. Click on the New Relation button (
dialog.
). This launches the Add Relation
4. In the Add Relation dialog, choose another table in the list box after Match
Key Fields in:.
5. In the Add Relation dialog, click on one field for each table that will be
used to match records and press OK. See figure below for an example
showing matching fields: MUNICIPALI and MUNICIPALITIES.
6. Back in the Relations dialog, check the desired columns to join from the
other table. Press OK.
Example: the external table Population Growth is matched to a table from
a drawing. As both tables contain names of municipalities (see figure
above), they could be matched as shown in the figure below. Important is
that the municipal names in both columns are exactly the same (even upper
and lower case) otherwise the match doesn’t work.
11.132
Hint
First export the table of the drawing as excel file (File
> Export > Table), then remove all columns in excel
except the column used for matching. Add all the
data columns you want to use in the GIS behind the
matching column, and Import the excel file again in
Manifold System. (File > Import > Table).
Columns that are "borrowed" from another table will appear
in the table with grey background colour to indicate they
are imported. They may be used like any other column, for
example, for sorting, filtering or within formulas or
thematic formatting. Tables may have more than one
relation with more than one other table. If you want to edit
a grey column or unlink the relation, just right click on the
column and Flatten All or Flatten on a specific field
11.133
Hint
If you did a GPS survey and have entered a lot of data in your field notes
about all the waypoints, then this process is an easy way of adding that
info to your GIS data. Just make sure that you encode your field notes into
excel and that you have a matching id between the waypoints and your
data. Also, do not use any layout options in your excel data since this
usually complicates issues. Good practise is to have the records
(waypoints) in rows and the attribute data in columns. The first row is then
reserved for the name of the field.
For more information see: Help > Index and type relations
Exercise 4.6
p.
11.134
Importing and Joining tables.
LECTURE POINTS:
Module 11
Session 11.5.2
Merging Map layers
T
here are a number of ways and a number of reasons for merging maps. One of
the most obvious of these reasons may be the fact that our CLUP is based on
maps from all the barangays. In order to make a municipal map, we have to
combine these maps into one new map. The easiest way to do this is to copy and
paste the items into a new drawing.
First create a new empty drawing (Create drawing in the project pane) and then copy
those elements from existing drawings into the new drawing. In order to copy these, open
the source drawing, use Edit-> Select all (or a conditional selection) and then paste them
into the new drawing. There are two options to paste the drawing elements: (1) Paste
Pastes contents of the Windows Clipboard into the active component. Edit – (2) Paste
Append appears in components such as drawings, tables or comments, where data may be
appended onto existing text or records. When copying objects from one drawing and
pasting into another the Paste Objects dialog appears to allow control of how
fields are pasted.
Select All - Paste all columns.
Select None - Do not paste any columns except ID.
Select Inverse - Do not paste all current Paste As columns and paste all other columns. A fast way to use all
but one column: click Select None, specify a Paste As choice for the one column not desired and then click
Select Inverse.
Autoselect - Paste existing fields to compatible columns where the names are the same and otherwise
create a new field as necessary.
column Column This column lists fields in the source drawing.
Paste As Paste As How the field should be pasted into the destination drawing. Double-click into a Paste As cell to
define how the paste should take place
In order to facilitate this process, it is good to make a template of the map layer you need.
This map layer should contain the attribute structure needed for all maps and then
facilitates the work for all layers. For instance for a map layer containing structures in a
barangay (points with the location of wells, barangay hall, schools, etc.) could be based on
a template structure-template which contains already the field definitions you need. A
copy can be used for all barangays and the easily be combined into one municipal map.
Physically merging map layers is only necessary if you need the different layers to be into
one file, for instance to create a municipal map or to share the data with other GIS users
who do not use Manifold System. In many cases creating a map containing the different
map layers is just as easy as merging the map layers.
Exercise 4.7
q.
Merging map layers.
11.135
LECTURE POINTS:
Module 11
Session 11.5.3
Creating New symbols
Manifold System has many options to symbolize points, however the symbols for
point features are not that exhaustive. Luckily for us it is not too difficult to make
our own symbols. We can use either symbols from the fonts in Windows (like
windings or webdings) or we can create icons or find them on the internet.
Manifold System can use point styles from four different sources:
•
Point styles that are built into Manifold System.
•
Point styles that are created from True Type fonts installed in Windows.
•
Point styles created from image files.
•
Point styles created from custom scalable styles.
This topic discusses the first three methods of customizing point styles. For use of
custom scalable styles see the Custom Scalable Styles for Points, Lines, Areas and
Labels topic at http://www.georeference.org
Point styles that are created from True Type fonts or images are loaded into Manifold
System based upon directions specified within .xml files found in the Config folder.
When Manifold System launches it reads any .xml files that are placed in
the Config folder and then opens True Type fonts or image files they mention to
create new point styles. If an .xml file mentions a True Type font or image file that is
not available in the Windows system, the point style thus specified will not be
available and will be displayed as the default circle point style.
For example, an .xml file adding all characters in the particular font could be
provided to customize the Manifold System installation. This .xml file tells Manifold
System to create point styles based on the characters in the given font. If for some
reason the specified font is not installed in Windows, the point styles created from
this .xml file will not be available. Note: A description of the XML language is not part
of this manual. For adding styles, please follow the exact descriptions and changes in
the files as described.
Point styles
created from
image files
11.136
Point styles created from images may be used just like any
point style, except that they are not resizable (and so may
result in unexpected scaling effects when size on the monitor
or on printed pages is compared) and do not use either
foreground or background formatting colours. In addition,
point styles created from images will not be shown in
selection colour when selected.
Users can add their own point styles from images by
installing a desired image file (one image per file) and then
creating an .xml file in the following pattern:
<xml>
<style>
<name>Name for this style</name>
<file> images\filename.png</file>
<type>point</type>
</style>
</xml>
Rules
•
There can be any number
of <style> … </style> entries within a single XML file
between the <xml> tag at the beginning of the file
and the </xml> tag at the end of the file.
•
The name string supplied in the <name> attribute is
mandatory and must be unique.
•
The path string in the <file> attribute is mandatory. It
specifies the path to the image file from the
configuration directory. In the pattern shown above
a filename.png image file must be within
an images directory that is in the Config directory.
•
Image files may be in any of the following formats:
BMP, GIF, JPG, PNG, TIFF, EXIF, WMF and EMF. Each
image file contains one image, corresponding to one
point style.
•
The value in the <type> attribute is mandatory and
must be "point".
Place the new or modified .xml file containing the image
point style specifications into the Config folder for Manifold
System
(normally C:\Program
Files\Manifold
System
Professional\Config) and restart Manifold System. When
Manifold System launches, the system will scan all .xml files
in
the Config folder.
Any <style> … </style> entries
of <type> "point" found in any of those .xml files that
correspond to image files will be loaded as a new point style.
Images can contain pixels in transparent colour. .png format
is a good format to use to save images that contain invisible
pixels (transparent colour). .png is fast and efficient and a
good choice overall for iconic images.
Point styles
created from
Fonts
(Webdings)
Point styles that are created from True Type fonts or images
are loaded into Manifold System based upon directions
specified within .xml files found in the Config folder. When
Manifold System launches it reads any .xml files that are
placed in the Config folder and then opens True Type fonts or
image files they mention to create new point styles. If
an .xml file mentions a True Type font or image file that is
not available in the Windows system, the point style thus
specified will not be available and will be displayed as the
default circle point style.
11.137
For example, an .xml file adding all characters in the
particular font could be provided to customize the Manifold
System installation. This .xml file tells Manifold System to
create point styles based on the characters in the given font.
If for some reason the specified font is not installed in
Windows, the point styles created from this .xml file will not
be available.
Point styles created from True Type fonts may be used just
like any point style, except that they are always created
using the foreground colour only. Users can add their own
point styles from True Type fonts by installing a desired True
Type font and then creating an .xml file in the following
pattern:
<xml>
<style>
<name>Name for this style</name>
<font>Windows font name</font>
<symbol>64</symbol>
<type>point</type>
</style>
</xml>
Rules
There can be any number of <style> … </style> entries
within a single XML file between the <xml> tag at the
beginning of the file and the </xml> tag at the end of the
file.
• The name string supplied in the <name> attribute is
mandatory and must be unique. Many users will
construct a unique name by appending the symbol
number to the name of the font.
•
The font name string supplied in the <font> attribute
is mandatory and must be one of the font names
installed in Windows.
•
The number in the <symbol> attribute is mandatory
and must be a number that corresponds to a valid
character, either in decimal notation or in
hexadecimal (hexadecimal numbers must be preceded
by a # character).
•
The value in the <type> attribute is mandatory and
must be "point".
Place the new or modified .xml file containing the point
styles
into
the Config folder
for
Manifold
System
(normally C:\Program
Files\Manifold
System
Professional\Config) and restart Manifold System. When
Manifold System launches, the system will scan all .xml files
in
the Config folder.
Any <style> … </style> entries
of <type> "point" found in any of those .xml files that
11.138
correspond to characters in installed Windows fonts will be
loaded into the system as an available point style.
Exercise 4.8
r.
Creating a new point style.
More information on creating custom styles can be found in:
http://www.georeference.org/doc/custom_point_styles.htm
Summary
In this Session you have learned how to edit the data you have
prepared, be it as drawing or as table. We have also shown you
how you can add data from two more different sources: excel and
lot data computations. These examples are not conclusive, but
they give you a very good idea how GIS can be used to collect and
combine data from a broad array of sources. In the next Session we
will be showing you how to use these new data in the analysis you
might want to do.
11.139
11.140
SESSION GUIDE:
Module 11
Session 11.6
Analysis
OVERVIEW
This Lesson will show how to analyse your data. The first steps are to use structured
selections that will help you to get more out of your data. In the next step we will combine
different layers in the analysis and make selections based on the spatial relationships in your
data. This Lesson concludes with the step by step procedure on how to make a number of
maps for your CLUP.
OBJECTIVES
After this Session, you will:
1. Obtain insight on how to design and deliver spatial analysis
2. Know the value of different selection tools as part of the analysis process
3.
Appreciate the tools to generate new map layers as part of the analysis tools
4. Have gained practical experience in combining these elements using realistic exercises
DURATION
1 day
CONTENT AND ACTIVITY
PLAN
Topics to be covered:
1. Basic Selections
2. Advanced selection
3. Analysis using the transformation toolbar
4. Conflict Maps
SUGGESTED METHODOLOGY
•
Presentations
•
Demonstrations
11.141
•
Exercises
•
Group Discussions
RESOURCES NEEDED
A basic understanding of GIS and GIS data and awareness of the basic operations in Manifold
GIS.
REFERENCES
Chang, Kang-Tsung (2006) - Introduction to Geographic Information Systems, McGraw-Hill
Higher Education
de Smith, Goodchild, Longley (2013) Geospatial Analysis - A comprehensive guide,
http://www.spatialanalysisonline.com/HTML/index.html
Geerling, Gertjan, - Draft Manifold Hands-on Manual, not published
MANIFOLD System GIS Help,
MANIFOLD System GIS User manual, accessed on:
http://www.georeference.org/doc/whnjs.htm
Pakes, Ubo – GIS analysis PowerPoint and Training materials, GIS tailor-made Inc
11.142
LECTURE POINTS:
Module 11
Session 11.6.1
Queries
Introduction
This Lesson deals with querying data from a GIS database. Queries
represent processes of selecting information from a GIS database
by asking questions. Queries can be divided into geometric,
thematic and topologic queries.
•
Geometric queries are based on location, for example
‘how many buildings are located within 5 km from the
road?’ Here the key factor is ‘within 5 km’, indication a
geometric question.
•
Thematic queries are based on attributes of the spatial
data, like ‘what is the average age of people in each
province?’The drawing ‘provinces’ should contain attribute
data on average age in its table.
•
Topologic queries are based on for example networks or
common boundaries, like ‘what is the shortest distance to
the next town by road?’ Here, the road is the network and
the computer must know which roads connect to each
other and which don’t (for example from a fly-over you
cannot turn left). Another example could be, ‘what
municipalities share the same coastline?’In this case, the
coastline is the common boundary.
You can perform a variety of queries in Manifold, from pointing at
features on a map (e.g., to identify them) to analysing spatial
relationships between different phenomena (e.g., to find out how
they might influence each other).
The formal structure of a query is:
Find the data of attribute T
of the database S
that fulfils condition C
and carry out operation O.
An example of a thematic query is: Which municipalities
have less than 10,000 inhabitants?
T = Inhabitants
S = Municipalities
C = less than 10,000 (<10,000)
O = Show the result (or save to new table, print, etc.)
11.143
Identifying
features with
the mouse
In a drawing:
1. Open a drawing from the project pane.
2. Right click on the object (like an area or line) and
choose Fields.
3. The Object Fields window appears containing the
Object’s attributes. These are taken from the table
connected to the drawing.
4. Refer to Help-> Index-> type object fields for more
information.
As with many things in GIS, there is another way to do this. If
you open the info pane from the View Panes Info, a
pane opens showing the fields from the selected object.
11.144
Manual
selection of
objects and
show
attributes
To get the attributes of specific objects in a drawing and then
work with them, it is best to select the objects on the view
and then open the drawings' attribute table to see their
attributes. When you select objects on a view, they are
highlighted to show that they are selected.
There are various ways to select features in Manifold System.
First, we will look at how to select features on a view with
the mouse and use the theme's attribute table to get
information about these features.
1. First open the drawing of which objects are to be
selected.
2. Go to Edit-> Select mode-> Replace
3. Go to Edit-> Select Objects and
choose your type of object to
be selected. Often all types
(points, lines, areas) are turned
on. If you have only one type in
your drawing, you can leave all
types on.
4. Then click on one of the objects
in the drawing, it should be
highlighted. See Figure below
for an example of a selected
area.
5. If you click on another object,
the first is deselected.
6. If you open the drawing’s table,
you will see that one of the
records is selected. If the table
is large i.e. contain many
records, you can use menu
View-> Selection filter to show
the selected records only.
Selection Toolbar
When a drawing is shown, quick access to menu items View->
Select mode and View-> Select objects is provided by the
Selection toolbar, see below. If you can’t find it go to Tools> Customize and switch it on.
11.145
REFINING THE SELECTION WITH THE MOUSE
Manifold provides several options to achieve the same in case of selections.
In case the selection toolbar looks as above, and none of the select type
buttons (
) is switched on. Then:
1. Select an object by clicking it; add another to the selection by holding SHIFT
or CTRL at the same time.
2. Deselect an object by holding CTRL and clicking it.
Selection toolbar
1. Choose your selection method:
Select Replace - Replace the existing selection with
whatever is now selected.
Select Add - Add whatever is now selected to the
existing selection.
Select Subtract - Subtract whatever is now selected
from the existing selection.
Select Invert - Deselect whatever is now selected that
was already in the existing selection and otherwise add
what has just been selected.
2. Choose what type of objects you want to select, i.e.
areas, lines, points, pixels in case of an image or text.
Which options are given depends on the active
component (drawing, image, layout). Multiple
selections are possible.
3. Choose how you want to select. Most common are
listed below, for descriptions of others options see
Help-> Index type Selection Toolbar
11.146
4.
Select Touch - Click to select pixels like the one
clicked, give or take the tolerance that may be set in
Tools – Options
5.
Select Shape - Select objects within a region
defined by a series of clicks followed by a right click.
Select Box - Click and drag to select items within a
rectangular selection box
Stop selecting and clearing the selection
The last buttons on the Selection toolbar are:
Disable selecting, or choose how selection appear
Clear selections
Saving Selections
By opening the Selections pane using View-> Panes->
Selections you can save selections and use them later. It
works in table view or geographical view.
•
Press
to save the current selection.
•
By double clicking you can apply the saved selection.
•
By pressing
and click on a saved selection once you
can preview a selection (the selection appears in blue
on the view screen.
Optional: The Viewbots pane (View-> Panes-> Viewbots)
can be used to dynamically summarize field data from
selected objects, like showing the average of a
particular field for the selected objects. When the
selection changes, the viewbot automatically updates
the values for the new selection. This topic has been
discussed in Session 4; or see Help-> Index and type
viewbots for more information.
Exercise 5.1
s.
Selection
11.147
Manual
Selections in
tables
When a table is open, you can view selections made in a
drawing or you can make selections in the table by clicking
the area before the first column. The options Edit-> Select
mode-> Replace and View-> Selection filter are also
available in tables.
Sorting attributes
By sorting an attribute table you can list the features in order
of importance:
1. In the attribute table, right-click the name of the field
(attribute) you wish to sort the attribute values.
2. Click the Sort Ascending or Sort Descending button to
sort the attribute values.
Finding
features by
using a query
(thematical)
Queries are used to find features according to their
attributes, in order to discover which features meet
particular criteria. A query expression is a precise definition
of what you want to select. Building a query expression is a
powerful way to select features because an expression can
include multiple attributes, operators and calculations.
Before building the query you have to specify the query
criteria.
The Query toolbar
Using the Query toolbar you can build simple queries, see
figure below. If you cannot find the Query toolbar, go to
Tools-> Customize and activate the Query toolbar.
Field box
Operator box
Argument box
HOW TO OPERATE THE QUERY TOOLBAR:
1. Open the table or drawing to select from
2. Choose the search field from the Field box left
3. Turn NOT button on or off by clicking. Using not you can inverse the
11.148
selection
4. Choose your operator from the Operator box, such as sounding like, or
less than.
5. Type the argument, in the example “san José”
6. Press Select.
For a description of the complete list of operators see Help->
Index and type Query toolbar. The available operators vary
with the type of component you have opened (Drawing, Table
or Image/Surface). Some examples are given below:
TOP operator: By using Area (I) as Field, the Top as
operator and for example 5 as argument, you get the
top 5 of areas.
The Matching, Containing Match, Ending with Match and
Starting with Match operators use Visual Basic style regular
expressions. Examples (taken from a Mexican drawing):
•
Using DURANGO as the argument, selects one
record ("DURANGO")
•
Using CHI.+ as the argument, selects all records
starting with CHI ("CHIHUAHUA" and "CHIAPAS")
•
Using operator Starting With Match and BA. + as
argument, selects all records starting with "BA".
•
Using operator Starting With Match and argument
[F-H]
selects
three
records
("HIDALGO",
"GUANAJUATO" and "GUERRERO"). In effect selects
everything between alphabetical order F and H.
Saving Selections
By opening the Selections pane using View-> Panes->
Selections you can save selections and use them later.
•
Press
to save the current selection.
•
By double clicking you can apply the saved selection.
•
By pressing
and click on a saved selection once you
can preview a selection (the selection appears in blue
on the view screen.
Exercise 5.2
t.
Queries
11.149
Geometrical and
topological
selections
In Manifold System, geometrical and topological
selections are done using the Transform toolbar. See
figure below. The toolbar is divided into a target box,
operator box and parameter box. It is not designed for
selections only; you will find a lot of operator functions
in the operator box. The table below shows a part of
the possible operators for making selections.
Target box
Operator box
Parameter box
The Transform toolbar
Table: Part of the Selection operators in Transform toolbar (except network based
selections).
T
Select Adjacent to
Select all objects in the target set that are adjacent to any object in the
source / argument box set. Objects are adjacent if they have one or
more boundary coordinates in common with no other overlaps.
T
Select Contained
within
Select all objects in the target set that are entirely contained within an
object in the source / argument box set
T
Select Containing
Select all objects in the target set that completely contain any object in
the source / argument box set.
T
Select Intersecting
Select all objects in the target set that intersect any object in the
source / argument box set. Objects intersect if they have any parts in
common excluding intersections consisting of common boundary
coordinates only.
T
Select Line Coverage
Select a minimal set of lines so that each line from the source set
touches at least one line from the result set.
T
Select Touching
Select all objects in the target set that touch any object in the source /
argument box set. Objects touch if they either intersect or are adjacent
to each other.
Select Euclidean Point
G Coverage
Select a minimal set of points so that each point from the source set is
within the given distance (in the drawing's native measurement units)
to at least one point of the result set.
T = Topological; G = Geometrical
11.150
Some examples of use
Select adjacent to: Suppose you work for a city
council that wants to inform owners of land adjacent
to the city border that a new hospital will be built.
You can use "Select adjacent to" to find those land
parcels that are adjacent to the city border.
1. Create a Map (File-> Create-> Map) and add
a city border drawing and land owners
drawing. Open the Map.
2. In the Choose [All objects in land owners] as
target in Target box.
3. Choose Select adjacent to in Operator box.
4. Choose [All objects in city border] in the
Parameter box.
5. Press Apply.
Select Intersecting: Suppose you want to know in
how many municipalities one single highway is
located. You can use Select Intersecting to select all
these municipalities.
1. Create a Map containing a Highway drawing
(lines or areas) and a Municipality drawing
(areas). Open it.
2.
Select the highway in question by clicking it
with the mouse or selecting it using the
select toolbar.
3. Choose [All objects in Municipalities] in the
Target box.
4. Choose Select Intersecting.
5. Choose [Selection in Highway] and press
Apply.
This also shows you can use a previous selection in the
operation. Selections made in the single drawings can
be used as well as saved selections from the Selection
pane.
Select Containing: Suppose you have a point
drawing of all the airports in the country, but you
want to know in which municipality they are located.
Fortunately you have a municipality drawing
containing the municipal areas. With select containing
you can select the municipalities (areas) containing
the Airports (points). You can export that list.
1. Create a map with both drawings.
2. Target = [All objects in Municipalities]
3. Operator = Select containing
4. Parameter = [All objects in Airports]
11.151
5. Click Apply
The result can look like this, in the drawing and table
all municipalities are selected (red) that have an
airport.
11.152
Finding
features inside
manually
drawn shapes
(topologic)
Use selection using freehand, box, circle or areas from the
selection toolbar, see example for a manually drawn area
around an island. See paragraph on manual selection with the
mouse in this chapter or refer to Help-> Index and type
Selection toolbar.
Exercise 5.3
u.
Geographic and Topologic Selection
Transferring
attributes to
another
drawing based
on location
(topologic)
Suppose you have a point and an area drawing and you want
to transfer the attributes (table entries) of the points to the
areas, you use Drawing-> Spatial Overlay. First, the
procedure needs you to select which fields should be
transferred and how. You do this using the Transfer Rules.
To specify a transfer rule for a column:
1. Open the drawing's table.
2. Right click on the column and choose Transfer rules.
3. In the Transfer Rules dialog, specify the transfer
method to be used for one to many (1 to N) operators.
The Proportional methods available for numeric
fields also require specification of a second numeric
field.
4. Specify the transfer method to be used for many to
one (N to 1) operators.
5. For text fields, choose any desired options to ignore
11.153
case or whitespace.
6. Press OK.
You can do this for as much columns you need, more
information in Help-> Index type Transfer rules.
Then, to use Spatial overlay:
1. Open the Map containing the two drawings to overlay.
Or at least one drawing containing two kinds of
objects, i.e. points, lines and/or areas.
2. Go to Drawing-> Spatial Overlay
3. Box Source: Choose an object set to be the source of
data. Choices will include the selection, all saved
selections, and objects in drawing layers when
launched from a map. The source set may contain only
objects of one type (that is, all areas, all lines or all
points).
4. Box Target: Choose an object set to receive the
transferred data. Choices will include the selection,
all saved selections, and objects in drawing layers
when launched from a map. The target set may
contain only objects of one type (that is, all areas, all
lines or all points).
5.
Box Method: Choose a transfer method. Only those
operations that make sense for the objects in the
source and target sets will be presented. If the source
or target set do not contain all objects of one type the
method box will not be enabled.
The methods for overlay pertain to objects inside other
objects, next to other objects, intersecting other objects,
touching other objects and neighbouring other objects.
Depending on the types of objects present in the drawings,
not all possibilities are shown in the Spatial Overlay window.
An overview of the spatial overlay methods is given in: Help> Index type Spatial Overlay
Exercise 5.4
Spatial Overlay
v.
11.154
Changing your
selection into a
new table or
drawing (copy
and paste)
To extract your selection from a drawing or table, just use
Edit-> Copy. Then go to an empty area in the Project pane
and press right-click paste as-> drawing or press the paste
as-> drawing button, see figure below.
The result will be a new drawing containing only the
selected objects, including the associated attribute table.
Exercise 5.3
w.
Geographic and Topologic Selection
11.155
LECTURE POINTS:
Module 11
Session 11.6.2
Advanced selection: using SQL
I
n Manifold queries can be built using a SQL language, exactly like the formal
form of a query as shown in the introduction. An example of a SQL query is:
SELECT * FROM [Antique_mun
[MUNICIPALI] LIKE "SAN JOSE";
Drawing
Table]
WHERE
Meaning: Select all records from the table ‘Antique_mun Drawing’ in which the field
‘Municipali’ is like ‘SAN JOSE’.
To make a query:
1. File-> Create-> Query (or press right-click in the project pane and choose
Create-> Query)
2. Give the name of your Query and press OK.
3. It will appear in the project pane.
4. Now you can enter your query
In building a query, it is important to know what type of field you are querying, usually it is
text based or numeric (integer or floating). To find out, open the table, right-click the
Field header and choose Format.
Examples for numeric or text based queries:
SELECT * FROM [MUNICIPALITIES Table] WHERE [POPULATION] < 2000;
SELECT * FROM [MUNICIPALITIES Table] WHERE [HOTELS] < 30 OR [HOTELS]-> 40;
SELECT * FROM [MUNICIPALITIES Table] WHERE [MUNICIPALI] = "SAN JOSE";
Keyboard shortcuts:
When pressing the [ key in query building gives you a list of tables and fields to
choose from to facilitate writing the right key.
Pressing CTRL + SPACE or CTRL+J gives you an available list of queries.
For standard examples look in Help-> Index and type Query Templates for all
expressions refer to Help-> Index-> type SQL Reserved Words / Index
11.156
LECTURE POINTS:
Module 11
Session 11.6.3
Analysis using the transformation toolbar
T
he Transform toolbar is loaded with operators that can accomplish "one step"
editing and transformation of the contents of the active window. The
transform toolbar's operators box will be loaded with the applicable
operators for whatever type of window is active (drawing, image, etc.). The
transform toolbar is also used to make spatial selections using commands such as
Select Touching or Select Contained within that work between sets of objects.
Because transform operators are highly specific to the type of window that is
active, the transform toolbar is covered in detail within topics for each different
component that has transform toolbar operators:
•
Transform Toolbar - Drawings
•
Transform Toolbar - Images
•
Transform Toolbar - Tables
The transform toolbar uses the same general interface in all cases. We can consider the
transform toolbar for drawings as an example. The transform toolbar makes changes
throughout the entire drawing using the specified operators. Transform operators can
create new objects, delete objects, change objects (for example, splitting them) and
select objects using various algorithms such as the location of a shortest path.
The Transform toolbar consists of three boxes, from left to right: a target box, the
operator box, and a parameter box.
Target box
Operator box
Also known as the scope box. The objects that will be
affected, altered or which will control the operation. Choices
in the target box will be [All Objects], [Selection] or the
names of any saved selections that have been saved in the
Selections pane. The illustration above shows that the
operator will be applied to all objects in the drawing.
Gives the function to be applied. The operator box is context
sensitive and will show only those operations that make sense
for drawings. The example shows we will add border buffer
zones.
11.157
Parameter box
Using the
Transform
toolbar
The value to be used. Depending on the operator, this may be
another object set or a value entered by the user. Many
operators, such as Boundaries do not require a parameter.
The parameter box will not be enabled for such operators. In
the example above we use 10000 for the size of the border
buffer zones, the size being specified in the native units of
the drawing.
1. Click on the map layer or drawing that contains the
target objects.
2. Make a selection if the operation is to be applied just to
the selection.
3. Choose the desired operator in the operator box.
4. Choose or specify a value in the parameter box, if this
operation requires it.
5. Press Apply.
Some operators create new objects. Any new objects created
will be created in the active drawing/layer and will now be
the Selection. Move the Selection to a new layer/drawing if
you wish to keep these objects organized separately from the
original objects in the drawing (almost always a good idea).
Themes and Toolbars
Themes can be used in the Query and transform toolbars.
Object sets defined on themes will always use the name of
the theme's parent drawing. For example, if there are
selected objects in a theme named T whose parent is a
drawing named D the selection choice will appear in the
query or transform toolbar boxes as Selection in D. This is
done so that it is immediately clear that modifying a theme
will modify the parent drawing (and thus all other themes
bound to that drawing).
Much used
tools
11.158
The following are a selection of much used tools in
the transformation toolbar
•
Boundaries – Create lines in the shape of the
periphery for each area in the target set. Will create
duplicate boundary lines in places where the edges of
areas coincide.
•
Bounded Areas – Create areas within regions enclosed
by lines in the target set
•
Buffers – Create a buffer zone for each object
extending outward by the given distance. For areas,
this is an outer buffer zone.
•
Clip with (Intersect) – Use the areas in the source /
argument box set to "cookie cutter" objects in the
target set and leave only those items inside the cookie
cutter.
•
Clip with (Subtract) – Use the areas in the source /
argument box set to "cookie cutter" objects in the
target set and remove those items inside the cookie
cutter.
•
Decompose – Split branched objects into simple (nonbranched) objects. For example, a single, branched
area object composed of three "islands" will be split
into three separate area objects
•
Explode – Explode lines into multiple line objects
where each line segment from the original line
becomes a separate line object. No effect on areas or
points (like naming the streets individually)
•
Intersect lines – Explode lines into multiple line
objects where each line segment from the original line
becomes a separate line object. No effect on areas or
points
•
Join Lines – Join lines with coinciding ends into a
new, single line object. Redistribute any data
attribute fields according to (Precision)
•
Points – Create points at all coordinates defining the
shape of lines and areas in the target set. Avoids
making duplicate points in places where the edges of
two areas coincide
•
Spline – Create points at all coordinates defining the
shape of lines and areas in the target set. Avoids
making duplicate points in places where the edges of
two areas coincide
•
Split With – Split target areas and lines using a given
set of lines.
•
Union – Combine all areas in the target set into one
area object
An overview of the tools is given in: Help-> Index type
Transform Toolbar
Exercise 5.6
x.
Hazard analysis using the transformation toolbar
11.159
LECTURE POINTS:
Module 11
Session 11.6.4
Preparation of a Barangay Base Map
One of the first steps in preparing the CLUP is the preparation of the base maps for
the barangays. The base map will be used in next steps to prepare all the thematic
maps needed for the barangay.
In order to prepare a barangay base map, please follow the next steps:
1. Secure the highest detail cadastral map you can get. Usually this will be the
barangay cadastral map from DENR-LMS;
2. Scan the blueprint cadastral maps. If you only have a small scanner (A3 or A4); then
you may need to scan the map in parts and stitch the different parts together again
into one image. Make sure that you have enough overlap when scanning. An
example of a blueprint cadastral map given is given below:
Barangay blue print from barangay Bonifacio, Mayorga, Leyte
3. For the stitching, you may use the procedures mentioned in the sideline in the
session on georeferencing.
11.160
4. Use the coordinates on the map for geo registering the map. Since the map may be
old, folded and maybe deformed due to weather, storage and so, use many control
points and make sure that the control points are evenly distributed over the map.
Please refer to session 3 for georegistration. In most cases, the coordinate system
used in these maps will be Luzon 1911, so please use that. After georeferencing and
digitizing (see the next step), you can change the projection to PRS92 or any other
if needed.
5. After georeferencing, trace or digitize the barangay boundary and other important
features. Please refer to session 4 for the digitizing process
To do a visual check on the process, you may export the newly digitized barangay
boundaries to google Earth and check if the digitized data are located correctly. If this is
not the case, please check your georeferencing and coordinate system.
To export to google Earth, right Click on the drawing in the project pane and select
export. Make sure that in the “save as type”field, you select kml /kmz files. In the next
menu you can enter a name and description field if desired. After clicking Ok, a KML file
will be exported which can be opened in google Earth. For more information on the export
to Google Earth please select help > Search > Export Kml.
To import this data into Google Earth, start Google Earth (a working internet connection is
needed) and select file > open. Navigate to your KML file and google earth will
automatically navigate to your location.
11.161
LECTURE POINTS:
Module 11
Session 11.6.5
Analytical Maps
D
epending on your area of work and the type of land use planning you are
working with there are a number of (national) policies regulating the land
use. The following chapters give an overview of these rules and regulations
for CLUP and FLUP. Since these rules and regulations can be changed or updated in
political processes and since there may be provincial or local regulations on top of
these, please do not consider the following lists as complete and final, but always
check with the responsible offices for changes and updates.
Comprehensive
Land Use Maps
Within the process of creating a CLUP you may find that
there are a number of conflicts between the existing land
use and preferred land use or between land use and laws and
regulations. There are generally 3 types of land use
conflicts:
1) land use vs. protected area (e.g. coastal
easement zone),
2) land use vs. hazard areas (e.g. flood prone area),
and
3) land use vs. land tenure (e.g. CLOA, A&D,
Timberland, CBFMA, etc.).
These maps (and especially the decisions based on these
maps) directly affect the lives of those who are affected and
therefore we have to be careful in preparing the maps.
There are legal procedures to be followed, but that process
is too extensive to describe in this technical manual. See
Modules 2 for integration of climate change adaptation
into local development planning, 3 for disaster risk
reduction and management, 8.1 for integrating FLUP into
CLUP and CDP, and 8.2 for CFRM-CLUP integration
However, the legal framework also gives us settings and
conditions which should be applied within our GIS. Please
find in the following a (non comprehensive) overview of
Laws, Policies and Rules.
Please find in the following a (non-comprehensive)
overview of Laws, Policies and Rules.
11.162
•
Lands Administrative Order No. 8-3, S. 1936 (as
amended)
•
DENR Administrative Order No. 34-99
•
PD 1067 (Water Code)
•
RA 9397, amending RA 7279 (Urban Development and
Housing Act of 1992)
•
RA 7160 (LGC), CLUP and LGU Zoning Ordinance
•
RA 8368 (Anti-Squatting Repeal Act of 1997);
dismissing all pending cases against squatting under
PD 772 (1975 Decree Penalizing Squatting and Similar
Acts; Sec 27 of RA 7279 (UDHA) against professional
squatters and squatting syndicates is not affected by
RA 8368.
•
RA 7279 (UDHA): eviction and demolition allowed if
persons occupy danger areas and public places
•
RA 7160: LGUs mandated to formulate CLUP and
zoning ordinances
•
RA 9397 (amended UDHA): HUDCC designs
registration of qualified socialized housing program
beneficiaries; LGU identifies beneficiaries
•
Lands Administrative Order No. 8-3: riparian owner
adjoining shore or marshy lands or lands bordering
shores or banks of navigable lakes or rivers may apply
for foreshore lease (if such land is not needed for
public service)
•
DENR AO 34-99: lessee may not assign, encumber or
sublet rights without prior consent of PENRO
•
PD 1067 (Water Code): no person allowed to stay in
banks of rivers and streams, shores of lakes and seas
within 3 meters (if urban), within 20 meters (if
agricultural) and within 40 meters (if forest)
•
Based on RA 7279 (UDHA): subject to summary
eviction are new squatter families whose structures
were built after the effectivity of RA 7279 and
squatters identified by the LGU in cooperation with
the PCUP and accredited urban poor organizations
•
Eviction and demolition allowed if persons or entities
occupy danger areas such as esteros, railroad tracks,
garbage dumps, riverbanks, shorelines, waterways
and other public places such as sidewalks, roads,
parks and playgrounds
11.163
Forest Land Use
Plans
The following table is provided by Provincial
Forestland Assistance Team (PFAT) in September
2012.
Policy
Two main
categories of
forestlands
PROTECTION an
PRODUCTION
Protection
Area
Slopes steeper
than 50%
Protection Area
Slopes steeper
than 50%
Above 1,000m
asl
Old growth
forest
Natural and
residual forests,
and naturally
grown trees
Mangrove
11.164
EO 318 Section
2.1.1.
Stipulation
State forestlands shall be identified, classified and
delineated/demarcated on the ground and shall constitute the
permanent forest estate unless otherwise stipulated by Congress;
the same shall be categorized and managed either as primarily
for production or as primarily for protection purposes, and in
both cases, placed under a formal management scheme.
Policy
DAO 24-1991
Stipulation
Prohibits logging
PD 705
Section 15.
Cannot be used as grazing land
DAO 1995-15
Section 3.
Definition of
terms
Protection Forest forestlands outside NIPAS obtained essentially for their
beneficial influence on soil and water in particular and the environment in
general. These are areas above 50% in slope and more than 1,000 meters in
elevation. Includes the critical watersheds, mossy forest, strips of specified
width bordering rivers, streams, shoreline and reservoir, and steep, rocky areas
and other naturally unproductive lands.
DAO 24-1991
Prohibits logging
EO 23
1.2 Natural and Residual Forests- are forests composed of indigenous trees,
not planted by man.
Section 2. Moratorium on the Cutting and Harvesting of Timber in the
National Forests – A moratorium on the cutting and harvesting of timber in
the natural and residual forests of the entire country is hereby declared unless
lifted after the effectively of this Executive Order.
R.A. 7161 Section
4. Referring to
Sec. 71. In PD 705
"Sec. 71. Charges on Firewood, Branches and Other Recoverable Wood Wastes
of Timber. - Except for all mangrove species whose cutting shall be
banned, there shall be collected forest charges on each cubic meter of
firewood cut in forestland, branches and other recoverable wood wastes of
Protection
Area
Policy
Stipulation
timber, such as timber ends, tops and stumps, when used as raw materials for
the manufacture of finished products, Ten pesos (P10.00).
Water
Production
River easement
Hazard and risk
areas
R.A. 8435 (AFMA
(1997)
SEC. 12. Protection of Watershed Areas. - All watersheds that are sources of
water for existing and potential irrigable areas and recharge areas of major
aquifers identified by the Department of Agriculture and the Department of
Environment and Natural resources shall be preserved as such at all times.
PD 1067 1976
Article 51. The banks of rivers and streams and the shores of the seas and
lakes throughout their entire length and within a zone of three (3) meters in
urban areas, twenty (20) meters in agricultural areas and forty (40) meters in
forest areas, along their margins are subject to the easement of public use in
the interest of recreation, navigation, floatage, fishing and salvage. No person
shall be allowed to stay in this zone longer than what is necessary for
recreation, navigation, floatage, fishing or salvage or to build structures of
any kind.
CA 141 Public
Land Act 1915
Section 90. (i) That the applicant agrees that a strip of forty meters wide
starting from the bank on each side of any river or stream that may be found
on the land applied for shall be demarcated and preserved as permanent
timberland to be planted exclusively to trees of known economic value,
and that he shall not make any clearing thereon or utilize the same for
ordinary farming purposes even after patent shall have been issued to him
or a contract lease shall have been executive in his favour.
RA 10121
LGUs are required to prepare LDRRMP and define the hazard and risk areas,
these have to be considered in FLUP.
Can include water security concern
11.165
What does this mean for GIS?
We can prepare maps to identify land uses which are in
conflict with the current use of the land – like for example,
agricultural areas within protected areas (coastal easement
zone) which is by law not allowed. So by overlaying the
existing land use data with that of data for the protection
areas, the you can identify which land use type are in conflict
with actions of the LGU for the protection of their locality.
Land Use conflict between other fields also follows the same
process but there are some issues which have to be respected
according to administrative orders and regulations. Examples
are that it is not legal to practice exhaustive agriculture
applications to slopes greater than 18% but restrictive agro
forestry uses are allowed (I forgot what regulation this is but
this is with DENR) or slopes greater than 50% should be
considered as protection areas because these are prone to
erosion and landslides.
In order to prepare these maps, we will combine different
layers. There are two specific tools in the transformation
toolbar that are very useful for this:
Clip with subtract or clip with intersect: The Clip with
operators in the Transform toolbar for drawings use one or
more areas to "clip" other objects, leaving only those parts of
the other objects that lie within the areas (Intersect) or
removing those parts of the other objects that lie inside the
areas (Subtract). For more information and examples please
check the help and search for Clip with subtract. We will be
applying these tools with exercises on the following
examples:
In the following table we will give a number of examples on
how to use these functions and on which data in order to
prepare the data.
Map
Input
drawings
GIS function
Short description
Riparian conflict
map (urban)
Open water;
Settlements
Buffer
Clip with intersect or
Select containing
Prepare a 3 m. buffer around the rivers
Select the settlements within this buffer
area
Riparian conflict
map (agriculture)
Open water;
Settlements
Buffer
Clip with intersect or
Select containing
Prepare a 20 m buffer around the rivers
Select the settlements within this buffer
area
Riparian conflict
map (forest)
Open water;
Settlements
Buffer
Clip with intersect or
Select containing
Prepare a 40 m. buffer around the rivers
Select the settlements within this buffer
area
Settlements in
protected areas
Protected areas;
Settlements
Clip with intersect or
Select containing
(if needed) select the right type of protected
area (watershed, natural park, forest etc.)
Select the settlements within this area.
11.166
The conflict maps that are created in this process will be
used to prepare proposed land use maps. This means that you
have be able to recognize the affected areas and that you
will have to be able to suggest measures and proposed land
use. Remember that one specific area can be part of more
than one land use conflict. Using the attribute table, you can
organize these data. For instance you can add columns in the
table:
Rip_conflict – riparian conflict area (yes or no)
Cur_landuse – current land use
Rip_measure – proposed measure/intervention with
respect to riparian conflict
Pro landuse – proposed land use after the measure has
taken place
You can use these fields again to make selections, calculate
areas etc.
Exercise 5.7
y.
Examples of land use conflict Map
Land use
conflicts
Residential
area conflicts
Intervention
map
Areas where the present land use is in conflict with one (or
more) of the regulations.
Similar to the land use conflicts, but restricted to residential
or urban areas but with the enclosure of the upland towards
the coastal environment.
After identifying the different land use conflict areas, there
has to be categorization since there may be redundancy of
data overlay (same areas containing multiple conflicts), the
LGU has to identify what kind of environmental intervention
they need to address to these areas. For example when there
is a clearly identified conflict with cultivated (agriculture)
area within slopes above 18% then the LGU needs to decide
11.167
what they plan in doing about it. For instance they can
identify it later as
1. agro forestry area or
2. as reforestation area or
3. remain as agriculture area for status quo.
So the intervention map, talks about how one LGU will handle
given all identified conflicts in their jurisdiction which is
according to existing administrative orders and regulations or
even the law. The actual decision making is not done in GIS,
but our maps are a strong tool in facilitating the discussion
and presenting and analysing the locations and areas affected
and we can present the new situation in a new map. Part of
creating this map can be done using the attribute table and
classifying the areas there.
Proposed land
use map
The proposed land use map is a culmination of the two above
prepared maps (and maybe others if other conflicts exist as
well). After having identified the different conflicts that they
have, the LGU can further decide on what to go about with
the existing land use of their locality.
Summary
In this lesson you have seen how you can get more value from your
data by performing spatial analysis. A first, strong way of analysing
your data is to select the right features in the drawing and study
the attribute data, or select features with the right conditions and
present these in a drawing. Using the complex selection options of
Manifold System, this can be done either in one drawing or
between drawings and tables.
The other strong feature is using the transformation toolbar in
which more and more complex analysis options are possible and
where also new drawing can be made by making smart selections
and combinations of drawings. Using exercises from the practice
from land use planning in the Philippines you have gained some
experience in using the analysis tools.
After steps in collecting and preparing data you have now gained
experience in analysing these data. The next step in the GIS
process in now to present the data that you have made and that is
the topic of the next lesson.
11.168
SESSION GUIDE:
Module 11
Session 11.7
Map Design
OVERVIEW
This Session is the last of the technical Sessions of this training toolkit and manual following
the usual workflow in GIS you have collected and edited the necessary data for SIMPLE. After
doing the analysis and preparing the necessary maps for the CLUP, it is now time to prepare
quality presentations for print or in digital form. In this Session you will gain first a
conceptual insight in how we observe and which elements can be placed in a map and what
their meaning is. After that we will prepare a lay-out for printing in Manifold System. The
Session will finish with some of the standards for data and colours that are set in the
Philippines and with instructions on how to prepare a print for a large scale printer.
In this lesson you will learn how to change the colours of a drawing according you your own or
specified settings and how to save and reuse these. Once you have the formatting of the
drawings set, then you will combine these into a map that is ready for distribution or
printing.
OBJECTIVES
After this Session, you will:
1.
Gain insight in how men observes and how to communicate with maps
2. describe cartographic elements and how these affect a map
3. Know how to prepare a map layout in Manifold System
4. Have insight in colour standards set by NGA’s in the Philippines
5. Have gained practical experience by combining these elements using realistic
exercises
DURATION
8 hours
CONTENT AND ACTIVITY
PLAN
Topics to be covered:
1. Changing symbology of drawings
11.169
2. Preparing a Layout in Manifold System
3. Creating a layout
4. Preparing for a large scale print
SUGGESTED METHODOLOGY
•
Presentation
•
Group Discussion
•
Exercises
•
Demonstrations
RESOURCES NEEDED
In order to follow this Session you should have understanding of the principles of Manifold
System and how it works with toolbars and panes. You should also know how to combine
different layers into a Map component and how to manipulate these layers.
The data for the exercises can be found on the DVD that goes with this toolkit.
REFERENCES
Deutsche Gesellschaft für Internationale Zusammenarbeit (GIZ) GmbH, Existing
PowerPoint and documents on Manifold GIS trainings, mostly compiled by Jay-ar
Ragub and Jerson Sala
Geerling, Gertjan, - Draft Manifold Hands-on Manual, not published
GIS tailor-made Inc. (2012) A GIS viewer for Leyte and Southern Leyte: Functional Design ,
GIZ ENRD and DP programs Philippines
GIS tailor-made Inc. (2011) A GIS viewer for Leyte and Southern Leyte: Inception report,
GIZ ENRD and DP programs Philippines
GIS tailor-made Inc. (2012) A GIS viewer for Leyte and Southern Leyte: Harmonization of
data , GIZ ENRD and DP programs Philippines
GIS tailor-made Inc. (2012) A GIS viewer for Leyte and Southern Leyte: user manual , GIZ
ENRD and DP programs Philippines
MANIFOLD System GIS Help,
MANIFOLD System GIS User manual, accessed on:
http://www.georeference.org/doc/whnjs.htm
Monmonier, Mark, H. J. de Blij (1996) How to Lie with Maps
Pakes, Ubo – GIS and visualization PowerPoint and Training materials, GIS tailor-made Inc
11.170
LECTURE POINTS:
Module 11
Session 11.7.1
Formatting drawings
O
nce a drawing has been imported and opened, we can change the way it
looks using the format toolbar. Used with drawings or drawing layers in
maps, the Format toolbar controls the colour, style and size of areas, lines
and points. Used with text components the Format toolbar controls the colour and
appearance of text labels in that layer. Used with images, the Format toolbar
controls the colour, style and size of painting tools. Note that the contents of this
toolbar depend on what component window or map layer is active.
FOR DRAWINGS THE FOLLOWING OPTIONS ARE AVAILABLE:
Areas Format - Foreground / background colours, Style and size for all
areas in this drawing.
Area Borders Format - Foreground / background colours, Style and size
for all area borders in this drawing. While the 1/20th of a point value
for border size works well for screen display it is wise to increase the
thickness of area borders for printed materials since 1/20th of a point
results in lines that are too thin for good visibility with most printers.
Lines Format - Foreground / background colours, Style and size for all
lines in this drawing.
Points Format - Foreground / background colours, Style and size for all
points in this drawing
•
Foreground Colour: The colour of solid points and lines and the foreground colour
of two-colour area styles or of two-colour area border styles. Choosing a
transparent colour for foreground colour for an area will turn off display of that
area. This is a short-cut way of turning off areas when desired.
•
Background Colour: The fill colour in most styles used for points, lines, areas and
area borders.
•
Style: The pattern or icon used to draw points, lines, areas or area borders.
•
Size: The relative size to use for patterns used to draw points, lines, areas and area
borders. Does not apply to bitmapped images used for points.
•
Rotation Angle: Allows rotating the symbols used for points to a given angle.
11.171
Below a short introduction is given, more
information can be found in the Manifold System
help file: look in the menu Help > Index and type
thematic formatting.
1. First open a project containing a drawing or import
a drawing.
2. Have a look at the table and decide what Field to
use. Field are sometimes also called column or
attribute.
3. Open the drawing (double click on it in the project
pane)
4. Locate the ‘format’ toolbar, see figure 2-1 below.
Format Toolbar
a. For linking area fill colour to a Field from a
table: click the area background button and
choose theme, see figure below. If you don’t
know what button to press, just hover your
mouse arrow above the buttons and wait for the
description to appear.
b. For linking a line colour to a Field, click the line
foreground button. This can be useful for
assigning colours to contour lines (elevation
lines).
Selection of Theme in Format toolbar
11.172
5. Choose the Field you want to use from the drop down menu
‘Field’. In the example below, it is ‘hectares’.
Formatting options
6. In the ‘Method’ drop down menu, choose the Method to be
used to construct intervals. Equal Count, for example, will
assign approximately the same number of objects to each
interval. Other methods are described in the table below.
Interval method selection
11.173
Method
Description
Equal Count
Assign interval values so that each interval contains the same number of
objects.
Equal Intervals
Assign interval values so that each interval contains the same range of values.
Exponential
Intervals
Assign interval values so that each interval contains an exponentially increasing
number of values.
Natural Breaks
Find clusters or groupings of objects by the given field and assign break values
so that each cluster is in a different interval.
Standard Intervals
Choose break values so that each interval represents one standard deviation.
Unique Values
Used with text and enumerated fields. Assign a break value for each unique
value that occurs in the field.
7. Choose the number of Breaks between intervals. This
specifies the number of intervals as well.
8. Change the Align to value if even numbers of tens,
hundreds, thousands, etc., values are desired for
intervals. Change the Range if the default entire
range needs to be extended or contracted.
9. Press the Tally button to create the given number of
intervals. If interval numbers different than those
created by the Method are desired, double-click into
the interval numbers to change them.
10. Either use a pre-set colour palette or click into the
interval colour boxes to change colours to whatever
range is desired. To use a palette, select it in the
Palette box and press Apply (
) to apply the pre-set
to the intervals. Check the Preview box to try out
different combinations and see how they look in the
drawing without committing the changes.
11. When satisfied, press OK.
Note: Not only line and area colours but all the items in the
Navigation toolbar can be connected to a field. For
example, size of points, shape of points, colour of
points, size of lines, etc. Just press one of the
navigation toolbar buttons, choose Theme. The
further procedure is similar as described in the text
above.
Note:
11.174
When a drawing contains more than one thematic
field and you want to show them at the same time.
Themes can be used to store different visualisations
of the same drawing. For more information look in
menu Help > Index and type themes.
Assign colors
to raster data
(surfaces)
Surfaces appear in a surface window as greyscale images
where lighter colours indicate greater heights. The word
"Height" is used even though the data values of a surface may
convey some other meaning, such as temperature. To change
the appearance of a surface window, use View -> Display
Options to change the settings.
Surface Display Options
By default, surfaces will appear as shaded surface renderings
with the colour of each pixel corresponding to the data value
at that spot as adjusted for highlights and shadows from a
Sun in the East. Other options include display of aspect or
slope, or use of shading. Palette controls are similar to those
used in Thematic Formatting of drawings.
Exercise 6.1
z.
Assigning colours to surface
11.175
Color
Standards
Sadly enough there are not yet many standards for the use of
colours and symbols in maps of the Philippines. The
topographic maps from NAMRIA have standard colours and
symbols which can be seen in the legend of the maps. Apart
from that, there are not many, so in most cases, you have to
create your own symbols. However, if you can avail of paper
maps from the map publishing agencies, please use the
colours in that map so that you follow that standard as much
as possible. Many of the colour standards that are presented
in this chapter are not officially standards, but have been
defined for the use with the Provincial Map Viewer in 2011.
CLUP
One exemption is the Comprehensive Land Use Plan where
the HLURB has set standards. The following standard is given:
No.
11.176
DESCRIPTION
COLOR
RGB VALUE
EXAMPLE
1
Residential
yellow
255
255
130
2
Commercial
red
255
0
0
3
Infrastructure/utilities
gray
190
190
190
4
Institutional
blue
0
0
255
5
Parks/playgrounds
light green
100
225
100
6
Industrial
violet
140
0
200
7
Agriculture
Green
0
150
0
8
Forest and Forest use
dark green
0
100
0
9
Mining/quarrying
brown
153
51
0
10
grassland/pasture
olive
90
125
40
11
Agro-industrial
Light violet
200
150
255
12
Tourism
orange
255
102
0
13
Cemeteries
black
0
0
0
14
Dumpsites/landfills
light grey
205
205
205
15
Buffer zones/Greenbelts
green yellow
173
55
7
16
Idle/Vacant land
17
Reclamation
sienna
142
107
35
18
Water uses
light blue
175
215
230
The colour coding in the table above is the one that is used in
the development of the provincial Map Viewer for Leyte and
Southern Leyte. It deviates from the official HLURB coding by
the fact that we have chosen the colour grey for dumpsites
and black for cemeteries where the HLURB is not giving
colours for those land uses. The land use reclamation area is
only to be used for newly reclaimed areas for which no land
use is proposed yet. As soon as a land use is proposed (or if it
is already in use), then the matching land use class should be
used.
If you can avail of real property data in GIS format from iTAX
or another GIS based system, then you also have information
on the land use as indicated in the taxation info. In that case,
we suggest that you use the same colour coding as presented
here for the CLUP.
Water uses
For water uses HLURB is also giving colour standards which
are colored blue (as in 5.3.1) with a hatch pattern. For the
provincial Map Viewer this has been adapted to the following:
code
description
1
Fishpond
2
Mangrove forest
3
Wetland
4
Sea grass area
5
Coral Reef
6
Fish Sanctuary
7
Nipa
8
Tourism
9
Fish cages
10
Seaweed culture
colour
During the development of the Map Viewer in a discussion
with HLURB region 7 it became clear that for the water uses
mangrove forest, tourism, nipa also the colours from the
5.3.1 would be accepted.
11.177
Classified Slopes
Classified slopes are used in a number of cases to determine
possible land uses and or land use conflicts. For the Provincial
Map Viewer the following classes and colours are suggested:
CODE
DESCRIPTION
COLOR
M
Level to nearly level (<
3%)
green
N
Gently sloping to
undulating ( 3 -8%)
O
RGB VALUE
EXAMPLE
0
255
0
green yellow
173
255
47
Undulating to rolling (818%)
yellow
255
255
0
P
Rolling to moderately
steep (18-30%)
yellow
orange
255
215
0
Q
Steep (30-50%)
orange
255
165
0
R
Very Steep (50-90%)
red
255
0
0
Natural hazard data
The area for which you are working may be susceptible to one
or more natural hazards. For the Provincial Map Viewer the
following generic symbology has been defined.
VALUE
DESCRIPTION
COLOR
RGB VALUE
EXAMPLE
1
Not Susceptible
green
124
252
0
2
Low Susceptibility
yellow
255
255
0
3
Moderate Susceptibility
violet
208
32
144
4
High Susceptibility
red
255
0
0
The description can be made to fit to match the specific
natural hazard (High susceptibility to landslide hazard for
instance). In case you want to combine more natural hazards
into a multi hazard map, you may consider giving the
different hazards a different hash marking, while keeping the
foreground colour the same and making the background
colour transparent. This way you can combine hazards in one
map or easily combine them with other data (which parcels
are affected by tsunami hazard).
Exercise 6.3
Making the colored maps.
aa.
11.178
Map
Preparation
Displaying data so that you can analyse spatial patterns on a
computer screen is usually the first step in your GIS works.
The next is often the printing a map for other people to look
at. In this case, the basic features you use for your analysis
may not be enough and for this Manifold System has a
separate option in the project pane for making layouts. Here
you can find a set of distinct functions and makes available a
series of tools for designing map layouts that you don’t need
until you are ready to print.
A map is a visual presentation of the data that we think are
so important that they should be placed on paper (or on a
digital folder). A map is a visual way of communication and
with all communication issues we have to think about the
message we want to convey and about the target audience
(or to whom do we want to convey the message. In order to
do this in a regular and organized way there are 12 steps we
can take.
The 12 steps are:
1. What purpose does the map serve?
2. What user group is aimed at?
3. What is the title of the map going to be?
4. What components are to be displayed in the legend?
5. What is the hierarchy of the components?
6. What is the attribute scale of these components?
7. How many classes does each component contain?
8. Which graphic symbols can be used?
9. Which graphic attributes have to be included?
10. Do I need a North arrow?
11. Do I need a Scale bar?
12. Should I mention the source of my data?
11.179
Map Elements
Map frame
In Manifold System this is the frame with the map that you
can place in your lay-out. The Map frame is the actual area
on your final product where the map is placed. In many cases
this will be an area which is separated from the other map
elements, but this is not always the case. For instance if you
are making a poster or a map for a colour magazine, the map
may be cover the whole page. There are also instances that
your final product will have more than one map (frame) for
instance if you compare two situations. Your final product
will however always have at least one map frame.
Legend
Unless the map clearly speaks for itself, you may have to add
a legend. A legend is a small display that provides captions,
summarizes formats or otherwise explains what is seen in a
window or in a print layout. Legends appear to float over the
window and are always on top of other items in the window.
Legends may use simple, default styles or they may consist of
complex and sophisticated items. Legends will often show
object formats for drawings, surface colours by height for
surfaces, thematic formats for labels (if present), and colours
in images.
Although legends are part of a component like a drawing,
they are an accessory item like a north arrow or scale bar
associated with that component and are not the same as the
actual contents of the component like the points, lines and
areas that make up a drawing. Legends are not edited using
tools such as painting tools for an image or the various
editing tools available for drawings. Instead, legends are
edited using settings in the Legend dialog.
Except for layouts, each component has one legend. A
component remembers the settings for its legend as part of
the properties of that component.
Print layouts may contain multiple legends, including even
multiple copies of the legend for each component that
appears as an element in the layout. An entire legend or any
part of a legend may be composed for us automatically by the
system or we can manually specify all or any part of a legend.
Automatically-created legend items may be dynamically
updated if the information they show, such as thematic
formatting, changes. Dynamic and static parts of legends may
be mixed, so that part of a legend (such as a title) may be
manually specified while other parts, such as the colours and
values for thematic formatting, may be dynamically
generated by the system.
Before you add a legend to a map or a layout, it is
good practice to consider the look and feel of your
11.180
map layer first:
•
Is the name in the properties pane (that will show in
the legend) logical (“Barangay boundaries” vs.
“brgy_bnd drawing”
•
Are the units in my legend logical and consistent (for
instance an automated class may reach from 0 – 4.98.
Setting this from 0 – 5 makes a lot more sense)
•
Are the colours that I use correct
•
Does this element need to be in the legend (the big
blue area next to a coastal barangay will be
interpreted by almost all people as the sea. Do you
then really need it in your legend?)
•
It is also good practice to have a hierarchy in the
order in which elements in the legend are presented.
From top to bottom this would be:
o
Point drawings
o
Line drawings
o
Polygon drawings
o
Surfaces/images
North arrow
The north arrow is (usually) an arrow that points to the
North. In Manifold System you have choice of a number of
North Arrows that can be used. In Manifold System the
components are always displayed "North up" based on the
assumption that they have been created that way in a
geographic context. Therefore all correctly georegistered
components will always be "North up”. On rare occasions we
may work with drawings or images that are not
georegistered, for example, scanned images or designs that
have been made in AutoCAD and that are imported using the
AutoCAD DXF format. These are usually designed using the
front facade and not the north as reference. In such cases
and only in such cases if we know the correct orientation for
the North Arrow, we can use the Bearing value to provide a
North Arrow that is not aligned straight up. Instead, the
North Arrow will point to North at whatever Bearing rotation
has been specified (with the default 0 degrees pointing
straight up).
Scale bar
A scale bar displays the current scale of the map and gives an
indication of how long a specific unit of length is. The units in
the scale bar can be chosen and will usually be kilometres or
meters or miles. When you place a scale bar in your map,
make sure that you use logical units for the scales. If a scale
bar does not change size when the Display number is changed
or if it otherwise misbehaves, consider if the number of units
11.181
to display would cause the scale bar to be less than the
minimum size specified (an underflow) or larger than the
maximum size specified (an overflow).
Supporting text
Supporting texts can take many forms and sizes. One of the
most obvious is of course to give your map a relevant title. It
is common to use a descriptive title (Overview map of
Barangay XX), but also more action directed texts can be
used for a title “Municipality is addressing flood problems!”.
Other texts can be legal disclaimers and more. Also the labels
that you can place on your drawings are considered to be
texts and should be treated as such. Do not place too much
texts and different fonts on your map in order to keep the
design easy to read. Italic fonts in maps are usually reserved
for water features (names of rivers etc.). Please consider the
audience of your map, if the map is used for discussions with
the people in a barangay, you may consider using your local
language instead of English.
Spelling errors in your maps can be irritating and can keep
your audience from focusing on the message of your map.
When in doubt, copy your texts into Word or another word
processor and use the spell check. You can then copy the
correct texts back in your map.
Supporting graphics
Your map can have a number of supporting graphics. These
can come in many shapes and sizes. You can think of a photo
at the background of your map when you are preparing a
poster. You can of course place the logo of your organization,
graphs and more. Before placing these graphics, consider
their use. Photos of affected areas can strengthen a map with
natural hazard zones etc. Too much graphics however can
make your map too crowded and difficult to read.
Source/colophon
It is good practice in making maps to add information on the
map. Usually this contains the following information;
•
The name of maker of the map and information on the
organization where the maker is working (name,
address, logo etc.)
•
Production date
•
Production framework (special project, for CLUP etc.)
•
Possibly legal information
Grids/graticules
Graticules are lines that are parallel to meridians of longitude
and parallels of latitude. Graticule lines will be curved in
11.182
geographic projections. Graticules may be shown as system
items in the window or may be saved as objects into a
drawing. There is a difference between graticules and grids.
In Manifold System, selecting the option for the graticules
will display the coordinate values in geographic coordinate
system, while the grid option will display values in the
projected coordinates system (e.g. UTM if that is selected).
They may add additional information to maps that cover a
large area, but for non GIS users, adding labels for cities or
provinces may be more meaningful. Graticules can be added
to your lay-out. Graticules can be added to your map by first
defining them in the map element using the View – Graticule
command. The next step is to double click on your layout to
open the properties menu and switch on the graticules. The
matching texts can be set using the options in the border.
Exercise 6.4
bb.
Making a map design
11.183
Tips and Tricks
Before you start
When making a layout for printing, especially in new or
unfamiliar formats, to make first a sketch on paper and
add all the elements that should be contained in the map.
A quick exercise like this can give you a good indication
which elements can be placed where without crowding the
layout too much.
Our eyes
The computer screen can display many more colours than
our eyes are able to see under normal conditions. For this
it is good to limit the number of colours in your map.
Please consider the following aspects when you design your
map:
The average person can only distinguish 7-8 colours and 3-5
grey shades on a map. Adding more may not really
contribute to adding more information, especially if the
colours are similar. In these cases, boundaries improve
distinction of colours that are close to each other
Red and Yellow are dominant colours and tend to pop out
while green and blue tend to vanish. You can also use this
for simple maps in the traffic light colours:
•
Red = warning or not good
•
Orange = in between or neutral
•
Green = positive or good
Saving Ink
When you print on a colour ink jet printer there are types
of paper that can really soak up so much of your ink. If you
don’t have the option to use good quality paper, then do
not use a solid colour for your areas. If you use a dense
dotted or densely hashed pattern, the soaking effect of the
paper may just work in your advantage to create a solid
fill.
Viewing texts
When you are preparing for a map that it is sometimes
difficult to judge if the texts can be read by the audience.
In that case, set the viewing scale of the map to 100% (real
life size) and if you are making a poster, step back to see if
the elements are still clear and can be read.
Transparency
In a map page you can set the transparency of your
11.184
drawings and images. Using the transparency is a great way
to let your area of interest really stand out. For instance if
your area of interest in one barangay in the municipality,
then consider adding a drawing of barangays in which all
barangays are colored white without an outline. Now set
the transparency to 50%. Now if you change the white
colour of your barangay to only the outline (no
foreground), then it really stands out from the crowd.
Make sure that this layer is always on top in your layout or
the effects will be less.
Hierarchy of elements
What is the most important in your map should also be
most visible in your map. You can achieve this using the
size of the element (the map will be bigger than the north
arrow), use of colours and colour intensities (primary
colours can be stronger then greys or pastels) and by the
way you design the layout.
Aligning elements
A good layout is pleasing to the eyes. One of the ways to
achieve this is to create balance in the way you place your
map elements. In Manifold System, you can easily align
your elements so that a more pleasing design is achieved.
Bounding boxes
Also placing boxes on elements creates a sense of unity
and if you place a box around a number of elements, then
these are visually combined into one element which
creates a more balanced look. Look at the following image
to see the effect of aligning and placing boxes.
11.185
LECTURE POINTS:
Module 11
Session 11.7.2
Preparing a Layout in Manifold System
M
aps in Manifold System are based on spatial data. Spatial data refer to the
geographic location of features on the Earth's surface, along with attribute
information describing what these features represent. You can communicate
complex information more effectively using maps than tables or lists, because
maps take advantage of our natural abilities to distinguish and interpret colors,
patterns and spatial relationships.
When you display your data on a map you will see distributions, relationships and trends
that you did not see before. Your maps will help you make decisions and solve problems.
They will also help to communicate your information and results more effectively to
others.
Choosing how to represent your data on a map may well be your most important mapmaking decision. Symbolizing your data involves choosing the colors and symbols that will
represent features. It also involves grouping or classifying features according to their
attribute values. Symbolization is a powerful tool for exploring, understanding and
analyzing your data.
Laying out
and printing
maps
You've displayed your data in a data frame. You've chosen the
symbology you want to use and you've labelled your data
frame with the information you want to include. Now you
want to print it out with a title, scale bar, legend, north
arrow, descriptive text and some other graphics, like neat
lines. To do this you have to create a layout.
A layout lets you assemble all the components you want to
appear in a map, arrange them together to get the design you
want, and then print it out when it's ready. Layouts make it
easy to produce presentation quality maps with Arc map. You
can place more than one data frame onto your layout along
with any of the charts and tables in your Arc map document.
If you change your mind later, you can add, remove, resize
and move each element in a layout as required.
11.186
LECTURE POINTS:
Module 11
Session 11.7.3
Creating a layout
L
ayouts may be created in two ways. The first way is to create a layout based
on a particular component, such as a drawing, and to then add any other
components to the layout. The second way is to create a blank layout and to
then drag and drop components into the layout.
The first method will automatically scale the component that is used to create the layout
to fill an entire page or, in the case of text components like tables or comments, the
layout will be expanded to a multipage layout to allow the entire component to be printed.
This component will automatically be the main component so that addition of any system
generated text expressions will use this component. The first method is convenient when
one main component will be the subject of the layout.
The second method may be more convenient when several components will be the subject
of the layout, or when a layout is being created for use as a standard layout with many
different projects.
Overview of
the Create a
Layout
procedure
1. Click on the project pane and create a new layout with File
> Create > Layout. If the layout is to be based upon a
particular component, choose that component in the
Create Layout dialog.
2. In the Create Layout dialog, if a template is to be used
check the Template box and choose a template. If the
layout is to be blank, check the No parent box and no
component will be loaded into the layout by default.
11.187
3. Open the new layout (located in the project pane). It should
appear as an empty sheet in the window.
4. Verify paper size and other overall options are correctly
specified in File > Page Setup.
5. Drag and drop components that are to appear from the
project pane into the layout.
6. Insert any objects such as vertical or horizontal lines, text
labels, and north arrow using the buttons from the Tools
toolbar.
7. Edit the component elements in the layout to change size,
position, views to be printed, etc. To resize or move press
the CTRL+ALT keys and click on the items using the mouse.
Items will appear as shown below (example of Philippine
map), and can be moved or resized by dragging the cornerblocks.
11.188
8. Double click on the layout to see and change the properties
of the layout. The following menu will show
9. Use File > Print to print the layout.
Creating a layout based upon a non-text component, like a
drawing, will automatically scale the component to fit the entire
component on a single, full page. Creating a layout based upon a
text component such as a table, query, script or comments
component will automatically invoke the multipage layout
capability to use as many pages as are necessary to show the
entire component in the font size that is used.
11.189
Using the
Tools toolbar
The tools toolbar for layouts allows us to insert additional design
elements into a layout. When a layout is the active window, the
tools toolbar will change to show tools used with layouts.
Insert Horizontal Line - Create a horizontal line in the
layout. Default line size is 1/20th of a point. You can
change the line thickness and colour of the after selecting
the line in the format toolbar
Insert Vertical Line - Create a vertical line in the layout.
Default line size is 1/20th of a point. You can change the
line thickness and colour of the after selecting the line in
the format toolbar
Insert Box - Create a rectangular box with a click and a drag.
Boxes have foreground and background colour and line
thickness that can be set by selecting the box and using the
format toolbar. Default line size is 1/20th of a point. You
can change the line thickness and colour of the after
selecting the line in the format toolbar
Insert Box on Center - Create a rectangular box centered on
initial mouse click. Default line size is 1/20th of a point.
You can change the line thickness and colour of the after
selecting the line in the format toolbar
Insert Text - Add a text box, such as a caption,
copyright notice or title, to the layout. Click on the
text box to select it and then use the format toolbar to
format the text. Double-click a text box in the layout to
edit the text it contains.
11.190
As you can see from the menu, you have options for
standard, pre-set texts, but you can also enter your own
texts. You can change the text and the text box properties
in the format toolbar when you select the text box
Insert Legend - Add a legend to the layout, based upon a
component used in the layout. Inserting a legend will raise a
dialog asking upon which component the item is to be based.
If the layout does not contain any components for which a
legend can be created, these buttons will be disabled.
Double clicking on the legend shows a menu in which you can
change the settings of the legend (like which map elements
to place in the legend and how these should look and feel.
Make sure that you have placed a checkbox in the show
legend option.
If you are not satisfied with the standard options (and in many
cases, you will not be satisfied with these, then check the box
besides customize legend. This gives you many more options to
tailor the legend to your desire. Keep in mind that formatting the
different drawings and images so that the colours look good in your
map and legend should be done before you prepare your layout.
Insert North Arrow - Add a North arrow to the layout, based
11.191
upon a component used in the layout. Inserting a North
arrow will raise a dialog asking upon which component the
item is to be based. If the layout does not contain any
components for which a North arrow can be created, these
buttons will be disabled. If you double click on the northarrow you have options for the placement of the North
Arrow and under the style button there is a huge array of
possible North Arrows available for you to use. If your map
is not North-South oriented, then you can use the bearing
option to make the angle of the North Arrow match that of
the layout.
Insert Scale Bar - Add a scale bar to the layout, based upon a
component used in the layout. Inserting a scale bar will
raise a dialog asking upon which component the item is to
be based. If the layout does not contain any components for
which a scale bar can be created, these buttons will be
disabled. As with the North Arrow and Legend, double
clicking will give a menu in which the properties of the
scale bar can be set
When inserting horizontal or vertical lines, it is usually best to turn
on the grid with View - Grid and to then use Snap to Grid to
11.192
position layout element such as vertical and horizontal lines.
Making a good layout may mean that you have to place and move
different map elements in order to get a pleasing result. A good
tool to help you with is the alignment toolbar which makes it easier
to align your elements
When you are working on an area, it may be good to assign one or
more views. A view is a specific view of an area that is saved into a
window at a given location and zoom level under a specific name.
It is possible to create a view for every municipality in a province.
By clicking on the view in the views pane, Manifold System will
automatically navigate to the predefined area and scale. Note that
when a component is projected, saving a view at a given zoom
level is really saving a view at a specified scale, the scale at which
the view is displayed. For setting and using views, you have to open
the Views Pane (tools - options - views).
Exercise 6.5
cc.
Make a print layout
Using
templates
Layout templates are pre-defined arrangements of layouts
that may be invoked when creating a new layout or applied
to an existing layout.
To use a template when creating a layout, in the Create
Layout dialog check the Template box and choose a
template. To apply a template after creating a layout, open
the layout and use the Edit - Template - Apply command to
use a built-in template or a template added to the system
through customization, or use the Edit - Template - Apply File
command to apply a template from a file.
To create a new template, create a layout and then use the
Edit - Template - Save command to save the layout to a file
for use as a template. The Edit - Template - Apply command
also allows us to use a layout in our project as a template to
be applied to the current layout.
11.193
Exercise 6.6
Making a layout and saving it as a template
dd.
11.194
LECTURE POINTS:
Module 11
Session 11.7.4
Preparing for a large scale print
W
ith GIS we will be preparing many maps and some of them will be printed
on paper sizes bigger than our normal office printer. Working with paper
sizes like that we need to prepare some extra steps in order to make the
print work. First of all, make sure that you have the correct printer installed and
that your printer drivers are up to date. To show you the steps you need to use, we
show here the example of plotting to a HP Designjet 510 (42 Inches), if you have
another printer, the details may vary, but the steps are the same.
Printing in the plotter within Manifold System System:
•
At the start of creating your layout: make sure the plotter is on (or any printer
you want to print at).
•
Set your page size first before finishing your lay-out. Do this by opening the
layout and go to File>Page Setup.
•
A window will open and click on Printer button.
•
Select hp designjet 510 42in printer and click on Properties button.
•
The hp designjet 510 42in properties window will appear, Click on Custom
button for a custom page size.
•
The Custom Page size window will appear and you will now input the desired
custom page size. Please see the Print out on the paper sizes to do this.
Commonly base maps will be printed in A0 or A1 paper sizes. Note: be careful
in inputting the values here.
•
If you have properly encoded the correct page size, hit OK on the Custom Page
Size window to close it> hit OK on the hp designjet 510 42in properties window
to close it > hit OK on the Printer Page Setup window> hit OK on the Manifold
System Page Setup window. Your layout will now automatically adjust to your
desired page size.
•
If you are done with your layout you can now just click on Print. The print
settings you made earlier will be carried over when you do your final print out.
Oftentimes, the printed map may not be the desired map you want. There may
be layers missing, roads or segment of land use not colored properly. This is
due to printer drivers setup and hp is a common culprit to this (not unlike
Epson, so I suggest if you are planning to purchase a printer in your LGUs to be
used in Manifold System, go for Epson).
•
If you want to use a PDF printer driver to print to a PDF file for further use, the
steps are similar, just make sure that you select the right PDF printer.
11.195
Summary
In this Session you have learned some elements of a balanced
layout and how to create a layout in Manifold System. A major
element of a good map is a good representation of the map
elements that are included in the layout. This was the last
technical Session on Manifold System GIS. The next Session, Session
7 will focus on a number of new technologies that can change the
way how we collect our data.
11.196
11.197
SESSION GUIDE:
Module 11
Session 11.8
New Developments
OVERVIEW
This last lesson will allow more insights to be obtained in new developments that may
change the way GIS data are collected.
In particular, relatively new tools and approaches are presented in data collection for
location specific areas of interests (e.g., Municipality or City). The tools are however not
always suitable for everybody or every case (for instance some tools need many people
with internet access). The tools and examples presented show in some cases how GIS
changing from a tool for experts to location based content in social media and how this
can be used to your advantage in collecting data. Some of the other tools show more
technological developments which help in collecting either more accurate or new
information. As such, this learning session does not provide exercises. Rather, it will
provide a number of links in the internet for further readings on the tools or elaboration
of cases. This lesson comprises from the following elements:
New developments in GPS
Depth sounders and coastal zone mapping
Tools for participatory data collecting
Crowdmap
Open Street Map Philippines
Collecting data using structured questionnaires in Android
Provincial map Viewer
OBJECTIVES
This lesson is envisaged to give broaden one’s understanding of new developments in GIS
that could be useful for the data collection local planning purposes. After this module, the
participants are expected to:
1. Contextualize usefulness of new developments with respect to GPS
2. Gain knowledge on tools and processes for participatory mapping
3. Obtain familiarity in the use of android cell phone based tools for data collection
4. Recognize the possibilities of depth sounders for Marine/Coastal Mapping
5. Appreciate the potentials of using the Provincial Map Viewer for development
planning.
11.198
DURATION
2 hours
CONTENT AND ACTIVITY
PLAN
Topics to be covered:
1.
2.
3.
4.
5.
6.
New developments in GNSS
Depth Sounders and coastal zone mapping
Tools for participatory data collection
Open Street Map Philippines
Data collection using Android devices
Open Data Kit
7. Provincial Map Viewer
SUGGESTED METHODOLOGY
•
Presentation
•
Self-study
•
Demonstration when requested
RESOURCES NEEDED
For this module there are no special requirements needed.
From the earliest history in cave drawings to navigational charts to GPS, people have created
and used maps to help them define, order and navigate their worlds. Four hundred years ago,
it was cartographers, often working alone, who used the stars, mathematics and early
attempts to represent longitude to map the New World. Today, it’s crowds, not scholars, who
are charting their own world. A combination of the old art of mapping with the relatively new
art of crowd sourcing — the open calls for action via the Web — offers the potential to open
up a new path for the developing world: helping citizens map their own country’s facilities
and thereby have a greater say in charting the future. Citizen cartographers can be a
powerful force. In the aftermath of the Haiti earthquake, rescue workers used real-time data
uploads on Open Street Map, via text and cell phone messages, to help create up-to-date
maps of Haiti and find the injured. Engineers from around the globe gathered “virtually” to
assess the damage. In the 17th century, imperial cartographers had an advantage over local
communities. They could see the big picture. In the 21st century, the tables have turned:
Local communities can make the biggest on the ground difference. Crowd sourced citizen
cartographers can help make it happen.
(after: Empowering Citizen Cartographers, By CAROLINE ANSTEY, Published: January 13,
2012)
In the following paragraphs we would like to demonstrate to you a number of the tools and
resources that may help you in your future projects.
11.199
REFERENCES
Anstey, Caroline (2012), Empowering Citizen Cartographers, New York Times
Crowdmap – http://www.crowdmap.com
Harrassmap – http://www.harrassmap.com
Open Data Kit http://www.opendatakit.org
Open Street Map Philippines – http://www.openstreetmap.com
GIS tailor-made Inc – 2012 A GIS viewer for Leyte and Southern Leyte: Functional Design ,
GIZ ENRD and DP programs Philippines
GIS tailor-made Inc – 2011 A GIS viewer for Leyte and Southern Leyte: Inception report ,
GIZ ENRD and DP programs Philippines
GIS tailor-made Inc – 2012 A GIS viewer for Leyte and Southern Leyte: Harmonization of
data , GIZ ENRD and DP programs Philippines
GIS tailor-made Inc – 2012 A GIS viewer for Leyte and Southern Leyte: user manual , GIZ
ENRD and DP programs Philippines
QuantumGIS for Android – http://hub.qgis.org/projects/android/gis
USHAHIDI – http://www.ushahidi.com
Votereport Philippines – http://www.votereport.com
WIKEPEDIA Echo Sounding http://en.wikipedia.org/wiki/Echo_sounding
11.200
LECTURE POINTS:
Module 11
Session 11.8.1
New developments in Global Navigation
Satellite System
GPS
A new generation of American GPS satellites offer an even
more accurate determination (two times more accurate) of
your position by using an improved atomic clock, better
resistance against disturbances of the signal and by having a
longer estimated lifespan. The new satellites will be used for
both military and civil aviation use and offers more
possibilities for search and rescue. The GPS IIF builds on 30
years of experience with the existing 39 satellites.
The GPS IIF satellite is crucial for the keeping the GPS
constellation available worldwide for its over one billion users
in civil, commercial and military applications.
Galileo
Galileo is a global navigation satellite system (GNSS)
currently being built by the European Union (EU) and
European Space Agency (ESA). The project is named after the
Italian astronomer Galileo Galilei. A major aim of Galileo is to
provide a high-precision positioning system upon which
European nations can rely, independently from the Russian
GLONASS, the US based GPS, and Chinese Compass systems.
Basic navigation services will be free of charge. Galileo is
intended to provide horizontal and vertical position
measurements within 1meter precision and better positioning
services at high latitudes than other positioning systems. As a
further feature, Galileo will provide a unique global search
and rescue (SAR) function. Satellites will be equipped with a
transponder that will relay distress signals from the user's
transmitter to the Rescue Co-ordination Centre, which will
then initiate the rescue operation. At the same time, the
system will provide a signal to the users, informing them that
their situation has been detected and that help is on the way.
This latter feature is new and is considered a major upgrade
compared to the existing GPS and GLONASS navigation
systems, which do not provide feedback to the user.
The use of basic (low-precision) Galileo services will be free
and open to everyone. The high-precision capabilities will be
available for paying commercial users and for military use.
The Galileo system will have five main services:
1. Commercial navigation (encrypted) High precision to
the centimetre; guaranteed service for which service
11.201
providers will charge fees.
2. Open access navigation: This will be available without
charge for use by anyone with appropriate massmarket equipment; simple timing, and positioning
down to 1 meter.
3. Safety of life navigation Open service; for applications
where guaranteed precision is essential. Integrity
messages will warn of errors.
4. Public regulated navigation (encrypted) Continuous
availability even if other services are disabled in time
of crisis; Government agencies will be main users.
5. Search and rescue System will pick up distress beacon
locations; feasible to send feedback, e.g. confirming
help is on its way.
An exciting new development with Galileo will be that it also
has options for indoor navigation, something that is not
possible with the traditional GPS.
GLONASS
GLONASS or acronym for Globalnaya navigatsionnaya
sputnikovaya sistema (Global Navigation Satellite System in
English), is a space-based satellite navigation system
operated by the Russian Aerospace Defence Forces. It both
complements and provides an alternative to the United
States' Global Positioning System (GPS) and is the only
alternative navigational system in operation with global
coverage and of comparable precision. The development of
GLONASS began in the Soviet Union in 1976. Beginning on 12
October 1982, numerous rocket launches added satellites to
the system until the constellation was completed in 1995.
During the 2000s, the restoration of the system was made a
top government priority and funding was substantially
increased.
By 2010, GLONASS had achieved 100% coverage of Russia's
territory and in October 2011, the full orbital constellation of
24 satellites was restored, enabling full global coverage. The
GLONASS satellites' designs have undergone several upgrades,
with the latest version being GLONASS-K. There is no clear
advantage other than accuracy over GPS. When used alone
GLONASS doesn’t have that strong coverage as GPS has, but
when both used together certainly increases accuracy with
coverage. And it is more useful in northern latitudes as Russia
started GLONASS originally for Russia. The accuracy is an
advantage of GLONASS with up to 2 meter of accuracy. GPS +
GLONASS allow your device to be pin pointed by a group of 55
satellites all across the globe. So when you are in a place
where GPS signals are stuck like between huge buildings or
subways, you will be tracked by GLONASS satellites
accurately.
Some modern receivers are able to use both GLONASS and
11.202
GPS satellites together, providing greatly improved coverage
in urban canyons and giving a very fast time to fix due to over
50 satellites being available. In indoor, urban canyon or
mountainous areas, accuracy can be greatly improved over
using GPS alone.
Actions were undertaken to expand GLONASS's constellation
and to improve the ground segment in order to increase the
navigation definition of GLONASS to an accuracy of 2.8 m by
2011. In particular, the latest satellite design, GLONASS-K has
the ability to double the system's accuracy once introduced.
The system's ground segment is also to undergo
improvements.
Beidou
Where the previous systems operate with satellites that are
circling the earth and therefore maintain a worldwide
coverage, the Chinese Beidou system works differently. It has
a limited number of 4 satellites in a stationary orbit (or fixes
position). This limits the costs of the GPS system, but also
limits the area of coverage (see figure).
Also the calculation of the location is done differently:
A signal is transmitted skyward by a remote terminal and this
is received by all satellites. Next each satellite sends the
accurate time of when each received the signal to a ground
station. The ground station calculates the longitude and
latitude of the remote terminal, and determines the altitude
from a relief map. The ground station sends the remote
terminal's 3D position to the satellites and from the satellites
broadcast the calculated position to the remote terminal
(your hand held device).
In 2007, the official Xinhua News Agency reported that the
resolution of the BeiDou system was as high as 0.5 meters,
considerably better than unaided GPS. With the existing user
terminals it appears that the calibrated accuracy is 20m
(100m, uncalibrated).
11.203
LECTURE POINTS:
Module 11
Session 11.8.2
Depth Sounders and coastal zone mapping
T
he Philippines as an archipelagic country relies heavily on its fishery
resources and the coast. With more than 60% of the population living near
the coastal areas, and half of all municipalities and cities located along the
coasts and rivers (NSCB 2012), the nation needs a proper coastal resource
management system in place.
Over several decades, coastal and fishery resources have come under increasing threat due
to human activities and to changes in climatic conditions which affect the lives of coastal
communities. The Local Government Code of 1991 (LGC) provided the means for local
government units (LGUs) to develop several management plans. Although coastal resource
management plans can be counted as one of them, the overall current scenario still allows
for anyone to have unregulated access to the coast and municipal waters and extract
resources unchecked. This open-access regime provides limited or no control mechanisms
for local governments over the harvest of coastal and fishery resources. Resource use
conflicts in the coastal areas such as commercial fishing in municipal waters result in the
over exploitation of limited fishery resources and the deprivation of fisherfolk. Population
pressure has contributed to overfishing and the use of destructive ¬fishing practices like
blast and poison ¬fishing. Valuable coastal habitats like mangrove forests, seagrass beds
and coral reefs are losing their ability to provide breeding grounds for marine organisms
and other essential ecosystem services such as pollution control. Coastal pollution lowers
environmental quality and natural production thereby affecting coastal ecosystems and
fisheries.
Many of the coastal resources depend for their existence on specific natural conditions like
water depth, type of seafloor substrate etc. In many cases, these are not known, especially
in those areas that are always submerged. Using a depth sounder and GIS these features
can be mapped and used as input for management and planning purposes.
Echo sounding is a type of SONAR that can be used to determine the depth of water by
transmitting sound pulses into water. The time interval between sent and return of a pulse
is recorded and is then used to determine the depth of water along with the speed of
sound in water at the time. For Coastal Zone Management purposes this is very usefull
since it gives us a relatively quick and affordable way of mapping the depth (and in some
cases also the type of seafloor) of the coastal zones.
Echo sounding can also refer to hydroacoustic "echo sounders" defined as active sound in
water (sonar) used to study fish. In fisheries these are quite often referred to as fish
finders.
Although it sometimes may be confusing, the word sounding is used for all types of depth
measurements, including those that don't use sound, and is unrelated in origin to the word
sound in the sense of noise or tones. Echo sounding is a more rapid method of measuring
depth than the previous technique of lowering a sounding line until it touched bottom. The
depth of the water is calculated by dividing the time between sent and returned pulse by
two and then multiply with the sound of speed in the water (approx 1.5 km/sec). The
signal is sent and received by a transponder which should in all cases be fully immersed in
water and be placed at the stable location in the boat. Generally a places in the center of
11.204
the boat (a stable location) and out of the turbulent water from the boats screw and
engine are recommended.
From Wikipedia, source: EM 1110-2-1003, Manual of Hydrographic
For Surveying,
mappingbased
purposes,
not only the depth,
but also the location
of this depth is required.
upon Principle_of_SBES.jpg
by en:User:Mredmayne.;
by
For Brandon
this reason
many
of
the
depth
sounding
devices
are
combined
with a GPS unit and some
T. Fields (cdated) via the US Army Corps of Engineers)
kind of data logger for storing the locations and the depths at those locations. (note, an
additional handheld GPS may be needed to navigate the area in a predefined pattern to
make sure the area is well mapped)
The transducer can be either placed on a
fixed location in the boat (usually through
the hull) so that all the cables can be kept
out of the way, or an external fixture has
to be made. Having the transducer fixed in
the hull has the advantage that once
placed, the location is good and the depth
sounder is easily made operational. It can
however not easily be transferred to
another boat. Having an external mount
for the transducer (and GPS) makes it
possible to work from a broad range of
boats and banka’s.
Geoplan staff installing the transducer and GPS
unit on the outrigger of a banca using an aluminum
rod, clamps and tie wires.
As opposed to the one beam from a single
beam depth sounder, a multi beam uses
more than beam and therefore can map
out a bigger area in one sweep. Most
modern systems work by transmitting a
broad acoustic fan shaped pulse from a
specially designed transducer across the
full swath across track with a narrow along
track then forming multiple receive beams
(beamforming) that is much narrower in
the acrosstrack (around 1 degree
depending on the system). From this
narrow beam a two way travel time of the
11.205
acoustic pulse is then established utilizing a bottom detection algorithm.
Illustration of echo sounding using a multibeam echosounder.
From Wikipedia, http://www.navy.mil/view_single.asp?id=2767
The side view sonar works different again. Here a big transponder is pulled under water at
a specific depth and instead of a top-down view, this creates a more side view image of
the underwater world. This tool is more used for deep water and the detailed scanning of
wrecks and other underwater structures.
Practical issues:
•
In order to have a reliable depth map, you need to correct for the
effect of the tide since this effects the depth of the water (the same
location with be deeper at high tide then at low tide). Much of the
software that comes with the depth sounder is able to this for you. Tide
data can be found on the internet or can be obtained from the right
authorities (which o which).
•
In order to have a good and reliable map, navigate in a regular pattern.
Prior to mapping, design transects or a raster in GIS and transfer this to
the GPS. This will guide the boatman in navigation (how and where to
navigate).
•
Make sure you know how deep your transducer is in the water so that
you can correct for that (if your transducer is 20 cm below the surface,
you have to add 20 cms to the depth of the water. Also if your mapping
takes more than one day, make sure that the transducer and GPS are at
exactly the same location (and depth) to prevent mistakes.
•
Don’t go out on rough seas. Apart from the danger to you and the
equipment, high waves also strongly affect the depths you perceive (but
which may be caused by waves)
•
Make sure that all equipment is well secured and (when necessary)
water proofed
11.206
LECTURE POINTS:
Module 11
Session 11.8.3
Tools for participatory data collection
Crowdmap
Crowd mapping (a combination of crowd sourcing and
mapping) can be described as the aggregation of crowdgenerated inputs such as text messages, photos and social
media feeds with geographic data to provide real-time,
interactive information on events such as wars,
humanitarian crises, crime, elections, or natural disasters.
When done right, crowd mapping can bring a level of
transparency to fast-moving events that are difficult for
traditional media to adequately cover in real-time, or to
longer-term trends that may be difficult to identify through
the reporting of individual events. Because anybody can
contribute to a crowd map, there is a whole array of
volunteer cartographers, data collectors that can
contribute.
Crowdmap can be run from the internet free of costs and
there is no installing required. After creating an account,
the user has access to the administration side of the
application where issues like legend items and colour, extra
texts and options; logo’s and user settings can be
determined. Access to Google Maps, Open Street Map or
other background maps can be set as well as the area of
interest. For someone with moderate internet skills, a
website can be setup in half a day. Once the website is setup, it is possible to link this with Facebook, Twitter and
even text messaging.
The administrator of the site has the option to provide a
quality check on the added data by approving (or nor) or
verifying messages from users. Users can add their email
information, photo’s videos and extra text information to
their reports to add information and/or credibility. Since
the reports are placed on a map (and therefore have X and
Y coordinated, the reports can be exported in KML format
and imported again in Manifold GIS for further presentation
and/or analysis.
Some famous websites using crowdmapping are:
Harrassmap.org: an award winning site from Ciaro in Egypt
where women can report all forms of violence against
women.
11.207
http://mindanews.com/crowdmap/ a website on
irregularities in Mindanao during the 2013 Elections
11.208
LECTURE POINTS:
Module 11
Session 11.8.4
Open Street Map Philippines
A
part from the efforts from NAMRIA to map the Philippines and the
commercial programs from Google, Yahoo and Bing Maps, there is also an
open source, community effort to map the Philippines. Open Street Map
Philippines is part of the international community effort to make quality spatial
data available for all. Mapping of the Philippines started sometime in 2006 when
EDSA in Metro Manila was marked via GPS traces. Since then, mapping effort
continued to rapidly increase throughout the years. When Yahoo! permitted OSM to
use their satellite imagery for tracing in December 2006, mapping of Metro Manila,
one of the areas covered exploded and remains to be the most mapped area in the
Philippines approaching around 90% of roads mapped.
Other areas with significant mapping activities include Davao City, which is another area
covered by Yahoo!'s imagery, areas in greater Metro Manila, Angeles and Clark, Baguio, and
Boracay. Government geospatial data has been imported and these include roads for
Laguna and the whole of Naga City in Camarines Sur. Major roads of Mindanao have been
mapped as well as other national highways around the Philippines.
Since mostly the urban areas in the Philippines are mapped quite well, data from
municipalities in the provinces is always welcome and it is a nice way to get added value
out of your data by contributing to a national map. OSM has quite strict conventions for
adding data, but also a number of tools for uploading your own data.
You can download data from Open Street Map using Geofabrik,
OSM and is constantly being updated every 4-5 hours. Geofabrik
–, extracts, selects, and processes free geodata for you. They
map tiles and full-blown web mapping solutions.
http://www.geofabrik.de/
which compiles data from
– German for "geo factory"
create shape files, maps,
Their website is at:
11.209
LECTURE POINTS:
Module 11
Session 11.8.5
Data collection using Android devices
T
he rapid growth in smart phones and android tablets has given rise to a new
generation of tools that can be used for GIS data collection. Since most smart
phones and tablets have an integrated GPS and are able to take pictures and
movies on spatial data collection becomes much easier.
Geotagging
With the increased use of Internet capable mobile devices
such as the Blackberry, iPhone and many android devices,
GeoTagging (or plainly geotagging) has seen a surge in
popularity as well. With the ability to quickly add GPS
information to media, smart phones make geotagging a
simple task. Geotagging is the process of adding location to a
photo, video or other media file or type. This can not only
help people find images and information based on a location,
but it can also be used to create location-based news and
media feeds by combining an application like Google Maps
with geotagged blogs, news articles and Flickr photos. Many
GIS software packages and databases also allow the
geotagged photos to be stored and displayed on location.
With the geographical information embedded within the
image we can show others the exact location of where a
picture was taken. Smart phones with built-in cameras and
GPS have made geotagging images a breeze. If the GPS of
your device is on and the geotagging mode is selected in your
camera, the coordinates will be automatically added to your
photo or video. If you have access to the EXIF info (the meta
information for digital photo’s) you can also manually add or
change the coordinate information.
With the decreasing price of smart phones and therefore the
increasing availability geotagging (or the later discussed ODK)
can be great tools to involve individuals and communities into
mapping their environment.
11.210
LECTURE POINTS:
Module 11
Session 11.8.6
Open Data Kit
T
he rise of smart phones and tablets running under the Android Operating
System gave rise to a whole new spectrum of mobile tools for collecting data
using these mobile devices. Apart from the ever decreasing prices and
increasing capacities and availability, these devices have also the advantage that
most avail of GPS and a photo camera. This means
that both location and a visual image of
phenomena can be recorded and used. There are
a number of tools who use these tools for a
structured data collection and therefore moving
from paper based interviews to a more digital
environment. There are a number of tools using
android cell phones and tablets and a good and
easy to use tool is ODK or Open Data Kit
(www.opendatakit.org).
Open Data Kit has three modules:
1.
ODK Build: a web based module for the
design of questionnaires. This module needs a
username/
password
and
after
a
questionnaire is built it can be either
uploaded on a server (aggregate) for future
download and use on a tablet or it can be
directly downloaded to a device. The
structure of building forms on the web is
structured and quite easy.
11.211
2. ODK Collect: is the actual tool used for collecting information. It runs on an
Android device and for doing the surveys, no internet access is needed. A
questionnaire as made in ODK Build can be downloaded on the device and a survey
can be done. On one device many different questionnaires and per questionnaire
many surveys (or instances) can be made. The questionnaires may contain location
(GPS) photo, video and speech. Once back in the office, the finished questionnaires
can be uploaded to the next module, ODK Aggregate
3. ODK Aggregate: is the module for management of the forms and for combining and
aggregating the results. Per questionnaire the data can be combined in easy
statistics and graphs, downloaded in KML for further use in GIS or directly visually
presented in Google Earth.
11.212
Our experiences with Open Data Kit are good. New users are able to conduct structured
surveys using tablets with only a minimum of training. Also the training for system
administrators for designing questionnaires and managing the web pages takes only a day
or so. After a short training, Lapu-lapu City is now using android tablets for: monitoring
cases of dengue, monitoring potholes and access times and obstacles to fires
(http://news.lapulapucity.gov.ph/fire-reporting-using-android-tablets/) . Ten teams with
a tablet are expected to map all business establishments in the city (over 10.000) in under
two months’ time, putting all locations on a map as part of a GIS supported Business Permit
Licensing System.
Quantum GIS
for Android
Another relatively development is that Quantum GIS, an open
source, mature GIS package, is now also available as GIS
package for Android devices. We have been testing the
android version of Quantum GIS and even though there are
some issues with the screen size and stability of the different
versions, the development looks very promising. You may
have a complete GIS on your tablet. Unlike the other tools
which mainly focus on the collection of data, having a
complete GIS means that you can also check in the field if
your GIS data are up to date. This could be a great tool for
checking real property data.
For practical reasons, it may be good to work on a 10 inch
tablet or use one of the android tablets for use so that the
screen size is not a limiting factor. The screen size now is no
limitation for the display of the maps, but the user interface
and the tables are hard to view on a smaller tablet. A device
with a stylus has added benefits for editing map layers.
The installer for Quantum GIS for android can be downloaded
here: http://hub.qgis.org/projects/android-qgis .
Before you install, it may be wise to check the
website to see if your device is supported.
11.213
LECTURE POINTS:
Module 11
Session 11.8.7
Provincial Map Viewer
T
he GIZ programs on Decentralization and Environment and Rural Development
(resp. GIZ-DP and GIZ-ENRD) have seen the need with many planners to have
an easy to use tool for spatial information related to planning. In many
municipalities the GIS capacity is low and this means that those who need insight
in spatial data cannot always obtain this. It was also observed that collecting the
data needed for a Comprehensive Land Use Plan is a both time and money
consuming effort where many datasets are obtained from national Government
Agencies, but each municipality had to collect these for itself. For this reason a
simple map viewer was developed. The Provincial Map Viewer has the following
goals:
•
It should be easy to use and support local and regional planners with
information relevant to the planning process.
•
Users should be able to perform basic GIS actions like combining layers,
zooming in and out and make basic selections, printing a map etc.. For
more complex questions, a GIS should be used
•
The viewer can contain data on: provincial level with respect to
planning data, regional natural hazard data, and local data on municipal
infrastructure and local real property tax information. All map layers
can be added with meta information describing the quality and source
of the information
•
It should run on all windows based PC’s and there is no need for
Internet Access.
11.214
All map layers have standardized legends which are as much as possible
obtained through the respective owners of the data.
The Map Viewer is now in use in Regions 8 and 6 and will be distributed for free to
interested parties. The Viewer comes with a training manual and instructions on how to
add data from new provinces and municipalities to the viewer. For most users a training of
half a day is enough to be effective in using the viewer.
Summary
In this Session you have learned some elements of a balanced
layout and how to create a layout in Manifold System. A major
element of a good map is a good representation of the map
elements that are included in the layout. This was the last
technical Session on Manifold System GIS. The next Session, Session
7 will focus on a number of new technologies that can change the
way how we collect our data.
11.215