1
ADAS304: Effective beam emission
spectroscopy stopping data - graph and fit
coefficient
The program interrogates beam stopping or beam emission coefficient files of type
ADF21 or ADF22. Data is extracted for stopping by a composite plasma consisting
of a mixture of protons (deuterons) and fully ionised impurities. The data is
interpolated using cubic splines at selected beam energy, target density and target
temperature triplets. Minimax polynomial fits are made to the interpolated data. The
total stopping and partial stopping by each species are given. The beam emission
coefficients are handled in a similar manner. The interpolated data are displayed and
a tabulation prepared. The tabular and graphical output may be printed and includes
the polynomial approximations.
Background theory:
$
For a neutral beam species
being stopped by fully stripped impurity species and
electrons in the plasma, the stopping coefficient is the effective loss rate coefficient
. This corresponds closely to the effective ionisation rate
of electrons from
coefficient or collisional-radiative ionisation coefficient from the ground state of
, where charge transfer losses as well as direct ionisation losses are included. It is
usual to write the coefficient in terms of the plasma electron density N e so that the
$
$
( A)
loss rate is N e SCR .
In creation of compact interpolable datasets of type ADF21 and ADF22, some
simplifications are made. The stopping coefficient data sets for each impurity species
are calculated as though that species alone is present in the plasma. For species
X + z0 , of nuclear charge z0 , of number density N ( z0 ) , the electron density used in
the stopping calculation is N e = z0 N
( z0 )
consistent with charge neutrality. Let the
+z
( $ ,X )
then the loss rate is
stopping coefficient for the impurity species X 0 be SCR
( $ ,X )
( $ ,e )
N e SCR
( EB , N ( z0 ) , T ( z0 ) ) = N e SCR
( EB , N ( z0 ) , T ( z0 ) )
4.4.1
( z0 ) ( $ , z0 )
( z0 )
( z0 )
+N
SCR
( EB , N
,T
)
distinguishing parts driven by excitation from the ground state of A by electron
+z
collisions and by X 0 ions respectively. The coefficient is
($ ,X )
( $ ,e )
SCR
( EB , N ( z0 ) ,T ( z0 ) ) = SCR
( EB , N ( z 0 ) , T ( z 0 ) )
($ , 0)
( EB , N ( 0 ) , T ( 0 ) )
+ (1/ z0 ) SCR
z
z
z
4.4.2
The density dependence of the collisional-radiative coefficient is written in terms of
(z )
the impurity ion density N 0 since ion collisions primarily determine the
collisional redistribution..
+z
Consider a set of species { X i 0i : i = 1,.., I } with fractions { f i : i = 1,.., I } , in the
plasma causing a composite stopping. The loss rate may be written approximately
as
($ )
( $ ,e )
N e SCR ( EB , N I ,TI ) ≈ N e SCR ( EB , N I , TI ) +
I
∑N
( z0 i ) ( $ , z0 i )
i
CR
S
( EB , N I , TI )
i =1
4.4.3
I
= ∑ N e,i [S
i =1
( A ,e )
CR
( EB , N I ,TI ) +
( A ,z0 i )
(1/ z0i ) SCR
( EB , N I , TI )]
where
ADAS User manual
Chap4-04
17 March 2003
I
I
I
i =1
i =1
i =1
N e = ∑ N e,i = ∑ z0i N ( z0i ) = N I ( ∑ z0i f i )
4.4.4
defines the proportions of the electron density contributed by each impurity species.
From an ion collisional redistribution point of view, in a composite plasma the
I
∑z
N k( Z0k ) z-weighted density sum is meaningful so the equivalent density of the
2
0k
k =1
+ z0i
single impurity X i
purpose is
to correspond to the summed impurity ion density for this
I
N i( z0i ),equiv = N I ( ∑ z02k f k ) / z02i
4.4.5
k =1
and the equivalent electron density is
N ei( z0 i ),equiv = (
Ne
I
∑ z 0 k fk
I
)( ∑ z02k fk ) / z0i
4.4.6
k =1
k =1
ADAS310 evaluates the stopping & emission coefficients as a function of electron
density. The approximate composite stopping coefficient is assembled from the pure
species coefficients as
I
I
i =1
k =1
( $ ,Xi )
($ )
( EB , N e , TI ) ≈ ∑ [ z0 i fi SCR
( EB , N ei( z0 i ),equiv , TI )]/(∑ z0 k f k )
SCR
4.4.7
The prescription outlined is equally applicable for the storage and handling of beam
emission coefficients.
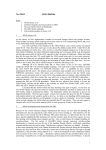
Program steps:
These are summarised in the figure below.
EHJLQ
HQWHU EHDP
RU
! VWRSSLQJ
EHDP HPLVVLRQ
ILOH OLEUDU\
UHSHDW
!
VHOHFW LRQV
FRQWULEXWLQJ
WR VWRSSLQJ
!
HVWDEOLVK
UDQJHV RI
GDWD
Figure 4.4
!
LQSXW LRQ IUDFWV
EHDP HQHUJ\
WDUJHW GHQVLW\ WHPS WULSOHWV
!
!
UHSHDW
2XWSXW WDEOHV
DQG JUDSKV
HQG
GLVSOD\ EHDP
VWRSSLQJ RU
EHDP HPLVVLRQ
JUDSKV
IRUP VSOLQH
DQG PLQLPD[
ILWV
LQWHUSRODWH
LQ RQH DQG WZR
GLPHQVLRQV
Interactive parameter comments:
Move to the directory in which you wish any ADAS created files to appear. These
include the output text file produced after executing any ADAS program (paper.txt
is the default) and the graphic file if saved (e.g. graph.ps if a postscript file). Initiate
ADAS and move to the series 3 menu. Select ADAS304.
The file selection window is shown below. Its operation is a little different from
usual.
ADAS User manual
Chap4-04
17 March 2003
1.
ADF21 is the appropriate format for use by the program ADAS304
(ADAS User Manual, appxb-21). A root path to the correct data type
ADF21 appears automatically. Your personal data of this type should
be held in a similar file structure to central ADAS, but with your
identifier replacing the first adas.
1
2
3
4
5
8
9
2.
Buttons are present to set the data root to that of the Central data or to
your personal User data (provided it is in ADAS organisation.
Alternatively the ‘data root’ may be edit explicitly.
3.
A group name for the input files is entered. This is the name of a subdirectory of ADF21 for a particular beam species (usually H or He).
6
7
ADAS User manual
Chap4-04
17 March 2003
4.
5.
6.
7.
8.
9.
The sub-directory contains individual data sets for each impurity
contributing to stopping , identified by the element symbol.
To increase flexibility in naming a three letter class prefix may be
added to the data set name. The primary data in central ADAS has no
prefix and so a typical data set name would be
/../adas/adas/adf21/bms#h/bms#h_be.dat.
ADAS304 allows you to select all the impurity files you wish easily.
Click the Reselect Ion List button.
The small pop up selection widget appears showing available species.
Click the toggle buttons of those you wish to include
Click Done to restore the main input widget. Your choices are shown at
the Stopping Ion List.
Clicking on the Browse Comments button displays any information
stored with the selected data-files. It is important to use this facility to
find out what has gone into the data-set and the attribution of the dataset.
Clicking the Done button moves you forward to the next window.
Clicking the Cancel button takes you back to the previous window.
The processing options window has the appearance shown below
1.
The Stopping ion list is repeated for information.
Comments button is also provided.
The Browse
1
2
6
5
3
4
7
2.
3.
ADAS User manual
The extracted data for a selected ion is interpolated by a cubic spline at
user selected plasma parameters for graphical display and tabular
output. Additionally a polynomial approximation may obtained by
making the appropriate selections.
The selection of beam energy, density and temperature sets for data
output must be made. The source values are held as one-dimensional
scans relative to reference values for each impurity separately. The
minimum and maximum for each impurity is shown in the Input
columns. The table may be edited by clicking on the Edit Table button.
Chap4-04
17 March 2003
4.
5.
6.
7.
Default Output Values and Clear Table buttons are provided.
A choice of which parameter of the input model set to use as the x coordinate of graphs is given. Click on the required button.
The mixture of species contributing to the stopping is assembled at d).
This again is an editable table. Click Edit Table to pop up the ADAS
Table Editor.
The required fractions may then be entered.
Normalisation to unity takes place.
The Exit to Menu icon is present in ADAS304. Clicking the Done
button causes the output options window to be displayed. Remember
that Cancel takes you back to the previous window.
The Output options window is shown below.
1.
2.
Graphical display is activated by the Graphical Output button. This
will cause a graph to be displayed following completion of this window.
When graphical display is active, an arbitrary title may be entered
which appears on the top line of the displayed graph.
By default, graph scaling is adjusted to match the required outputs.
Press the Explicit Scaling button to allow explicit minima and maxima
for the graph axes to be inserted. Activating this button makes the
minimum and maximum boxes editable.
1
2
3
4
3.
ADAS User manual
Hard copy is activated by the Enable Hard Copy button. The File name
box then becomes editable. A choice of output graph plotting devices is
given in the Device list window. Clicking on the required device
Chap4-04
17 March 2003
selects it. It appears in the selection window above the Device list
window.
4. The Text Output button activates writing to a text output file. The file
name may be entered in the editable File name box when Text Output is
on. The default file name ‘paper.txt’ may be set by pressing the button
Default file name.
The Graphical output window is shown below
1. Printing of the currently displayed graph is activated by the Print button.
1
Illustration:
The output from the programme for hydrogen beam stopping in a composite plasma of H+, He+2 and
B+5 is illustrated in figure 4.4a. The total stopping rate coefficient is given as well as the individual
species contributions to the stopping. The solid lines are spline fits and the dotted lines give the
minimax polynomial fits. The tabulated output is shown in table 4.4a.
Figure 4.4a
ADAS User manual
Chap4-04
17 March 2003
Table 4.4a
ADAS RELEASE: ADAS93 V1.13 PROGRAM: ADAS304 V1.6 DATE: 15/04/98 TIME: 14:32
****** TABULAR OUTPUT FROM BEAM STOPPING COEFFICIENT INTERROGATION PROGRAM: ADAS304 - DATE: 15/04/98 *****
------------------------------------BEAM STOPPING COEFFICIENTS AS A FUNCTION OF BEAM ENERGY AND TARGET DENSITY AND TEMPERATURE
-----------------------------------------------------------------------------------------DATA GENERATED USING PROGRAM: ADAS304
------------------------------------INPUT DATA SET: bms97#h
MEMBERS: B5 H1 HE2
-------------------------------------------------- STOPPING ION FRACTIONS --------------------------------------------------ION CHARGE FRACTION
---------------------B
5
0.050
H
1
0.900
HE
2
0.050
------------------------------------------------------- TOTAL BEAM STOPPING COEFFICIENTS -------------------------------------------------------BEAM
TARGET
TARGET BEAM STOPPING
ENERGY
DENSITY
TEMP.
COEFFICIENT
(EV)
(CM-3)
(EV)
(CM3 S-1)
---------------------------------------5.00D+03 6.00D+13 2.00D+03
1.22D-07
1.00D+04 6.00D+13 2.00D+03
1.35D-07
1.50D+04 6.00D+13 2.00D+03
1.39D-07
2.00D+04 6.00D+13 2.00D+03
1.41D-07
2.50D+04 6.00D+13 2.00D+03
1.41D-07
----------------------------------------------------------------------------------------NOTE: * => BEAM STOPPING COEFFICIENT EXTRAPOLATED FOR ENERGY/DENSITY/TEMPERATURE TRIPLET.
---------------------------------------------------------------------------------------------------------------------------------------------------- INDIVIDUAL ION BEAM STOPPING COEFFICIENTS -----------------------------------------------------------BEAM
TARGET
TARGET ---- BEAM STOPPING COEFFICIENT (CM3 S-1) --------------------ENERGY
DENSITY
TEMP.
B5
H1
HE2
(EV)
(CM-3)
(EV)
(0.05)
(0.90)
(0.05)
-----------------------------------------------------------------------------------------5.00D+03 6.00D+13 2.00D+03 1.98D-08 9.59D-08 6.76D-09
1.00D+04 6.00D+13 2.00D+03 2.60D-08 9.92D-08 9.39D-09
1.50D+04 6.00D+13 2.00D+03 2.90D-08 9.97D-08 1.08D-08
2.00D+04 6.00D+13 2.00D+03 3.07D-08 9.92D-08 1.15D-08
2.50D+04 6.00D+13 2.00D+03 3.11D-08 9.79D-08 1.19D-08
-----------------------------------------------------------------------------------------NOTE: 1) * => BEAM STOPPING COEFFICIENT EXTRAPOLATED FOR ENERGY/DENSITY/TEMPERATURE TRIPLET.
2) ION FRACTIONS GIVEN IN BRACKETS BELOW ION SYMBOLS.
------------------------------------------------------------------------------------------
ADAS User manual
Chap4-04
17 March 2003
The output from the programme for hydrogen beam emission coefficients for a
composite plasma of H+, He+2 and B+5 is illustrated in figure 4.4b and the tabulated
output in table 4.4b.
Figure 4.4b
Table 4.4b
ADAS RELEASE: ADAS93 V1.13 PROGRAM: ADAS304 V1.6 DATE: 15/04/98 TIME: 14:34
***** TABULAR OUTPUT FROM BEAM EMISSION COEFFICIENT INTERROGATION PROGRAM: ADAS304 - DATE: 15/04/98 *****
------------------------------------BEAM EMISSION COEFFICIENTS AS A FUNCTION OF BEAM ENERGY AND TARGET DENSITY AND TEMPERATURE
-----------------------------------------------------------------------------------------DATA GENERATED USING PROGRAM: ADAS304
------------------------------------INPUT DATA SET: bme97#h
MEMBERS: B5 H1 HE2
-------------------------------------------------- STOPPING ION FRACTIONS --------------------------------------------------ION CHARGE FRACTION
---------------------B
5
0.050
H
1
0.900
HE
2
0.050
------------------------------------------------------- TOTAL BEAM EMISSION COEFFICIENTS -------------------------------------------------------BEAM
TARGET
TARGET BEAM EMISSION
ENERGY
DENSITY
TEMP.
COEFFICIENT
(EV)
(CM-3)
(EV)
(CM3 S-1)
---------------------------------------5.00D+03 6.00D+13 2.00D+03
3.13D-10
1.00D+04 6.00D+13 2.00D+03
3.10D-10
1.50D+04 6.00D+13 2.00D+03
3.41D-10
2.00D+04 6.00D+13 2.00D+03
3.81D-10
2.50D+04 6.00D+13 2.00D+03
4.32D-10
----------------------------------------------------------------------------------------NOTE: * => BEAM EMISSION COEFFICIENT EXTRAPOLATED FOR ENERGY/DENSITY/TEMPERATURE TRIPLET.
-----------------------------------------------------------------------------------------
ADAS User manual
Chap4-04
17 March 2003
------------------------------------------------------------ INDIVIDUAL ION BEAM EMISSION COEFFICIENTS -----------------------------------------------------------BEAM
TARGET
TARGET --------BEAM EMISSION COEFFICIENT (CM3 S-1) -----------------ENERGY
DENSITY
TEMP.
B5
H1
HE2
(EV)
(CM-3)
(EV)
(0.05)
(0.90)
(0.05)
----------------------------------------------------------------------------------------5.00D+03 6.00D+13 2.00D+03 1.03D-10 1.74D-10 3.56D-11
1.00D+04 6.00D+13 2.00D+03 9.86D-11 1.73D-10 3.80D-11
1.50D+04 6.00D+13 2.00D+03 1.09D-10 1.90D-10 4.19D-11
2.00D+04 6.00D+13 2.00D+03 1.18D-10 2.16D-10 4.66D-11
2.50D+04 6.00D+13 2.00D+03 1.30D-10 2.50D-10 5.24D-11
----------------------------------------------------------------------------------------NOTE: 1) * => BEAM EMISSION COEFFICIENT EXTRAPOLATED FOR ENERGY/DENSITY/TEMPERATURE TRIPLET.
2) ION FRACTIONS GIVEN IN BRACKETS BELOW ION SYMBOLS.
-----------------------------------------------------------------------------------------
Notes:
ADAS User manual
Chap4-04
17 March 2003