1
selects it. It appears in the selection window above the Device list
window.
4. The Text Output button activates writing to a text output file. The file
name may be entered in the editable File name box when Text Output is
on. The default file name ‘paper.txt’ may be set by pressing the button
Default file name.
The Graphical output window is shown below
1. Printing of the currently displayed graph is activated by the Print button.
1
Illustration:
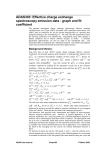
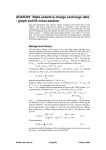
The output from the programme for hydrogen beam stopping in a composite plasma of H+, He+2 and
B+5 is illustrated in figure 4.4a. The total stopping rate coefficient is given as well as the individual
species contributions to the stopping. The solid lines are spline fits and the dotted lines give the
minimax polynomial fits. The tabulated output is shown in table 4.4a.
Figure 4.4a
ADAS User manual
Chap4-04
17 March 2003