1
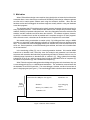
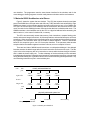
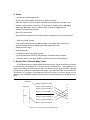
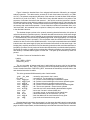
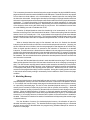
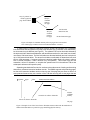
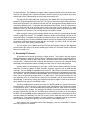
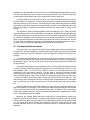
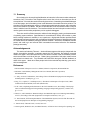
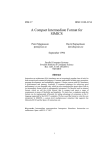
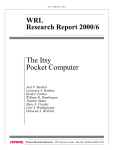
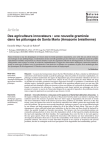
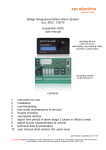
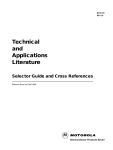
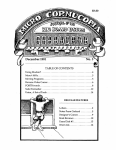
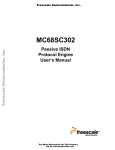
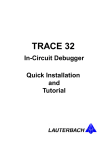
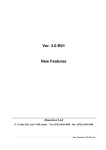
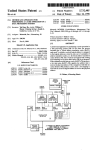
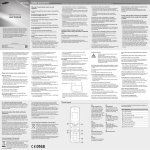
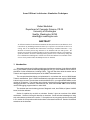
Some Efficient Architecture Simulation Techniques
Robert Bedichek
Department of Computer Science, FR-35
University of Washington
Seattle, Washington 98195
[email protected]
ABSTRACT
An efficient simulator for the Motorola 88000 at the ISA (Instruction Set Architecture) level
is described. By translating instructions on the fly to a quick-to-execute form we achieve an
average ratio of 20 simulator host instructions executed per simulated instruction. Lazy
allocation of memory allows large memories to be modelled with low start-up time. We
describe our experience using the simulator to develop workstation software. The simulator’s
speed and extensive I/O device modelling made it possible for us to interactively debug and
test a UNIX®kernel and diagnostic software well before the hardware was available. Extensions to closely model caches and multiprocessors are sketched.
1. Introduction
We present techniques for building a high speed architecture simulator for the Motorola 88000
CPU [1] and CMMU (Cache and Memory Management Unit) [2]. These methods can be used for
simulation of other architectures, including CISCs. This work was done while the author was at
Tektronix and supported the development of the XD88®workstation series.
The concepts described below are implemented in a simulator that runs on 68020-based
Tektronix workstations. On a 2.5 MIPS workstation the simulator executes roughly 130,000 88000
instructions per second. The simulator models the 88100 CPU, up to eight 88200 CMMUs, and a
number of I/O devices. The simulator has a human interface that gives programmers symbolic
debugging facilities. This interface, called the front-end, is derived from dbx. Dbx is a tool normally
used for debugging programs that run under UNIX.
The simulator was used to debug pieces of diagnostic code, boot ROMs, a System V®UNIX
kernel, and other software.
Section 2 explains why we built our simulator. Section 3 gives an overview of the 88000
architecture. Sections 4 through 6 describe our simulator. Some technical advantages of using
such a simulator are pointed out in section 7. We explain our not-very-pretty solution to writing this
in C in section 8. Our experience with the simulator is discussed in section 9. Section 10 sketches
extensions to the simulator.
2. Motivation
When CPU architects design a new machine, they typically write an instruction-level simulator
to test their ideas. Later, when they are confident of the stability of their design, software engineers
are often told to make system software work using the architects’ simulator. When the real
hardware arrives and is debugged, the software engineers usually switch to using real hardware
to test their programs.
The simulators that CPU architects write typically execute thousands of host instructions for
every simulated instruction. These simulators are written to test concepts and processor design
tradeoffs; flexibility is important and speed is not. Also, they often gather instruction execution time
statistics, and this constrains and slows down the simulator. The software engineers, however,
would like a simulator that is as fast as possible and is complete enough to run their programs.
With a little more work, a simulator can be had that is more complex but is much faster.
We wanted to bring a workstation to market quickly. By building and then using our 88000
simulator, we were able to start debugging software six months earlier than we otherwise would
have. The simulator has useful debugging features not available in the actual machine and so is
still in use. Some operations, such as downloading text and data, are faster on the simulator than
on the real machine.
In the terminology of May [3], ours is a second generation simulator. We translate 88000
instructions to threaded code, while May does flow analysis and generates host instruction
sequences with semantics that match the program being simulated. A scheme, similar to ours, for
translating target instructions to threaded code is outlined in [4]. Other systems that translate
instructions on the fly to a quick-to-execute form include the VAX-8800®series of computers [5],
the CRISP microprocessor [6], and a Smalltalk 80 interpreter [7].
When Tektronix engineers debug kernels and diagnostic programs on the hardware, they use
a cross-debugger that runs on a 68020-based workstation. The workstation communicates with
the hardware via an RS-232 serial link. The cross-debugger, simulator, and dbx front-end are all
part of a single program (see Figure 1). The cross-debugger and the simulator share the dbx-based
Human Interface (dbx plus X11 support)
Single
UNIX
process
44,000 lines of C
Simulator
Cross debugging
support
Memory, I/O, CMMU, CPU
3,500 lines of C
17,000 lines of C
Simulator Host
UNIX kernel
Figure 1: Structure of the simulator
user interface. The programmer sees the same human interface for the simulator and for the
cross-debugger, allowing engineers to switch easily between simulator and the real hardware.
3. Motorola 88000 Architecture at a Glance
Figure 2 shows the system that we simulate. The CPU has separate instruction and data
ports. Each CMMU has a 16k byte cache and a 56-entry TLB (Translation Look-aside Buffer). Eight
CMMUs are shown, but the simulator and the real system can have one, two, or four CMMUs per
CPU port. We call the cache in the CMMU(s) that are connected to the instruction bus the code
cache; the cache in the CMMU(s) that are connected to the data bus is called the data cache. The
CMMUs translate a virtual address sent by the CPU to a physical address before accessing the
data in cache or, in the case of a cache miss, in memory.
The CPU can concurrently access data memory, fetch instructions, compute floating point
results, and execute integer instructions. All of these operations, and external interrupts, can cause
exceptions. When an exception occurs the floating point unit is stopped and the contents of several
key registers in the instruction fetch unit are frozen in shadow registers. Control is transferred
based on the exception type to one of 512 exception handlers. If the processor takes another
exception before the shadow registers have been unfrozen, an error exception will occur.
There are two kinds of 88000 branch instructions: non-delayed and delayed. Non-delayed
branches execute the branch target after the branch instruction and have an idle cycle. This idle
cycle is due to the temporary lack of an instruction to execute while the branch target is fetched,
and is called the branch delay slot. To take advantage of the branch delay slot the architects
included delayed branches. Delayed branch instructions cause another instruction to be executed
during the branch delay slot. It gets this instruction from the word following the delayed branch. Any
non-branching instruction may be in a branch delay slot.
CPU
data
port
register file
virtually addressed data bus
data
CMMU
data
CMMU
data
CMMU
data
CMMU
code
CMMU
code
CMMU
code
CMMU
code
CMMU
FP unit
integer unit
code
port
virtually addressed code fetching bus
physically addressed system bus
interrupt
interrupt request controller
I/O devices
Figure 2: 88000 System Modelled.
main memory
4. Goals
We wanted a simulator that would:
• Execute the common 88000 instructions as quickly as feasible.
• Make the execution as close to that of the hardware as programmers needed it to be.
• Provide a clean interface to front-ends. This allowed us to switch from an adb-based
front-end to dbx easily. We plan to switch again, this time to a gdb front-end.
• Efficiently simulate large memories.
• Have a low start-up time.
• Allow I/O device simulators to be written with little knowledge of the rest of the simulator.
We did not intend to model:
• FP accuracy with respect to the 88000 hardware. We use the host’s floating point
arithmetic instead of exactly modelling the 88000 floating point unit.
• 88000 instruction timing.
• Little endian mode.
• The instruction and floating point pipelines.
• The exact data cache and PATC (Page Address Translation Cache) contents.
• Transistors, gates, or any other aspect of the physical structure of the hardware.
5. Decode Once, Execute Many Times
The simulator does not interpret 88000 instructions directly. Before an instruction executes
for the first time, it is translated into a form that can be executed quickly. This translation of an
instruction is called a decoded instruction and is not visible to the user of the simulator. Decoded
instructions are cached in decoded instruction pages. Only instructions that are encountered in
the execution of a program are decoded and cached, so there is no start-up penalty for this
technique. We call 88000 instructions raw instructions to distinguish them from decoded instructions.
decoded ip
Pointer to handler for addu
literal pool
Pointer to word modelling r4
Pointer to word modelling r5
Pointer to word modelling r6
Pointer to handler for subu
1000
Pointer to word modelling r2
Pointer to word modelling r4
Pointer to literal word 1000
Figure 3: Two consecutive decoded instructions.
r0
r1
r2
r3
r4
r5
r6
...
r31
Figure 3 shows the decoded form of an unsigned add instruction followed by an unsigned
subtract instruction. The add sums the contents of r5 and r6 and stores the result in r4 ("addu
r4,r5,r6"). The subtract computes the difference of the contents of r4 and the literal 1000 and puts
the result in r2 ("subu r2,r4,1000"). The first field of every decoded instruction is a pointer to the
sequence of simulator instructions that execute it. We call this code the instruction’s handler.
Decoded instructions along with their handlers are a form of threaded code [8]. Most handlers are
9 to 35 host instructions long. Decoded instructions that have register operands have pointers to
the memory that model these operands. If a raw instruction contains an immediate value, as in
"add r9,r9,1000", this immediate value is copied to a literal pool, and a pointer to the literal is put
in the decoded instruction.
The simulator keeps a pointer to the currently executing decoded instruction; this pointer is
called the decoded ip (instruction pointer). Because decoded instructions are all the same length
(16 bytes), the decoded ip can be updated on non-branching instructions by simply incrementing
it. The architectural ip, the one seen by the 88000 programmer, is not kept explicitly. It is computed
from the decoded ip when it is needed. This computation takes four 68020 instructions, and only
needs to be done for a few of the 88000 instructions. It is a simple computation because all 88000
instructions are the same length (4 bytes) and all decoded instructions are the same length. Not
keeping the ip explicitly saves time on all non-branching instructions that would otherwise have to
keep the ip up to date. An early version of the simulator kept both the ip and the decoded ip explicitly.
Removing the explicit ip made all the non-branching instruction handlers one instruction shorter
and freed up a valuable 68020 register for other use. This sped up the simulator by about five
percent.
This is the C source of the handler for addu:
L(addu);
DST = SRC1 + SRC2;
DISPATCH_NEXT;
The are a number of macros used here: L(addu) defines the entry point for the handlers
(described in section 8). DST, SRC1, and SRC2 refer to the operands pointed to by fields in the
current decoded instruction. DISPATCH_NEXT increments the decoded ip and branches to the
next decoded instruction’s handler.
This is the generated 68020 assembly code of addu handler:
.globl _sim_addu
_sim_addu:
movl a2@(4),a1
movl a2@(12),a0
movl a0@,d0
movl a2@(8),a0
add
a0@,d0
movl d0,a1@
movl
bne
addl
movl
jmp
a3,d3
L67
d5,a2
a2@,a0
a0@
; created by asm inserts in the L macro,
; see section 8. The decoded ip is in register a2
; a1 :=pointer to word modelling the destination register
; a0 :=pointer to word modelling the 2nd source operand register
; d0 :=the second source operand register contents
; a0 :=pointer to word modelling the 1st source operand register
; d0 := first source operand + second source operand
; store the sum in the word modelling the destination register
; test to see if we are in a branch delay slot.
; we usually are not, so we usually do not branch here.
; advance decoded ip to next instruction (d5 =16)
; fetch the address of the next instruction’s entry point
; jump to the next instruction’s entry point.
Decoded branch instructions whose target is on the same decoded instruction page contain
the decoded ip of the target. This makes branches within a page fast. If the target is on a different
page, the offset is kept instead, and the decoded ip is calculated each time the branch is executed.
This is necessary because the decoded instruction pages correspond to physical 88000 memory
pages and branch instructions work with 88000 virtual addresses. A branch instruction may appear
at more than one virtual address, or the virtual address of a branch instruction can change after
the instruction is decoded. Computing the decoded ip of the target of off-page branches each time
the branch is executed preserves the semantics of branches and of the virtual to physical translation
mechanism. To reduce the penalty of off-page branches we cache translations of virtual code
addresses to decoded instruction pointers. Implementing this cache increased the overall speed
of the simulator, when running the UNIX kernel, by ten percent. We invalidate this cache when
the code CMMU(s) are told to invalidate their TLBs.
Execution of delayed branches cause the decoded ip to be incremented, as it is for nonbranches, and a flag is set if the branch should be taken. Each non-branching instruction handler
checks to see if it is in a delay slot. If it is, control passes to the target of the most recent delayed
branch instead of to the following instruction. This extra check adds two 68020 instructions to each
handler. If the simulator didn’t have to implement delayed branches, it would run about 5 percent
faster.
When a decoded instruction page is first allocated, and when it is flushed, the decoded
instruction slots are filled with an instruction we call the decode pseudo instruction. (Actually, just
the first 1024 slots are so initialized, see the next paragraph for what happens to the 1025th slot.)
When a decode pseudo instruction is executed a raw instruction is translated to a decoded
instruction. The raw instruction is fetched from the address in the raw page that corresponds to the
position of the decode pseudo instruction in the decoded instruction page. For example, if a decode
pseudo instruction in the 10th slot is executed, the 10th word in the corresponding raw page will
be translated. The new decoded instruction replaces the decoded pseudo instruction and then this
new instruction is executed.
There are 1025 decoded instruction slots in each decoded instruction page. The first 1024 of
these hold the decoded form of the 1024 raw instructions that can be in a raw page (a raw page is
4kb). The 1025’th has a requalify pseudo instruction that causes the decoded ip to be requalified.
When a non branching decoded instruction in the 1024th slot is finished executing the decoded ip
is incremented and points to the requalify pseudo instruction. Because the flow of control has
moved off of the page the decoded ip must be requalified. Having the requalify pseudo instruction
in the last slot saves time by making it unnecessary for the handlers to check for the end of page
condition.
5. Modelling Memory
A large physical memory is simulated with low start-up time by not allocating host memory for
simulated physical memory until some simulated instruction or some front-end operation touches
it. For example, the front-end causes a raw page to be allocated when the user examines memory
on a previously untouched page. The size of active simulated physical memory (i.e., simulated
memory that is touched) is limited only by the host’s limit on process virtual memory. When the
simulator is started, an array of pointers is allocated with one element for each 4k page of physical
memory. When an 88000 instruction, I/O device, or front-end operation accesses memory, this
table is indexed by the page frame number of the physical address (see Figure 4). If the addressed
element is nil, a raw page structure is allocated and a pointer to the new structure is installed in
the table. This structure contains a few words of overhead and a 4k byte array that models a page
of physical memory.
Like the allocation of memory for simulated physical memory, the allocation of space for
decoded instruction pages is lazy. The decoded instruction page corresponding to a simulated
physical memory page is allocated when the program being simulated attempts to execute an
instruction on that page.
array of pointers indexed by physical
page frame number
4k bytes
of 88000
memory
raw page
4k bytes
of 88000
memory
raw page
1025 decoded
instruction slots
decoded instruction page
Figure 4: Example of simulation memory after two pages have been touched.
One of these pages contains at least one instruction that has executed.
To make memory reference instructions execute quickly, the simulator has a translation
look-aside buffer that corresponds in concept to the hardware TLB (Translation Look aside Buffer),
but its structure is quite different (see Figure 5). The software TLB is a two level table indexed by
the top twenty bits of data virtual addresses, and has different sections for user loads, kernel loads,
user stores, and kernel stores. The first level tables are allocated statically and can each point to
up to 1024 second level tables. The second level tables are allocated on demand and can each
point to 1024 raw pages. If a memory reference instruction handler finds a nil pointer in either a
first or second level table, it calls a function to try the operation. This function may fault the
transaction, call an I/O simulator, or complete the operation and fill in the software TLB so that
subsequent references will operate quickly.
Separating translation buffers into four sections reduces the amount of testing and branching
that memory reference instruction handlers must do. The CMMU supports write protecting pages,
but the store instruction handlers need not check to see if the page they are about to write to is
write-protected because they use a section of the TLB that can only point to raw pages that are
segment#
page#
offset
88000 virtual data address
Second level software TLB table
4k bytes
of 88000
memory
First level software TLB table
raw page
Figure 5: Example of one of the four software TLB data structures that cache the translation of
88000 virtual data address to pointers to pages modelling physical memory.
not write-protected. The CMMUs also support making a page accessible only in supervisor state.
However, the load and store instruction handlers need not check for this, because they use a
different part of the TLB depending on which mode the processor is in.
The segment and page tables are examined by the CMMU when the physical address is
needed for a logical page that is not in the TLB. This is true on both the simulator and the hardware.
Because the simulator’s TLB is different from the real TLB, the segment and page tables may be
examined at different times. If a program that manipulates these tables, such as a UNIX kernel,
does not flush the TLB at all the right points, errors may result from the presence of a stale
translation in the TLB. Because the simulator’s TLB is much larger, these errors will be more likely
to be noticed on the simulator. This is an advantage of using the simulator.
When a program running on the simulator flushes a code cache, the corresponding decoded
instruction pages are cleared. The simulator, therefore, handles self-modifying code just as the
real machine does. The difference is that the real machine has from 16K to 64K bytes of instruction
cache, depending on the number of CMMUs installed, whereas the simulator has no fixed limit on
the number of decoded instruction pages that can accumulate. As with the TLBs, this will make
some errors occur more readily on the simulator.
The only aspect of the CMMUs cache and TLB that we modeled closely are the diagnostic
ports that allow the cache to be tested. Modelling the caches and TLB more closely would have
been of no benefit to us.
6. Simulating I/O Devices
All simulated I/O accesses go through a single function. This function uses the physical
address passed to it to determine which I/O device is addressed, and the device’s simulator function
is called. Hashing is used to speed this lookup. Information about each access is saved in a
circular buffer. A special front-end command uses this buffer to give the user a powerful facility
that displays I/O transactions that have already occurred, much as a logic analyzer does.
We have written I/O simulators for a timer chip, a serial communications controller, interrupt
controllers, Futurebus registers, a DMA controller, diagnostic registers, and an idealized disk
controller. The boot ROMs are modelled as an I/O device. Most of the I/O simulators model real
chips closely enough that diagnostic and operating system software cannot tell that they are running
on a simulator. We did not model the disk hardware, but we did write a simple disk simulator that
works with a correspondingly simple driver in our UNIX kernel. This simulated disk driver is the
only significant piece of our kernel that is special for the simulator, and the kernel switches to it
automatically. It does this by looking at the 88100 mask revision register, which for the simulator
has a value that we expect no real 88100 to have.
The most complex device simulator we wrote is for the Zilog 8530 SCC (Serial Communications Controller). It is 1351 lines of C, and simulates most of the features of the 8530 when running
in asynchronous mode. If we had simulated the synchronous features, which we did not need, it
would have been twice as large. Our strategy is to simulate only what we need. When the 88000
program initializes this chip, the SCC simulator opens a host tty line for each of the two ports on
the 8530. When the 88000 program changes the bit rate or hardware flow control flags, the SCC
simulator makes the necessary host ioctl (I/O Control) calls to make the real tty line match the
simulated port. This makes it possible to connect terminals to a machine running the simulator
and use these terminals as though they were connected to a real 88000 system.
Some features are unavailable when cross-debugging, such as commands to examine
write-only registers in I/O devices.
7. Tricks That The Hardware Cannot Do
There are some conditions that 88000 code running in supervisor mode should not allow, but
can arise through a coding error. If this happens in a kernel that is running on a real machine, the
system will stop completely with no indication of error. A logic analyzer is often required to find the
problem. The simulator is much more forgiving; it prints an explanation and stops on the instruction
that triggered the detection of an illegal condition.
A real 88000 cannot be single stepped when its shadow registers are frozen. Any exception
(a trap or interrupt) will freeze the shadow registers. Exception handling routines sometimes
execute hundreds of instructions before unfreezing the shadow registers. These sequences of
code cannot be single stepped or contain breakpoints on the real machine. These restrictions do
not apply on the simulator. This makes debugging these sequences much easier on the simulator.
We added a memory reference trace facility in response to a request from hardware engineers
contemplating future cache designs. When enabled, this feature causes the simulator to generate
a trace record for every memory reference that a program makes. This facility, combined with the
simulator’s ability to execute user programs running on top of the UNIX kernel, gives us trace data
that previously could only be gathered with hardware monitors or, in the case of microprogrammed
machines, special microcode [9].
8. Details And Kludges
The simulator is written entirely in C. We used the Green Hills 68020 C compiler. We looked
at the generated code and tweaked the C code to get efficient handlers.
There is a kludge that would not be necessary in a language that supported label values. It
is the following: all of the handlers are in a single, large procedure. Each handler begins with a
macro (e.g., L(addu)) that expands to an assembly-language insert that defines a global label (e.g.
asm(" .globl _sim_addu") ; asm("_sim_addu ");). Each global label is also declared in C as an
external function (e.g. "extern void sim_addu();"). The end of each handler jumps indirectly to the
handler for the next decoded instruction. In C we write this as an indirect call of the procedure
pointer in the first field of the decoded instruction to be executed. This procedure pointer is really
a pointer to an instruction sequence. A post-compilation script runs over the assembly code for all
the handlers and converts the indirect calls to indirect jump instructions. This scheme is error prone
because the compiler is not aware of the true control flow of the procedure and may decide it can
reuse registers that it shouldn’t. For this reason we have optimization-fooling code in addition to
the handlers to force all of the local variables to be live for the whole function. An alternative to
this kludge would be to write all the handlers in assembly code. Although it would remove the
kludge, it would be no faster, a big job to maintain, and very unportable. Another alternative would
be to put all the handlers in a big switch statement and accept about a 40% slowdown due to the
switch statement overhead.
9. Experience With The Simulator
Kernel engineers extended the simulator to do extra checking to find specific bugs that had
been difficult to find when running on the hardware. Diagnostic software engineers wrote a number
of device simulators without knowing much about the rest of the simulator. Because the cross-debugger and the simulator use the same dbx-based interface, engineers easily switch back and forth
between the simulator and the real hardware. The simulator is still in use, a year after the hardware
became available, because it offers features not present in the hardware. The simulator is
sometimes used to get a "second opinion" when a software engineer suspects a hardware design
flaw. If erroneous behavior occurs on both the real machine and the simulator, it is usually due to
a software bug. We expected to find most, but not all, of our 88000 software bugs with the simulator.
We could have spent more effort to make a more accurate simulator, but it would be slower and
the bugs that we would have found would not have been worth the extra effort.
It took two weeks of intensive coding to get the core of the simulator working well enough to
prove the viability of our approach. To date we have spent about six person months on the simulator
itself and another six on the front end. A relatively bug-free front end already ported to the 88000
architecture should take a few weeks to interface with the simulator. Our management very much
liked the decoupling of hardware and software schedules that was a result of relying on the
simulator.
The simulator is made for debugging 88000 kernel and diagnostic code. Finding bugs that
required looking at a lot of user-process state is cumbersome. An 88000 UNIX process debugger,
such as gdb, would help, but we didn’t have one at the time we were first bringing the UNIX kernel
up. And such a debugger would be painfully slow in our simulation environment. The simulator is
about 20 times slower than the host and about 100 times slower than the real hardware. We can
run most UNIX commands on the simulator, including fsck, the file system consistency checker.
Running a simple command like date takes about 20 seconds of elapsed time.
10. Contemplated Enhancements
How hard would it be to make our simulator model a multiprocessor and true cache behavior?
Is it possible to use these techniques to model machines with variable length instructions? Modest
changes are all that is required. Below we sketch the approach we propose for making such
changes.
To model multiple processors, one would run some processor’s thread for a period of time,
call it the processor interval, then switch to another processor’s thread. Give the user control over
the processor interval. The user will set this to a large value for fast simulation and to small value
for high accuracy.
Exact code cache behavior can be modelled as follows: allow only those decoded instructions
to remain in decoded instruction pages that correspond to raw instructions that could be in a real
code CMMU’s cache. To do this, keep a table of pointers to the decoded instructions that
correspond to the code cache’s contents. Use this table to selectively invalidate decoded
instructions when a cache line must be reused to make space for a missed line or when the code
cache is flushed explicitly. When a miss is taken we currently decode just the current instruction.
To model the behavior of the code cache, translate all four instructions in the cache line. With
these changes, every decoding of a set of four instructions will correspond exactly to a code cache
miss. By looking at our auxiliary data structure we can tell what the exact code cache contents
are.
Model the data cache by making the software TLB map to an array modelling the data in the
data cache instead of to raw pages. This would require either adding a third level to the software
TLB or making the first or second level tables 256 times larger. A software TLB miss would then
correspond to a data cache miss. Software TLB entries would then be invalidated when a cache
line in a real CMMU would be invalidated.
Machines with variable length instructions complicate the correspondence between raw
instructions and decoded instructions. Perhaps the best approach would be to keep the decoded
instructions a fixed length, make decoded instruction pages large enough to handle the worst case
(i.e., a raw page filled with the shortest raw instructions), and keep a data structure with each
decoded instruction page to map decoded instruction pointers to simulated machine virtual
addresses.
11. Summary
Our technique is to do everything feasible when an instruction is first seen to make subsequent
executions fast. This is akin to the compiler-writer’s motto "don’t do at run time what you can do
at compile time." We cache the results of decoding instructions, of translating virtual data addresses
to raw host pages, and of translating virtual code addresses to decoded instruction pointers. The
simulator is lazy in allocating raw memory, in allocating decoded instruction pages, and in allocating
second level software TLB tables. We have a clean interface to the I/O section to make it easy for
users to add their own I/O simulators. The interface with the front-end is simple to make it easy to
use the good work that other people have put into symbolic debuggers.
There is a need for efficient execution vehicles for the debugging, testing, and measurement
of operating system software. Specifications for an architecture usually exist months or years
before working hardware is available. In our experience, a high speed simulator provided kernel
and diagnostic software engineers with a reliable and inexpensive means of debugging their code
six months before the hardware prototypes became available. We had the workstation software
ported, and could log in and execute UNIX commands three months before the first hardware
prototype was ready.
Acknowledgements
This work was funded by Tektronix. Andrew Klossner approved the project, helped with the
design, extended the simulator, completely rewrote the SCC simulator, and patiently corrected
drafts of this paper. Brent Sherwood and Tim Dale wrote a number of the I/O simulators, without
which the simulator would be of little use. Robert Henry gave drafts of this paper careful review
and pointed out related work. Tony Birnseth and Daniel Klein also gave valuable feedback on
drafts of this paper. I thank all of these people both for the technical help that they gave and for
their encouragement.
References
1. MC88100 RISC Microprocessor User’s Manual, Motorola Corporation, MC88100UM/AD
2. MC88200 Cache/Memory Management Unit User’s Manual, Motorola Corporation,
MC88200UM/AD.
3. C. May, "A Fast S/370 Simulator", Proceedings of the ACM SIGPLAN Symposium on Interpreters
and Interpretative Techniques", pp. 1-13.
4. Lang, T.G., O’Quin, J.T., and Simpson, R.O., "Threaded Code Interpreter for Object Code", IBM
Technical Disclosure Bulletin, 4238-4241 (March 1986).
5. D. W. Clark, "Pipelining and Performance in the VAX-8800 Processor", Proceedings of the Symposium on Architectural Support for Programming Languages and Operating Systems", October 1987,
pp. 173-179.
6. Ditzel, D., and H. MeLellan. "Branch Folding in the CRISP Microprocessor: Reducing Branch Delay
to Zero", Proceedings of the 14th Symposium on Computer Architecture, 1987, p. 2.
7. L. Peter Deutsch, "Efficient Implementation of the Smalltalk 80 System", Record of the Eleventh Annual ACM Symposium on Principles of Programming Languages.
8. James R. Bell, "Threaded Code", CACM, June 1973.
9. Anant Agarwal, Richard L. Sites, and Mark Horowitz, "ATUM: A New Technique for Capturing Ad-
dress Traces Using Microcode", Proceedings of the 13th International Symposium on Computer Architecture, June 1986, pp. 119-127.
XD88 is a trademark of Tektronix, Inc.
UNIX and System V are trademarks of AT&T.
VAX is a trademark of Digital Equipment Corporation.