1
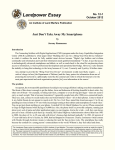
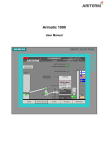
P1.2 NEXRAD OPEN RADAR DATA ACQUISITION (ORDA) RECEIVER CALIBRATION Alan D. Free* SI International, Norman, Oklahoma Adam K. Heck and Nita K. Patel RS Information Systems, Inc., Norman, Oklahoma 1. ABSTRACT 3. The Open Radar Data Acquisition (ORDA) System will replace the Legacy Radar Data Acquisition (RDA) system that is currently part of the NEXRAD fleet. Many Legacy calibration parameters, e.g., SYSCAL, have been replaced with new system calibration parameters, e.g., dBZ0, with the ORDA system. This paper provides a description of test methodology for automatic online calibration and off-line calibration algorithms. When appropriate, differences to Legacy parameters will be identified and explained. 2. INTRODUCTION The NEXRAD Open Radar Data Acquisition (ORDA) enhancement program provides automatic on-line calibration to maintain radar performance and provides enhanced off-line calibration routines to support system maintenance, alignment and troubleshooting (Patel et al, 2003). Calibration is performed during system startup, periodically in standby and during Volume Coverage Pattern (VCP) retrace, i.e., transition from end of a particular VCP to the start of the next VCP. Most calibration routines use one of several test signals available in the WSR-88D architecture. The four test signals shown in Figure 1 are: v Continuous Wave (CW) – constant level test signal at IF frequency v RF noise (NOISE) – broadband noise source v RF test signal (RFD) – sample of RF drive signal input to the Klystron v Klystron Delayed (KD) - 10 µs delayed sample of transmitter output * Corresponding author address: Alan D. Free, SI International, 2227 W. Lindsey Ave., Suite 1500, Norman, OK 73069; e-mail: [email protected] CALIBRATIONS Table 1 details which procedures are run during the on-line calibration during VCP retrace and periodically during standby (Free et al, 2004). The table further details the tests available through the off-line System Test Software (STS). Calibration of the WSR-88D from transmitter to receiver consists of measuring transmitter power, measuring system noise floor, measuring gain/loss of all components in the receiver signal path, computing an error offset for reflectivity and measuring antenna system parameters, namely, antenna gain and pointing accuracy. Parameters contributing to reflectivity accuracy, transmitter power, noise level and linearity, are measured during the on-line calibration each VCP. Off-line STS calibration functions provide additional detail and also assist in system verification, maintenance and troubleshooting. Table 1: On-line and Off-line Calibration Test System Noise Short Pulse Long Pulse Noise Temperature Reflectivity Correction (dBZ0 ) System linearity Linearity Test Attenuator Calibration Velocity/Spectrum Width I/Q Processing External Phase Shifter Transmitter Power Error estimates Short Pulse Long Pulse KD Check KD power Online Offline Clutter Suppression CW Substitution Stage Clutter Suppression Suncheck Az/El Offsets Antenna Gain 4. SYSTEM NOISE System Noise measurements provide a measure of the receiver path. Noise is measured with the transmitter off, i.e., non-radiating. When in standby, Noise is measured with the antenna in parked position (0° azimuth and 23° elevation). Operationally, the measurement is only made with the antenna above 3.5° in elevation to avoid bias due to ground noise. No test signals are injected during noise measurements. In ORDA, the System Noise is measured in both short and long pulse to obtain accurate system calibration for both short and long pulse VCPs. This is different from the Legacy computation in that an offset was added to the short pulse measurement to obtain the long pulse noise value. ORDA uses digital matched filtering; therefore, the filter parameters are specified for both short and long pulse independently. Since the matched filter loss is a contributor to the system noise measurement, independent computations are made for the differing pulse widths. System Noise is obtained by computing signal the power of approximately 5000 I/Q samples along a span of 10 radials. The System Noise parameter is adjusted by an elevation scale factor representing the influence of ground noise on the reading. ORDA Noise measurements for short and long pulse are -80dB and -85dB, respectively. Legacy short/long pulse Noise measurements were approximately -57dB. Depending on system waveguide configurations and other receiver path components, Noise measurements from system to system will vary 1-2dB. 5. NOISE TEMPERATURE Noise Temperature is related to the system noise figure (see Figure 1). Noise Temperature is best measured by injecting different noise source levels at the input of the receiver. 1 WG Circulator 2 Rx Protect PDL EMI Filter 3 A LN 4 Heliax Cable Cabinet Coupler - Preselect Filter Other Cable losses 5 xe r Mi am p Pr e 6 3dB Attenuator Anti Alias Filter Gain (dB) -0. 63 -1.15 +27. 88 -6.30 +19.79 -5.00 Noise Figure (dB) -0. 63 +1.15 +1.30 +6.30 +11.00 +5.00 Noise Source Figure 1: ORDA Noise Figure The NOISE test signal is injected at the front end to compute a noise power level (Noiseon) with a calibrated signal. Another measurement (Noiseoff ) with no injected signal is also taken. The ratio of Noiseon to Noiseoff along with the known Hot and Cold source temperatures gives the noise temperature as shown in equation 1. The cold temperature (TC ) value is the temperature of the antenna. The hot temperature (TH ) is given by equation 2 using the computed Excess Noise Ratio (ENR) of the NOISE test signal and is calculated at the receiver front end, i.e., the receiver protector. Noisetemp Noiseon TH − TC Noiseoff = Noiseon − 1 Noiseoff ENR TH = 290 10 10 + 1 (1) (2) ORDA Noise Temperature is 250K to 270K. Legacy measurements gave values of 550K to 600K due to an error in the Legacy equation. However, the absolute values are not important in themselves. Noise Temperature is an excellent indicator of changes in component performance and/or system calibration. This Noise Temperature represents the contribution of noise in the receiver signal path from the receiver protector to the IFD. The noise added by waveguide components, feedhorn, antenna, side-lobes and the radome are all taken into account in the cold temperature, TC . Noise Temperature is extremely sensitive to receiver changes; therefore, it is an ideal parameter for use in early detection of failing components. IFD 6. REFLECTIVITY CALIBRATION CONSTANT (dBZ0 ) The ORDA system outputs 1km reflectivity moment data that is computed using equation 3. P −N dBZ = 10 log R + 20 log(R ) − A × R + dBZ 0 N (3) Where PR is the return signal power, N is the Noise value corrected for elevation, R is range, A is the two-way atmospheric loss and dBZ0 is the system calibration constant, computed using equation 4. dBZ0 represents the reflectivity of a 0dB Signal-to-Noise target at a range of 1km, and includes all the constants in the radar equation (Rinehart, 1997). 210 × ln ( 2 ) × λ2 × 1018 ×10 −3 × 10⁶ N dBZ0 = 10 log 3 × π × P × G 2 ×θ 2 × c × τ × K 2 × L × L × L g T t r d (4) Where λ is the wavelength in centimeters, Pr is the received power in milliwatts, G is the antenna gain, θ is the beamwidth, τ is the pulsewidth in microseconds, K is refractivity, Lr is the receiver waveguide loss in dB, Lt is the transmitter loss in dB, Ld is the receiver detection loss in dB, N is the system Noise in milliwatts and g is the receiver gain. 6.1 Transmitter Power, Pt The transmitted power directly affects system calibration. Along with Noise (N) and receiver gain (g), transmitted power can fluctuate during system operation; therefore, Pt is measured periodically. Transmitter Power is measured during the surveillance cut of a VCP and also during the Performance Check. During a VCP cut, the system measures the average power of the transmitter once a second. The samples are averaged together and corrected for the duty cycle to obtain the transmitter peak power. During the Performance Check, a similar procedure is used; however, samples are obtained at one-second intervals with the antenna parked. The transmitter has not changed in the ORDA architecture and is the same as that available in the Legacy WSR-88D configuration. Nominal transmitter peak power is 700kW. Because the WSR-88D system uses an average power meter to measure power, the zero level is important. Power Meter Zero is done during on-line calibration to measure the slight positive bias on the power meter thereby ensuring accuracy of power measurements when radiating. 6.2 Sensitivity, I0 System sensitivity, N/g, represents the power level of a 0dB Signal-to-Noise target measured at the receiver input. This term is called I0 and also represents the system’s Minimum Discernible Signal (MDS). I0 and Transmit Power are the only variables of the dBZ0 equation that change regularly and need to be updated. I0 is calculated by the Linearity routine and provides a measure of the linearity of the system as well as the Noise floor of the system. Nominal ORDA sensitivity is measured to be -114dBm. Correlating Legacy sensitivity is nominally -113dBm. 7. SYSTEM LINEARITY This test verifies the linear receiver response. Data points along the linear graph are used to determine the calibration constant I0 used in the dBZ0 calculation. The ORDA design incorporates a staggered linearity test performed during VCP retrace to verify the entire linear operating range. That is, each VCP will measure 10 points on the linear curve. The 10 points will be staggered with points used on subsequent VCPs in order to eventually test the entire linear range. For example, the first VCP will use points 21, 27, 33, 39 etc.; the second VCP will use points 22, 28, 34, 40 etc. During every Performance Check, the ORDA calibration procedures will test the entire receiver transfer curve. Deviations from linear response indicate a failing system components or non-linear response from the active components. The ability to view data points at different attenuation levels is one advantage over the Legacy architecture that only provided data at four discrete test signal levels. 7.1 Test Attenuator The test attenuator is used to vary the injected signal level from 0 to 103dB; therefore, it is critical each attenuation step is accurately calibrated. An automated off-line routine allows the technician to inject a signal into the IFD through the 0dB test attenuator setting to obtain a reference point. Based on the reference value, the 103dB steps of the test attenuator are calibrated using the internal CW test signal and by varying the injection point between the cabinet and the front end. 7.2 Dynamic Range v v ORDA software automatically executes Dynamic Range measurements every retrace period, a capability not available in Legacy RDA software. Using the built-in CW test signal stepped through all 103dB steps of the test attenuator, the system’s 1dB compression point is identified. The Dynamic Range is then computed as the delta between I0 and the 1dB compression point. Figure 2 (Free, 2005) shows the ORDA offline linearity and reflectivity test measurement display. This calibration test computes the system noise floor, compression point, minimum detectable signal, linearity and dynamic range and shows the results in a graphical window. This test run was done in short pulse at the KCRI channel 2 test bed system in Norman, OK. As shown here, the Dynamic Range from 0dB S/N to 1dB compression is given as 95dB. The nominal legacy value for Dynamic Range is 93dB -3/8 VNyquist 5/8 VNyquist The velocities are simulated by progressively phase stepping the test targets produced by the frequency generator. Applying a dither to the successive phase simulates spectrum width. A dither of 13º is applied to give a constant spectrum width of 3.55 m/s with a VNyquist = 28 m/s. The ORDA signal processor uses the input test signal to verify RF generator phase shifter operation and to verify signal processor phase reference and processing consistency. With ORDA, two types of velocity and spectrum width computations are performed. The phase shifted CW test signal is used in off-line calibration. During on-line calibration, a predefined I/Q data stream is input to the processor for verification of the velocity and spectrum width algorithm. Velocity/Spectrum Width problems are rare and would indicate a phase unstable receiver component. This typically only happens when the component becomes non-linear and its noise increases. 9. KD CHECK The KD Check provides information about the receiver protector and compares the cabinet versus front-end signal levels to help isolate path gain/loss errors in the front-end components versus the cabinet components. KD pulse level checks help differentiate between transmitter or receiver problems. 9.1 Clutter Suppression Figure 2, Receiver Transfer Curve Problems in Dynamic Range can indicate saturation problems in the active receiver components. Noise problems will indicate problems in the lower end of the receiver curve. 8. VELOCITY/SPECTRUM WIDTH In addition to varying the CW test signal for measurement of system Linearity and the Reflectivity Calibration, the CW test signal is phase shifted in reference to the COHO to simulate Doppler shifts on the test target returns. Using this technique, the following velocities are sequentially simulated: v 0 velocity v 1/4 VNyquist Since the KD pulse is a sample of the klystron output, it is an ideal test target for testing Clutter Suppression. The level of the KD pulse is measured with and without Clutter Suppression enabled in the signal processor. The level of suppression and consistency in the measurement gives a high level of confidence in the phase stability of the system. Problems here typically indicate problems with transmitter stability. Typical Clutter Suppression levels for ORDA is around 55dB. Legacy Clutter Suppression was nominally 50dB (Ice, 2005) (Heiss, 1990). 10. CALIBRATION VERIFICATION Off-Line procedures to verify calibration accuracy are integral to the maintenance strategy. There are three major procedures used to verify reflectivity calibration: Suncheck, Error Estimate, and CW Substitution. Each procedure has a different focus and exposes different calibration problems. 10.1 Suncheck Suncheck uses the sun as a noise source to do 2 things: calibrate antenna position, and check antenna gain. This external source’s position relative to the earth is well known and accurate, and observatories like Penticton calibrate its noise output in the WSR-88D frequency band, measured in solar flux. To check antenna gain, we first use the solar flux data and convert it to sun noise temperature referenced to the receiver front end. This conversion accounts for beamwidth, polarization, assumed antenna gain, wavelength, sun-earth distance, and path loss from antenna port to receiver front end. Next, we must measure the sun temperature as seen by the receiver. We use the following equations to calculate the sun temperature: P TN − TC N PC TR = PN − 1 PC (5) then: P TN − TR N 2 − 1 P S TS = PN 2 − 1 PS (6) Where TC is the Blue Sky Antenna temperature measured at the receiver front end, PC is the Antenna power level, TN is the Noise Source temperature at the receiver front end, PN is the Blue Sky with Noise Source on power level, TS is the Sun temperature, PS is the Sun power level and PN2 is Sun with Noise Source on power level, TR is the receiver Noise temperature and g is the receiver gain from the receiver protector to the IFD. The calculated-to-measured ratio gives an estimate of the antenna gain correction and is dependent on correct system calibration. 10.2 Error Estimate The error estimate is an off-line procedure that can quickly pinpoint dBZ0 problems. It is completely automated, and gives information on changes in noise, gain, linearity, and transmitter power. 10.3 CW Substitution CW Substitution is used to verify the receiver gain using a calibrated external signal generator. The signal generator injects CW at a known power level into the receiver at 2 points, allowing comparisons with the internal RF Generator. This checks accuracy of the test path, the front end, and the receiver cabinet path. 11. CONCLUSION Calibration provides verification that reflectivity accurately compensates for detectable system changes. It also provides insight into hardware behavior and improves troubleshooting capability. Automating as many tasks as possible reduces the chance for error from human input and speeds test completion, improving concentration on the problem instead of the test. The Off-Line tests build upon the foundation formed by the On-Line tests, allowing improved analysis and increased data for diagnosing problems. 12. ACKNOWLEGEMENTS The authors would like to thank Dale Sirmans and William Urell for their support in writing this paper. Note: The views expressed are those of the author(s) and do not necessarily represent those of the National Weather Service. 13. REFERENCES Free, A., Patel, N., Heck, A., 2004: ORDA Internal Report – ORDA System Calibration. Free, A., 2004: ORDA Internal Report – Legacy vs. SIGMET dBZ Calculation. Rinehart, Ronald E., 1997: Radar for rd Meteorologists, 3 edition, Rinehart Publications, Columbia, MO. Ice, R., McGehee, T., Rhoton, R., Saxion, D., Warde, D., Guenther, R., Sirmans, D., Rachel, D., 2005: Radar Operations Center (ROC) Evaluation of New Signal Processing st Techniques for the WSR-88D, 21 International AMS Conference on Interactive Information and Processing Systems for Meteorology, Oceanography, and Hydrology. Heiss, W., McGrew, D., Sirmans, D., 1990: NEXRAD: Next Generation Weather Radar (WSR-88D), Microwave Journal. Patel, N. and Macemon, B., 2003: NEXRAD Open Radar Data Acquisition (ORDA) Signal th Processing & Signal Path, 20 International AMS Conference on Interactive Information and Processing Systems for Meteorology, Oceanography, and Hydrology. Patel, N., Free, A., Jim, G., 2005: NEXRAD Open Radar Data Acquisition (ORDA) Receiver st Characteristics, 21 International AMS Conference on Interactive Information and Processing Systems for Meteorology, Oceanography, and Hydrology. Sirmans, D., Urell, W., 2001: Radar Operations Center “On Measuring WSR-88D Antenna Gain Using Solar Flux”. SIGMET, 2004: RVP8 User’s Manual