1
IMP Software Suite User Manual, Release 4.0.2
2.2.4 Analyze Scan Data
Raw ImAFM™ data, the intermodulation spectrum at each pixel, both trace and retrace, are stored in one compact
scan file. The spectrum at each pixel is an highly compressed representation of the actual cantilever motion, from
which we reconstruct the tip-surface force. From the raw data, the AFM scientist can go back and make a more
careful study of each point on the surface, analyzing it with different models and plotting it in different ways.
Intermodulation Products offers a Quantitative Analysis package with many methods of analysis, and more are
constantly being developed. You can also use the ScanData python class to easily extract and analyze the data
with your own analysis methods.
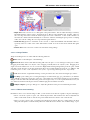
In File pull-down menu, select Open (ctrl+O). The Amplitude and Phase images appear in a new tab
for each open scan file. You can open multiple tabs and compare data from different scans on the same plot in the
analysis view. In the analysis view you will find the Image settings panel, the Image Toolbar and the Color Bar.
With the Pixel inspector tool and Line inspector tool, you can select individual pixels and lines for Quantitative
Analysis, as previously described.
2.2.4.1 Image Smoothing
The analysis panel is similar to the Image settings panel, with an additional Smooth image button. This button
opens a dialog box where you can apply a Gaussian filter to your scan data. Smoothing will convolve the stored
intermodulation data with a Gaussian function of width Sigma pixels in the x and y direction. The result is a new
image, stored to the given File name, where each pixel of the new image is a weighted average of neighboring
pixels in the raw scan data file. Smoothing with one pixel results little loss of sharpness in the image and it lowers
the noise considerably. The Gaussian has 98% of the weight within 3 Sigma of the center, so smoothing with one
pixel essentially averages a block of 9 pixels, giving an improvement in the signal-to-noise ratio by a factor of 3.
This is a smart way to improve the signal quality without increasing the measurement time, by exploiting the idea
that neighboring pixels are more likely to have the same response. Note however that smoothing does introduce
a correlation length to your data, which you can clearly see as a granularity in high-order IMP images, which are
often more noisy. Be careful not to interpret these smoothing-induced grains as features in your image.
2.2.5 Session Overview
This view shows all the scans in a session, automatically imports data from the host AFM, sorts out unwanted
scans to a sub-folder, adjust images for synchronization problems with the host AFM, and generates parameter
maps on multiple scans in a batch processing mode.
2.2. Work Flow
15