1
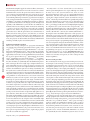
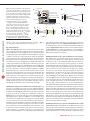
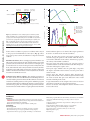
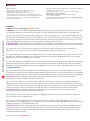
protocol A multispectral optical illumination system with precise spatiotemporal control for the manipulation of optogenetic reagents Jeffrey N Stirman1,2, Matthew M Crane2, Steven J Husson3,4, Alexander Gottschalk3,4 & Hang Lu1,2 School of Chemical and Biomolecular Engineering, Georgia Institute of Technology, Atlanta, Georgia, USA. 2Interdisciplinary Program in Bioengineering, Institute of Biosciences and Bioengineering, Georgia Institute of Technology, Atlanta, Georgia, USA. 3Johann Wolfgang Goethe University, Institute of Biochemistry, Frankfurt am Main, Germany. 4Frankfurt Institute for Molecular Life Sciences, Johann Wolfgang Goethe University, Frankfurt am Main, Germany. Correspondence should be addressed to H.L. ([email protected]). 1 © 2012 Nature America, Inc. All rights reserved. Published online 12 January 2012; doi:10.1038/nprot.2011.433 Optogenetics is an excellent tool for noninvasive activation and silencing of neurons and muscles. Although they have been widely adopted, illumination techniques for optogenetic tools remain limited and relatively nonstandardized. We present a protocol for constructing an illumination system capable of dynamic multispectral optical targeting of micrometer-sized structures in both stationary and moving objects. The initial steps of the protocol describe how to modify an off-the-shelf video projector by insertion of optical filters and modification of projector optics. Subsequent steps involve altering the microscope’s epifluorescence optical train as well as alignment and characterization of the system. When fully assembled, the illumination system is capable of dynamically projecting multispectral patterns with a resolution better than 10 µm at medium magnifications. Compared with other custom-assembled systems and commercially available products, this protocol allows a researcher to assemble the illumination system for a fraction of the cost and can be completed within a few days. INTRODUCTION Recently, there has been considerable interest in optically targeting optogenetic reagents for noninvasive excitation and inhibition of cultured cells1–5 and neurons and muscles in small model organisms such as the nematode Caenorhabditis elegans 6–14, the fruit fly Drosophila melanogaster15–18, the zebrafish Danio rerio19–24 and the mouse25–30. Optogenetic reagents are light-gated ion channels and pumps, and, when expressed in excitable cells (neurons and muscles), illuminating them with the appropriate wavelength of light causes depolarization (e.g., Channelrhodopsin-2 or ChR2 (ref. 1)) or hyperpolarization (e.g., Halorhodopsin or NpHR2, MAC and Arch3) of the cell. In cultured cells and small model organisms, the ability to excite or inhibit a subset of the cells would allow for probing circuits and functions in real time. However, there are few single-cell–specific promoters in C. elegans, and thus optogenetic reagents are generally expressed in a larger population of cells. Although there are techniques for single-cell expression, including the use of Cre31 or FLP recombinases32, these can be unreliable or they may not allow for sufficient expression of optogenetic reagents. Furthermore, to investigate integration of distinct neural signals, expression in multiple cells is required. To fully realize the potential of the optogenetic reagents, the toolbox must be expanded to include techniques for specific and localized optical targeting of excitable cells. In addition, because currently available optogenetic reagents cover a broad range of the optical spectrum, the ability to have multispectral optical illumination is valuable. In this protocol we present a procedure to modify a commercially available three-panel liquid crystal display (3-LCD) projector and integrate it with most inverted epifluorescence microscopes for the purpose of patterned illumination on a sample, as was shown previously for the optogenetic activation and inhibition of neurons and muscles in C. elegans12. The protocol allows for fully reversible modification of the microscope system. Once completed, the illumination system is capable of multicolor illumination, and it can be applied to both static and moving samples. The illumination pattern is defined by a computer and sent to the projector as a second video output; the image is then relayed from the projector to the microscope and demagnified (determined by the objective and the accessory optics). Images for projection can be easily defined statically through programs such as Microsoft PowerPoint, or they can be dynamic and more complex in design through the use of image-processing techniques in MATLAB or LabVIEW12. The resolution of the generated optical pattern depends on the microscope objective selected, and, for example, is better than 10 µm using a ×25 objective. The temporal resolution and accuracy of the system is ultimately limited by the refresh rate of the projector (60 Hz), the response time of the pixel elements and the lag time of the projector, and is found to be ~111 ms (Supplementary Fig. 1 and Supplementary Note 1). The high illumination intensity from a typical projector ( >4 mW mm − 2 with a ×4 objective) is sufficient for the activation of most optogenetic reagents2,3,6,9. Furthermore, the intensity of illumination can be varied throughout the projection pattern by defining the 8-bit value of the pixel for each color at the desired location. To fully demonstrate the capabilities of this multispectral system, we show it applied to the dynamic optical activation of optogenetic reagents in freely moving C. elegans, where we simultaneously excite and inhibit specific cells. Applications of the method One application of this illumination system and similar systems, as shown in this paper and previously10,12,13, is for the dissections of various neural circuits and synaptic functions in C. elegans. In addition, this technology can replace or supplement other techno logies used for illumination in other model systems including D. melanogaster16–18, D. rerio19–21 and cells33,34 in which region-specific illumination of optogenetic reagents is beneficial. We also envision nature protocols | VOL.7 NO.2 | 2012 | 207 © 2012 Nature America, Inc. All rights reserved. protocol that this method might be applied to cultured cell lines, for instance, for monitoring homeostasis in a network of neurons in a culture dish. Furthermore, because the protocol describes a method to create a system for patterned illumination, the system can be used in place of existing techniques that use spatially defined illumination, including enhancing resolution by reconstruction of samples using structured illumination technique35 and patterned photocrosslinking36. In addition, the illumination intensity is sufficient to perform standard fluorescent imaging, and the multispectral capability of the illumination system can allow for simultaneous multicolor fluorescence imaging. When extremely fast shuttering ( <15 ms) is not needed, the projector can replace the excitation epifluorescence shutter, as the projector can switch from full-on (pixel value 255) to full-off (pixel value 0) at a maximum rate of 60 Hz (refresh rate of the projector), and, therefore, we envision that this could also replace a shuttering system. Finally, because the light intensity is defined by the value of the pixel (from 0 to 255, 8-bit), the projector can also modulate the intensity of illumination and thus potentially replace neutral density filters. Comparison with other methods Many of the existing techniques for optogenetic illumination are performed by positioning optical fibers in the vicinity of the target19,26,37,38, by statically focused laser illumination39 or by static shadowing of illumination regions20. These methods are frequently imprecise or are performed in static samples, thus limiting their applicability. Current state-of-the-art illumination systems involve the use of two-photon microscopy4,5, light-emitting diode (LED) arrays34, digital light-processing (DLP) mirrors10,13,33 or commercially available LCD projectors12,18 to spatially restrict light, and they have the ability to dynamically alter the illumination pattern. These techniques allow for a high degree of light localization to target individual neurons or groups of neurons or muscles, and they can form any pattern for complex illumination schemes. In addition, the illumination patterns can change dynamically and the system can be automated to allow for continuous illumination even in moving targets. However, the commercially available singlechip DLP system, two-photon– and LED-based methods may be cost prohibitive to many laboratories, and custom-constructed DLP-based systems are both expensive and require substantial knowledge of optical components and design. A further limitation of the two-photon, LED array and single DLP-based systems is that they are generally limited to single-color illumination. If more than a single color is used, then it must be achieved by rapid switching between colors, and thus it is not truly simultaneous; this adds considerable complexity due to multicomponent synching and adds substantial cost. In contrast, the 3-LCD projector-based system presented here has three independent light paths for red, green and blue, which allow for true simultaneous illumination. The off-the-shelf availability of 3-LCD projectors makes the system presented in this protocol affordable and feasible for implementation in most laboratories. By using the native metal halide light source of the projector, no additional cost is incurred, and the final system is one to two orders of magnitude cheaper than comparable commercial systems. Such a light source is standard in fluorescent imaging and provides high-brightness illumination across a broad spectrum. Furthermore, the protocol described here does not require an expert knowledge in optics, engineering or physics to be able to assemble the equipment. 208 | VOL.7 NO.2 | 2012 | nature protocols Recently, Leifer et al.13 have described the use of a related system for optical manipulation of C. elegans. Although it is similar in many ways to the system described here, there are some important distinctions. Leifer et al. use a single DMD from Texas Instruments, and thus only single-color illumination is used at a given time compared with the system described here and pre viously12, which can perform simultaneous (spatially independent) three-color illumination. Second, Leifer et al. use light from either a blue laser (473 nm, 5 mW mm − 2) or green laser (532 nm, 10 mW mm − 2), providing spectrally narrower and slightly higher intensity; in comparison, the system described here and previously12 uses the native metal halide light source with the addition of custom band-pass filters: blue (430–475 nm, 4.62 mW mm − 2), green (543– 593 nm, 6.03 mW mm − 2) and red (585–670 nm, 5.00 mW mm − 2). By using the native metal halide light source of the projector, no additional cost is incurred, and the optical configuration of the system is simplified. Finally, the two systems differ in the software used for real-time control and feedback and the closed-loop operation speed. By using the C programming language, optimizing the code and using Intel’s Integrated Performance Primitives, Leifer et al. were able to achieve a closed-loop temporal accuracy of ~20 ms while using the full resolution of the camera (1,024 × 768)13. We chose to use LabVIEW with Vision software for its ease of use for programming non-experts; our system operates with a closedloop temporal accuracy of ~111 ms (Supplementary Note 1) at a camera resolution of 320 × 240. Both systems provide similar software user interfaces and options, as well as subsequent data analysis capabilities. Overview of the procedure The overall objective of the steps presented in this protocol is relatively simple: to take an image created by a projector, and, instead of enlarging it and projecting it onto a screen, to relay the image through the epifluorescence port on a microscope and transfer a demagnified image to the sample plane (Fig. 1a)12. A projector operates by shining light through a spatial light modulator (SLM; in this case an LCD), thereby creating an image composed of hundreds of thousands of individual pixels defined by the individually addressable SLM pixel elements. The image formed at the SLM (object plane) is then transferred through a relay zoom lens and a concave (diverging) magnifying projection-focusing lens to form the primary image and projected (magnified) image (Fig. 1b). By removing the diverging projection lens, a primary image is formed by the zoom lens a few centimeters in front of the lens. This image is then relayed through a reconfigured epifluorescence optical train of an inverted microscope, passing through the objective, forming a demagnified image at the focal plane of the objective (specimen plane; Fig. 1c,d). It is in this specimen plane that the object of interest (e.g., freely moving C. elegans) is located and illuminated. The image projected onto the sample plane can be constructed through programs such as Microsoft PowerPoint, or other graphic illustrators, for simple static patterns10 or for patterns that change with time in a predefined manner18. These projected images would be suitable for immobilized animals or cells, or objects that vary slowly over time, as there is no real-time feedback. For freely behaving animals or for dynamic events, one must use software that can provide and process real-time feedback. Custom programs can be written in LabVIEW, MATLAB or C, which can dynamically alter the illumination patterns based on user protocol © 2012 Nature America, Inc. All rights reserved. a b Sample plane Camera C-mount coupler Inverted Petri dish ///ALLIED Figure 1 | Optical configuration of the system and components. (a) Final optical configuration for the system. The epifluorescence optics are replaced by an accessory tube lens (infinity corrected) or relay lens pair (160 mm) and a modified 3-LCD projector. (b) Optical configuration of the projector in the original unmodified state. (c) Optical configuration of the constructed illumination system for an infinity-corrected microscope. (d) Optical configuration of the constructed illumination system for a 160-mm microscope. ATL, accessory tube lens; BFLRLP, back focal length of the RPL; FFLRLP, front focal length of the RLP; FLATL, focal length of the ATL; PDL, projector diverging lens; PI, projected image (M > 1); PPI, projector primary image; PZL, projector zoom lens; OL160mm, objective lens (160 mm); OLIC, objective lens (infinity corrected); RLP, relay lens pair; IP160 mm,160 mm back image plane; SLM, spatial light modulator; SP, sample plane (M < 1). Adapted from reference 12. PI PZL Motorized XY stage SLM PPI Primary projector Image 3-LCD PROJECTOR x4 objective PDL 662 nm dichroic c SLM Accessory tube lens (infinity corrected) or relay lens pair (160 mm) PZL ATL PPI d OLIC SLM PZL RLP PPI OL160 mm IP160 mm SP FLATL inputs or closed-loop automated analysis of images (Fig. 2; e.g., targeting neurons and muscles in C. elegans12,13). Experimental design Choice of 3-LCD projector. A few considerations must be taken into account when selecting a 3-LCD projector. The main specifications of importance are the brightness, the size of the LCD panels and the contrast ratio. The combination of the brightness (reported in lumens) and the size of the LCD panels define the maximum possible intensity of the demagnified image at the sample plane. Because the etendue of an optical system cannot decrease, a projector with the same reported brightness yet smaller LCD panels will yield greater intensity at the sample plane. Therefore, a projector that maximizes the brightness (minimum suggested is 2,000 ANSI lumens) with the smallest panels should be chosen (maximum panel size suggested is 1 inch). The Hitachi CP-X605 is a 4,000– ANSI lumen projector with 0.79-inch LCD panels and is used in this protocol. Also important is the contrast ratio. Both DLP- and LCD-based systems have no true zero intensity: even when the DLP or LCDs are in the off state, there is a finite amount of background illumination. To minimize the background illumination (thus preventing unwanted excitation of the optogenetic reagents), a high-contrast-ratio projector (at least 500:1) should be selected. The Hitachi CP-X605 has a stated contrast ratio of 1,000:1. Modification of the projector and insertion of custom optics. The protocol to reconfigure the 3-LCD projector (Hitachi CP-X605) begins by removing the diverging projection lens and inserting custom filters internally (Fig. 3a). The action spectra of the optogenetic reagents previously used12, ChR2 (ref. 1) and MAC3, are shown in Figure 3b. The spectrum of each color of the unmodified Hitachi CP-X605 projector is quite broad (Fig. 3c)12 and would thus cause considerable cross-activation between optogenetic reagents. Similar spectra would be observed for other 3-LCD projectors. Therefore, to limit the spectral width of the excitation, custom filters are added inside the projector; the filters in this protocol are chosen to maximize optogenetic activation and minimize cross-activation. To fit in the projector, the new filters must either be custom sized by a filter company (e.g., Semrock or Chroma) or cut from a larger filter by a professional glass cutter. The specifications, dimensions SP FFLRLP BFLRLP 160 mm and method of cutting of the filters used in this protocol (for the Hitachi CP-X605) are found in Supplementary Table 1. Filter sizes for alternative projectors can be determined through careful mea suring (Supplementary Note 2) of the locations for filter insertion in PROCEDURE Step 9. The postmodification spectrum (Fig. 3c) has much narrower spectral widths for each color, allowing for highly defined multicolor excitation. Modification of microscope optics for infinity-corrected systems. The epifluorescence optical train of a microscope cannot properly relay the projector image to the sample plane as its lenses are not of the proper style or focal length and thus must be removed to make room for the custom optics. In this protocol, we describe the modifications for both the infinity-corrected microscope and for the 160-mm fixed-tube-length microscopes. In an infinitycorrected microscope, the objective lens and tube lens combine to form a two-lens system, and when imaging the amount of magnification is determined by the ratio of the focal lengths of two lenses (M = TLfl/OLfl > 1). To transfer the projector’s primary image (PPI, Fig. 1c) to the sample plane (Fig. 1c), an accessory tube lens (ATL, Fig. 1c) must be inserted in the optical path between the projector and the objective. The magnification in this direction is again determined by the ratio of the focal lengths of two lenses (M = FLOL/FLTL), which will yield M < 1 or cause demagnification. Tube lenses from different microscope manufacturers have different focal lengths (Leica, 200 mm; Nikon, 200 mm; Olympus, 180 mm; and Zeiss 165 mm). The ATL to be inserted should be chosen to best match the focal length of the tube lens of the microscope manufacturer; in this way, the power of the objective closely matches the amount of demagnification. The distance between the ATL and the PPI should be equal to the focal length of the ATL (Fig. 1c). The distance between the ATL/projector combination and the objective lens is not as critical; however, it is generally recommended that this distance be kept as short as possible. Modification of microscope optics for 160-mm fixed-tube-length systems. Although the 160-mm fixed-tube-length microscopes are an older style, they are more than adequate for the purpose of constructing this multispectral illumination system and can often be found more inexpensively. In a 160-mm fixed-tube-length microscope, nature protocols | VOL.7 NO.2 | 2012 | 209 protocol a Image aquisition Motorized stage control Camera X–Y stage Aquire image Current position Threshold Calculate worm offset Center of mass (X,Y ) Reposition stage Illumination control © 2012 Nature America, Inc. All rights reserved. c d 1 0 Threshold Image processing X–Y stage b Calculation of illumination segments e f g Projected image Projector Figure 2 | Custom software for the real-time illumination of freely behaving C. elegans. (a) Three independent loops, each operating at 25 Hz, control image acquisition, motorized stage repositioning and automated illumination control. (b) Acquired bright-field image of C. elegans. (c) Binary image after applied thresholding. (d) The binary image is thinned to a single pixel backbone, representing the AP axis of the animal, and segmented according to user-selectable parameters (number and location). The locations for segmenting are based along the relative path length of the backbone where the head is 0 and the tail is 1. (e) Resulting segmentation of the binary image. (f) Color pattern generated based on user-selectable options including segment number, color (RGB), intensity (0–255) for each color and illumination duration. (g) The resulting multicolor illumination pattern projected onto the moving C. elegans. The image is falsely colored based on the intended illumination pattern. Scale bar, 250 µm. the specimen is placed slightly in front of the front focal plane (FFL) of the objective, and the intermediate image is formed 160 mm behind the nosepiece opening. To reverse this process and demagnify the projector image, the primary projector image (PPI, Fig. 1d) should be placed 160 mm from the nosepiece opening. However, owing to mechanical restrictions, this is usually not possible. Therefore, the primary projector image must be transmitted to the plane 160 mm from the nosepiece opening. This is accomplished by using a relay lens (RL, Fig. 1d) consisting of a 1:1 matched RL pair (RLP). The RLP should be located such that the FFLRLP of the lens pair and the 160 mm plane coincide, and such that the back focal length (BFLRLP) of the lens pair and the primary projector image coincide (Fig. 1d). System assembly. The projector is mounted on a stable lab jack to provide z-translational ability; the ATL or RL and the projector must be centered along the optical axis of the epifluorescence port. Fine adjustments to the location of the lenses and projector are made to ensure that the demagnified projector image and the object of interest (e.g., C. elegans) are coincident. When connected to a computer and set up as a dual-monitor display, the completed system will relay the image for the second monitor (projector) through the microscope, which reduces it in size, thus projecting it onto the sample. General software. We created custom software capable of automatically tracking C. elegans, acquiring images, identifying anatomical locations and directing the projector to illuminate the animal at the desired location, color and intensity (Fig. 2). The software is written in LabVIEW and can be found, along with a complete description, in the online supplementary material of reference 12 (http://www.nature.com/nmeth/journal/v8/n2/full/nmeth.1555. html#/supplementary-information). The complete software consists of four main programs, which are briefly described below. The software was written for a specific camera (AVT Guppy) and a specific motorized microscope stage (Prior), and would need to be modified for another camera or stage. More detailed information 210 | VOL.7 NO.2 | 2012 | nature protocols can be found in the ‘Program Overview’ file and in comments within the programs that accompany reference 12. Projector Alignment software. This program obtains parameters for a coordinate system transformation between the camera coordinates, XC,YC (defining the object of interest within the field of view), and the projector coordinates, XP,YP (defining the intended illumination pattern). A grid of 20 solid circles is projected (center positions XP,YP) sequentially through the constructed optical system. These images are reflected off a highly reflective surface (such as a front-coated mirror) and are imaged with the camera, and then the locations of the projected circles are determined (center positions XC,YC). The scaling and offset parameters are determined and saved for use by the main program. Color Illumination and Tracking software (main program). This program controls the acquisition of images, real-time tracking of the animal (keeping within the field of view), image processing to determine relative positions in the animal, constructing the illumination pattern based on user-selectable inputs (position, color, intensity and duration), scaling the image and finally relaying it to the projector. Within this program, there are three main loops: (i) image acquisition, (ii) motorized stage control and (iii) illumination control (Fig. 2a). These functions are contained in separate processing loops to increase speed and operate in a closed loop in order to accurately maintain illumination of the desired locations as the animal changes body posture and location. First, the image is acquired using a digital camera (Fig. 2b), and thresholding this image results in a binary image (Fig. 2c) from which the center of mass can be calculated. From this current position, the offset of the animal is calculated and a command is sent to the motorized stage to recenter the object. The binary image of the animal is thinned to a single-pixel backbone and segmented based on user-selectable parameters (Fig. 2d,e; e.g., six equally spaced segments). Within the program, the user can select which segments to illuminate, as well as the color, intensity and the duration of illumination (Fig. 2f). This illumination pattern (Fig. 2f) is scaled and offset to translate a 600 nm LP filter (add) 568/50 nm filter (add) 475 nm SP filter (add) UHB mercury lamp LCDs Relay zoom lens Primary projector image plane b 1.0 Relative sensitivity protocol 0.5 ChR2 MAC 400 Focusing diverging projection lens (to be removed) 450 500 550 600 650 c 100 Blue (post-filter) Green (post-filter) Red (post-filter) Blue (pre-filter) Green (pre-filter) Red (pre-filter) © 2012 Nature America, Inc. All rights reserved. from a camera coordinate to projector coordinates and is relayed to the projector for illumination of the object (Fig. 2g). These loops each operate at 25 Hz, and thus have a temporal resolution of 40 ms. Head Encode software. This is a simple program in which the user follows the position of the head of the animal with the cursor. This position is encoded in the video. The reason for encoding the position of the head is to ensure in subsequent video analysis that the head (rather than the tail) is always identified accurately. We have found that occasionally when reversing, the curvature of the tail is similar to the head and can thus be erroneously labeled as the head if automated identification is used. Complete Video Analysis software. This analysis program uses the videos obtained in ‘Color Illumination and Tracking’ that were encoded with the position of the head in ‘Head Encode’ and extracts a number of detailed parameters. The options within this program are the threshold values for defining the animal, a conversion factor (micrometers per pixel) for converting camera pixel measurements into micrometers and the number of equal segments into which the Relative intensity 80 Figure 3 | Modifications of the 3-LCD projector to limit the spectral width of the RGB colors. (a) Internal filters are added to the 3-LCD projector, thus narrowing the band pass for each RGB color. (b) Action spectra for the optogenetic reagents channelrhodopsin-2 (ChR2) and MAC. (c) Measured spectra for the red, green and blue color planes before and after addition of the internal filters. Panels a and c are adapted from ref. 12. The spectra are adapted from refs. 2 and 3. UHB, ultra-high-pressure bulb; LP, long pass; SP, short pass. 700 Wavelength (nm) 60 40 20 0 400 450 500 550 600 Wavelength (nm) 650 700 worm’s backbone spline is to be divided. The output parameters are saved to a text file and are described as follows: • Velocity. By using the previous and current position of the motorized stage, the position of the animal within the field of view and the calibration of the camera (micrometers per pixel), the velocity of the animal is calculated. • Two-point angles. The angle between two successive points is determined relative to 90° and normalized such that the expectation value of all angles is equal to zero40. • Three-point angles. Similar to the two-point angles, except that the angle is determined between three successive points and is relative to 180°. • Average angles. For both the previous angles measured, the average of the absolute value of all the angles determined along the worm is found. This gives some indication of the overall amount of bending of the worm. • Length. Measurements of the length of the worm are made in micrometers using the user input conversion factor. • Head-to-tail distance. The straight-line distance from the worm’s head to tail is made. MATERIALS REAGENTS • Experimental C. elegans with suitable expression of optogenetic reagents ! CAUTION All animal experiments must comply with relevant institutional and governmental animal care guidelines. • Blank (unseeded) nematode growth medium41 (NGM) plates EQUIPMENT General equipment • Inverted fluorescence microscope (infinity corrected or 160 mm) • Motorized microscope X-Y stage (optional for moving samples) • Stage insert for microscope stage capable of holding a 6-cm Petri dish • Illustration program (Microsoft PowerPoint); alternatively, use LabVIEW with vision, MATLAB with image-processing toolbox or custom software12. • Computer capable of dual video output (Intel i3 1.6 GHz processor with 3 GB RAM or better) • Stage micrometer calibration slide (Amscope, cat. no. MR100) • Camera (AVT Guppy F-033, Edmund Optics, or similar) • Support lab jack (10 ×10 inches; VWR, cat. no. 14233-368) • High-temperature epoxy • Electrical tape nature protocols | VOL.7 NO.2 | 2012 | 211 protocol Microscope optics • Dichroic mirror (Semrock, cat. no. FF662-FDi01-25×36) • Emission filter (Thorlabs, cat. no. FB650-40) • Bright-field filter (Edmund Optics, cat. no. NT66-096) • ATL (for infinity-corrected microscope; 1 inch mounted achromatic doublet, Thorlabs, cat. no. AC254 series—match focal length closely with microscope tube length: Leica, 200 mm; Nikon, 200 mm; Olympus, 180 mm; and Zeiss, 165 mm) • RLP (for 160-mm fixed–tube-length microscope; Achromatic Doublet Pair, Thorlabs, cat. no. MAP10100100-A) • Low-magnification objective (×4 to ×10) for whole animal imaging Equipment for projector modification • High-brightness and high-contrast LCD projector (Hitachi, cat. no. CP-X605 or similar) • Custom filters for insertion internal to the projector (Supplementary Table 1) • Anti-static mat (Desco, cat. no. 45010) © 2012 Nature America, Inc. All rights reserved. PROCEDURE Modification of the LCD projector ● TIMING ~2.5 h ! CAUTION All steps in this section should be performed with the projector unplugged and after at least 30 min if the projector was previously switched on, as the bulb can be very hot. It is also suggested that one should work on an anti-static mat. 1| Begin by removing the frame around the projector lens in order to remove the lens. For the Hitachi CP-X605, there are two screws on the bottom of the frame, and two additional screws that can be found by opening the lens shift cover on the top of the case that must be unscrewed. After removing the frame, remove the entire zoom lens by pressing up on the lens release latch (Fig. 4a) and twisting the lens counterclockwise. Carefully set the lens aside. CRITICAL STEP Be careful when handling the projector lens to ensure that it is not damaged or scratched; it will be used later. CRITICAL STEP For some projectors, the lens assembly cannot be removed. For those projectors, this step can be omitted. 2| Remove the screws on the back of the projector case so that the internal circuit boards can be removed later. There are ten such screws on the back of the Hitachi CP-X605 projector that should be removed. 3| Locate and remove the screws on the bottom of the projector; these screws connect the main body and the top of the projector case. The Hitachi CP-X605 has nine screws on the bottom of the projector (Fig. 4b) holding the case together. Remove the screws and save them for later reassembly. 4| Return the projector to the upright position. Carefully begin to lift off the top portion of the case. Angle the cover back and look inside to locate connector cables connecting the top control panel to the main circuit board (two cables for the Hitachi CP-X605). Disconnect these cables from the main unit (Fig. 4c). The case cover can now be completely removed and set aside. ? TROUBLESHOOTING 5| The topmost metal casing is the LAN board. Disconnect the large set of blue wires connecting the LAN board to the main circuit board. Locate the four screws holding the LAN board down and unscrew. There is also a black grounding wire connected to the left side of the LAN board that should be disconnected. The LAN board can now be carefully removed and set aside (Fig. 4d). CRITICAL STEP We suggest that a photograph of the projector and the location of the wires be obtained before disconnecting in order to facilitate accurate reassembly later. 6| You will now be able to see all the wires connecting to the main board as well as the three LCD panel connections (Fig. 4e). Disconnect all wires, taking note of where the wires were connected. Unlatch the LCD panel cable connector and slide out the LCD panel cable from the main board (Fig. 4f). There are three screws on the right side of the main board that need to be removed, as well as an additional one at the back left of the metal bracket connected to the main board. CRITICAL STEP We suggest that a photograph of the projector and the location of the wires be obtained before disconnecting in order to facilitate accurate reassembly later. 7| Remove the screws on the cover of the dynamic iris (Fig. 4g). Remove the cover and then slide out the dynamic iris unit. Disconnect the green grounding wire. 8| The cover of the main optical train of the projector must now be removed. The Hitachi CP-X605 has four screws holding down the cover (Fig. 4h) that is to be removed, as well as two plastic brackets (Fig. 4h) that can be unlatched with a flathead screwdriver or spatula. Remove the cover. CRITICAL STEP Connected to the optical train cover (removed in this step) are three polarizing filters (Fig. 4i) that are positioned directly in front of the LCD panel when the cover is in place. Care should be taken not to damage these filters. These filters have also been aligned at the factory (rotationally) to maximize the contrast of the projector. These filters should not be rotated or altered. 212 | VOL.7 NO.2 | 2012 | nature protocols protocol a b c d © 2012 Nature America, Inc. All rights reserved. LAN board e f g h i j k l Figure 4 | Disassembly and insertion of custom optics into the 3-LCD projector. (a) Removal of the projection/zoom lens system. (b) Removal of the screws connecting the top of the projector case to the main body. (c) Disconnecting the top control panel to remove projector case cover. (d) Removal of the LAN board. (e) Disconnecting wires and screws connecting the main board. (f) Disconnecting LCD panel cables. (g) Removal of the dynamic iris. (h) Removal of the cover of the main optical RGB path. (i) Cover showing the polarizing filters. (j) RGB optical paths. (k) Optical path after insertion of optical filters; colored boxes show locations for red, green and blue filter insertion. (l) Removal of the diverging projection lens from the zoom lens system. 9| The internal optical path can now be seen; the left path is for red, the middle for green and the right for blue (Fig. 4j). Locations of the insertion of the custom filters (Supplementary Note 2) are indicated with boxes in Figure 4k. Insert the precut optical filters (dimensions for filters for the Hitachi CP-X605 can be found in Supplementary Table 1) into the appropriate locations. The filters should be secured to the case with high-temperature epoxy. Alternatively, the filters can be temporarily secured from the top side with electrical tape. CRITICAL STEP All optical components should be handled with care. ? TROUBLESHOOTING 10| Once the filters have been successfully placed and secured (Fig. 4k), the projector can be reassembled by reversing Steps 4–9. CRITICAL STEP For the projector to function correctly, all cables must be reattached in the original position; otherwise, an error will occur when powering on the projector, and the projector can potentially be damaged. Refer to the photographs acquired in the previous steps for accurate reassembly. 11| To remove the projection lens from the lens assembly, remove the screws attached to the zoom ring (four screws for the Hitachi CP-X605). CRITICAL STEP For those projectors in which the lens assembly cannot be removed, the projection lens can simply be removed by completely unscrewing counterclockwise. 12| Slide the zoom ring back as far as possible and rotate to see the small inner screws (Fig. 4l). These are stops for the projection focus lens, preventing it from being fully unscrewed. Loosen these screws until the diverging projection lens can be fully rotated counterclockwise and off the zoom lens assembly. nature protocols | VOL.7 NO.2 | 2012 | 213 protocol 13| Reattach the zoom ring. The zoom lens should now be reinserted into the projector by lining up the notches and rotating clockwise until a click is heard. CRITICAL STEP The projection lens portion of the zoom lens assembly must be removed for optimal performance. However, the diverging projection lens can be reinserted to use the projector in its original function (magnify and project an image). Adjustment of the projector settings ● TIMING ~0.25 h 14| Reinsert the projection lens. Turn on the projector and focus on a wall or a screen. ? TROUBLESHOOTING 15| The settings of the projector must be set to ensure optimal performance. Follow the manufacturer’s user’s manual instructions and set as follows: all keystone settings should be zero offset; brightness, contrast, color and tint should be set to the middle position (usually default; + 0 on the Hitachi CP-X605); and the active iris should be turned off. 16| Adjust the vertical and horizontal lens shift setting to a neutral (zero offset) position by following the manufacturer’s user’s manual instructions. © 2012 Nature America, Inc. All rights reserved. 17| Remove the projection lens by unscrewing it counterclockwise. Assembly of the projector and microscope system ● TIMING ~3 h 18| These steps describe the process for modification of an inverted microscope and integration of the projector into the system. Either an infinity-corrected microscope (A) or a 160-mm fixed-tube-length microscope (B) can be used for these steps. (A) Assembly of projector and microscope system (infinity corrected) (i) Remove the epifluorescence optical train from the inverted fluorescence microscope. Follow the manufacturer’s user’s manual for schematics and description. CRITICAL STEP All optical components should be handled with care. Save all optical components, noting the locations from which they came for later reassembly if necessary. (ii) Place the ATL in the epifluorescence optical path near the filter cube, centering it along the optical axis. (iii) Remove the transmitted light optical filter. With the filter cube in place (with the dichroic and emission filters but without the excitation filter, as it has been inserted internally in the projector), place the stage micrometer calibration slide on the microscope stage and bring the slide into focus. (iv) Turn up the transmitted light intensity. By using a piece of paper, find the position along the epifluorescence optical path where the image of the micrometer comes into sharp focus. This should be at the back focal plane of the ATL. (v) Place the projector such that the primary projector image coincides with the location of the focal plane of the ATL determined in step 18A(iv) (Fig. 1c). ? TROUBLESHOOTING (B) Assembly of the projector and microscope system (160 mm) (i) Remove the epifluorescence optical train from the inverted fluorescence microscope. Follow the manufacturer’s user’s manual for schematics and description. CRITICAL STEP All optical components should be handled with care. Save all optical components, noting the locations from where they came for later reassembly if necessary. (ii) Remove the transmitted light optical filter. With the filter cube in place (with the dichroic and emission filters but without the excitation filter), place the stage micrometer calibration slide on the microscope stage and bring the slide into focus. (iii) Turn up the transmitted light intensity. Use a piece of paper to find the position along the epifluorescence optical path where the image of the micrometer comes into sharp focus. This will be at the back focal plane of the objective, located 160 mm from the nosepiece opening. This will be the location IP160 mm in Figure 1d. (iv) Place the RLP such that the edge of the lens housing is 92 mm (the working distance of the lens pair) from the position found in the previous step. This will position the back focal plane of the lens pair at the back focal plane of the objective (Fig. 1d). (v) Place the projector such that the primary projector image is 92 mm from the front edge of the lens tube pair. This will place the primary projector image at the FFL of the lens pair (Fig. 1c). ? TROUBLESHOOTING 214 | VOL.7 NO.2 | 2012 | nature protocols protocol Computer setup and system alignment ● TIMING ~1 h 19| With the projector connected to the computer, adjust the display settings in order to have dual display capabilities, extending the desktop onto the second monitor (projector), not cloning the primary monitor. The projector should be configured as the secondary monitor and should be set to use the full resolution of the projector (Hitachi CP-X605 – 1,024 × 768). The desktop should also be set to use a solid black background, thus not projecting any unwanted images to the sample. 20| Place a piece of fluorescent paper or slide glass on the microscope stage and bring it into focus through the eyepieces or camera. © 2012 Nature America, Inc. All rights reserved. 21| With the projector turned on, bring up an image on the ‘second monitor’ (projector) from the computer. A checkerboard pattern will work well for this step. Without adjusting the focus of the microscope, bring the pattern into focus on the paper by adjusting the position of the projector and lens. Gross adjustments can be made by observing the pattern on the paper by eye. ? TROUBLESHOOTING 22| To make fine adjustments in the projector position and focus, begin by placing a highly reflective material on the microscope stage; this can be a front-coated silver mirror. A blank NGM plate also works well for this purpose. Bring the front surface of the reflective material into focus by focusing the microscope on an imperfection or dust on the surface. 23| With the projector on and projecting an image, make further adjustments of the X, Y and Z positions of the projector and lens system to bring the projected image into sharp focus. These positions should be noted and the lens and projector system can be fixed. CRITICAL STEP This is a crucial step to ensure that the projected image is focused on the sample of interest. When the sample of interest is focused through the microscope, the projector image will be demagnified and focused on the sample. If the system is not moved, these focusing steps need not be repeated, although we suggest that this be done once in a while (weekly) in order to ensure proper alignment. Small offsets in the axial location of the lens and projector from the ideal locations (Fig. 1c,d) will make only slight alterations in the amount of demagnification. Example applications: methods of illumination control 24| These steps provide three different approaches for performing targeted illumination with the constructed system: option A is suitable for rapid evaluation, single-point white illumination and human feedback; option B is suitable for multicolor static pattern generation or predefined pattern generation and projection with no feedback; and option C uses custom software12 for real-time automated illumination of samples that may vary in space and time. (A) Simple illumination using a mouse pointer ● TIMING ~0.10 h (i) Place the sample on the microscope and bring it into focus. (ii) Move the mouse cursor from the primary monitor to the secondary monitor (projector). A small point of light moving in the area of the sample will be observed as the mouse is translocated. The mouse can be placed over the intended target area by observing through the eyepieces or camera. In this way, one can rapidly evaluate the constructed illumination system, as well as qualitatively assess the reaction of the sample. (B) Static or predefined dynamic illumination using Microsoft PowerPoint ● TIMING ~0.25 h (i) Create a new presentation in Microsoft PowerPoint. Set the background of the slides to solid fill with black as the color. (ii) Draw the desired geometrical shape. Set the RGB color of the object by right-clicking the object, select ‘Format shape…’ and then select ‘Solid Fill’ under the ‘Fill’ tab. Under ‘Color’, select ‘More colors…’ and the ‘Custom’ tab. In this window, the specific values for the Red, Green and Blue intensities can be set. For example, Zhang et al. used a ring of blue light (B = 255; G = 0; R = 0) to confine D. melanogaster larvae expressing ChR2 in nociceptive neurons18. (iii) To create a time-series sequence of patterns, create patterns for each time point and use the ‘Custom Animations’ option to determine the transition times. (iv) Place the sample on the microscope and bring it into focus. (v) To project the created objects or animations, set the presentation to display on the secondary monitor and begin the slide show. (C) Selected area illumination of C. elegans using custom software ● TIMING ~0.25 h (i) Open the ‘Beamer Alignment’ program and start it with the play button (see ref. 12) CRITICAL STEP These steps describe the use of the custom software written for our specific camera and motorized stage. To adapt it to other cameras and stages, a few alterations must be made to the software. These are discussed in more detail in the supporting documentation of the software12. nature protocols | VOL.7 NO.2 | 2012 | 215 © 2012 Nature America, Inc. All rights reserved. protocol CRITICAL STEP Step 24C(i–iv) is a crucial calibration step that must be performed before using the main program. Inaccurate alignment and calibration could cause mislocalized illumination. This step must be performed on a regular basis (e.g., daily) in order to ensure accurate calibration of the system. ? TROUBLESHOOTING (ii) Place a highly reflective material on the microscope stage; this can be a front-coated silver mirror or a blank NGM plate. Bring the front surface of the reflective material into focus by focusing the microscope on an imperfection or dust on the surface. (iii) A window will open on the secondary monitor (projector), displaying a cross pattern. Adjust the location of the projector such that the cross pattern is located roughly in the center of the field of view of the microscope. (iv) Adjust the rotation of the camera such that the cross-patterned lines are perfectly horizontal and vertical. There are alignment marks on the image display to aid in this step. (v) Repeat Steps 24C(ii,iii) until the cross pattern is centered and is horizontal/vertical. (vi) Press ‘Continue’ to initiate calibration. At this step, a sequence of 20 solid circles will be projected and the corresponding location will be recorded. The calibration parameters for translation from camera coordinates to projector coordinates will be saved. (vii) Pick a worm and place it onto a blank 6-cm NGM plate. (viii) Allow the worm to freely crawl for ~25 min on the plate in order to allow it to recover from the mechanical disturbance of picking and adjust to the lack of food42. (ix) Open the main program, ‘Color Illumination and Tracking’, and start it with the play button. ? TROUBLESHOOTING (x) Select the location and name of the video to be saved when prompted. (xi) With the transmitted light filter in place and the transmitted light turned on, invert the plate and place it on the custom microscope stage. Locate the worm and center it within the field of view and bring it into focus. (xii) Adjust the bright-field illumination intensity such that the binary image is an accurate representation of the worm (Fig. 2c). (xiii) With the worm in the center of the field of view, select the ‘TRACK’ button to begin automated tracking of the animal. (xiv) In the upper right of the program interface, there is a block labeled ‘Illumination Control’. In this block, the number of segments and location of the segment divisions should be set (Fig. 2d,e). In addition, within this block, set the values (0–255) of the individual red, green and blue lights, and select (turn on) the segments to illuminate. Finally, set the timing to ‘Timed’ and adjust the illumination duration, or alternatively set to ‘Untimed’. These settings can be adjusted with the slide bar set to ‘Simple’. More complicated illumination patterns can be set with the ‘Scheduled’ option (see ‘Read Me—Program Overview’ in supplementary software from ref. 12). (xv) To begin the segmentation (Fig. 2d), select the ‘Thin and Segment’ option. The small white dot in the ‘Backbone’ display should be located at the animal’s head. If this is incorrect, press the ‘Flip HT’ button. (xvi) With the options set as desired, begin the video recording with the ‘Record?’ button. (xvii) Begin the illumination by clicking ‘Illuminate!’. (xviii) When completed, stop the video acquisition to save the movie and enter the name for the next video when prompted. (xix) Stop the program with ‘Complete Stop’. (xx) To implement ‘Head Encode’ on the saved video, open the ‘Head Encode’ program and start it with the play button. (xxi) Place the mouse cursor over the head of the animal and press the ‘Enter’ button on the keyboard. Follow the position of the head with the cursor as the video is played. The encoded video will automatically be saved with the name of the original file plus ‘-HE’. (xxii) To analyze the completed video, open the ‘Complete Video Analysis’ program. (xxiii) Enter the calibration value for micrometers per pixel (at full resolution) and select the binning of the camera used. For the data obtained12, we measured 3.3 µm per pixel and used a 2 × 2 binning, thus providing a calibration of 6.6 µm per pixel for our recorded videos. (xxiv) Start the program with the play button. (xxv) When prompted, select the video(s) (‘*-HE.avi’) to be analyzed. The data based on the video will be saved to a text file with the extension ‘*-data.txt’. The data order of the columns is time, illumination, level, length of animal, velocity, average 2-pt angles, number of 2-pt angles, 2-pt angles, average 3-pt angles, number of 3-pt angles, 3-pt angles and head-to-tail distance. ? TROUBLESHOOTING Troubleshooting advice can be found in Table 1. 216 | VOL.7 NO.2 | 2012 | nature protocols protocol © 2012 Nature America, Inc. All rights reserved. Table 1 | Troubleshooting table. Step Problem Possible reason Solution 4 Case cover will not slide off Not all screws have been removed Check both the back and the bottom of the projector to ensure all necessary screws have been removed 9 Filters will not fit Improperly sized filter Measure the opening at the location for the filters and check dimensions of the custom filters. Alter the filters as necessary to fit 14 Projector will not turn on Internal disconnected cables If all cables were not correctly connected when reassembling the projector, then unit will not power up. Take the projector apart and ensure that all cables are connected Other errors associated with the projector Check error blinking codes and consult the user’s manual for solutions Dim image Bulb is near the end of its life Check the projector for bulb hours and refer to the user’s manual on replacing Color is missing/absent Disconnected LCD panel cable Disassemble the projector to ensure that LCD panel cables have been securely reattached Shifted or broken filter Disassemble the projector and check all inserted filters if they have shifted or possibly broken. Replace if necessary Color or image is striped Unsecured/loose LCD panel cable Disassemble the projector to ensure that LCD panel cables have been securely reattached 18A(v) Insufficient space to position the projector Accessory tube lens focal plane located within the body of the microscope Extend the accessory tube lens to the rear of the microscope, allowing the focal plane to be located outside the body of the microscope 18B(v) Insufficient space to position the projector Relay lens focal plane located within the body of the microscope Select a matched lens pair of greater focal length 21 Image never focuses Incorrectly positioned lenses Check that all lenses are located as described in Figure 1 24C(i), 24C(ix) Program gives error upon starting Different camera from what the program was written for Alter the LabVIEW code to communicate with the specific camera used. See also supporting documentation of reference 12 Different motorized stage from Alter the LabVIEW code to communicate with the specific what the program was written for stage used. See also supporting documentation of reference 12 ● TIMING Steps 1–13, Modification of the LCD projector: 2.5 h Steps 14–17, Adjustment of the projector settings: 0.25 h Step 18A, Assembly of the projector and microscope for infinity-corrected microscope: 3 h Step 18B, Assembly of the projector and microscope for a 160- mm microscope: 3 h Steps 19–23, System alignment: 1 h Step 24A, Simple illumination using a mouse pointer: 0.10 h Step 24B, Static or predefined dynamic illumination using Microsoft PowerPoint: 0.25 h Step 24C, Selected area illumination of C. elegans using custom software: 0.25 h nature protocols | VOL.7 NO.2 | 2012 | 217 protocol © 2012 Nature America, Inc. All rights reserved. 100 b Blue Green Red 80 Relative intensity Relative intensity a 60 40 20 50 100 150 Pixel value (8 bit) 200 175 150 125 100 75 Ideal Measured 200 0.8 0.6 0.4 0 –100 250 d Measured spot size (µm) (width at 10% max intensity) 0 c Measured Ideal 1.0 0.2 0 Measured spot size (µm) (width at 10% max intensity) Figure 5 | Characterization of the completed illumination system. (a) Relative intensity as a function of color pixel value (0–255) for each RBG color plane. (b) Ideal (59.6 µm) and measured (68.5 µm) width of a defined projection pattern using a ×4 objective. This demonstrates spatial spread in illumination as a result of the contrast transfer function of optical components. Width was measured at the point where the intensity drops to 10% of the maximum value. (c) Measured spot size using a ×4 objective. This shows a resolution limit of ~14 µm at ×4. (d) Measured spot size using a ×25 objective. This shows a resolution limit of ~5 µm at ×25. Adapted from reference 12. 35 30 –50 0 50 Position (µm) 100 Ideal Measured 25 20 15 10 50 ANTICIPATED RESULTS 5 25 Characterization of the illumination 0 0 system 0 25 50 75 100 125 150 175 200 0 5 10 15 20 25 30 Projected spot size (µm) Projected spot size (µm) After insertion of the internal filters in the 3-LCD projector, the spectrum of the three-color planes (red, green, blue) are spectrally restricted (Fig. 3c) on the basis of the specifications of the filters (Supplementary Table 1) as measured using a spectrometer (CCS100, Thorlabs). The narrow bandwidth of the spectrum allows for sufficient separation of wavelength to excite distinct optogenetic reagents. These results are expected on the basis of the band-pass values of the filters. If other filters are chosen, the modified spectra should reflect those filter specifications. Note that the modification of the individual color spectra can only further narrow the individual color spectra; it cannot extend the limits of the color spectrum, as they are determined by the dichroic mirrors within the projector’s optical train, which are not modified in this protocol. Each pixel element is defined by an 8-bit integer (0–255) for each color, and thus defines the relative intensity at that location (Fig. 5a). The contrast ratio for each color was determined by the ratio of full-on (pixels set to 255 for that color; Fig. 5a) to full-off (zero pixel value; Fig. 5a) and, for the modified Hitachi CP-X605 projector, the ratios are as follows: red = 896:1; green = 463:1; and blue = 605:1. Ratios were measured using a power meter (PM100D, Thorlabs). These values are less than the manufacturer’s stated contrast ratio of 1,000:1 as a result of the modifications performed on the projector. The contrast ratio is an important feature of the system as it determines the background light intensity and should be as low as possible in order to avoid causing any undesired stimulation. Therefore, we suggest choosing a projector with a high initial (i.e., manufacturer’s stated value) contrast ratio ( >500:1) and carefully measuring these values before and after modifications are performed. The main source of significant decreases (i.e., greater than a twofold decrease) in contrast ratios after modifications are performed might be the slight incidental rotational misalignment in the polarizing filters occurring in PROCEDURE Step 8. Should this be the case, these filters can be slightly adjusted, the projector reassembled and contrast ratios remeasured; however, this is a time-consuming process and care should be taken to avoid initial misalignment. The contrast transfer function of the projector and microscope optics will spread the area of illumination over a larger area. The effects of such spreading can be measured by defining a spot of known size, projecting it through the illumination system and then measuring the width of the illumination where the intensity falls to 10% of the maximum value. In this manner, a resolution limit can be defined: the smallest spot size that can be reliably defined. By recording these measurements for this system (Fig. 5b–d)12, we find a limit of 14 µm using a ×4 objective and 5 µm using a ×25 objective. The measured spatial resolution of the system is typical for the selected objective and projector. Should another projector be used, the main feature of the projector that could alter this value is the size of the LCD panels (0.79 inches for the Hitachi CP-X605). If the resolution of the system is much lower than expected, the most likely source of error is the axial focus of the projector. The projector must be focused at the sample plane (PROCEDURE Steps 21–23) to ensure a high spatial resolution. This is increasingly crucial as the magnification and numerical aperture of the objective increases. By using the custom software for automated illumination of C. elegans, the temporal accuracy was measured and was found to be ~70 ms for the projector alone and ~111 ms for the complete system (Supplementary Fig. 1 and Supplementary Note 1). Selected area illumination of C. elegans To demonstrate the capabilities of the system for dynamic illumination of a sample, a few experiments were conducted on C. elegans specimens expressing optogenetic reagents. The first experiment shows dynamic control of an illumination pattern 218 | VOL.7 NO.2 | 2012 | nature protocols © 2012 Nature America, Inc. All rights reserved. protocol Figure 6 | Example application: selected a area illumination of C. elegans. (a) Frames from supplementary video 2 of reference 12 demonstrating direct muscle control of a paralyzed animal using patterned light. (b) Sequential frames from supplementary video 3 of reference 12 showing b a bar of light passing over the worm from the posterior to the anterior region as the animal is freely crawling. Initially, the worm is traveling forward; however, when the light reaches the anterior mechanosensory neurons expressing c ChR2 (middle frame), the worm quickly reverses direction. (c) Sequential frames from supplementary video 8 of reference 12 showing the multispectral dynamic capacity of the illumination system. The worm is illuminated with blue light in the region of the anterior mechanosensory neurons, which express ChR2, thus eliciting a reversal. The worm is subsequently illuminated with green light in the region of the command interneurons, which express the hyperpolarizing MAC, thus halting the reversal. Scale bars, 250 µm. used for direct control of muscle contractions in a paralyzed worm. The worm strain (ZX299: lin-15(n765ts); zxEx22[pmyo-3:: ChR2(H134R)::YFP; lin-15 + ]) expresses ChR2 in the muscle cells; therefore, when illuminated with blue light the muscles will contract2. Animals are immobilized with ivermectin (0.01 mg ml−1 solution), which hyperpolarizes motor neurons but leaves muscles fully functional43. By dynamically altering the illumination pattern on the basis of the shape of the animal and optically activating muscle contraction, the animal can be optogenetically controlled (Fig. 6a and ref. 12, http://www. nature.com/nmeth/journal/v8/n2/extref/nmeth.1555-S3.mov). A second experiment demonstrates the ability to dynamically alter projection patterns at high resolution in a moving animal. Using animals expressing ChR2 in the gentle touch sensory neurons (AQ2334: lite-1(ce314); ljIs123[pmec-4::ChR2; punc-122::RFP]), a bar of light was scanned along the body of the animal while it crawls freely. When the illumination reaches either the anterior or posterior sensory neurons, the animal will reverse or accelerate, respectively (Fig. 6b and ref. 12, http://www.nature.com/nmeth/journal/v8/n2/extref/nmeth.1555S4.mov). A final demonstration uses the full capacity of the system for dynamic, multicolor illumination. A strain expressing excitatory ChR2 in the gentle touch sensory neurons and inhibitory MAC in the command interneurons (ZX899: lite-1(ce314); ljIs123[pmec-4::ChR2; punc-122::RFP]; zxEx621[pglr-1::MAC::mCherry; pelt-2::GFP]) was subjected to blue illumination (thus exciting ChR2) in the region containing the anterior sensory neurons, thus initiating a reversal, and it was subsequently illuminated with green light (exciting MAC), thus inhibiting signal transmission and halting the reversal (Fig. 6c and ref. 12, http://www.nature.com/nmeth/journal/v8/n2/extref/nmeth.1555-S9.mov). Acknowledgments We thank members of the Caenorhabditis Genetic Center, W. Schafer, Y. Tanizawa (Medical Research Council-Laboratory of Molecular Biology, Cambridge, UK) and E. Boyden (Massachusetts Institute of Technology) for reagents; the US National Institutes of Health (H.L.), the Alfred P. Sloan Foundation (H.L.), the Human Frontier Science Program Organization (S.J.H.), the Deutsche Forschungsgemeinschaft (grants GO1011/2-1, SFB807-P11, FOR1279-P1, EXC115/1) and the Schram Foundation (A.G.) for funding. We also thank J. Andrews and B. Parker in the Georgia Institute of Technology School of Chemical and Biomolecular Engineering machine shop and D. Woodyard in the glass shop. AUTHOR CONTRIBUTIONS J.N.S. designed and constructed the illumination system. J.N.S. and M.M.C. characterized the system. S.J.H. and A.G. contributed to reagents and provided valuable discussions. J.N.S., M.M.C., S.J.H., A.G. and H.L. designed the experiments. J.N.S. and H.L. prepared the manuscript. COMPETING FINANCIAL INTERESTS The authors declare no competing financial interests. Published online at http://www.natureprotocols.com/. Reprints and permissions information is available online at http://www.nature. com/reprints/index.html. 1. Nagel, G. et al. Channelrhodopsin-2, a directly light-gated cation-selective membrane channel. Proc. Natl. Acad. Sci. USA 100, 13940–13945 (2003). 2. Zhang, F. et al. Multimodal fast optical interrogation of neural circuitry. Nature 446, 633–639 (2007). 3. Chow, B.Y. et al. High-performance genetically targetable optical neural silencing by light-driven proton pumps. Nature 463, 98–102 (2010). 4. Papagiakoumou, E. et al. Scanless two-photon excitation of channelrhodopsin-2. Nat. Methods 7, 848–854 (2010). 5. Andrasfalvy, B.K., Zemelman, B.V., Tang, J.Y. & Vaziri, A. Two-photon single-cell optogenetic control of neuronal activity by sculpted light. Proc. Natl. Acad. Sci. USA 107, 11981–11986 (2010). 6. Nagel, G. et al. Light activation of channelrhodopsin-2 in excitable cells of Caenorhabditis elegans triggers rapid behavioral responses. Curr. Biol. 15, 2279–2284 (2005). 7. Liewald, J.F. et al. Optogenetic analysis of synaptic function. Nat. Methods 5, 895–902 (2008). 8. Mahoney, T. et al. Intestinal signaling to GABAergic neurons regulates a rhythmic behavior in Caenorhabditis elegans. Proc. Natl. Acad. Sci. USA 105, 16350–16355 (2008). 9. Liu, Q., Hollopeter, G. & Jorgensen, E. Graded synaptic transmission at the Caenorhabditis elegans neuromuscular junction. Proc. Natl. Acad. Sci. USA 106, 10823–10828 (2009). nature protocols | VOL.7 NO.2 | 2012 | 219 © 2012 Nature America, Inc. All rights reserved. protocol 10. Guo, Z.V., Hart, A.C. & Ramanathan, S. Optical interrogation of neural circuits in Caenorhabditis elegans. Nat. Methods 6, 891–896 (2009). 11. Stirman, J.N., Brauner, M., Gottschalk, A. & Lu, H. High-throughput study of synaptic transmission at the neuromuscular junction enabled by optogenetics and microfluidics. J. Neurosci. Methods 191, 90–93 (2010). 12. Stirman, J.N. et al. Real-time multimodal optical control of neurons and muscles in freely behaving Caenorhabditis elegans. Nat. Methods 8, 153–158 (2011). 13. Leifer, A.M., Fang-Yen, C., Gershow, M., Alkema, M.J. & Samuel, A.D.T. Optogenetic manipulation of neural activity in freely moving Caenorhabditis elegans. Nat. Methods 8, 147–152 (2011). 14. Schultheis, C., Liewald, J.F., Bamberg, E., Nagel, G. & Gottschalk, A. Optogenetic long-term manipulation of behavior and animal development. PLoS ONE 6, e18766 (2011). 15. Fiala, A. et al. Light-induced activation of neurons in Drosophila using channelrhodopsin-2. J. Neurogenet. 20, 115–116 (2006). 16. Schroll, C. et al. Light-induced activation of distinct modulatory neurons triggers appetitive or aversive learning in Drosophila larvae. Curr. Biol. 16, 1741–1747 (2006). 17. Suh, G.S.B. et al. Light activation of an innate olfactory avoidance response in Drosophila. Curr. Biol. 17, 905–908 (2007). 18. Zhang, W., Ge, W.P. & Wang, Z.R. A toolbox for light control of Drosophila behaviors through Channelrhodopsin 2-mediated photoactivation of targeted neurons. Eur. J. Neurosci. 26, 2405–2416 (2007). 19. Arrenberg, A.B., Del Bene, F. & Baier, H. Optical control of zebrafish behavior with halorhodopsin. Proc. Natl. Acad. Sci. USA 106, 17968–17973 (2009). 20. Douglass, A.D., Kraves, S., Deisseroth, K., Schier, A.F. & Engert, F. Escape behavior elicited by single, Channelrhodopsin-2-evoked spikes in zebrafish somatosensory neurons. Curr. Biol. 18, 1133–1137 (2008). 21. Arrenberg, A.B., Stainier, D.Y.R., Baier, H. & Huisken, J. Optogenetic control of cardiac function. Science 330, 971–974 (2010). 22. Schoonheim, P.J., Arrenberg, A.B., Del Bene, F. & Baier, H. Optogenetic localization and genetic perturbation of saccade-generating neurons in zebrafish. J. Neurosci. 30, 7111–7120 (2010). 23. Umeda, K., Shoji, W., Ishizuka, T. & Yawo, H. Transgenic zebrafish expressing an optimized channelrhodopsin variant under regulation of Gal4/UAS systems: optogenetic stimulation of Rohon-Beard neurons. J. Physiol. Sci. 60, S118 (2010). 24. Zhu, P.X. et al. Optogenetic dissection of neuronal circuits in zebrafish using viral gene transfer and the Tet system. Front. Neural Circuits 3, 21 (2009). 25. Arenkiel, B.R. et al. In vivo light-induced activation of neural circuitry in transgenic mice expressing channelrhodopsin-2. Neuron 54, 205–218 (2007). 220 | VOL.7 NO.2 | 2012 | nature protocols 26. Aravanis, A.M. et al. An optical neural interface: in vivo control of rodent motor cortex with integrated fiberoptic and optogenetic technology. J. Neural Eng. 4, S143–S156 (2007). 27. Ayling, O.G.S., Harrison, T.C., Boyd, J.D., Goroshkov, A. & Murphy, T.H. Automated light-based mapping of motor cortex by photoactivation of channelrhodopsin-2 transgenic mice. Nat. Methods 6, 219–224 (2009). 28. Cardin, J.A. et al. Targeted optogenetic stimulation and recording of neurons in vivo using cell-type-specific expression of Channelrhodopsin-2. Nat. Protoc. 5, 247–254 (2010). 29. Huber, D. et al. Sparse optical microstimulation in barrel cortex drives learned behaviour in freely moving mice. Nature 451, 61–64 (2008). 30. Wang, H. et al. High-speed mapping of synaptic connectivity using photostimulation in Channelrhodopsin-2 transgenic mice. Proc. Natl. Acad. Sci. USA 104, 8143–8148 (2007). 31. Macosko, E.Z. et al. A hub-and-spoke circuit drives pheromone attraction and social behaviour in C. elegans. Nature 458, 1171–1175 (2009). 32. Davis, M.W., Morton, J.J., Carroll, D. & Jorgensen, E.M. Gene activation using FLP recombinase in C. elegans. PLoS Genet. 4, e1000028 (2008). 33. Wang, S. et al. All optical interface for parallel, remote, and spatiotemporal control of neuronal activity. Nano Lett. 7, 3859–3863 (2007). 34. Grossman, N. et al. Multi-site optical excitation using ChR2 and micro-LED array. J. Neural Eng. 7, 16004 (2010). 35. Delica, S. & Blanca, C.M. Wide-field depth-sectioning fluorescence microscopy using projector-generated patterned illumination. Appl. Opt. 46, 7237–7243 (2007). 36. Itoga, K., Yamato, M., Kobayashi, J., Kikuchi, A. & Okano, T. Cell micropatterning using photopolymerization with a liquid crystal device commercial projector. Biomaterials 25, 2047–2053 (2004). 37. Gradinaru, V. et al. Targeting and readout strategies for fast optical neural control in vitro and in vivo. J. Neurosci. 27, 14231–14238 (2007). 38. Campagnola, L., Wang, H. & Zyka, M.J. Fiber-coupled light-emitting diode for localized photo stimulation of neurons expressing channelrhodopsin-2. J. Neurosci. Methods 169, 27–33 (2008). 39. Schoenenberger, P., Grunditz, A., Rose, T. & Oertner, T.G. Optimizing the spatial resolution of Channelrhodopsin-2 activation. Brain Cell Biol. 36, 119–127 (2008). 40. Stephens, G.J., Johnson-Kerner, B., Bialek, W. & Ryu, W.S. Dimensionality and dynamics in the behavior of C. elegans. PLoS Comput. Biol. 4, e1000028 (2008). 41. Brenner, S. Genetics of Caenorhabditis elegans. Genetics 77, 71–94 (1974). 42. Gray, J.M., Hill, J.J. & Bargmann, C.I. A circuit for navigation in Caenorhabditis elegans. Proc. Natl. Acad. Sci. USA 102, 3184–3191 (2005). 43. Holden-Dye, L. & Walker, R.J. Anthelmintic drugs. in WormBook (ed. The C. elegans Research Community) Published online, doi/10.1895/ wormbook.1.143.1 (02 November 2007).