1
ARTICLE IN PRESS
108
M. Lino da Silva / Journal of Quantitative Spectroscopy & Radiative Transfer 108 (2007) 106–125
yet accurate spectral database of line-by-line transitions [1], but also regarding the convolution of this line
database with its adequate lineshapes, followed by the superposition of different continua.
Here, we will present a method to enhance the efficiency of line-by-line calculations, in order to achieve
three main goals:
(a) fast calculations over the whole spectral range;
(b) reasonable spectral grid sizes;
(c) accuracy of the simulated spectra.
The method has been devised as being fully parametrical, so as to allow potential users to decide which of the
issues (a), (b) or (c) are of the upmost importance for a particular problem, and adapt the routine to the
proposed needs. It will be shown that such improvements allow considering the line-by-line method as a
credible and accurate approach, accessible to modern-day computational tools.
2. A sample case-study: simulation of atmospheric entry radiative processes
As discussed in the previous section, the simulation of atmospheric entry radiative processes represents a
typical intricate case for radiative transfer calculations. Additionally to the large array of radiative processes
encountered behind a shock-wave, one has to cope with the presence of large gradients in the macroscopic
properties of the flow (temperature, species number densities, etc.). This means that numerical grids for
radiative transfer calculations have to account for a large number of spatial cells (102 2103 ). Such spatial grid
sizes, coupled to the large spectral grid of each spatial cell, means that the computational overheads of this
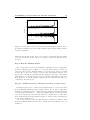
type of simulations may quickly become unaffordable. As an example of the typical spectra obtained in such
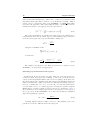
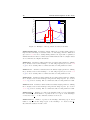
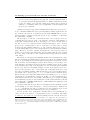
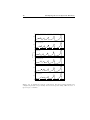
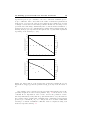
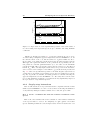
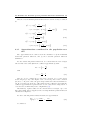
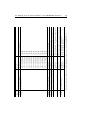
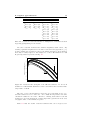
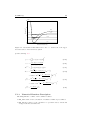
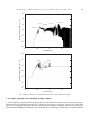
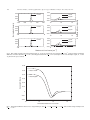
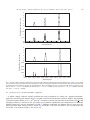
conditions, two sample calculations of the spectral emission of an atmospheric pressure 97% CO2–3% N2
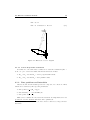
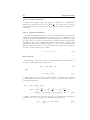
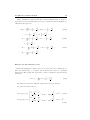
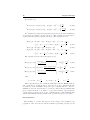
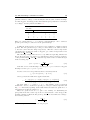
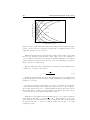
(Martian-type) mixture in thermochemical equilibrium at 5000 and 10,000 K are presented in Fig. 1.
Two aspects are immediately obvious when examining the calculated spectra. Firstly, the spectral features
differ sensibly depending on the plasma temperatures (and hence compositions as we are assuming chemical
equilibrium). Secondly, depending on the considered spectral range, radiative features may be abundant or
scarce. This means that any adequate spectral calculation must have sufficiently adaptive features to be able to
efficiently reproduce spectra as different as the ones presented in Fig. 1.
We may start by examining the problem boundaries: Spectral ranges to be considered for the simulation of
plasma radiation typically spread from 10 to 106 cm1 (or more for some continua). For the typical conditions
of an atmospheric entry, spectral lineshapes have widths of about 0:5 cm1 . At least three points are required
for resolving a line peak, which means that considering a fixed-width grid would amount to at least 6 106
spectral points, or more if the Voigt lineshapes are to be correctly reproduced. Given the current state-of-theart computational capabilities, handling this type of grid sizes remains out of reach. Fixed-width methods are
therefore limited to the simulation of restricted spectral regions which encompass the most paramount
radiative features of the flow. One such example which can be presented is the recent entry of the Huygens
probe in Titan’s atmosphere. Here the radiation from the CN Violet system accounted for the almost overall
radiative power of the plasma surrounding the probe. This has allowed utilizing fixed-width spectral grids for
coupled calculations [4–7]. Nevertheless, nonuniform spectral grid approaches have been proposed in the past,
considering a frequency division based on the equivalent widths of individual lines [8,9]. These are not known
to have been extensively utilized in practical applications.
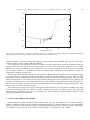
However, as can be seen in Fig. 1, one can take advantage of the fact that some spectral regions lack
significant radiative features. Thus, one can define an adaptive grid which would be defined as to be tighter in
spectral regions with a large number of lines, and more relaxed in regions with lesser lines. Also, to further
attain the most compact grids, means of calculating accurate lineshapes with a minimal number of points have
to be devised. Point (a) derives from point (b) in the sense that the methods utilized to calculate global spectral
profiles over such grids must be computationally efficient, thus requiring a minimum number of function
evaluations. Finally, the spectra computed over such adaptive grids must prove to follow closely highresolution spectra, which would enforce point (c).