1
Chapter 14 Worklife Probability Report
Chapter 14 Worklife Probability Report
This chapter describes your options for printing Worklife Probability reports. As with the
Case Summary and VALE reports, many of the items in the report simply copy your
input. The items that are calculated in some way are described below. To review
information pertaining to the calculations underlying this report, see Chapter 18 and
Chapter 19.
The reports in this chapter are for the same fictitious case regarding John Doe. The
example assumes that Mr. Doe is a high school graduate who was nondisabled prior to
the injury in question. As a result of injury, he is restricted to work of a sedentary to light
nature and has a worklife like that of an average not severely disabled male.
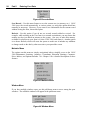
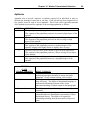
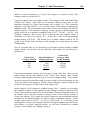
Through the options presented on the Report Options tab in the Print Dialog form (see
page 59), VALE 2000 allows you to print two different types of Worklife Probability
reports:
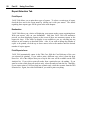
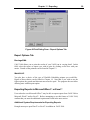
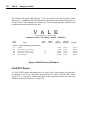
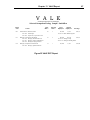
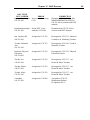
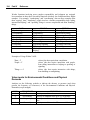
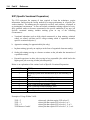
Report Type
Standard Report
Offset Report
Description
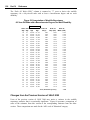
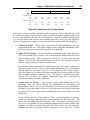
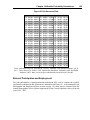
This option calculates both probable worklife and adjusted
earnings for every year. Choose this option if you wish to use a
net discount rate.
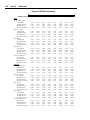
This option calculates only probable worklife for each year.
Lifetime earnings are calculated based on the total worklife
expectancy in combination with the earnings package. This
option is only available with a total offset.
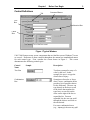
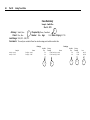
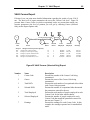
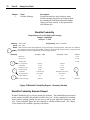
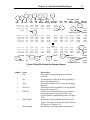
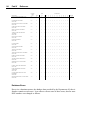
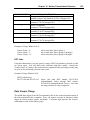
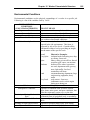
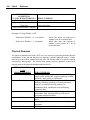
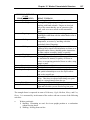
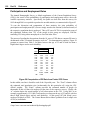
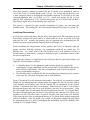
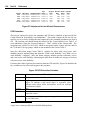
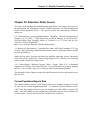
Regardless of the report type chosen, the top portion of the Worklife printout will be the
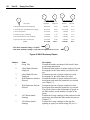
same, as presented in Figure 53.
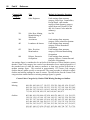
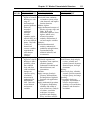
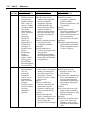
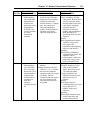
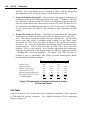
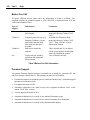
Number
1
Name
Notes
2
Current Wage Base
3
Future Worklife Value
4
Future Worklife Percent
Description
Notes created by the program which
summarize your analysis choices.
Presents the pre- injury and post- injury annual
earning capacity based on your scenario inputs.
Presents the pre- injury and post- injury
worklife expectancy as of the report date by
summing the individual Probable Worklife
figures (see next section).
Presents as a percentage the loss of worklife
expectancy from pre-injury to post- injury.
69