1
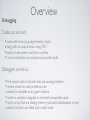
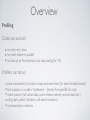
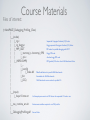
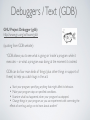
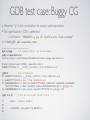
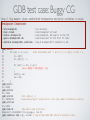
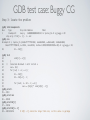
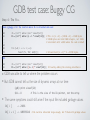
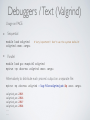
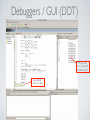
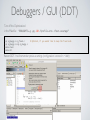
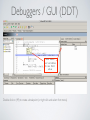
PACE
Debugging and Profiling Workshop
June 17, 2014
Mehmet (Memo) Belgin, PhD
Scientific Computing Consultant
Georgia Tech, OIT-ART, PACE
[email protected]
www.pace.gatech.edu
Debugging and Profiling Workshop
• A look at available debuggers and Profilers on PACE clusters (text/GUI)
• Debuggers - GDB
- Valgrind
- DDT
• Profilers
- Gprof/Gcov
- PAPI
- TAU
• Hands-on examples • Run “pace-register-classes” and pick this class in the list to register and copy
the class materials in ‘~/data/PACE_Debugging_Profiling_Class’ • This includes *everything* you need to follow/replay the tutorial
• Slides are designed to be self-contained (yes, they are crowded!)
Path: Boring → Interesting
Debuggers ➥ text
➥ GUI
➥ Profilers
➥ text
➥ GUI
Debugging
Overview
!
Codes can, and will:
• crash with errors (e.g. segmentation faults)
• hang with no output, w/wo using CPU
• work on one system and fail on another
• run to completion, but produce inaccurate results
!
Debuggers can tell us:
• the source code or libraries that are causing problems • where inside the code problems arise
• values for variables at any given instance • where a variable is assigned an incorrect/unexpected value
• which arrays that are leaking memory (allocation/deallocation errors)
• which functions are called and in what order
Overview
Profiling
!
Codes can, and will:
• run very, very slow
• run even slower in parallel
• run fast up to N processors, but stop scaling for >N
!
Profilers can tell us:
• time consumed by functions, loops and even lines (for each thread/process)
• the location of a code’s “bottleneck” (Pareto Principle: 80-20 rule) • event counts (instruction/data cache misses, memory access stalls, etc.)
• call graphs (which functions call which functions)
• communication matrices
Our Arsenal
(including, but not limited to...)
!
Debuggers
text-based:
GUI
:
GDB, valgrind
DDT
!
Profilers
text-based:
GUI
:
!
Gprof/Gcov, PAPI
TAU
Registration
Single-step Registration:
!
Run (case-sensitive!):
pace-register-classes
!
And pick this class from the list. This command:
!
• Includes your username/name/email in the registration list !
• Moves the course material (including codes, files and this presentation) to:
!
~/data/PACE_Debugging_Profiling_Class
!
• Registering for multiple times is OK, but overwrites this directory and
everything in it.
!
• Alternatively:
http://pace.gatech.edu/workshop/DebuggingProfiling.pdf
Course Materials
Files of interest:
!
(~/data/PACE_Debugging_Profiling_Class)
|
|__(codes)
|
|_ cg.c
Sequential Conjugate Gradient (CG) Solver
|
|_ cg_buggy.c
Buggy sequential Conjugate Gradient (CG) Solver
|
|_ MPI_DDT
MPI codes for parallel debugging with DDT |
|
|_ startmpi_c.c/startmpi_f.f90 Buggy MPI code
|
|
|_ cpi.c
Another buggy MPI code
|
|_ (NPB3.3-MPI)
MPI (parallel) CG solver from NAS Benchmark Suite
|
|_...
|
|_(config)
|
|
|_make.def Makefile definitions for parallel NAS Benchmarks
|
|_bin
Executables for NAS Benchmarks
|
|_(CG)
NAS Benchmark source codes for parallel CG
|
|
|__(input)
|
|_ bayer10.mtx.csr
An Example sparse matrix in CSR format for sequential CG solver runs
|
|__tau_runtime_env.sh
Environment variables required to run TAU profiler | |__DebuggingProfiling.pdf Course Slides
PART I
DEBUGGERS
Debuggers / Text (GDB)
GNU Project Debugger (gdb)
http://www.gnu.org/software/gdb/
!
(quoting from GDB website)
!
“GDB allows you to see what is going on ‘inside’ a program while it
executes -- or what a program was doing at the moment it crashed.
!
GDB can do four main kinds of things (plus other things in support of
these) to help you catch bugs in the act:
!
•
•
•
•
Start your program, specifying anything that might affect its behavior.
Make your program stop on specified conditions.
Examine what has happened, when your program has stopped.
Change things in your program, so you can experiment with correcting the
effects of one bug and go on to learn about another.”
GDB test case: Buggy CG
CG: Conjugate Gradient Solver
• An iterative Krylov Subspace solver • Requires positive definite sparse matrices
• Sparse matrix-vector multiply (SpMV) at each iteration
!
cg.c
: Source code “without” a bug
cg_buggy.c : Source code “with” a bug
!
Make:
!
!
$
$
$
$
$
cd ~/data/PaceWorkshop/codes
module purge
# remove all modules in your environment
module load gcc
# load required modules
make clean
# clean existing objects/executables etc.
make all
# make both executables: “cg” and “cg_buggy”
( ignore the “/usr/bin/ld:” warning, if any )
!
Test run:
!
$ ./cg_buggy bayer10.mtx.csr
Segmentation fault (core dumped)
PROBLEM!!
GDB test case: Buggy CG
• Requires “-g” in the compilation for source-code association
• No optimization (-O0) is preferred
in the Makefile:
• Initiate gdb:
“DEBUGOPTS=-g -pg -O0 -fprofile-arcs -ftest-coverage”
gdb <executable_name>
----------------------------------
$gdb cg_buggy
# no arguments/inputs, just the executable!
(gdb) run bayer10.mtx.csr Starting program: /nv/pf2/mbelgin3/PaceWorkshop/codes/cg_buggy bayer10.mtx.csr
!
Program received signal SIGSEGV, Segmentation fault.
0x00007ffff72c8122 in ____strtoll_l_internal () from /lib64/libc.so.6
!
(gdb) bt
# bt is “backtrace”
#0 0x00007ffff72c8122 in ____strtoll_l_internal () from /lib64/libc.so.6
#1 0x00007ffff72c4ec0 in atoi () from /lib64/libc.so.6
#2 0x000000000040124c in Sparse_CG (AA=0x7ffff7f62010, b=0x617240, x=0x624440, IA=0x60a040, JA=0x7ffff7f05010, n=13436, nnz=94926, delta=9.9999999999999995e-08) at cg_buggy.c:29
#3 0x0000000000401e37 in main (argc=2, argv=0x7fffffffdff8) at cg_buggy.c:182
!
(gdb) list 29 # list the source code ‘around’ line 29
...
27 double criteria, product;
28 29 int MAXITER = atoi(getenv("CG_MAXITER"));
30 ...
GDB test case: Buggy CG
Step 1: Pinpoint the problem (run, backtrace, list)
(gdb) show environment CG_MAXITER
Environment variable "CG_MAXITER" not defined. # we found the first problem!
(gdb) set environment CG_MAXITER 100
# environment variables can be manipulated inside the GDB
(gdb) run
# no need for input arguments if you are running again
The program being debugged has been started already.
Start it from the beginning? (y or n) y
!
Starting program: /nv/pf2/mbelgin3/PaceWorkshop/codes/cg_buggy bayer10.mtx.csr
!
Program received signal SIGSEGV, Segmentation fault.
# we found a second problem!
0x00000000004013e5 in Sparse_CG (AA=0x7ffff7f62010, b=0x60d4d0, x=0x61a6d0, IA=0x60a040, JA=0x7ffff7f05010, n=13436, nnz=94926, delta=9.9999999999999995e-08) at cg_buggy.c:53
53 sum += (AA[k] * oldx[JA[k] - 1]);
(gdb) bt
# backtrace
#0 Sparse_CG (AA=0x7ffff7f62010, b=0x60d4d0, x=0x61a6d0, IA=0x60a040, JA=0x7ffff7f05010, n=13436, nnz=94926, delta=9.9999999999999995e-08) at cg_buggy.c:53
#1 0x0000000000401e17 in main (argc=2, argv=0x7fffffffe128) at cg_buggy.c:182
(gdb) list 53
48 for (i=0; i < n; ++i) {
49 K1 = IA[i];
50 K2 = IA[i+1] - 1;
51 52
for (k=K1; k < K2 + 1; ++k) {
53 sum += (AA[k] * oldx[JA[k] - 1]);
54 }
55 oldr[i] = sum;
56 sum = 0.0;
57 }
GDB test case: Buggy CG
Step 2: Dig deeper: place conditional breakpoints and print variables in stack
Breakpoint Cheatsheet
•
•
•
•
•
info breakpoints
clear <line#>
disable <breakpoint#>
ignore <breakpoint#> <N>
condition <breakpoint#> <condition>
:
:
:
:
:
list existing
clear breakpoint at line#
skip breakpoint, but keep it in the list
skip break point for the first ‘N’ times
stop at breakpoint# if condition is met
(gdb) list 53
48 for (i=0; i < n; ++i) {
# The relationship with ‘i’ and ‘k’ is: i-> IA[i] -> K1,K2 -> k
49 K1 = IA[i];
50 K2 = IA[i+1] - 1;
51 52
for (k=K1; k < K2 + 1; ++k) {
53 sum += (AA[k] * oldx[JA[k] - 1]);
54 }
55 oldr[i] = sum;
56 sum = 0.0;
57 }
(gdb) print k
$1 = 95230
(gdb) print K1
$2 = 21655
(gdb) print K2
# K2 = IA[i+1] - 1
$3 = 1065353214
# Suspiciously High!!! Should not be > nnz! (nnz= number of nonzeros in matrix)
(gdb) print nnz
$4 = 94926
(gdb) break 49
# We want to stop at line 49...
Breakpoint 1 at 0x401343: file cg_buggy.c, line 49.
(gdb) condition 1 IA[i + 1] - 1 > nnz
# stop at bp#1 (@49) ONLY when this condition is met GDB test case: Buggy CG
Step 3: locate the problem
(gdb) info breakpoints
Num
Type
Disp Enb Address
What
1
breakpoint
keep y
0x0000000000401343 in Sparse_CG at cg_buggy.c:49
stop only if IA[i + 1] - 1 > nnz
(gdb) run
Breakpoint 1, Sparse_CG (AA=0x7ffff7f62010, b=0x60d4d0, x=0x61a6d0, IA=0x60a040, JA=0x7ffff7f05010, n=13436, nnz=94926, delta=9.9999999999999995e-08) at cg_buggy.c:49
49 K1 = IA[i];
!
(gdb) list
44 oldx[i] = x[i];
45 }
46 // Calculate Residual r with initial x
47 sum = 0.0;
48 for (i=0; i < n; ++i) {
49 K1 = IA[i];
50 K2 = IA[i+1] - 1;
51 52
for (k=K1; k < K2 + 1; ++k) {
53 sum += (AA[k] * oldx[JA[k] - 1]);
(gdb) print i
$5 = 3363
(gdb) print nnz
$6 = 94926
(gdb) print IA[i]
$7 = 21656
(gdb) print IA[i + 1]
$8 = 1065353216
# IA[i + 1] cannot be larger than nnz, so this value is garbage
GDB test case: Buggy CG
Step 4: The Fix.
Check cg_buggy.c for the location where IA is allocated and used:
!
160
161
...
...
164 169
170
JA = (int *) malloc (nnz * sizeof(int));
IA = (int *) malloc (n + 1 * sizeof(int));
for (i=0; i < n + 1; ++i)
fscanf (fn, "%d", &IA[i]);
# This is (n + 4) = (13436 + 4) = 13440 bytes
# 13440 bytes can hold 3360 integers, not 13436.
# consistent with i=3363 where the code crashed!
# IA must hold (n + 1) * 4 = 53748 bytes.
FIX:
!
160
161
JA = (int *) malloc (nnz * sizeof(int));
IA = (int *) malloc ((n + 1) * sizeof(int));
# Fixed by adding the missing parenthesis
• GDB was able to tell us where the problem occurs
• But: GDB cannot tell us the size of dynamic arrays at run time
(gdb) print sizeof(IA)
$11 = 8
•
# This is the size of the IA pointer, not the array.
The same symptoms could still arise if the input file included garbage values.
IA[ i ]
<- 21656
IA[ i + 1 ]
<- 1065353216
# IA could be allocated large enough, but filled with garbage values
There is more to GDB
• Watchpoints: Breakpoints on “variables”, instead of functions or lines.
•
•
•
•
watch <var>
rwatch <var>
swatch <var>
info breakpoints
:
:
:
:
Stop on
Stop on
Stop on
Listing
writes on <var>
reads on <var>
writes/reads on <var>
and manipulation of watchpoints !
• Other useful commands •
•
•
•
•
•
•
!
step : continue to next line
next : skip over the function
cont : run until the next breakpoint (or to completion is there is none)
print sizeof(var): returns the size of a variable whatis(var): returns type of the variable
ptype(var): similar to whatis(), but more detailed. E.g. shows structs
set var <var> = <value>: sets or replaces a variable at runtime
E.g.: (gdb) set var i = 5 • Running GDB in parallel • mpirun -np 4 xterm -e gdb your_mpi.exe
• Use GUI debuggers!
(well, good luck with that!)
Debuggers / Text (Valgrind)
Valgrind
http://valgrind.org/
!
•
•
•
•
•
A CPU simulator with hierarchical memory support.
All requests for memory allocation/deallocation are captured and
analyzed. Subtle errors that does not crash the code can also be identified.
Slow (up to 50x), so small test cases should be preferred.
Six different tools •
•
•
•
•
a memory error detector (default)
two thread error detectors a cache and branch-prediction profiler a call-graph generating cache branch-prediction profiler a heap profiler”
Debuggers / Text (Valgrind)
Usage on PACE:
•
Sequential
module load valgrind
# Very important!! Don’t use the system default!
valgrind <exe> <args> !
•
Parallel
module load gcc mvapich2 valgrind
mpirun -np <#cores> valgrind <exe> <args>
!
Alternatively, to distribute each process’ output on a separate file:
mpirun -np <#cores> valgrind --log-file=valgrind_out.%p <exe> <args>
!
valgrind_out.27025
valgrind_out.27026
valgrind_out.27027
valgrind_out.27028
...
...
Debuggers / Text (Valgrind)
valgrind output for the buggy CG run:
$ module load valgrind
$ export CG_MAXITER=100
$ valgrind ./cg_buggy ./bayer10.mtx.csr
...
...
==9428== Invalid write of size 4
==9428==
at 0x5625A20: _IO_vfscanf (in /lib64/libc-2.12.so)
==9428==
by 0x563354A: __isoc99_fscanf (in /lib64/libc-2.12.so)
==9428==
by 0x401D28: main (cg_buggy.c:170)
# The operation on line 170 is an invalid write
==9428== Address 0x5a22c60 is 0 bytes after a block of size 13,440 alloc'd # 13,440 / 4 = 3360 !!
==9428==
at 0x4C267BA: malloc (vg_replace_malloc.c:263)
==9428==
by 0x401BF2: main (cg_buggy.c:161)
# On the variable that was allocated on line 161
Buggy CG source code:
!
161
162
163
164
165
166
167
168
169
170
IA = (int *) malloc (n + 1 * sizeof(int));
b = (float *) malloc (n * sizeof(float));
x = (float *) malloc (n * sizeof(float));
for (i=0; i < nnz; ++i)
fscanf (fn, "%f", &a[i]);
for (i=0; i < nnz; ++i)
fscanf (fn, "%d", &JA[i]);
for (i=0; i < n + 1; ++i)
fscanf (fn, "%d", &IA[i]);
Debuggers / Text (Valgrind)
But wait... Looks like there is more, which GDB did not complain about !!
==23817== Invalid read of size 4
==23817==
at 0x4012E2: Sparse_CG (cg_buggy.c:53)
==23817==
by 0x401D33: main (cg_buggy.c:182)
==23817== Address 0x5528e7c is 4 bytes before a block of size 53,744 alloc'd
==23817==
at 0x4C267BA: malloc (vg_replace_malloc.c:263)
==23817==
by 0x401162: Sparse_CG (cg_buggy.c:31)
==23817==
by 0x401D33: main (cg_buggy.c:182)
==23817==
==23817== Invalid read of size 4
==23817==
at 0x4015A0: Sparse_CG (cg_buggy.c:83)
==23817==
by 0x401D33: main (cg_buggy.c:182)
==23817== Address 0x555050c is 4 bytes before a block of size 53,744 alloc'd
==23817==
at 0x4C267BA: malloc (vg_replace_malloc.c:263)
==23817==
by 0x4011AA: Sparse_CG (cg_buggy.c:34)
==23817==
by 0x401D33: main (cg_buggy.c:182)
30
31
32
33
...
...
51
52
53
54
!
...
oldx = (float *) malloc (n * sizeof(float));
r = (float *) malloc (n * sizeof(float));
oldr = (float *) malloc (n * sizeof(float));
for (k=K1; k < K2 + 1; ++k) {
sum += (AA[k] * oldx[JA[k] - 1]);
}
# 1-based / 0-based confusion
Debuggers / Text (Valgrind)
Code was assuming 1-based, but the input is 0-based
30
31
32
33
34
35
...
51
52
53
54
...
82
83
84
...
oldx = (float
r = (float *)
oldr = (float
p = (float *)
oldp = (float
*) malloc
malloc (n
*) malloc
malloc (n
*) malloc
(n * sizeof(float));
* sizeof(float));
(n * sizeof(float));
* sizeof(float));
(n * sizeof(float));
for (k=K1; k < K2 + 1; ++k) {
sum += (AA[k] * oldx[JA[k]);
}
for (k=K1; k < K2 + 1; ++k) {
sum += AA[k] * p[JA[k]];
}
# It was: oldx[JA[k] - 1] now fixed.
# It was: p[JA[k] - 1] now fixed.
The code runs correctly, but Valgrind still reports leaks...
==24512== LEAK SUMMARY:
==24512==
definitely lost: 1,243,108 bytes in 11 blocks
# Another Problem?
==24512==
indirectly lost: 0 bytes in 0 blocks
==24512==
possibly lost: 0 bytes in 0 blocks
==24512==
still reachable: 16,404 bytes in 2 blocks
==24512==
suppressed: 0 bytes in 0 blocks
==24512== Rerun with --leak-check=full to see details of leaked memoryggy.c:34) # This is what we will do
==23817==
by 0x401D33: main (cg_buggy.c:182)
More problems? Definitely YES. Trust Valgrind on this!
Debuggers / Text (Valgrind)
Full Leak Check: Shows all sources for leaking memory
valgrind --leak-check=full <exe> <args>
$
!
valgrind --leak-check=full ./cg_buggy bayer10.mtx.csr
==24935== Memcheck, a memory error detector
==24935== Copyright (C) 2002-2011, and GNU GPL'd, by Julian Seward et al.
==24935== Using Valgrind-3.7.0 and LibVEX; rerun with -h for copyright info
==24935== Command: ./cg_buggy bayer10.mtx.csr
==24935==
NOT CONVERGED!! at iteration = 101
Elapsed time: 3.315764 sec.
==24935==
==24935== HEAP SUMMARY:
==24935==
in use at exit: 1,259,512 bytes in 13 blocks
==24935==
total heap usage: 14 allocs, 1 frees, 1,260,080 bytes allocated
==24935==
==24935== 53,744 bytes in 1 blocks are definitely lost in loss record 3 of 13
==24935==
at 0x4C267BA: malloc (vg_replace_malloc.c:263)
==24935==
by 0x401B4C: main (cg_buggy.c:162)
==24935==
==24935== 53,744 bytes in 1 blocks are definitely lost in loss record 4 of 13
==24935==
at 0x4C267BA: malloc (vg_replace_malloc.c:263)
==24935==
by 0x401B61: main (cg_buggy.c:163)
==24935==
==24935== 53,744 bytes in 1 blocks are definitely lost in loss record 5 of 13
==24935==
at 0x4C267BA: malloc (vg_replace_malloc.c:263)
==24935==
by 0x401192: Sparse_CG (cg_buggy.c:31)
...
...
Debuggers / Text (Valgrind)
!
!
In Sparse_CG(), add to the end:
free(oldx);
free(r); free(oldr); free(p); free(oldp); free(q);
In main(), add to the end:
!
free
free
free
free
free
(AA);
(IA);
(JA);
(b);
(x);
$ valgrind --leak-check=full ./cg_buggy bayer10.mtx.csr
...
...
==26027== HEAP SUMMARY:
==26027==
in use at exit: 16,628 bytes in 2 blocks
==26027==
total heap usage: 14 allocs, 12 frees, 1,260,304 bytes allocated
==26027==
==26027== LEAK SUMMARY:
==26027==
definitely lost: 0 bytes in 0 blocks
# Finally!
==26027==
indirectly lost: 0 bytes in 0 blocks
==26027==
possibly lost: 0 bytes in 0 blocks
==26027==
still reachable: 16,628 bytes in 2 blocks
==26027==
suppressed: 0 bytes in 0 blocks
==26027== Reachable blocks (those to which a pointer was found) are not shown.
Debuggers / Text (Valgrind)
(Valgrind FAQ 5.2)
• "definitely lost" means your program is leaking memory -- fix those leaks!
!
• "indirectly lost" means your program is leaking memory in a pointer-based structure. (E.g.
if the root node of a binary tree is "definitely lost", all the children will be "indirectly lost".) If
you fix the "definitely lost" leaks, the "indirectly lost" leaks should go away.
!
• "possibly lost" means your program is leaking memory, unless you're doing unusual things
with pointers that could cause them to point into the middle of an allocated block; see the
user manual for some possible causes. Use --show-possibly-lost=no if you don't want to
see these reports.
!
• "still reachable" means your program is probably ok -- it didn't free some memory it
could have. This is quite common and often reasonable. Don't use --show-reachable=yes if
you don't want to see these reports.
!
• "suppressed" means that a leak error has been suppressed. There are some suppressions
in the default suppression files. You can ignore suppressed errors.
Debuggers / GUI (DDT)
Allinea DDT
www.allinea.com/products/ddt/
!
•
•
•
•
•
•
•
A commercial debugger with a GUI
PACE has a single user license with up to 32 procs. Heavily builds on GDB, does everything GDB does, and more
Supports memory debugging and data structure visualization
Supports Mvapich2/OpenMPI and also custom MPI stacks
Supports GNU, Intel & PGI compilers (and more)
Distributed debugging with focus on scalability
Debuggers / GUI (DDT)
• We will use the same buggy CG code. • Starting the DDT debugger (always on a compute node!!, use msub
$
$
$
$
msub -I -X -q iw-shared-6 -l nodes=1:ppn=8,pmem=2gb
module load gcc mvapich2
# whichever compiler/MPI
module load ddt ddt
Select “Auto-Detect (none)”
-I
):
Debuggers / GUI (DDT)
Your decision really, but I
usually skip this step and
run things interactively
This is for admins, you can
also skip this step.
Debuggers / GUI (DDT)
Run and debug a code
Only for command line!!
Attach any of the running processes
Open and debug a coredump
• “Run & Debug” is for running and debugging the code interactively.
• Manually Launch a Program is for runs started DDT’s command line tools
• Attach to any running processes (which you own)
• Displays running processes and allows you to pick any subset
• Allows you to selectively attach (e.g. only 32 procs of 128 total) • DDT can also analyze coredumps
Debuggers / GUI (DDT)
input matrix *is* an
argument, NOT an
input file, since it
is not redirected in
the code with “<”
Debuggers / GUI (DDT)
If you see
this, turn off
optimizations!
Annotated
source code
Debuggers / GUI (DDT)
Turn off the Optimizations!
in the Makefile: “DEBUGOPTS=-g
!
$
$
$
$
cp cg_buggy.c cg_fixed.c
cp cg_buggy.c.org cg_buggy.c
make clean
make all
-pg -O0 -fprofile-arcs -ftest-coverage”
# Optional, if you would like to keep the fixed code
Restart DDT. It will remember previous settings (configuration is stored in ~/.ddt)
Debuggers / GUI (DDT)
Move mouse
over variables
to see their
value
Double click on (49) to create a breakpoint (or right click and select from menu)
Debuggers / GUI (DDT)
Enter the condition
(there is a typo here, it
should be IA[i+1] - 1)
•
•
Select “Breakpoint” Tab and enter the breakpoint condition:
Hit “Play” again
IA[i + 1] - 1 > nnz
Debuggers / GUI (DDT)
•
•
It stopped exactly when the condition is met and we can browse for all variables No need for “print”
Debuggers / GUI (DDT)
• Right Click on “IA” from the “Current Line(s)” (or “Locals”) panel on the right, and select “View Array”
• Enter 0 and 13437 (n + 1) as the Range, and click on “Visualize” • We expect IA to gradually increase, but the graph shows a drastic spike around 3000 (remember i=3363) • Using visualization, it only takes a single glance to recognize problems!
Parallel Debugging with DDT
•
•
•
Not so different from sequential debugging (which cannot be said for text
based debuggers)
Process and Thread level debugging with the ability to see and compare the
stack for each process/thread
Powerful “Cross Process/Thread Comparison” tool to compare the stack in
different processes/threads
!
Hands-on Examples (if there is time!)
Warmup: startmpi_c.c / startmpi_f.f90
• Deadlock: cpi.c
•
!
DDT Parallel case: startmpi_c/f
$
$
$
#
$
#
$
#
$
#
cd codes/MPI_DDT
source load_modules
make
First, try with no args
mpirun -np 4 ./startmpi_c
No problem! Try *with* args
mpirun -np 4 ./startmpi_c a b c
CRASH! Open DDT:
ddt
start code in DDT (see screenshot)
DDT Parallel case: startmpi_c/f
1) Hit the Play button to run
2) When crashes, hit pause
3) Click on the “main” directly
above the print_arg function
in the “Stack” View.
4) This takes you to main which
lets you see where that arg
value comes from.
5) Now click on the “Locals” tab
(on the right-hand side of the
GUI) – you are seeing all the
local variables.
6) Click on the “Current Line”
tab to simplify and show only
the variables on that line.
7) Click and drag between lines
113 and 118 in the source
code to show all the
variables in that region.
FIX:
1) y = 4251280 (the number of arguments ??) 2) Fix on line 117: for (y = 0; y < argc; y++)
DDT Parallel case: startmpi_c/f
!
# Now try with 5 procs:
$ mpirun -np 5 ./startmpi_c a b c
# CRASH! Open DDT again
1) Try clicking on the boxes representing processes 0 to 4,
how do the values in stack change?
2) Can you spot the problem? (hint check the screenshot)
DDT Parallel case: cpi.c
$ cd codes/MPI_DDT
$ source load_modules
$ make
# First, try with 4 procs
$ mpirun -np 4 ./cpi
# No problem! Try with 10 procs
$ mpirun -np 10 ./cpi
# No problem! Try with 8 procs
$ mpirun -np 8 ./cpi
# CRASH! But why?
Homework!
!
Hint: It’a deadlock
PART II
PROFILERS
Profilers / Text (Gprof)
Gprof (part of GNU binutils package)
http://www.gnu.org/software/binutils/
!
• Turn on the optimizations! (e.g -02)
• Requires compilation with “-g -pg”
in the Makefile:
both!
“DEBUGOPTS=-g -pg -O2 -fprofile-arcs -ftest-coverage”
!
make clean; make all
!
• Nothing extra on the command line. Just run the code (‘cg’ this time)
$./cg bayer10.mtx.csr
NOT CONVERGED!! at iteration = 1001
Elapsed time : 0.551763 sec.
!
• A file named “gmon.out” appears in the working directory
• To see the profiling information, run:
$gprof cg > gprof.out
Profilers / Text (Gprof)
Flat profile:
!
Each sample counts as 0.01 seconds.
%
time
cumulative
seconds
self
seconds
self
calls
total
ms/call
ms/call
100.10
0.55
0.55
1
550.54
550.54
0.00
0.55
0.00
2
0.00
0.00
name
Sparse_CG
rtc
...
Call graph (explanation follows)
granularity: each sample hit covers 2 byte(s) for 1.82% of 0.55 seconds
index % time
[1]
100.0
self
children
called
0.55
0.00
1/1
0.55
0.00
1
name
main [2]
Sparse_CG [1]
# Current function
-----------------------------------------------
<spontaneous>
[2]
100.0
0.00
0.55
main [2]
0.55
0.00
1/1
Sparse_CG [1]
0.00
0.00
2/2
rtc [3]
# Current function
-----------------------------------------------
[3]
0.0
0.00
0.00
2/2
0.00
0.00
2
main [2]
rtc [3]
-----------------------------------------------
# Current function
Profilers / Text (Gprof)
• The
[1], [2], [3], ...
are tables for each function, sorted by the
‘exclusive’ time spent •Gprof output is verbose. (use ‘-b’ to omit definitions) • Total % might be >100.0 due to accumulated sampling errors
• “self” means this function alone • “cumulative” means this function plus all listed above it (parents)
• “children” means time propagated into this function by its children
• Add ‘-l -A’ for annotated output. NOT line by line, only shows
the number of calls for each function.
Profilers / Text (Gprof)
gprof cg -l -A > annotated_gprof.out
in annotated_gprof.out:
void
output_vector(char *label, float *a, int n);
!
double rtc()
2 -> {
# Called twice
struct timeval time;
gettimeofday(&time,NULL);
return ( (double)(time.tv_sec*1000000+time.tv_usec)/1000000 );
}
!
Top 10 Lines:
Line
Count
24
2
32
1
!
Execution Summary:
86
Executable lines in this file
3
Lines executed
3.49
Percent of the file executed
!
3
0.03
Total number of line executions
Average executions per line
Profilers / Text (Gcov)
Gcov
!
• Show which parts of the code were executed
• Can be regarded as a debugger or profiler, depending on the usage
• Code must be compiled with "-fprofile-arcs -ftest-coverage"
in the Makefile:
!
“DEBUGOPTS=-g -pg -O2 -fprofile-arcs -ftest-coverage”
make clean; make all
•
!
"gcov <exe>"
code)
creates source.c.gcov (the annotated source
Profilers / Text (Gcov)
$ gcov cg
File 'cg.c'
Lines executed:93.07% of 101
cg.c:creating 'cg.c.gcov'
!
in cg.c.gcov:
!
-:
1000:
13437000:
13436000:
-:
1000:
#####:
#####:
-:
1000:
-:
13437000:
13436000:
13436000:
13436000:
118: (Blank)
119:
criteria = 0.0;
120: (executed 13437000x)
for (i = 0; i < n; ++i)
121:
criteria += r[i] * r[i];
122:
123:
if
(sqrt(criteria) < delta) {
124: (Not executed)
printf ("Converged at iter = %d\n", iter);
125:
break;
126:
}
127:
oldro = ro;
128:
129:
for (i = 0; i < n; ++i) {
130:
oldr[i] = r[i];
131:
oldp[i] = p[i];
132:
Profilers / API (PAPI)
PAPI
Performance Application Programming Interface
http://icl.cs.utk.edu/papi
!
•
•
•
•
A profiling API for C/C++/Fortran/Java and collection of tools
Supports a large variety of architectures (intel, AMD, Power ...)
Used by many profiling packages (TAU, OpenSpeedshop, etc)
No longer requires modified Kernel for hardware counter support
(starting with 2.6.39)
Profilers / API (PAPI)
Preset Events:
•
!
Can be a single hardware event, or derived using multiple events. E.g:
Single:
PAPI_TOT_CYC: Total number of cycles, single event
!
Derived:
PAPI_L1_TCM : Total L1 misses = (L1 data misses) + (L1 instr misses)
•
•
•
!
Support for Preset Events depend on the architecture
!
The number and types of Preset Events that can be counted
concurrently are also architecture dependent
!
Usage on PACE Clusters (for both API and tools)
!
$ module load papi
Profilers / API (PAPI)
Getting the list of supported events: papi_avail
$ papi_avail
Available events and hardware information.
--------------------------------------------------------------------------------
PAPI Version
: 5.0.1.0
Vendor string and code
: AuthenticAMD (2)
Model string and code
: AMD Opteron(tm) Processor 6168 (9)
...
...
Number Hardware Counters : 4
Max Multiplex Counters
: 64
--------------------------------------------------------------------------------
!
Name
Code
Avail Deriv Description (Note)
PAPI_L1_DCM 0x80000000 Yes
No
Level 1 data cache misses
PAPI_L1_ICM 0x80000001 Yes
No
Level 1 instruction cache misses
PAPI_L2_DCM 0x80000002 Yes
No
Level 2 data cache misses
PAPI_L2_ICM 0x80000003 Yes
No
Level 2 instruction cache misses
PAPI_L3_DCM 0x80000004 No
No
Level 3 data cache misses
...
...
PAPI_VEC_SP 0x80000069 No
No
Single precision vector/SIMD instructions
PAPI_VEC_DP 0x8000006a No
No
Double precision vector/SIMD instructions
PAPI_REF_CYC 0x8000006b No
No
Reference clock cycles
-------------------------------------------------------------------------
Of 108 possible events, 40 are available, of which 8 are derived.
!
avail.c
PASSED
Profilers / API (PAPI)
Choose events to count concurrently: papi_event_chooser
USAGE:
!
$ papi_event_chooser
# Buggy: Safe to ignore messages “PAPI Error: Didn't close all events”
Usage: papi_event_chooser NATIVE|PRESET evt1 evt2 ...
!
Q: Can we count L2 Data Misses (PAPI_L2_DCM) and Accesses (PAPI_L2_DCA) together?
!
$ papi_event_chooser PRESET PAPI_L2_DCM PAPI_L2_DCA
Event Chooser: Available events which can be added with given events.
...
!
Q: How about L2 Data Misses (PAPI_L2_DCM) and L3 Data Misses (PAPI_L3_DCM) together?
!
$ papi_event_chooser PRESET PAPI_L2_DCM PAPI_L3_DCM
...
Event PAPI_L3_DCM can't be counted with others -7
# Not supported (or no such cache exists)
!
Q: PAPI_L1_DCM + PAPI_L1_DCA + PAPI_L2_DCM + PAPI_L2_DCA + PAPI_TOT_CYC?
!
$ papi_event_chooser PRESET PAPI_L1_DCM PAPI_L1_DCA PAPI_L2_DCM PAPI_L2_DCA PAPI_TOT_CYC
...
Event PAPI_L2_DCA can't be counted with others -8
# supported, but cannot count with others
Profilers / API (PAPI)
Compilation with PAPI • Use of #ifdef blocks are recommended to easily turn on/off PAPI. in the code:
#ifdef PAPI
...
...
#endif
!
• Load the PAPI module
$ module load papi
• Add PAPI and PFM libraries in the Makefile (and -DPAPI for #ifdef blocks)
in the Makefile:
PAPILIB=-L$(PAPIDIR)/lib/ -lpfm -lpapi
PAPI=$(PAPILIB) -DPAPI
...
...
cg: cg.c
$(CC) -o cg cg.c $(DEBUGOPTS) $(PAPI) $(LIBS)
Profilers / API (PAPI)
Embedding PAPI in the code (See cg.c for a working example) • Include the PAPI header define the number of concurrent events #ifdef PAPI
#include <papi.h>
#define NUMEVENTS 2
#endif
!
• Initialize PAPI and start counters
!
!
#ifdef PAPI
// Initialize PAPI
int events[NUMEVENTS] = {PAPI_L2_DCM, PAPI_L2_DCA};
// Start Counters
int errorcode = PAPI_start_counters(events, NUMEVENTS);
if (errorcode != PAPI_OK) { // Error handling goes here # Two events will be counted
# Start counters
#endif
• Read from counters and printout the results
...
# Do some work here
#ifdef PAPI
long long values[NUMEVENTS];
# Use long long, since the number of events may get too large
errorcode = PAPI_read_counters(values, NUMEVENTS);
# This function resets the counters!
fprintf(stderr, "L2 Access
: %lld\n", values[1]);
fprintf(stderr, "L2 Miss
: %lld\n", values[0]); #endif
Profilers / GUI (TAU)
TAU
Tuning and Analysis Utilizies
http://www.cs.uoregon.edu/research/tau/home.php
!
•
•
•
A profiling GUI for C/C++/Fortran/Java/Python (paraprof)
For sequential and parallel (distributed and multithreaded) codes
Supports both dynamic instrumentation and recompilation of code via
compiler wrappers
•
•
•
•
•
•
Collects and Visualizes profiling data (including data by other packages)
Function and loop level granularity (nothing at line-level so far)
Supports 2D and 3D Visualizations
Supports instrumentation using PDT (program data toolkit)
Utilizes PAPI for HW counters
Provides a Text-based interface (pprof) as well
Profilers / GUI (TAU)
on PACE Clusters:
• Usage
!
$ msub -I -X -q iw-shared-6 -l nodes=1:ppn=8,pmem=2gb
# -X for X11 forwarding
$ module load gcc mvapich2
# whichever compiler/MPI
$ module load tau/2.22.1
$ module list
Currently Loaded Modulefiles:
1) gcc/4.4.5(default)
3) mvapich2/1.6(default)
5) pdt/3.18
2) hwloc/1.2(default)
4) papi/5.0.1
6) tau/2.22.1 •
Code re-compilation requires a specific Makefile, provided by TAU.
The TAU module on PACE automatically defines it in your environment.
!
$ echo $TAU_MAKEFILE
/usr/local/packages/tau/2.22.1/mvapich2-1.6/gcc-4.4.5/x86_64/lib/Makefile.taupapi-mpi-pdt-openmp
•
!
We will use the NAS Parallel Benchmark Suite for TAU demonstration http://www.nas.nasa.gov/publications/npb.html
!
• NAS Suite comes with a MPI CG solver, which we will use :-)
Profilers / GUI (TAU)
• Change directory to “PaceWorkshop/codes/NPB3.3-MPI”
$ cd ~/data/PaceWorkshop/codes/NPB3.3-MPI
• Check “config” directory for Makefile definitions
$ cd config
$ ls -al
lrwxrwxrwx
-rw-------rw-------
1 mbelgin3 pace-admins
12 Feb 11 14:17 make.def -> make.def.tau
1 mbelgin3 pace-admins 7264 Feb 11 14:13 make.def.org
1 mbelgin3 pace-admins 7337 Feb 12 16:41 make.def.tau
!
• make.def.org is the original definitions file that comes with the suite
• make.def.tau includes the modifications needed for TAU
• Currently, make.def is linked to make.def.tau, switch between these
two as you wish.
Profilers / GUI (TAU)
Let’s check the differences between two Makefile definition files:
$ diff make.def.org make.def.tau
32,33c32,33
< MPIF77 = mpif77
<
---
> #MPIF77 = mpif77
> MPIF77 = tau_f77.sh -lpfm
79c79,80
< MPICC = mpicc
---
> #MPICC = mpicc
> MPICC = tau_cc.sh -lpfm
124c125,126
< CC= cc -g
---
> #CC
= cc -g
> CC= tau_cc.sh -lpfm
• The only difference is replacing the
compiler with TAU-provided wrapper
!
• On our system, there is a default libpfm:
/usr/lib64/libpfm.so
!
which is not compatible with TAU, so we
need to use the one that comes with PDT.
However, this is not correctly defined in the
TAU Makefile ($TAU_MAKEFILE)
!
Until this is resolved, we need to add ‘lpfm’
Profilers / GUI (TAU)
• Make the Parallel CG Suite
$ cd ../
#or cd ~/data/PaceWorkshop/codes/NPB3.3-MPI/
$ make clean
$ make cg NPROCS=8 CLASS=W
!
• “NPROCS” is the number of processors, “CLASS=W” defines the size • NPROCS and CLASS are NAS-specific, they have nothing to do with TAU
• You can ignore the message that says:
/usr/bin/ld: warning: libpfm.so.3, needed by /usr/local/packages/papi/5.0.1/lib//
libpapi.so, may conflict with libpfm.so.4
• Now, find the executable named “cg.W.8” in the bin directory:
$ cd bin
$ ls
cg.W.8
• Run the Benchmark as usual
$ mpirun -np 8 ./cg.W.8
Profilers / GUI (TAU)
• You will notice new profiling files named as “profile.x.y.z” for each processor
$ ls
cg.W.8
!
profile.0.0.0
profile.2.0.0
profile.4.0.0
• Run the TAU GUI “paraprof ” (in the same directory)
$ paraprof
profile.6.0.0
Profilers / GUI (TAU)
• This profiling data only includes “TIME”. Double click on it.
• Then double click on *any* of the blue bars
Profilers / GUI (TAU)
Function-specific view for the selected metric (TIME) for each
process/thread.
Function name: MPI_Init()
time spent in the
function for each
thread/process
“Windows” Menu is identical for
all views, and not specific to functions. Explore!
sorted by
time,
including
min, max,
mean, and
std dev
Profilers / GUI (TAU)
3D viz allows us
to compare two
metrics on the
same plot.
!
We have only
“TIME” here, so a
3D viz is not that
meaningful
Profilers / GUI (TAU)
Right-click on the
green bar (function
SPRNVC) and select
“Show Source Code”
You might need to tell TAU where the source codes are (if they not in the same directory as the executables)
Profilers / GUI (TAU)
You will not see the “Show
Source Code” option for
functions that do not
come from packages
compiled without
debugging enables (-g).
!
E.g. try right clicking on
the blue bar for MPI_Init()
• The function selected with blue text background
• Do not hope to see line-by-line metrics. The finest granularity is loops, and
it needs to be enabled :-(
Profilers / GUI (TAU)
Not impressed yet? Let’s do more!
• Throw more metrics in the mix (E.g. Number of cycles and Cache events) • Use 3D visualization features to compare two different metrics at a glance
• Derive new metrics using the already counted events
• Check MPI communication patterns
• Create a Call Graph
• Get detailed counts/statistics in table and text formats
Profilers / GUI (TAU)
•TAU configuration is done using env variables. Using a script is recommended.
See:
~/data/PaceWorkshop/tau_runtime_env.sh
#!/bin/bash
# Sets up runtime TAU intrumentation parameters
!
module
module
module
module
!
purge
load gcc
load mvapich2
load tau/2.22.1-beta
# The directory where profiling takes place
export PROFILEDIR=~/data/PaceWorkshop/codes/NPB3.3-MPI/bin
!
# Required for visualizing the communication matrix (for MPI)
export TAU_COMM_MATRIX=1
!
# Enable tracking for message communication
export TAU_TRACK_MESSAGE=1
!
PAPI Events
# Which hardware counters to count
export TAU_METRICS="PAPI_L1_DCM:PAPI_L1_DCA:PAPI_FP_OPS:TIME
!
# Create a callpath with a max depth of 100
export TAU_CALLPATH=1
export TAU_CALLPATH_DEPTH=100
!
"
TAU Event
Loop-Level Granularity!
!
BEGIN_INSTRUMENT_SECTION
loops routine="#"
END_INSTRUMENT_SECTION
# TAU options file
export TAU_OPTIONS='"-optTauSelectFile=~/data/PaceWorkshop/codes/NPB3.3-MPI/bin/select.tau –optVerbose"'
Profilers / GUI (TAU)
• DON’T run this script, “source” it.
$
$
$
$
$
•
msub -I -X -q iw-shared-6 -l nodes=1:ppn=8,pmem=2gb
module purge
cd ~/data/PaceWorkshop/codes/NPB3.3-MPI
source tau_runtime_env.sh
echo $TAU_METRICS
PAPI_L1_DCM:PAPI_L1_DCA:PAPI_FP_OPS:TIME
!
•
# if not in a compute node
# In case you have loaded modules
# Check if sourcing worked fine
# Good
Recompile and run the code (required due to new TAU configurations)
$
$
$
$
•
Source exports all env variables to shell.
make clean
make cg NPROCS=8 CLASS=W
cd bin
mpirun -np 8 ./cg.W.8
!
You will notice new directories named “MULTI__PAPI_X_Y”
$ ls
...
MULTI__PAPI_L1_DCA
MULTI__PAPI_L1_DCM
MULTI__PAPI_FP_OPS
MULTI__TIME
Run paraprof (in the bin directory)
$ paraprof
Profilers / GUI (TAU)
See “Height” and “Color” Metrics. Can you tell which loops are FP_OPS-heavy?
Profilers / GUI (TAU)
Deriving your own metrics using collected data. E.g. L1_MISS_RATE (%)
SETUP_PROC_INFO on
node 6 experienced a
10.718% L1 Miss Rate
Use the Derived Metric Panel to Create your own:
L1_MISSRATE=(100*"PAPI_L1_DCM")/"PAPI_L1_DCA"
Profilers / GUI (TAU)
3D Communication Matrix
We can easily identify two kinds of messages:
1. Frequent but small
2. Less Frequent but large
Profilers / GUI (TAU)
Call Graph
The labels are scaled to the
“exclusive” time spent, but
the can be enlarged using
the mouse to read the
function names Profilers / GUI (TAU)
Statistics (Table)
Profilers / GUI (TAU)
Statistics (Text)
Profilers / GUI (TAU)
•
“Packing” all profiling data into a single package
$ cd bin
$ paraprof --pack tau_results.ppk
!
(then on “any” system with TAU installed)
!
$ paraprof tau_results.ppk
•
Dynamic Instrumentation (for codes that are not compiled with TAU)
$ mpirun -np 8 tau_exec ./cg.W.8
(TAU will do its best to profile the code)
• Text-based paraprof: pprof
$ pprof profile.0.0.0
$ pprof profile.1.0.0
$ ...
!
(Separate runs for each thread/process)
Thank You!
•
Your feedback will be appreciated! ([email protected])
- Give it to me straight, I welcome criticism :-)
- We *might* send you a survey later, and any comment will help.
Have More Time?