1
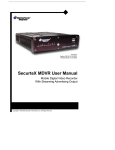
CMS Web Manual
Average Customers by hour - YTD (Year to Date)
Year to Date (YTD) Average Customers by hour report will display a graph representation of the hourly average number
of customers (Traffic In/Entering and Traffic Out/Exiting) or the hourly average number of Transactions for the
current fiscal year.
The start of a fiscal year is determined by the company's Fiscal Calendar, the end of the fiscal year is set to the Search
Date.
Selected sites and the Region(s) they belong to are color-coded for easy identification on the chart.
If the sites from more than one Region are selected for the report, the graph report will be generated for Regions
and not individual sites. Check off the View Sites check box to display the graph for each individual site.
To run the Average Customers by Hour - YTD report,
1. Start by selecting the Search Date for the report. Yesterday's date is selected by default. Click the calendar
icon
to select a different date.
2. Select the entire Company, one or more Regions OR one or more individual sites in the Sites tree list.
3. Select Business Analytic > Average Sales by Customers > YTD report in the BAM Reports tree list in
the bottom left corner.
4. The report will be automatically generated in the right pane.
5. To switch from Traffic In to Traffic Out or Transactions, make the selection in the drop-down menu under
the graph (highlighted in the image below). The graph will be updated automatically
72