1
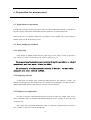
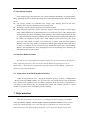
Curve 1 ----Select the smaller measuring range. When the sample BOD range is unknown, according to the determined value of the total organic carbon (TOC), permanganate index (IMn) or chemical oxygen demand (CODCr), and according to the ratio of BODT5 and TOC, IMn or CODcr on the following table, estimate BODT5 expected value. Water type BODT5/TOC Untreated wastewater 1.2---2.8 1.2---1.5 0.35---0.65 0.3---1.0 0.5---1.2 0.20---0.35 Biochemical treatment wastewater BODT5/IMn BODT5/CODcr Curve 2 ----the curve indicates the beginning of nitrification. Usually, after 5 days, typical wastewater occur organic nitrogen biological oxidation. The development of nitrifying bacteria is slower than other types of bacteria. However, some samples contain a high concentration nitrifying bacteria will cause very fast nitrification phenomenon. Adding one 13





![IDVisor Hardware User Manual [Rev 1.1]](http://vs1.manualzilla.com/store/data/005787323_1-ba2f62bd59c5cdea456b5da531a1d222-150x150.png)