1
Actitracker: A Smartphone-based Activity Recognition
System for Improving Health and Well-Being
Gary M. Weiss, Jeffrey W. Lockhart, Tony T. Pulickal,
Paul T. McHugh, Isaac H. Ronan, Jessica L. Timko
Department of Computer & Information Science
Fordham University
441 East Fordham Road
Bronx, NY, 10458
{gweiss, lockhart, pulickal, mchugh, ronan, timko}@cis.fordham.edu
ABSTRACT
This paper describes Actitracker, a smartphone-based activitymonitoring service that helps people ensure that they receive sufficient activity to maintain proper health. Unlike most other such
services, Actitracker requires only a smartphone (no watches,
bands, or clip-on devices). This free service allows people to set
personal activity goals and monitor their progress toward these
goals. Actitracker uses data mining to generate its activity recognition models. It initially uses a universal/impersonal model that is
generated from labeled activity data from a panel of users, but will
automatically generate, and deploy, much more accurate personalized models once a user completes a simple training phase. Detailed activity reports and statistics are maintained on the
Actitracker server and are available to the user via a secure web
interface. Actitracker has been deployed for several months and
currently has over 250 registered users. This paper discusses user
experiences with the service, as well as challenges and tradeoffs
associated with building and deploying the service.
Categories and Subject Descriptors
J.3 [Life and Medical Sciences] – health.
General Terms
Algorithms, Measurement, Performance, Design, Human Factors.
Keywords
Activity recognition, sensors, smartphones, data mining, health,
mobile health, fitness.
1. INTRODUCTION
A lack of adequate physical activity is an enormous problem in
our society, because physical inactivity dramatically increases the
health risks for many diseases, including cardiovascular disease
[3, 11, 14], colon cancer [4], diabetes mellitus, hypertension, and
osteoporosis [16]. According to the World Health Organization,
inactivity is responsible for approximately two million deaths per
year [13], while a healthy amount of physical activity has been
shown to significantly reduce the risk of all-cause mortali-
Permission to make digital or hard copies of all or part of this work for
personal or classroom use is granted without fee provided that copies are
not made or distributed for profit or commercial advantage and that
copies bear this notice and the full citation on the first page. To copy
otherwise, or republish, to post on servers or to redistribute to lists,
requires prior specific permission and/or a fee.
KDD’14, August 24–27, 2014, New York, NY, USA.
Copyright 2014 ACM 1-58113-000-0/00/0010 …$15.00.
ty [1, 12]. Inactivity is especially associated with health-related
societal problems like childhood obesity, which is now generally
considered to be a critical public health threat [6]. Inactivity also
impacts the ability of the elderly to live independently, which has
huge quality-of-life and economic implications, given our rapidly
aging population. If a caregiver could identify dramatic changes in
activity for an elderly person, this could help identify healthrelated problems before they become serious.
The good news is that according to a report from the US Surgeon General, even moderate amounts of exercise can substantially improve one’s health [17]. Activity recognition technology can
address the problems associated with inactivity by providing people with accurate information about their activities, along with
guidelines concerning the amount of physical activity that is required for good health. In this paper we describe Actitracker, a
deployed, free, smartphone-based service that provides activity
monitoring and thus supports the social good.
The fitness market currently offers several activity tracking
products, such as the Fitbit (www.fitbit.com) and Nike+ Fuelband
(www.nike.com/fuelband). Both of these require the purchase of
additional sensor hardware: Fitbit requires the purchase of a clipon or wristband device in the $60-$130 range while the Nike+
Fuelband costs $149. Fitbit requires an additional annual $49 fee
should the user want to download their data and access supplemental features. Smarthwatches, such as the Pebble smartwatch
(getpebble.com), have recently begun to enter the market and will
support activity tracking applications; the cost of these watches
starts at about $100.
The Actitracker service offers several advantages over the
commercial products just listed. The most obvious is that it requires no additional hardware. This results in cost savings, but
perhaps more importantly, it makes activity tracking immediately
available to a much broader audience—there are currently about
1.5 billion smartphone users in the world [8] whereas the projected market for wearable fitness sensor devices in 2017 is just 64
million [15]. There is also some incremental effort associated with
owning and maintaining these wearable accessories (e.g., charging, taking off and on). Although smartphones require similar
effort, most people carry smartphones for reasons other than activity monitoring and thus this effort must be expended anyway.
Actitracker also provides more granular results than most commercial products (i.e., our timeline displays activities in 10-second
intervals) and recognizes some additional activities. Actitracker’s
focus on basic daily activities like walking and climbing stairs is
not particularly limiting because for most people—including the
elderly—such activities are the most realistic and sustainable way
to maintain healthy levels of activity.
There are also benefits associated with the fact that Actitracker,
although positioned as a commercial-quality service, is developed
and maintained by a University research lab and is not profitdriven. Aside from the fact that the service is free, anonymized
Actitracker data is shared with activity recognition researchers via
publically available datasets [20]. Furthermore, if the service becomes sufficiently popular, the data can also be used to enable
large scale epidemiological studies of activity and behavior that
would otherwise be impractical. For example, Actitracker activity
data can be used to track activity levels over time, by season, by
geographic region, and by various demographic factors such as
age, profession, and weight. Also, unlike most commercial products, Actitracker’s design and algorithms are documented in a
form available to the public and research community [7, 9, 10].
Actitracker will also support the exporting of low-level user data,
so that external third-party services and applications can be used
to benefit the user. Currently most commercial products want to
retain control over their data and only allow the exporting of relatively high level results.
There have been several research papers that have described
some of the research underlying Actitracker, including papers that
have focused exclusively on activity recognition [7, 10, 19]. However, that prior work focused exclusively on highly structured
settings, where users were directed to perform specific tasks at
specific times. Additionally, no prior work discussed the overall
Actitracker system or the user interface component, including the
Actitracker activity reports. This is also the first paper to describe
user experiences with the complete system in a fully naturalistic
setting.
Although Actitracker is being developed in a university research lab and is free, it was designed to mimic a commercial
service. This was to remedy some complaints with prior work on
activity recognition, including that they do not address problems
in a fully natural setting and are terminated before they gain real
users. To help ensure that Actitracker does not suffer the fate of
some of these prior systems, thousands of development hours
have been spent on user interface design and providing professional quality documentation; approximately half a million dollars
has been expended on Actitracker research and development over
the past four years.
The basic functionality of Actitracker has been operational
since March 2013, at which point the system entered Alpha release. After a number of enhancements and bug fixes, the system
entered Beta release in September 2013 and then general availability in November 2013. However, very little effort has thus far
been expended to promote the Actitracker service, and most of
that effort has focused mainly on the Fordham University Rose
Hill campus. Nonetheless, users have found the service, including
many international users. As of February 2014 there were 250
registered Actitracker users, although not all users are active each
month. While the usage of the tool is quite modest, the existing
user base is sufficient for us to provide a reasonable assessment of
the strengths and weaknesses of the tool. We expect these usage
numbers to increase slowly over the next six months and then plan
to promote the tool aggressively starting in the summer of 2014.
Current usage statistics are generated dynamically and available
from the Actitracker.com main page.
2. SYSTEM ARCHITECTURE
Actitracker utilizes a client-server model to perform activity
monitoring and to present the results to the user. A high level
view of the basic Actitracker system architecture is provided in
Figure 1, which shows the major system components. The Acti-
Figure 1. Actitracker system architecture.
tracker client runs on the smartphone and transmits sensor data to
the Acitracker server for processing. The client app collects this
data when it is enabled and the phone is unplugged with the
screen off (the phone is normally expected to be in one’s pocket).
The server performs data cleaning and preprocessing steps and
then transforms the time-series accelerometer data into examples
that each describe 10-second intervals of activity, via the formation of higher level features. The transformed data is then
passed to a classification model, which determines the activity
corresponding to that 10 seconds of accelerometer data.
Actitracker currently identifies five activities: walking, jogging,
stairs (up or down), standing, and sitting/lying down. Sitting and
lying down are combined because it is very difficult to distinguish
these two activities from a smartphone positioned in one’s pocket.
If the user has provided sufficient training data through the
Actitracker self-training process, then a personalized activity
recognition classification model is applied; otherwise an impersonal/universal classification model is applied. The results are
stored in a database, which is subsequently accessed by the web
interface to provide activity reports to each user through their
personal Actitracker account. The details of these system components and the processing are described in the next few sections:
the smartphone client is described in Section 3, the web interface
is described in Section 4, and the data mining process components, which implement activity recognition, are described in
Section 5.
The high level system architecture shown in Figure 1, which is
consistent with our current implementation, involves several important design decisions and tradeoffs. First, virtually all functionality is offloaded from the phone to the server. This simplifies the
design of the client but increases the load on the server and hence
impacts the scalability of the system. The primary reason for doing things this way is that it enables the server to receive and store
all raw sensor data. This is useful because the raw data can then
be shared with other researchers [20] and alternate feature encodings can be applied at a later date. Given that users supply some
labeled data via the self-training mode, we can evaluate such alternate encodings with minimal effort, even long after the data
have been collected. Nonetheless, because these advantages are
mainly for researchers, we are in the process of migrating the
preprocessing and transformation code to the client app; we can
then enable this optionally via our administrative interface. By
doing this we may save battery life on the phone because even
though the processing demands will increase, the amount of data
that will need to be transmitted using the phone’s radios, given
our current encoding scheme, will decrease to 2.9% of the current
size [9]. We have also thought about moving additional functionality to the client. These alternatives and their pros and cons are
discussed in detail in our prior work [18]. At the furthest extreme,
all of the functionality is migrated to the phone, including model
induction; at that point the system is perfectly scalable—but researchers lose access to all data and results.
Another design decision was to provide the results and associated reports only via a web interface. Thus, the Actitracker app
provides no facility for viewing results. Users can view the results
by logging into their secure web account from their computer or
from their smartphone. While a mobile web interface is provided
and usable, the preferred method is to view results from a computer with a larger screen since this permits the best viewing of
some of the more comprehensive reports (like our timeline).
3. Smartphone Client Application
Actitracker currently supports Android smartphones and the
Actitracker client app is available for free from the Google Play
store. Support for the iPhone should arrive in June 2014. The
central responsibility of the smartphone client is to poll the accelerometer sensors and transmit the data to the Actitracker server (in
the future we will include the gyroscope sensor, if it exists, and
the GPS sensor). As mentioned earlier and discussed in Section 7,
additional functionality may be migrated from the server to the
client over time.
The client interface is extraordinarily simple and has only three
major components—a button to toggle the service on and off, a
button for adjusting settings, and a button to enter training mode.
First time users are prompted to create a secure account on the
Actitracker server; this account is used by the phone to submit
data and by the web server to authenticate users attempting to
view their data. Users may also create accounts from the web.
The preferences screen allows users to change data transmission and storage settings. Users have control over the circumstances under which the sensor data is uploaded to the server, a
major factor in battery life. “Wi-Fi Transmission” and “Mobile
Network Transmission” checkboxes permit the phone to send the
data when connected to a Wi-Fi network, mobile network, or both
(selecting only Wi-Fi tends to conserve power and prevent the app
from using up limited data plans, but delays results until the device is connected to Wi-Fi). The user can also select the “Charge
Only” option, which overrides the other options and ensures that
data is only transmitted when the phone is charging—which for
most people will lead to results being posted only once per day.
Most smartphones can easily store many days or months worth of
data. Finally, users can specify transmission frequency, which
applies only when the specified transmission mechanism(s) are
available. Frequency options range from once per minute to once
per hour, although we are planning a “real time” option to support
live demos of the service. Most people check their activity reports
only once a day—or at most a few times a day—so most configurations are more than adequate. The data storage and management
options do not normally need to be changed, but can allow one to
not cache unsent data, clear cached data, or “force send” all
cached data disregarding the current transmission settings.
The Actitracker training mode screen enables a user to provide
labeled activity data, so that the system can then automatically
generate a personalized activity recognition model, which will
override the default “impersonal/universal” model. The training
phase is highly recommended, since our research studies, summarized later, show that personal models far outperform the imper-
sonal ones [10]. The training mode guides the user to progress
though the set of activities. A timer is started after the user selects
“start,” at which point the user is expected to perform the activity
until the time expires and the phone emits a siren sound. The user
can ignore the siren and continue to collect additional training
data, and they can come back at a later time to generate additional
training data. As long as a minimum amount of data is available
for each of the required activities (“jogging” and “stairs” are not
required activities), a personal model will automatically be created and enabled. For most activities, we require only 2 or 3
minutes of data, although our research has shown that good results
are possible with even less data [10]. As described in Section 5,
the labeled training data is sampled in a manner that ensures that
class imbalances do not unduly bias the induced model.
4. Web Interface
The web interface provides each user with access to the
Actitracker results. It allows the user to obtain documentation and
information about Actitracker, provide feedback about the service
via several online surveys, and provide information to Actitracker
via a user profile. However, the most important function of the
web interface is to provide the user with access to the activity
recognition results from Actitracker’s database through a personal
dashboard.
4.1 User Documentation, Surveys, and Profile
Actitracker documentation assists the user in learning about the
service. Under the “About” menu there is a very short promotional description of the service, a “quick start” guide that should
enable most users to become familiar with the tool within a few
minutes, and a user manual that provides some additional details.
A privacy policy and document that explains the terms of use are
also provided. Although most of the data is not particularly sensitive, privacy issues will become much more important if we decide to enable GPS sensor collection (although we would make
this an opt-in service). Finally, we provide a frequently asked
question list with detailed answers.
Given that we wish to improve the Actitracker service and
evaluate it effectiveness, we provide two online surveys (located
under the “Contact Us” menu). The short daily survey is intended
to capture feedback about the service for a single day of use, and
most of its questions are concrete and relate to the accuracy of the
various activity predictions. That survey also asks about battery
drain and provides a space for free-form comments. The comprehensive survey is meant to be filled out only occasionally, and
asks about twice as many questions, including some higher level
questions about the usefulness of the service. The survey results
help us to describe and quantify user experiences in Section 6.
Users are prompted upon registration to fill out a profile that
includes their gender, age, height, and weight. Some of the profile
information is used to determine the user’s peer group so that we
can compare that user’s activity results with those in the same
peer groups (based on age, gender, and body mass index) in the
comparison charts described in Section 4.2.2. In the future, user
profile information may also be used to improve activity recognition performance, since this information could be incorporated
into the impersonal/universal activity recognition models. The
demographic information collected in the user profile can also be
used to advance our research on identifying personal traits like
gender, height, and weight from accelerometer data [19].
4.2 Activity Results
Stairs 2%
Standing
23%
The primary responsibility of the web interface is to visualize
activity information for the user. This is controlled through their
activity dashboard.
Jogging
5%
Walking
12%
4.2.1 Activity Dashboard
The central component of the web interface for each user is the
activity dashboard. The reports area takes up two-thirds of the
dashboard. This includes a display area for the graphical results,
with three tabs at the top corresponding to the three reports: timeline, activity comparison, and activity breakdown. The remaining
one-third of the dashboard is taken up by other elements, including:
Sitting/Lyi
ng Down
58%
A graphical date selector to specify the time period over
which the various charts and statistics are computed. Buttons
are provided as shortcuts to view the current day, week, and
month.
Figure 2: Acitivty breakdown for one day.
A visual indicator of the FitDex value, a single number that
maps total activity to an easy to understand value. The user’s
average FitDex and user-supplied goal are also displayed.
Lifetime achievements, computed over the lifetime of one’s
Actitracker usage, and “best” achievements, typically computed over a single day.
Avg. by Gender
Your Activity
Stairs
Standing
Sitting/
Lying Down
4.2.2 Activity Reports
Actitracker currently supports three activity reports, each of
which provides a different view of the user data. The relevant
timeframe is determined by the date selector. Figure 2 provides a
breakdown of the activities for a specific user over the period of
the day when the user is awake. The figure shows that the user
spent most of his time sitting or lying down. The comparison chart
in Figure 3 shows how a user’s activity compares to that of other
Actitracker users, based on three different demographic categories
(BMI = Body Mass Index and is computed from the height and
weight values stored in the profile).This user is more sedentary
than others of similar age, gender, and activity. In the future we
can incorporate recommended values since the average values
very possibly do not reflect a healthy lifestyle.
Figure 4 shows an example of the timeline report. This report
shows the results at the most granular level—at 10 second increments. The user can scroll left or right to see different time periods. Because of the highly granular nature of the data, it may appear that a user is performing multiple activities at any time, but
Avg. by Age
Jogging
Activities
Calories burned, as well as average calories burned per day,
and user supplied calorie goal.
Avg. by BMI
Walking
0
2
4
6
8
10
Hours
Figure 3: Activity comparison.
in this chart only one activity is identified at each 10-second interval, which is clear upon zooming in to any specific time span.
In the future we plan to aggregate the results so that the user can
“roll up” to longer intervals of time (e.g., one minute).
4.2.3 FitDex and Calories Burned
Actitracker provides users with two numerical values that
summarize their daily activity: a calorie count and their FitDex.
The calorie count is based on the activity results and, more specifically, the time spent performing each activity. The conversion
from activity type to calories burned is accomplished via published estimates. Actitracker computes calories burned without the
manual effort required by many fitness tools.
Figure 4: Activity timeline.
The FitDex metric maps a user’s daily activity to a value between 0 and 1,000. The FitDex is calculated by taking the
weighted sum of the activities, where the weights are determined
based on the relative amount of calories burned for that activity.
The values are scaled such that an average healthy amount of
activity yields a FitDex of 500. A logarithmic scale is employed
so that moderate increases in activity will yield significant improvements in FitDex at the low end of the scale. This will provide motivation to those users who are not particularly active and
who may require the most positive feedback. As users achieve
higher FitDex values, more substantial increases in activity are
required to move the FitDex higher, which ensures that highly
active users remain properly motivated.
Both the FitDex and the calorie count are currently displayed
on the activity dashboard with the ability to view the last two
weeks of values in a line-graph. From the dashboard the user can
also set a goal value for the FitDex and calories burned, and when
the user reaches their daily goal, the dashboard will display a congratulatory message.
4.2.4 Achievements
The activity dashboard includes a panel of fitness achievements for the user. Lifetime achievements allow the user to view
achievements based on their “lifetime” usage of Actitracker. These achievements include: total calories burned, total hours using
Actitracker, and total hours expended performing each activity.
The “best” achievements are geared to the performance over a
single day and include: maximum time walking, jogging, and
climbing stairs. Because sedentary activity can be detrimental to
health, in the future we will add an achievement for “least time
sitting.” We also plan to add “medals” to a user’s account for
significant achievements and provide the ability to link these to
the user’s Facebook account to garner additional social support.
More creative achievements will also be added, such as one for
people who go a week without sitting continuously for more than
20 minutes at a time.
5. DATA MINING PROCESS
The Actitracker server implements and automates the entire data mining process for supporting activity recognition. Every step,
from data cleaning and preprocessing to model induction and
activity prediction, is automatically performed by the server as it
receives data from client phones, without human intervention.
5.1 Data Segmentation and Quality Control
Each data connection from a client leaves the server with an
ordered list of accelerometer records (a timestamp and x, y, and z
acceleration readings) collected over a period of several minutes
or hours. These lists of data are first divided into 10-second, nonoverlapping segments (a simple task, since the client sends data in
multiples of 10 seconds). This has several advantages. First, it
allows us to use standard classification techniques which require
discrete examples. Second, this allows us to handle each example
independently, which facilitates parallelization. Finally, the use of
discrete examples enables clients to connect and submit data periodically without requiring data from separate connections to be
matched up during processing.
Due to the way android smartphones provide accelerometer data to apps such as ours, repeat and null values must be expected.
Usually, they are the result of the operating system or hardware
being too busy to provide new sensor readings at the requested
rate. We implemented Algorithm 1 in order to allow a 10% degree
of tolerance for bad sensor readings; as long as 90% of the
ALGORITHM 1:
end_time = r[i].time + duration;
while(r[i].time < end_time)
if(!is_null(r[i]) && !is_repeat(r[i])
example.add(r[i]);
i++;
if(example.r_count > 0.9*(rate*duration))
process(example);
readings are good, an example is generated. We find that, in practice, this algorithm discards very few examples.
5.2 Feature Generation
The raw accelerometer records in each example are transformed into a set of 43 summary features that have been empirically shown to perform well [7]. These features are simple statistics, including the means and standard deviations of acceleration
per axis, the binned distribution of values, and a heuristic measure
of wave period. These features are computationally easy to generate, ensuring that the system remains scalable and that it can provide results to the end user in near real time.
We are exploring more advanced features and will incorporate
them if they are shown to improve accuracy. Additionally, the
code which performs feature generation is written in a Java library
shared by both the client and server. This will make it easy for us
to move the data transformation step from the server to the clients.
We are currently exploring this avenue, since while it does add
extra load to the device processor, it may save battery by reducing
the amount of data transmitted by the phone.
5.3 Model Induction
Our prior work has demonstrated that models built using training data from one user are excellent at predicting that user’s activity from unlabeled data, with accuracies in the high 90’s [10].
However, unlike our prior work and that of most other activity
recognition groups, Actitracker’s data is not collected in the lab,
but in real time and “in the wild.” If the incoming data has an
activity class label attached to it (i.e., via the app’s training mode),
it is considered training data. New training data is combined with
all previously received training data from the same user and then
is automatically used to generate a personal activity classification
model for the user. The model is then stored for later use in classifying unlabeled data from the user. Currently, Actitracker induces
and stores several kinds of models that have been shown in our
prior research to perform well in controlled environments [10].
The Actitracker system only uses Random Forest models (which
were shown to perform very well [10]) because of their relative
speed when being built and when classifying examples. Each
model is represented as a Java object, and they are both cached in
RAM for speed of access and serialized to long term storage for
persistence. More information about this implementation and
alternatives is available in our prior work [9, 18].
Because training data is user-submitted, it may be the case that
the user has not submitted training data for all activities, or that
they have submitted insufficient training data (e.g. only a few
examples) for some activities. Thus, before inducing a personal
model, Actitracker checks to make sure that it has at least one
minute of accelerometer data for each of the walking, sitting, and
standing activities before building a model. This way the user’s
personal model will be able, minimally, to predict these activities.
If they later submit training data for additional activities, their
model will be rebuilt using both their old and new training data,
and the new model will be able to predict the additional activities.
In the future we may implement hybrid models, where data for
ALGORITHM 2:
6.1.1 Body Location of Phone
k = (lg( e*input_count ))/output_count;
for(i = 0; i < output_count; i++)
select( ceil( (1/e)*exp(i, k) ) );
The original activity recognition research that was done in support of Actitracker assumed that the phone was located in the
front pants pocket [7, 10], and we do recommend that the user
carry their phone in that location. If they do not, the results could
be compromised, although our training mode will allow other
body locations to work if the movement at that location is sufficiently different to distinguish between the various activities.
The question of where and how people carry their smartphones
has been studied [2, 5] and quantitative statistics have been captured. While many factors can come into play (e.g., gender, age,
nationality) our user experiences are quite simple: the recommended phone location is not an issue for men but is a huge issue
for women. Both the research and our user experiences show that
women carry their phones in a variety of locations, namely: purse,
back pocket, front pocket, hand, and jacket pocket. Women typically do not use the front pants pocket because the phone will not
fit. But although the back pocket would probably provide an adequate sensor signature for activity recognition, women transfer the
phone to their hand or a table prior to sitting down. This is not
ideal since they may continue to move around, although if they do
remain seated the phone positioned on a stationary table will fortuitously lead to the proper activity—since it is in a similar position as if it was in the user’s pocket. Nonetheless, the issues are
significant enough that women are very likely to avoid this service
or stop using it. This is backed up by our user statistics, which
show that women make up 20% of our registered users but, significantly, generate only 13% of our activity data. As discussed in
Section 7 we plan to address this by integrating smart watches
into Actitracker, but this will remove one key advantage of our
system for most women—that it only requires a smartphone.
missing activities is taken from a panel of other users, or from
users with similar physical characteristics.
Users have a high degree of control over what training data
they submit, so it is possible that they will submit training data
with a severe class imbalance (e.g. one hour of sitting data and
only a few minutes for other activities). To prevent this from unduly biasing the predictions of the induced activity recognition
models, we down-sample any activity for which there are more
than three times that user’s mean number of examples per activity.
We assume that the most recent examples will be the most useful
in classification, since a user’s gait may change over time due to
injury or age. However, old examples may still contain useful and
diverse information about their gait. Thus we designed our subsampling process as an exponential function that selects a few old
examples and many recent ones. It is defined in Algorithm 2.
5.4 Prediction
Unlabeled examples are classified using the personal Random
Forest model for their user, if one is available, or else with our
default impersonal/universal Random Forest model. This universal model was generated by researchers on high quality data gathered under lab conditions, as described in our prior work [10].
This model is known to perform reasonably well on unseen users,
with an average accuracy of 75% (although there is considerable
variation around this number from user to user). While the performance of these impersonal models is not nearly as good as that
of the personal models (which have accuracies generally above
95%), they do perform at least as good as the impersonal models
generated by other researchers working with similar activities
[10]. This use of a default impersonal model allows new users of
Actitracker to start using the system right away. They can later
evaluate whether they are satisfied with the performance of the
system and train a personal model for increased accuracy.
Prediction results are stored as a set of probabilities. For each
10-second example, the probabilities that during that time the user
is walking, jogging, sitting, standing, or climbing stairs are all
stored. This allows displays and summaries of activity to take into
account the classifier’s uncertainty.
6. USER EXPERIENCES
User experiences have been collected via a formal on-line survey, which also allows free-form comments, and by more informal feedback from our own researchers and early adopters. The
surveys include a short daily survey and a more comprehensive
survey meant to be filled out only once. Strategies for addressing
many of the weaknesses are briefly mentioned in this section or
are discussed in Section 7 under future work.
6.1 Usability
Usability relates to the ease of use and learnability of a humanmade object. Actitracker was designed to be easy to use—ideally
you just “set it and forget it.” Overall, our responses indicate that
Actitracker is an easy tool to learn. This is probably due to the
extremely simple client interface and the quality documentation.
However, there were two key issues related to ease of use, which
involve the positioning of the device on the body and battery usage (i.e., power consumption).
6.1.2 Battery Usage
The other key issue with usability is the impact that Actitracker
has on the smartphone battery life. The results of the user survey,
provided in Figure 5, are consistent with our team’s experience—
Actitracker seems to have a modest but significant impact on battery life, often reducing the battery life by 20%-30%. Although
the survey does not explicitly ask what impact this reduction in
battery life has on their phone usage, it is clear based on our personal experiences that this additional drain sometimes prevents
the phone from lasting a complete day. A closer analysis of the
data further confirms our own experience, which is that the impact
of Actitracker usage on battery life seems to fluctuate dramatically on different days—with no immediately apparent explanation.
We are investigating this phenomenon.
45%
40%
35%
30%
25%
20%
15%
10%
5%
0%
None
~10%
20%-30%
30%-40%
40%-50%
>50%
Figure 5. Perceived reduction in battery life due to app.
6.2 Accuracy and Efficacy
5
In this section we discuss the accuracy and efficacy of the system, mainly through the perceptions of the users. This could arguably be more important than actual accuracy, since perceptions
will drive whether users continue to use the service.
Our surveys ask about the perceived accuracy of the service,
both at an overall level and for specific activities. The results for
the overall accuracy are summarized in Figure 6 and Figure 7.
Figure 6 shows the responses to the assertion “Overall the app is
accurate at measuring my activities.” The scale for this statement
is the same as for most of the accuracy-based questions, where
“1” means that they disagree with the statement and “5” indicates
that they agree with the statement. A “3” is interpreted as meaning
that the app results are often correct (i.e., more than 50% of the
time) but do not fully meet expectations. Figure 7 shows the responses to the assertion “Do you think that the app accurately
measures the overall amount of physical activity that you do?” In
this case, the scale is set so that “3” corresponds to the ideal value
(balanced), whereas “1” corresponds to under predicting the total
amount of activity and “5” corresponds to over predicting it. Note
that one can misclassify some activities while providing an accurate assessment of the overall amount of physical activity.
The results in Figure 6 and Figure 7 are quite positive, but
show that there are errors and that there is room for improvement.
The results concerning the accuracy of the specific activities are
summarized in Figure 8. The assertion was “I feel that my ___
results were accurate,” where the blank was filled in with the appropriate activity. The scale was the same used for Figure 6,
where 1 corresponded to “disagree” and 5 to “agree.” Only the
averaged values are shown.
The survey results show that the service does generally provide
good results, but with room for improvement. Specific comments
from users indicate that often the results are highly accurate—
4.3
4
4.3
3.9
3.7
3
3
2
1
Walking
Stairs
Jogging
Standing
Sitting/Lying
Figure 8: Response to “app accurately predicts specific activity”
60%
for example, the timeline perfectly indicates when there is a long
walk, with virtually no misclassifications during the walking period. Similarly, one may walk up and down between levels in one’s
home and the short episodes of stair climbing are nonetheless
correctly reflected in the timeline chart. However, there are other
times when basic activities are mistaken and these results are glaring. We believe that a major source of such errors is due to changing orientations of the phone within the pocket, which are not
adequately taken into account in our current system. Solutions to
this problem are discussed in Section 7.
Some of the specific comments that we have received also
shows that the system is able to properly reflect a mixture of activities. For example, the activity of “snow shoveling” appears as
a mixture of “walking” and “standing.” Most users agree that
training yields much improved results and that the results are quite
poor without training. We do not have much information on the
performance using the universal models “in the wild” because we
recommended that all users utilize the training mode as soon as
possible. But our study in a controlled environment shows that the
personal models greatly outperform the impersonal models [10].
One of the metrics that we created was the FitDex, which, as
described in Section 4.3, summarizes a user’s total level of activity in a single number. When asked whether this single number
appropriately summarized their total amount of activity, the mean
response using our normal 5-point scale (1=disagree and 5=agree)
was 3.5. Overall, we have found that the FitDex does tend to correlate with how active one is each day, but the values are poor
when one runs Actitracker for only part of the day. This is a consequence of our current assumption, which is that a user is active
only when the tool is running and confirms that they are active.
We could address this by setting the FitDex relative to the number
of hours it is collecting data, but we wish to keep the current
scheme to encourage users to run Actitracker all day. Thus we
plan to modify the service to apply a threshold and only generate
the value when that threshold has been met.
50%
6.3 Objective Assessment of Performance
35%
30%
25%
20%
15%
10%
5%
0%
1 (disagree)
2
3
4
5 (agree)
Figure 6. Response to “app provides accurate predictions.”
40%
30%
20%
10%
0%
1
(under predicts)
2
3
(balanced)
4
5
(over predicts)
Figure 7. Response to “app predicts proper amount of activity.”
Our prior research was able to measure the accuracy of our activity recognition models with relative ease because the experimental setup was very precise—subjects were told to perform
specific activities for specific amounts of time, in specific locations [7,10]. It is extremely difficult and time-consuming to generate such objective performance metrics “in the wild” (i.e., in a
fully natural setting). Nonetheless, such objective metrics are
important, even given the user satisfaction metrics from the survey results, described in Section 6.2. In this section we discuss the
performance results for three Actitracker subjects, who kept a
detailed diary of their activities for a 12 hour period. These subjects had sufficient training data so that they each had personal
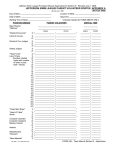
Table 1. Partial activity diary entry for subject 1.
Duration
18:24 - 18:34
18:35 - 19:27
19:27 - 19:33
19:33 - 19:40
19:40 - 19:42
19:42 - 19:55
19:55 - 19:58
19:58 - 21:27
Activity
Standing
Sitting
Wander about house (walk/stand)
Sit down to eat chili
Get water to drink (thirsty)
Eat while sitting down
Walk to work desk
Sit at work desk
activity recognition models. A sample of one of these diaries is
provided in Table 1.
The times are noted to the nearest minute and the activities are
described briefly, but are not always mapped precisely to a single
basic Actitracker activity. For example, “wander about house”
really means walking about, but also includes time spent chatting
while standing. In cases like these it is not simple to identify individual activities, and any real attempt to do so would require
tracking activities at the second-level rather than minute-level.
Tracking at this fine level of granularity would tend to interfere
with the subject, thus invalidating the purpose of the evaluation,
unless a less intrusive mechanism, such as video tracking, were
used. But this would be very costly and time consuming (e.g.,
each motion would also have to be analyzed carefully) and might
still interfere with the natural behavior of the test subjects. Furthermore, some activities are fundamentally a mixture of two or
more basic activities, and such a system would still not enable one
to break them down precisely into their component parts.
The evaluation process involves querying the Actitracker database for the activity results for the appropriate user over the specified times, and comparing those results so the actual activity (or
activities) noted by the user. Because Actitracker issues predictions at 10 second intervals but the users track times at the minute
level, if the evaluator noticed a small time shift in the transition to
a new activity, the transitions were essentially aligned to remove
any errors due to minor inaccuracies in time. In cases like the
“wander about house” activity mentioned earlier, where the user
notes that it is a mixture of two activities, our evaluation process
counts either activity as correct. The results for the three test subjects are provided in Table 2.
The evaluation process used to measure Actitracker accuracy
for the three subjects also identified where most of the errors occur. Subject 1 had the “walking” and “standing” activities occasionally classified as “sitting/lying down.” These errors were sporadic and were generally within long periods of correct classifications, so a user would most likely ignore or barely notice these
errors in the timeline view. Subject 2 sometimes had “walking”
mislabeled as “stairs,” which is the most common misclassification for the “walking” activity [10], but also had a very substantial
amount of “sitting” misclassified as “standing.” Further analysis
showed that these errors came from the end of the day when the
subject sat in a chair that is different from his normal chair. This
other chair accounted for 3 hours and 23 minutes of “sitting” and
this activity was mislabeled for 1 hour and 32 minutes of that
Table 2. Actitracker Activity for 3 users over a day.
Subject #
1
2
3
Ave
Accuracy
91.2%
79.5%
98.1%
89.6%
time; this one error explains most of subject 2’s errors. Subject 3
had a very high accuracy and most of the errors came from misclassifying short periods of “walking” as “lying down/sitting”.
This evaluation process was quite informative, although it does
place a burden on the subject. We are expanding our number of
test subjects and are trying to simplify the process of keeping the
diary. We will develop a simple app to assist with this, which will
let a subject select an activity from a list of high level activities
(e.g., dishwashing) and basic activities (e.g., walking). The app
will then append a timestamp automatically, which will be far
more precise than the current method that only tracks the time at
the level of minutes. This app would, however, have to be run on
a second phone or other device, to avoid interference with the
normal activity recognition process.
7. CONCLUSION AND FUTURE WORK
This paper described a deployed smartphone-based activity
monitoring application called Actitracker. This service provides
the user with an accurate assessment of the amount of activity that
they are performing and allows them to monitor the impact of any
behavioral changes. The goal of this service, or tool, is to improve
people’s health by combating the many harmful diseases and conditions associated with inactivity. Thus, this is a tool that uses data
mining for social good. The collected data will also be made
available to researchers and can also be used for large scale epidemiological studies of activity—thus providing additional benefits for society.
We faced many challenges while developing and deploying
this tool, and learned several lessons—which we plan to use to
improve the tool. One key lesson that we learned was that some
people, mainly women, rarely carry their phone in their pocket.
This impacts the utility of our service. We hope to address this by
making our models more flexible, so that they can adapt to different body locations. This can be done by having users provide
training data while the phone is in different locations, which can
enable the models to learn to identify the phone location. We will
also address this issue by providing support for alternative sensors, such as those located in smartwatches. We are currently
working on integrating the Pebble smartwatch into Actitracker
and hope to release a Pebble app.
The movement of the phone as a person moves has also been
recognized as a problem. We plan to address this by either coming
up with features that are not so sensitive to the phone’s orientation, or by explicitly compensating for changes in orientation
(which can be determined by the accelerometer and gyroscope).
We have also found that battery power is an issue, although
this was not totally unexpected given the resource limits of modern smartphones. We believe that we can improve the energy
efficiency of our app in many ways, such as using an adaptive
scheme that does not poll the sensors as frequently when the user
(i.e., phone) appears to be stationary. We are also investigating the
impact of moving the data preprocessing and transformation steps
to the phone, which will greatly reduce the amount of power
needed for data transmission.
We have already planned some additional significant enhancements to the system, which should make it more effective.
These include iPhone support, which is under development, and
integration with social media sites such as Facebook to better
encourage changes in activity via positive social influences. Future work will also assess the tool differently—rather than focusing on accuracy of the models, it will focus on how effective the
tool is at fostering positive changes in behavior.
8. ACKNOWLEDGMENTS
This material is based upon work supported by the National
Science Foundation “Smart Health and Wellbeing” program under
Grant No. 1116124, a Google Faculty Award, and a variety of
Fordham University faculty and student research awards.
9. REFERENCES
[1] Blair, S. N., Kohl, H. W., Paffenbarger, R. S., Clark, D. G.,
Cooper, K. H., and Gibbons, L. W. (1989). Physical fitness
and all-cause mortality: A prospective study of healthy men
and women. Journal of the American Medical Association,
262, 2395-2401.
[2] Cui, Y., Chipchase, J., and. Ichikawa, F. 2007. A cross culture study on phone carrying and physical personalization. In
Proceedings of the 2nd international conference on Usability
and Internationalization, 483-492.
[3] Fox, S. M., Naughton, J. P., and Haskell, W. L. 1971. Physical activity and the prevention of coronary heart disease. Annals of Clinical Research, 3, 404-432.
[4] Gerhardsson, M., Norell, S. E., Kiviranta, H., Pedersen, N.
L., and Ahlbom, A. 1986. Sedentary jobs and colon cancer.
American Journal of Epidemiology, 123, 775-780.
[5] Ichikawa, F., Chipchase, J., and Grignani, R. 2005. Where’s
the phone? A study of mobile phone location in public spaces. In Proceedings of Mobility 2005 Conference on Mobile
Technology, Applications, and Systems, 797-804.
[6] Koplan, J. P., Liverman, C. T., and Kraak, V. I. (2005). Preventing childhood obesity: health in balance, National Academies Press, Washington DC.
[7] Kwapisz, J. R., Weiss, G. M., and Moore, S. A. 2010. Activity recognition using cell phone accelerometers. ACM
SIGKDD Explorations, 12(2):74-82.
[8] Leonard, H. There Will Soon Be One Smartphone For Every
Five People In The World. Business Insider. February 7,
2013. [http://www.businessinsider.com/15-billionsmartphones-in-the-world-22013-2]
[9] Lockhart, J.W., Weiss, G.M., Xue, J. C., Gallagher, S.T.,
Grosner, A. B., and Pulickal, T.T. 2011. Design considerations for the WISDM smart phone-based sensor mining architecture. In Proceedings of the KDD Fifth International
Workshop on Knowledge Discovery from Sensor Data, San
Diego, CA, 25-33.
[10] Lockhart, J.W., and Weiss, G.M.. 2014. The benefits of personalized models for smartphone-based activity recognition.
In Proceedings of the 2014 SIAM International Conference
on Data Mining.
[11] Oberman, A. 1985. Exercise and the primary prevention of
cardiovascular disease. American Journal of Cardiology, 55,
10D-20D.
[12] Paffenbarger, R. S., Jr., Hyde, R. T., Wing, A. L., and Hsieh,
C. C. 1986. Physical activity, all-cause mortality, and longevity of college alumni. New England Journal of Medicine,
314, 605-613.
[13] Physical inactivity a leading cause of disease and disability,
warns the World Health Organization. [http://www.who.int/
mediacentre/news/releases/release23/en], 2002.
[14] Powell, K. E., Thompson, P. D., Caspersen, C. J., and
Kendrick, J. S. 1987. Physical activity and the incidence of
coronary heart disease. Annual Review of Public Health, 8,
253-287.
[15] Reed, B. “Wearable computer shipments seen hitting 64
million in 2017.” Yahoo! News. October 25 2013.
[http://news.yahoo.com/wearable-computer-shipments-seenhitting-64-million-2017-014532724.html].
[16] Siscovick, D. S., LaPorte, R. E., and Newman, J. M. 1985.
The disease-specific benefits and risks of physical activity
and exercise. Public Health Reports, 100, 180-188.
[17] United States. Public Health Service. Office of the Surgeon
General, et al. 1996. Physical Activity and Health: A Report
of the Surgeon General. Government Printing Office.
[18] Weiss, G. M., and Lockhart, J. W. 2012. A comparison of
alternative client/server architectures for ubiquitous mobile
sensor-based applications. In Proceedings of the Ubicomp
2012 1st International Workshop on Ubiquitous Mobile Instrumentation, Pittsburgh, PA.
[19] Weiss, G.M., and Lockhart, J.W. 2011. Identifying user traits
by mining smart phone accelerometer d. In Proceedings of
the Fifth International Workshop on Knowledge Discovery
from Sensor Data, San Diego, CA, 61-69.
[20] Wireless Sensor Data Mining (WISDM) Datasets. Fordham
University WISDM Lab. [http://www.cis.fordham.edu/
wisdm/dataset.php]