Download VibWire-108 Manual - Keynes Controls Ltd
Transcript
VibWire-108
8 Channel Vibrating Wire Sensor Interface
User Guide & Installation Manual
Version 1.09
Last updated 17/04/2014
contact: Keynes Controls Ltd - [email protected]
VibWire-108 User Manual V1.09
1
WARRANTY
Keynes Controls Ltd warrants its products to be free of defects in materials and workmanship, under normal use and service for
a period of 12 months from the date of purchase. If the unit should malfunction, it must be returned to Keynes Controls for
evaluation, freight prepaid. Upon examination by Keynes Controls Ltd, if the unit is found to be defective, it will be repaired or
replaced at no charge.
However the WARRANTY is VOID if the unit shows evidence of having been tampered with or shows evidence of being damaged
as a result of excessive corrosion or current, heat, moisture or vibration., improper specification misuse outside of the companies
control.
Components which wear or become damaged by misuse are not warranted. This includes batteries, fuses and connectors.
VibWire-108 User Manual V1.09
2
Introduction
The following document is the User Manual and installation guide for the VibWire-108 range of instruments.
The User is expected to have some prior knowledge of the SDI-12, RS-485 or Modbus network and protocols since this manual
is not meant as a teaching aid for network applications.
The VibWire-108 family of vibrating wire sensor interfaces have been designed to interface vibrating wire sensors from any
manufacture to a data logger, PC data acquisition system, or SCADA applications.
The principle operating feature of the VibWire-108 is its ability to accurately measure and report the vibrating wire sensor
frequency. The instrument uses an auto-resonance technique to energise the sensor coil and adjusts the ping rate automatically
to follow the sensor operation. The auto-resonance feature enables the sensors to be automatically configured as the instrument
adjusts the coil excitation to maximise the signal to noise ratio without excessive strain put to the sensor coil.
1435.2
Hardware Options
VibWire-108-RS485
VibWire-108-SDI12
VibWire-108-Modbus
VibWire-108-Analog
with RS-485 network option
with SDI-12 network option
with RS-485 Modbus option
with analogue output option
Dynamic & Static Measurement Applications
The VibWire-108 is ideally suited to static measurement applications. In applications requiring samples rates of 1 - 10 Samples/
Sec then a new keynes Controls product the VibWire-101-RS232 will be required. See
http://www.aquabat.net/HighSpeedVW/high-speed-vw101v1.html
Configuration
For SDI-12, RS485 and Modbus network operations the sensor input ranges are automatically assigned. The only time the
VW-108 requires any sensor frequency configuration is when the analogue output representation of the input signal is being used.
SI Units
The VibWire-108 can be set-up to supply results directly in units of Hz, Digits (Hz2) , and Engineering units. The vibrating wire
sensor engineering unit conversion is carried out using the industry standard quadratic equation expansion. The vibrating wire
sensor thermistor values are converted to temperature using the Steinhart-Hart equation to give values in Deg C or can be
supplied in raw mV format.
VibWire-108 User Manual V1.09
3
Features
8 x 4 Wire Vibrating Wire Sensor Inputs
Resolves the VW signal to less than 0.001 Hz
(industry standard 0.1 Hz)
Gas Discharge Tube Sensor Protection
Real-time Frequency Display - 5 digit
Audible Output
Auto Resonance VW Excitation
SDI-12 Network Support
Firmware Upgrade facility
Automatic VW sensor configuration
Digital communications to remove noise sources
and errors.
Simplified configuration and data logger support.
Output - Frequency, Digits, SI Units, Temp Deg C
Steinhart-Hart Thermistor Linearisation Support
Integrated Polynomial Linearisation - Quadratic Support
direct from VW sensor calibration data sheet.
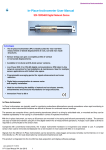
Photo VibWire-108
Field Operations
All of the VibWire-108 family of interfaces contain a real-time 5 digit, 7 segment LED display that can be used to show real-time
sensor frequencies for the vibrating wire sensors, and to configure the most commonly used features of the instrument. This
feature is useful when configuring and testing sensors in the field.
The VibWire-108 automatically resets to the network operation after a time-out period of 10 minutes and so prevents a User
leaving in the wrong mode of operation. This feature ensures the instrument is always ready for operation and is useful for widely
distributed applications and systems deployed in hard to reach locations.
Terminal Port
The VibWire-108 supports a terminal port configuration and upgrade facility. The terminal port can be used by any industry
standard terminal emulator software such as the Microsoft Hyper-terminal or Token-2. The terminal port enables the vibrating wire
sensor calibration factors to be stored easily into the instrument.
Fully Integrated Data Recording Solutions
The VibWire-108 can be connected to any suitable third party data logger or communication system supporting SDI-12, RS-485
or Modbus operations. Simple industry standard commands are used to make a reading and acquire data.
The Modbus network protocol is supported for easy integration into SCADA applications.
Q-LOG
The VibWire-108 is fully integrated into the free Keynes Controls Q-LOG data recording and display software. The Q-LOG
application software enables the VibWire-108 to be used to create PC based data recording and display solutions with little or no
programming experience.
The Q-Log software can be downloaded for free
http://www.aquabat.net/QLOGFree/qlogv2.html
Copyright
Keynes Controls 2010- 2011 Release Version 1.08
1.0
Care & Maintenance
The VibWire-108 family of products have been designed for long term operation and so will operate reliably for many years as
long as the instrument is not mis-used and operated as shown in the manual..
Step 1
Remove any signal cables and terminal blocks from the instrument.
Step 2
Clean the 4 and 5 way plug and sockets using ionised water to remove the buildup of any dirt or foreign bodies that build up on
the termination pins. It is essential to remove any grease that can cause corrosion to the pins.
Step 3
Allow the sockets to dry out before connecting any signal cables.
Description
Operating temperature
–10 to 60 °C
Storage temperature
–10 to 85 °C
Operating humidity
10 to 90% RH, non-condensing
Storage humidity
5 to 95% RH, non-condensing
2.0
Default Factory Settings
All instruments are set for
No of Channels = 8
Default ID = 0
Models VibWire-108-SDI12, VibWire-108-RS485, VibWire-108-Modbus
3.0
Temp = 8
Required Software
The VibWire-108 requires a terminal software package supporting VT100 emulation only.
Recommended software
Microsoft Hyper-terminal
Token2
3.1
Q-Log Software
The Q-Log data acquisition and display software operates with all of the USB-SDI12 and USB-RS5485 media converters
Q-Log enables the VibWire-108 to operate with a PC or laptop and give the User access to the data in a familiar Windows
environment
When used with a USB-SDI12-Pro or USB-RS485-Pro media converters, the VibWire-108 can directly powered from the
PC/Laptop USB port.
Download at
http://www.aquabat.net/QLOGFree/qlogv2.html
Warranty Information
The information in this document is subject to change without notice. Keynes Controls Ltd . has made a reasonable effort to be sure that the information contained herein is current and accurate as of the date of
publication.
Keynes Controls Ltd. makes no warranty of any kind with regard to this material, including, but not limited to, its fitness for a particular application. Keynes Controls Ltd will not be liable for errors contained herein or
for incidental or consequential damages in connection with the furnishing, performance, or use of this material.
In no event shall Keynes Controls Ltd . be liable for any claim for direct, incidental, or consequential damages arising out of, or in connection with, the sale, manufacture, delivery, or use of any product.
VibWire-108 User Manual V1.09
5
4.0
Front Panel
0V
+12V DC
VW Sensor Inputs
1435.2
Fig 1
Analogue Output Channels
Not Used in SDI-12/RS-485 & Modbus version
instruments
Menu Out
Button
Down Button
4.1
Menu In
Button
7 Segment Display
Up Button
Circuit Board Features
Gas Discharge
Protection
Transorb
Speaker ON/OFF Switch
Fig 2
Terminal Port
9 Pin DTE
Ceramic
Speaker
Real-time 5 Digit
7 segment display
7 Segment Display
VibWire-108 User Manual V1.09
6
5.0
SDI-12 Serial Network Connection
The following page describes connecting the VibWire-108 to an SDI-12 network.
SDI-12 data
Earth
Earth
0V /Gnd - SDI-12
12V DC - SDI-12
Earth
Earth
NPN-4
NPN-3
NPN-4
NPN-3
485 + / SDI-12
485 + 12V
Gnd
Fig 3
Earth Connection
The menu system shown below is used by
the AquaLOG data logger.
Main Menu
Ensure that a good Earth
connection is made and fitted to
each instrument in order that the
lightning protection discharge
tubes will operate.
1 Device Setup
2 Zigbee Mode Settings
3 GPRS Mode Settings
4 USB Memory Stick Settings
5 SDI12 Setup
6 Formulas
7 Alarms
8 Logging Operations
9 Diagnostics
A System Maintenance
U Up. T Top.
Lightning protection is provided for
all VW sensor inputs and between
the SDI-12 - 0V connection.
- SDI-12
Gnd/0V
+ SDI-12
Acquire data across the SDI-12
network for 2 x VW108 instruments and store data into the
logger starting at the free cell [D]
in the data table.
[D] 3M! 3D0! 7M! 7D0!
5.2
Multi-Instrument Solutions
SDI-12 Network Connection
Use the same network connection for any
3rd party logger
5.1
For multiple instruments to operate together on an SDI-12
network then they must each have a unique ID number
assigned.
SDI-12 Network Operation
As soon as a measurement instruction is sent by the data logger
the the SDI-12 bus is activated and all the instruments are
powered on. Upon receipt of the correct start measurement
command then then a scan of the sensors is made and data is
sent in turn to the data recorder. After all data is received the the
instruments are all powered off.
The SDI-12 multi-drop network requires only 3 wires to be
connected between instruments for the communication of data.
This ensures that the installation and use of the SDI-12 network
is a very simple operation. The VibWire-108 is powered by the
SDI-12 network +12V and 0V supply operations. The SDI-12
network only goes active during a measurement operation and The image below shows how a simple multi-instrument system
is switched off at any other time. The SDI-12 network is is connected together to a data logger.
controlled by the data recorder.
5.3
PC Data Acquisition System
5.4
Multi-instrument Data Logger Solution
Figure 5 below shows how a typical multi-instrument
data logger system is wired together.
Additional Information
The USB-SDI12 media converter only controls
the network lines. Individual instruments use
their own local power supply and are active
continuously.
- 485
Example of multi-instrument
SDI-12 Application
+ 485
Expansion
Port
SDI-12 Gnd
SDI-12 +12V DC
SDI-12 Data
Range 0 .. 100 m
1435.2
Fig 5
SDI-12 Network
SDI-12 Network
Fig 4
1435.2
1435.2
2135.8
1435.2
1435.2
2135.8
VibWire-108 User Manual V1.09
7
6.0
RS-485 Serial Network Connections
Earth, -RS485, +RS485 lines are connected in common to all units
RS485 + Common to all instruments
RS485 -
RS485 - Common to all instruments
RS485 +
12V DC
0V
Earth
Earth
Earth
Earth
NPN-4
NPN-3
NPN-4
NPN-3
4
485 + / SDI-12
485 + 12V
Gnd
1
Control Signal Lines
1
2
3
4
Gnd
Power
- RS485
+ RS485 / SDI12
Fig 6
- RS-485
12V DC
6.1
Gnd/0V
+ RS-485
Earth Connection
Ensure that a good Earth connection is made and fitted to each instrument in
order that the lightning protection discharge tubes will operate.
Lightning protection is provided for all VW sensor inputs and between the
RS-485 - 0V pins.
Important Note
Failure to fit the Earth connection will prevent the lightning protection from
operating.
RS-485 Network Connection
6.2
PC Data Acquisition System - RS-485 Solution
Additional Information
A PC based RS-485 system can operate with up to 32 instruments and to a direct network span of up
to 1000 m. This is an ideal solution for large distributed applications.
The USB-RS-485 media converter only controls the network lines. Individual instruments use their own
local power supply and are active continually.
- 485
Fig 7
+ 485
Expansion
Port
2135.8
Range 0 .. 100 m
1435.2
SDI-12 Network
SDI-12 Network
1435.2
6.3
Large Scale Systems Deployment
For applications requiring a large number of distributed instruments
then simply adding a new USB-RS485 media converter to a PC will
enable multiple network systems to operate together.
The Keynes Controls Q-LOG software enables unlimited expansion
by adding new networks to a PC at any time. In fact the software is
flexible enough to enable SDI-12 and 485 networks to coexist
enabling many different intelligent sensors to be used.
2135.8
VibWire-108 User Manual V1.09
8
7.0
Modbus RS-485 Network Connections
The VibWire-108-modbus connects to the RS-485 network as shown below.
Fig 8
SDI-12 / RS-485 digital communications
Typical Q-Log Panel Meter Display
- RS-485
12V DC
Gnd/0V
+ RS-485
Laptop / PC
Computer
RS-485 Network Connection
8.0
PC/Laptop Data Recording & Display System
Isolated USB Media Converter
SDI-12 / RS485 digital network
Fig 9
1435.2
1435.2
VibWire–108
VibWire–108
Isolated USB Media Converter
Model No.
USB-SDI12-Pro
USB-RS485-Pro
The image above shows how the VibWire-108 can be integrated into a PC based
data recording and display solution using the Q-LOG application software.
The USB-SDi12-Pro and USB-RS485-Pro media converters are used to add new
network strings to the computer as and when required.. The USB-Pro range of
media converters power the VibWire-108 interfaces directly from the PC USB port.
All of the USB-Pro model media converters
can power directly the VibWire-108 interfaces
and 3rd party sensors. An external power
supply can be used when large number of
units are being used.
2135.8
0
5
Km
depending upon signal
cable quality
Q-LOG will also operate with many third party intelligent sensors .
VibWire-108 User Manual V1.09
9
9.0
Technical Specifications
The technical specification for the different models is shown below.
All of the VibWire-108 family of products use the same terminal port setting for configuration operations.
Measurement Data:
Number of channels
8 x 4 Wire VW Inputs - User Selectable
VW sensor coil resistance
to 2 K Ohm (standard):- other ranges on request
Distance of VW sensor to interface
0 .. 10 Km depending on cabling.
Frequency range
400 - 6 KHz (standard)
Other ranges on request
Frequency Resolution Accuracy
32 bit resolution 0.001 Hz
Long term stability
± 0.05 % FS max / year
Temperature range
- 50 to 70 Deg C
Temperature resolution
0.1 oC +/- 0.2 Deg Thermistor
10 K Ohm standard 3.3 K Ohm on request
Temperature accuracy
± 0.2
Thermistor measurement
A half bridge ratio-metric measurement. Value returned in mV. Is used for temperature
compensation on VW measurements using Steinhart-Hart thermistor equation or beta value.
Thermistor excitation
2.5 V DC 50 ppm /Deg C
Input resistance
10 K Ohm 0.1 % Completion resistor (Standard)
3.3 K Ohm on request
Units
Freq (Hz), Digits (Hz2), SI Units, Temperature Deg C, mV
Display only - Resolution
5 digit - 0.1 Hz
oC
/ 0.2
oF
SDI-12
Electrical Data
Voltage supply
SDI-12 10.5 to 16V DC
Current compensation SDI-12 Option only
Typical values are @ 12 V DC Excitation
Idle mode
Active / measurement
1.2 mA
8 mA
data transmission
58 mA
including frequency display
These values may change slightly between sensors. Use figures as a guide only.
Measuring time
warm up
response
500 ms
3 seconds per channel depending on the VW sensor being used (Typical)
Length of data lines
SDI-12
0 .. 100 m
SDI-12 Address mode
Supports enhanced addressing 0 .. 9
A .. Z
General Data:
Dimensions (mm)
L =260
Material
Powder coated aluminium
W = 127
D = 38
SDI-12 Digital Port
SDI-12, 1200 Baud, 7 bit, N stop bit, Even Parity - other speeds on request
CE Conformity
CE conformity according to
EN 61000-6
Weight
400 g
Communications
Terminal Port
9 Way Male - 9600 Baud 8 data, No Parity, 1 stop bit, No Flow control - DTE
SDI-12 Digital Port
1200 Baud, 7 bit, N stop bit, Even Parity - other speeds on request
RS-485 Network Settings
1200 Baud, 7 data bit, N stop bit, even parity
RS-485 Network Settings - modbus
9600 Baud, 8 data bit, 1 stop bit, even parity
10.0
System Test - Power on sequence
The instructions are the same for all models.
Step 1 - Power on the VibWire-108.
Response
Apply 12V DC to the power connector shown on Fig 1, Page 6
The VibWire-108 will briefly show the message ‘HELLO’ on the 5 Digit LED Display.
Step 2 - The display will default to ‘0’ on the LED display.
The instrument will wait until a start measurement command is received before a measurement is made.
VibWire-108 User Manual V1.09
10
11.0
VibWire-108 Digital Communications
The instructions below detail the operations to follow to operate the VibWire-108 across both the SDI-12 and RS-485 serial
networks.
No sensor configuration details need be applied to the VibWire-108 when operating with the cable free transmitter, RS-485 or
SDI-12 network. Simply connect the sensors to the interface as shown in Fig 2 and initiate the commands listed below.
Recommended Test
Use a single instrument only when undertaking initial measurements with a VibWire-108 on the RS-485 or SDI-12 network. This
simplifies the software and will speed up the understanding of the command used to obtain data. It is very easy to test the results
measured across the RS-485 and SDI-12 network with the ones shown on-board frequency display of the unit.
The results obtained across the RS-485 and SDI-12 network will be same as those shown on the display for a specified channel.
The default instrument address for a unit straight out of the box is 0 - results will be random numbers with no sensors installed.
Test Measurement
Issue command 0M! to start measurement operations. The VibWire-108 will scan all channels
0D0! returns items of data 0 Freq Chan 0 + Freq Chan 1 + Freq Chan 2 + Freq Chan 3
Ensure that each instrument used on a network has a unique ID number assigned within its configuration in order to correctly
identify the data that is being recorded.
11.1
Command Structure & Operations across an RS-485 network
The VibWire-108 uses a command structure across the RS-485 network very similar to that used by the SDI-12 network in order
to simplify the overall system operations. Understanding the control of the instrument on one network be that RS-485 or SDI-12
will make using the the unit on the other a very simple operation.
The RS-485 and SDI-12 network both operate at the same speed of 1200 baud. The RS-485 network speed can be increased at
the time of manufacture. Currently it is factory set.
Even though this is a relatively slow rate, as networks go, it is more than adequate for the small amounts of data transmitted by
the instrument. No break characters are transmitted in an RS-485 command and any sent will be ignored by the instrument.
A short delay of approximately 10 ms is added between a command received by VibWire-108 and its transmission of data since
this delay is used to allow time for the host PC to turn off its transmitter when using soft-negotiation for data flow control
operations. Under normal RS-485 data transmission operations the RTS line on the serial port is used for flow control operations.
Keynes Controls recommends an RS-485 interface with hardware negotiation is used to control the VibWire-108 across a network.
11.2
Timing Constraints RS-485 / SDI-12 Network
There are no timing constraints for the transmission of instructions and receipt of data across an RS-485 network compared to
the operations on and SDI-12 network.
Data Access Time
12 mS
8 mS
SDI-12 Data
Figure 10 shows timing delay used on SDI-12 serial bus
prior to sending data
Typically the VibWire-108 takes 5 seconds to complete the scan of the first sensor and a further 3 seconds for any other sensor
connected to the instrument. The actual response time for the instrument is dependent upon number of sensor fitted and can
interrogated using the aM! command.
11.3
RS-485/ SDI-12 Commands
The commands used by instruments on the SDI-12 and RS485 network are the same
In the following commands 'a' and 'b' are the address of the instrument and can only be integers 0 to 9 or the characters a - z.
where
'ttt' represents a time in seconds (0 to 999 seconds)
'n' or 'nn' represents a number of channels (00 to 99 channels)
\r and \n are the Carriage Return and Line Feed characters - ASCII 13 and 10.
VibWire-108 User Manual V1.09
11
11.4
Assigning Data Transmission over the SDI-12 or RS-485 Network
All of the VibWire-108 models use the SERAL option to assign the data transmission operations across the digital network. A 10
minute time-out feature ensures that the instruments cannot be left displaying real-time frequency results.
For Modbus operations the instrument scans automatically at the pre-set sample time as soon as power is applied,
see page 24 for setting the sample time.
The Modbus ID is set exactly the same as for the SDI-12 and normal RS-485 operations.
11.5
Starting Data Acquisition Operation on a SDI-12 Network
To activate the analogue output channels on the
VibWire-108.
Instrument Identifier
Each instrument deployed on the SDI-12 multi-drop network
must have a unique instrument identifier set in order to identify
specific instrument on the network. For the SDI-12 network this
identifier is 0-9. The SDI-12 ID can be expanded upon request.
1.
Starting at
2.
Select “Menu In” button
3.
Use the Up & Down Keys to select the option “SERAL”
See Page 8 for details on setting the ID number.
“Analg C0d C1d C2d C3d C4d C5d C6d C7d” are the other options available
Once the “Seral” output is selected the “Menu Out” key has to be pressed to confirm this option.
4.
The VW-108 will return to the display
SDI-12 and RS485 operations are only possible when the VibWire108 is in serial port mode. This is indicated by activating the ‘SErAL’
option.
and now the SDI-12/RS-485 port for the instrument is now activated.
11.6 Starting Data Acquisition Operation on a 485 Network
Instrument Identifier
To activate the SDI-12/ 485 output channels on the VibWire-108 Each instrument deployed on the RS-485 multi-drop network
must have a unique instrument identifier (ID) set in order to
1.
Starting at
identify specific instrument on the network. For the RS-485
network this identifier is 0-31. The SDI-12 ID can be expanded
upon request.
2.
Select “Menu In” button
3.
Use the Up & Down Keys to select the option “SErAL”
See Page 26 for details on setting the ID number using the
keyboard menu system. System Maintenance option of the
terminal menu system page 23.
“Analg C0d C1d C2d C3d C4d C5d C6d C7d” are the other options available
Once the “SErAL” output is selected the “Menu Out” key has to be pressed to confirm this option.
4.
The VW-108 will return to the display
and now the SDI-12/RS-485 port of the instrument are now activated.
11.7
Modbus version instrument
The Modbus version instrument will start the scan sequence automatically as soon as power is applied. The scan period is set
using the built in menu system using the keyboard. See page 24, section 23.3 for details.
VibWire-108 User Manual V1.09
12
12.0 Instrument Identifier
Each instrument deployed on the multi-drop network must have a unique instrument identifier set in order to identify specific
instrument on the network:
For the RS-485 network this identifier is in the range 0-9 / a-z.
For the SDI-12 network then the ID number is in the range 0..9 - Additional ID numbers are supported a .. z.
For Modbus operations the ID number is currently limited to 1 .. 32.
13.0
Start Measurement Commands
There are 2 separate commands supported by the VibWire-108 for initiating measurements across an RS-485 network and are
named ‘aM!’ and ‘aC!’. Table 1 includes a complete description of the commands used by the VibWire-108
The ‘aM!’ starts a measurement and responds as soon as the data is ready to be transmitted from the instrument. This command
returns all instrument sensor inputs as a string
The ‘aC!’ command starts concurrent operations that are used to initiate measurements upon multiple instruments deployed
across the network. The ‘aC!’ command frees the network bus so that other devices can operate freely.
14.0
Advice on the choice of measurement commands
The VibWire-108 supports both the individual and concurrent start measurement commands.
Keynes recommends using individual start measurement commands where there are large distances between devices and the
network cable installation quality is poor. Should there be substantial voltage losses on the supply cable then the additional load
of a lot of sensors scanning simultaneously may cause errors with some instruments being unable to operate correctly.
For fast results and small scale systems then the concurrent start measurement command can be used.
14.1 Possible Network Problems
Should a larger than expect load be put onto the SDI-12 network then the voltage drop between 0 V and SDI-12 12 V supply can
be as high as 2 V. If this is the case then the instrument may not respond as expected.
Copyright
Keynes Controls 2008- 2009 Release Version 1.06
VibWire-108 User Manual V1.09
13
15.0
SDI-12 Supported Commands
The following commands are supported by the VibWire-108 SDI-12 model
Description
Master
VibWire-108 Response
Acknowledge active
a!
a\r\n
Send ID:
aI!
a13KEYNESCOVibWire-1080001\r\n
provided to complement SDI-12 protocol
Part Description assigned by Keynes
Address Query
?!
a\r\n
identifies instrument address
and commonly used on single instrument
operations only.
Used to make command set SDI-12 compatible
Where a = ID number
0 - 9 (standard) / (a..z) Enhanced SDI-12
0 - 9 / a - z for RS485
Change Address:
aAb!
b\r\n
used to change instrument address from a (inital) to b
new ID for network operations
a = initial address
Start Measurement
aM!
a0268\r\n
instruct an instrument to make measurement
a = address of instrument
example 0M! starts scan for ID 0
instrument with address a returns 8 x vibwire & 8 x temp
after 60 seconds
Concurrent measurement:
aC!
a0268\r\n
Used for starting a measurement for all instruments on a
network at the same time.
start measurement instrument address a
initial response only after receipt of instruct and no
response when data ready to be sent.
Send data
aD0! aD1! aD2! or aD3!
+xxxx.x+xxxx.x+xxxx.x+xxxx.x\r\n
data returned
aND! = Vib + Vib + Therm + Therm
and has same format for each command
aD0! = channel 0 and 3
aD1! = channel 4 and 7
aD2! = channel 0 and 3
aD3! = channel 4 and 7
Thermistor 1 & 2
VibWire-108 supports 2 thermistor types
b = new address
a:b
= number 0 - 9 or a - z
This command frees RS-485 bus for other devices
Thermistor Type 1
Temperature sensor settings
VibWire Sens
VibWire Sens
Therm/analog
Therm/analog
aXT1RE!
aXT1T0! = 25
aXT1BET!
Resistance at 25 Deg C
T0 - generally 25 Deg C
Beta Value
aXT1ST0!
aXT1ST1!
aXT1ST2!
aXT1ST3!
A in Steinhart-Hart
B in Steinhart-Hart
C in Steinhart-Hart
D in Steinhart-Hart
aXT2RE!
aXT2T0! = 25
aXT2BET!
Resistance at 25 Deg C
T0 - generally 25 Deg C
Beta Value
Page 36 shows sample calibration data sheet
aXT2ST0!
aXT2ST1!
aXT2ST2!
aXT2ST3!
A in Steinhart-Hart
B in Steinhart-Hart
C in Steinhart-Hart
D in Steinhart-Hart
VW Sensor Input Channel Settings
aXCH0FN!
0 = output in Hz
1 = output in digits = F^2/1000
2 = use formula
A + B*digits + C*digits^2 + D*temperature
Parameters from the sensor calibration sheet
Steinhart-Hart Parameters
Thermistor resistance/temp calculation
Thermistor Type 2
Temperature sensor settings
Parameters from the sensor calibration sheet
Steinhart-Hart Parameters
Thermistor resistance/temp calculation
F = Frequency type
N = VW Channel 0 .. 7
digits = Frequency2 in units of Hz2
Therrmistor Type
aXCH0TN! = Thermistor type
The VW108 supports 2 different thermistor types for
temperature measurement.
where a = ID
T = Thermistor Type
N = Thermistor Channel Input = 0..7
Thermistor Temperature Calculation
aXT1TYn!
0 = resistance ratio - thermistor data sheet (Rt/R25)
a = ID
1 = Beta value calculation
1/T = 1/T0 + log(r)/Beta
n = integer 0 .. 2
0 = Voltage ratio
1 = Type 1 thermistor (use XT1RE etc. as above)
2 = Type 2 thermistor
11 = Type 1 resistance ratio, output Rt/R25
12 = Type 2 resistance ratio, output Rt/R25
99 = Output mV at terminal
where r = Rt/R25
2 = Steinhart-hart equation
1/T = A + B(Ln Rt/R25) + C(Ln Rt/R25)2 + D(Ln Rt/R25)3
VibWire-108 User Manual V1.09
14
16.0
RS-485 Supported Commands
The instrument commands for the RS-485 and SDI-12 versions of the instrument are identical except for the “%”
prefix at the start of the command. See table below
Description
Master
VibWire-108 Response
Acknowledge active
%a!
a\r\n
Send ID:
%aI!
a13KEYNESCOVibWire-1080001\r\n
provided to complement SDI-12 protocol
Part Description assigned by Keynes
Address query
%?!
a\r\n
identifies instrument address
and commonly used on single instrument
operations only.
Used to make command set SDI-12 compatible
Where a = number 0 - 9 for SDI-12
0 -9 letters a - z for RS485
A-Z
Change Address:
%aAb!
b\r\n
used to change instrument address from a (inital) to b
new ID for network operations
a = initial address
Start Measurement
%aM!
a0268\r\n
instruct an instrument to make measurement
a = address of instrument
example 0M! starts scan for ID 0
instrument with address a returns 8 x vibwire & 8 x temp after
60 seconds
Concurrent measurement:
%aC!
a0268\r\n
Used for starting a measurement for all instruments on
a network at the same time.
start measurement instrument address a
initial response only after receipt of instruct and no response
when data ready to be sent.
Send data
%aD0! aD1! aD2! or aD3!
+xxxx.x+xxxx.x+xxxx.x+xxxx.x\r\n
data returned
aND! = Vib + Vib + Therm + Therm
and has same format for each command
aD0! = channel 0 and 3
aD1! = channel 4 and 7
aD2! = channel 0 and 3
aD3! = channel 4 and 7
Thermistor 1 & 2
VibWire-108 supports 2 thermistor types
b = new address
a:b
= number 0 - 9 or a - z
This command frees RS-485 bus for other devices
Thermistor Type 1
Temperature sensor settings
VibWire Sens
VibWire Sens
Therm/analog
Therm/analog
%aXT1RE!
%aXT1T0! = 25
%aXT1BET!
Resistance at 25 Deg C
T0 - generally 25 Deg C
Beta Value
%aXT1ST0!
%aXT1ST1!
%aXT1ST2!
%aXT1ST3!
A in Steinhart-Hart
B in Steinhart-Hart
C in Steinhart-Hart
D in Steinhart-Hart
%aXT2RE!
%aXT2T0! = 25
%aXT2BET!
Resistance at 25 Deg C
T0 - generally 25 Deg C
Beta Value
See page 36
%aXT2ST0!
%aXT2ST1!
%aXT2ST2!
%aXT2ST3!
A in Steinhart-Hart
B in Steinhart-Hart
C in Steinhart-Hart
D in Steinhart-Hart
VW Sensor Input Channel Settings
%aXCH0FN!
0 = output in Hz
1 = output in digits = F^2/1000
2 = use formula
A + B*digits + C*digits^2 + D*temperature
Parameters from the sensor calibration sheet
Steinhart-Hart Parameters
Thermistor resistance/temp calculation
See page 36
Thermistor Type 2
Temperature sensor settings
Parameters from the sensor calibration sheet
Steinhart-Hart Parameters
Thermistor resistance/temp calculation
F = Frequency type
N = VW Channel 0 .. 7
digits = Frequency2 in units of Hz2
Therrmistor Type
%aXCH0TN! = Thermistor type
The VW108 supports 2 different thermistor types for
temperature measurement.
where a = ID
T = Thermistor Type
N = Thermistor Channel Input = 0..7
Thermistor Temperature Calculation
%aXT1TYn!
0 = resistance ratio - thermistor data sheet (Rt/R25)
a = ID
1 = Beta value calculation
1/T = 1/T0 + log(r)/Beta
n = integer 0 .. 2
0 = Voltage ratio
1 = Type 1 thermistor (use XT1RE etc. as above)
2 = Type 2 thermistor
11 = Type 1 resistance ratio, output Rt/R25
12 = Type 2 resistance ratio, output Rt/R25
99 = Output mV at terminal
where r = Rt/R25
2 = Steinhart-hart equation
1/T = A + B(Ln Rt/R25) + C(Ln Rt/R25)2 + D(Ln Rt/R25)3
VibWire-108 User Manual V1.09
15
17.0
Examples Of Using RS-485/SDI-12 Commands
The following examples show how to undertake the various tasks needed to setup and make readings across the RS-485 and
SDI-12 networks. The command structure between the SDI-12 and RS485 models is essentially the same except all RS-485
commands use the ‘%’ sigh at the start of all instructions.
The SDI-12 networks only supports up to 10 instruments with address range: 0 to 9 unless otherwise stated.
17.1
Changing the ID Number (address)
The following example demonstrates how to change the instrument ID number from the default factory setting 0 to 5.
Use the command ‘aAb!’
SDI-12 master sends:
RS-485 master sends
17.2
‘0A5!’
‘%0A5!
where a = Start ID
b = Final ID
Instrument responds
Instrument responds
5\r\n
5\r\n
Return New Line (5 representing new ID number)
Return New Line (5 representing new ID number)
ID Number Query
This command has been included to remain compatible with the SDI-12 and should be used for used with single instrument
operations only. Useful command when identifying ID numbers for instruments to be deployed on a multi-instrument network.
The example below is to show the ID number of a single instrument
Use the command ‘?!’ .
The ‘?!’ command only works when a single instrument is in operation.
master sends: ‘?!’
17.3
Instrument responds
3\r\n Return New Line (3 is the ID number)
Start measurements for Instruments on a network
The following example shows how to start measurements on instruments with ID numbers 2, 7, and 9 respectively.
For this example the instruments are instructed to start readings one at a time and the network is not freed up until each instrument
responds that the readings are being undertaken.
The instruments will start their measurement operations but will not send data across the network until instructed to do so.
Use the command ‘aM!’
Use the command ‘%aM!’
where a = Instrument ID Number
for RS-485 network operation
Examples of use.
The following example is based upon a simple application of 3 x VibWire-108 units connected together on a local SDI-12 network.
Unit 1 with address 2 has 4 vibrating wire sensors, Unit 2 with address 7 has 6 sensors connected and finally Unit 3 has only 2
sensors connected.
master sends: ‘2M!’
Instrument responds
followed by
‘20144\r\n’
‘2\r\n’
7M!
‘70206\r\n’
‘7\r\n’
9M!
‘ 90082\r\n’
‘ 9\r\n’
indicated readings available after 60 secs
when the measurement is completed
Note. For this command the RS-485 network will not become available until each instrument completes its measurement cycle.
SDI12 Setup
The VibWire-108 is fully integrated into the Keynes Controls
AquaLOG SDI-12 data recorder and communications interface.
The menu opposite shows a typical SDI-12 network command
as used by the AquaLOG to start a measurement on an
instrument with ID=4 and used to download 8 x frequency
inputs and 8 x temperature levels.
A power-up delay of 500 ms is needed before a measurement
can be made.
Copyright
1 Powerup delay (ms)
2 Powerdown delay (ms)
3 Device 1 Command
4 Device 2 Command
5 Device 3 Command
6 Device 4 Command
7 Device 5 Command
8 Device 6 Command
9 Device 7 Command
A Device 8 Command
B Device 9 Command
C Device 10 Command
U Up. T Top
500
0
[D] 4M! 4D0! 4D1! 4D2! 4D3!
Keynes Controls 2011- 2012 Release Version 1.09
VibWire-108 User Manual V1.09
16
17.4
Start measurements using the concurrent command
The VibWire-108 supports the aM! and aC! measurement commands. The concurrent measurement ‘aC!’ command differs from
the ‘aM!’ command as it frees the network after the initial command response to allow other devices to operate. Concurrent
measurements enable multiple instruments to respond faster to measurement commands on a network. The disadvantage of
using the ‘aC!’ command is that there can be greater power loss on the power supply network lines, so good quality network
cabling for long network strings should be used.
The ‘aC!’ command initiates the measurement cycle within the instrument to start reading from the sensors however the data still
has to be requested from the VibWire-108 before being sent across the network.
Example of concurrent measurements for instruments with ID numbers 1, 6, and 7 respectively.
For this example the instruments are instructed to start readings one at a time and the network is not freed up until each instrument
responds that the readings are being undertaken.
The instruments will start their measurement operations as soon as the command is received but will not send data across the
network until instructed to do so.
Use the command ‘aC!’
where a = Instrument ID Number.
master sends: ‘1C!’ - 4 sensors
Instrument responds
‘10144\r\n’
indicated readings available after 14 secs
The network is free for other devices as soon as this response is returned.
17.5
‘6C!’ -3 sensors
‘60113\r\n’
‘7C!’ - 5 sensors
‘70175\r\n’
Read data values from the VibWire-108
No matter which instruction ‘aM!’ or ‘aC!’ is used to initiate measurement operations for the VibWire-108 has to be instructed to
send data when it becomes available. It takes the instrument 60 seconds to make sensor values available after being instructed
to make a measurement. The vibrating wire readings are in Units Hz. The Temp/Current loop input are in Units mV..
Use the command:
‘aD0!’
‘aD1!’
‘aD2!’
‘aD3!’
-----
Vibrating Wire inputs 0 - 3
Vibrating Wire inputs 4 - 7
Temp/current loop inputs 0 - 3 (values in mV)
Temp/current loop inputs 4 - 7 (values in mV
Instrument responds:
‘a+xxxx.x+xxxx.x+xxxx.x+xxxx.x\r\n’
xxxx.x is the format of the number returned - 1 decimal place
for example to read all the sensor data back from an instrument with ID = 4
master sends: ‘4D0!’
‘4D1!’
installed
17.6
Instrument responds: ‘4+1011.3+1204.4+1101.3+1190.7’
Instrument responds: ‘4+1021.5+0000.0+1141.2+0000.0’
Vibrating wire data
0000.0 is returned when no sensor
Temperature/Current loop Data Format
For an instrument with 7 VW sensors installed.
‘4D2!’ Instrument responds: ‘4+0050.6+0056.1+0101.2+0017.0’
‘4D3!’ Instrument responds: ‘4+0051.4+0058.3+0110.2+0000.0’
No Data is available
Instrument responds ‘a\r\n’
shows results with only 7 temperature values mV
or this example ‘4\r\n’
Note. The temperature values are in mV only. Thermistor linearisation is needed is convert the results into engineering values.
VibWire-108 User Manual V1.09
17
18.0
Connection to an Analogue Data Acquisition System
The following details show how to configure and optimise the VibWire-108 analogue outputs to operate with a analogue input data
acquisition system or logger unit.
Technical Specifications - Analogue Output Ports
8 x 0 - 2.5V DC single analogue output ports - 16 bit DAC
8 x thermistor outputs - 3.3 KOhm completion resistors
User Control Keys
Menu-out
18.1
Theory of Operation
Down
Up
Menu-in
Fig 11
When defining the operation of the analogue output each channel has to have the sensor
operating characteristics defined. For the VW-108 this means that the minimum operating
frequency and span are set into the instrument.
0V
- Vin
+Vin
+2.5V
+
Therm
+
Sense
+
Therm
-
0V
- Vin
+Vin
+2.5V
AquaDAT
The VW-108 can be connected to an external data acquisition system or data logger
using the analogue output ports fitted onto the instrument. In order that the correct values
can be interpreted by the logger/acquisition system they are first scaled into a suitable
analogue signal by the VW-108 before being passed on for measurement. Each output
channel can be uniquely configured to support any manufactures sensor.
0V
- Vin
+Vin
+2.5V
+
Sense
-
Once the operating frequencies for the sensor are assigned the instrument scales the measured sensor frequency
over the range 0V = minimum frequency and 2.5V = maximum frequency.
18.2
Figure 9
Connection to an Analogue Input or Data Acquisition System
The analogue output ports are singles ended and as such, care
should be taken when connecting to a differential input channel. The example shown in Fig 9 shows the analogue output from
the VibWire-108 connected to the AquaDAT analogue data
acquisition unit. The AquaDAT supports a full differential or
- Sense = 0V (single ended ) or -Vin (Differential Input)
single ended operations and also uses an auto-ranging inputs
+ Sense = +Vin
to optimise measurements.
18.3
VibWire-108 Analogue Port Configuration
Low Frequency := 500 - 3000Hz defined in 100 Hz intervals
Range
:= 100 Hz steps.
18.4
Analogue Data Acquisition
System Example
Starting Analogue Output Ports
To activate the analogue output channels on the VibWire-108
1.
Starting at
2.
Select “Menu In” button
3.
Use the Up & Down Keys to select the option “Analg”
Fig 12
AquaLOG
AquaDAT
“Serial C0d C1d C2d C3d C4d C5d C6d C7d” are the other options available
Analogue output
on VW-108
Once the “Analg” output is selected the “Menu Out” key has to be pressed to confirm this option.
4.
The VW-108 will return to the display
and now the analogue output channels for the instrument is now activated.
Each of the vibrating wire sensor inputs can be individually configured. Setting the analogue output channel is only
needed when using the instrument with an external data logger or analogue acquisition system and is not required when
measurements are to be made across the SDI-12 and RS485 networks.
VibWire-108 User Manual V1.09
18
18.5
Optimising the Analogue Output Settings
Example 1
The VibWire-108 contains 8 independently configurable analogue output ports and they are used to represent the output
signal from the sensor.
Each analogue output is of the range 0 - 2.5V DC and any analogue output must scale a result to within this range
Care should be taken to ensure that the output signal is scaled as close as possible to sensor range
For example, Channel 0 is used to output a signal from a sensor with operating range of 1452 - 3176 Hz
It is not possible to set the output range of the DAC directly to represent the absolute range of the sensor and so it must
be set
to cover the sensor range with the minimum overlap in order to obtain the highest resolution.
a range of
0V = 1400 Hz
&
2.5V = 3200 Hz
so CH0 LF = 1400 and
CH0 RA = 3200 - 1400 = 1800 Hz
will give the highest resolution for this example
DAC Resolution output port = 16 Bit
so Frequency Resolution = 1800 / 65536 = 0.03 Hz
in practice accuracy of around 0.5 Hz can be achieved when connecting the VW-108 to an analogue data acquisition
system after allowing for the losses due to the Digital-analogue and Analogue-digital conversion process. The 0.5 Hz
measurement accuracy is achieved using the AquaDAT as the input signal measuring device..
Only when operating the VibWire-108 with an active analogue output port need the operating characteristics for the
vibrating wire sensor be defined.
For general purpose operations the analogue output should be set to represent the full operating range of the sensor.
18.6
Integration to the AquaDAT Analogue Sensor Interface
Example 2
A vibrating wire pressure sensor with operating frequency 400 Hz to 1000 Hz connected to channel 5 on the VW-108
and the analogue output is to be connected to an AquaDAT Sensor interface.
CH5 LF = 400 CH5 RA = 600
( where range = 1000 - 400)
and CH(0-7).RA is the range parameter.
the AquaDAT input channel range is to be set to 2.5 V
therefore 0V = 400 Hz and 2.5V = 1000 Hz
The AquaLOG will auto-range to optimise the signal measurement
The data logger will scale the results over the full range Resolution = 600/65536 = 0.01 Hz
In practice an measurement accuracy of 0.05 Hz will be achieved after allowing for losses in the analogue conversion
process.
Unit Conversions
Celsius to Fahrenheit
(°C × 9/5) + 32 = °F
Fahrenheit to Celsius
(°F - 32) x 5/9 = °C
Example: Convert 26° Celsius (a nice warm day) to Fahrenheit
First:
26°×9/5
=234/5
=46.8
Then: 46.8 + 32 = 78.8° F
VibWire-108 User Manual V1.09
19
19.0 Real-time Frequency Display
All of the VibWire-108 models contain a 5 digit 7 segment display and this can be used to display the instantaneous frequency
from any of the individual vibrating wire sensor inputs.
Vibrating wire sensors can be deployed a considerable distance from the VibWire-108 interface and may well be embedded into
a structure. To ensure that the sensors are operating correctly, simply observe the sensor operating frequency on the 7 segment
display and then confirm the result is within the operating range as specified by the manufacturer.
When operating in a real-time mode the instrument frequency display responds instantly to effects upon the sensor.
To use the VibWire-108 as a real-time frequency display follow the instructions below:
19.1
Assigning the real-time display to a VW sensor input
To activate the real-time frequency display
1.
Starting at
The “Basic” menu item is the first menu item available after the instrument is powered on.
2.
Select “Menu In” button
3.
Use the Up & Down Keys to select the option
The Display above shows the option required to place Channel 0 for real-time frequency output
the other options available are:
“Analg Seral C0d C1d C2d C3d C4d C5d C6d C7d”
C0d = Channel 0 ........ C7d = Channel 7
Once the “C0d” option is selected then the “Menu Out” key has to be pressed to confirm this option.
4.
The VW-108 will now display the real-time sensor frequency for channel 0.
The above example shows a typical real-time frequency result .
20.0
Sensor problems
Loud Speaker
Speaker
Loud Speaker
On/Off Switch
Should a clean ping not be heard when the vibrating wire
sensor is being sampled by the instrument the following guide
should help.
1) If there is only random noise on the speaker for the defined
channel then check the wiring and circuit resistance. The
most common error is an open circuit. Locate and fix the
broken cable.
Figure 13
Frequency
Display
2) If a ping can be heard but it is faint then the sensor cable may
be too long, or a to high cable resistance is being used
causing degradation of the signal amplitude. Finally the
gauge sensitivity may be to low.
All of the VW-108 range of instruments are supplied with an
internal ceramic speaker. The speaker can be activated and the 3) If the ping is not a pure tone then the gauge is possibly faulty.
The gauge may have become damaged during installation.
sensor ping and resultant echo can be heard.
The speaker used in collaboration of the frequency display 4) If a low frequency hum is heard then noise pickup can be a
problem. If the gauge cabling is routed near a transformer,
should enable nearly all sensors to be tested no matter their
electric motor, high current power cables, etc, then relocate
location using only the VW-108 interface unit.
or reorient the gauge for minimum pickup. Ensure that only
shielded cable is used and that the shielding is terminated at
a single point to prevent capacitive pickup.
VibWire-108 User Manual V1.09
20
21.0
Vibrating Wire Sensor Installation
The vibrating wire sensors are connected directly into the VW Sensor Input channels as shown below. The instrument contains
a completion resistor for the thermistor sensor enabling the temperature reading to be made along with the vibrating wire sensor
readings. The VibWire-108 can be used with most different thermistors used within the vibrating wire sensors.
Connection to the instrument is as follows:
Figure 14A
Sensor Inputs
+
Therm
-
+
Sense
-
+
Sense
-
Earth
Amoured Cable
Thermistor
+
Therm
-
Menu-in
+
Sense
-
Earth
VW-108
Menu-out
Earth
Earth
Earth
Earth
Earth
Up
+
Therm
-
Earth
Sheath
Analogue Outputs
Earth
Down
Earth
Figure 14
Figure 15
Use thermistor calibration
data
sheet
to
obtain
Steinhart-Hart or Beta values
for temperature sensor values
VW Sensor Input Ports
21.1
Common Earth Points
21.2
PCB Jumper Settings
All of the VibWire-108 models support
both thermistor and analogue inputs for
the range 0 - 2.5 V DC and current loop
inputs.
In order to ensure that there are sufficient points to terminate
sensor sheathing when armoured cable is used to connect a
sensor to the VibWire-108 the following terminal points are
internally wired in common:
Figure 16
Earth
Earth
Earth
Earth
Gnd
PCB Jumpers
For current loop operations such as
those 0- 20 mA, 4- 20 mA then external
excitation is required.
Jumper Open
= 0-2.5V DC
4-20 mA loop
Jumper Closed = Thermistor
On the power supply connection terminals
Therm Sense -
on both the sensor input and analogue output terminals.
21.3
Multiple Instrument Installation
Fig 14A shows how the channels are wired together to form
common earth connection. Effectively all of the Earth, Gnd, Sense
- and Therm - terminals are wired together.
Example of multi-instrument
SDI-12 Application
SDI-12 Data
SDI-12 +12V DC
SDI-12 Gnd
Any earth Sheathing from armoured cable etc.. can be
connected to any of terminals mentioned above for ease of
installation.
21.4
Fig 17
Lightning Protection
The lightning protection within the VibWire-108 cannot protect
the instrument from a direct lightening strike. It is used to protect
the instrument from local ground strikes close to the sensors
and cabling.
All of the sensor inputs are protected by transorb and gas
discharge tubes. The transorb are high capacitance devices and
are not used on all systems as they can distort low level signals
to a point where the instrument can not be accurately measured.
The transorb does protect the instrument at lower levels than the
gas discharge tube, and starts to become active around 12V.
1435.2
1435.2
1435.2
The gas discharge tube protection activates at around 92V DC Figure 17 shows how to Earth multiple instruments within a
and resets instantaneously after the lightning strike effect has single enclosure. Ensure that good quality cable of around 2.5
died away.
mm diameter core is used to connect the instruments earths
together and that a good connection to a main system earth is
Fig 14 shows the VibWire-108 connected to a system earth obtained. The Earth connection is essential for the lightening
using the Earth terminators mounted adjacent to the power protection to work.
connectors.
VibWire-108 User Manual V1.09
21
22.0
Fig 18
Terminal Port
USB-RS232
Converter
Null modem cable
Terminal Port
9 Pin - DTE
Models VibWire-108-SDI12, VibWire-108-RS485, and VibWire-108-Modbus can be
configured using the instrument terminal port.
The following instructions are for the Microsoft Windows Operating system.
Step 1:
Connect the PC/Laptop to the VibWire-108 using the USB-RS232 interface and null
modem cable as shown above. The terminal port is configured as a 9-way DTE device.
Step 2:
Plug the USB-RS232 adapter into the PC/Laptop.
From the operating system control panel select the “device manager” option. A Window
similar to that shown opposite will appear.
Select the ‘Ports (COM & LPT)’ option from the menu list to identify the Comm port
number used by the USB-RS232 interface.
Comm
Port
in
use
by the USB-RS232 media converter
Microsoft Windows 7 Device Manager Window
22.1
Terminal Port Operation
The terminal port built-in to the VibWire-108 enables
the instrument to be easily configured using the built
in menu system to set all the calibration parameters.
Microsoft Hyper-terminal - Connect To Window
22.2
Microsoft Hyper-terminal - Comm Port
Properties Window
The Terminal Port Menu System
There is no software required with this device part
The menu system can be accessed and used by any modern terminal
from a terminal emulator package, which is
emulator software such as Microsoft Hyper-terminal or Token-2 etc. The
frequently a feature included most operating
terminal software has to be VT100 compatible to operate correctly.
systems.
The example Windows above, are taken from the Hyper-terminal software,
Each VW sensor input channel can be individually
however the communication port settings are the same no matter which
configured using details taken directly from a sensor
package is used.
calibration data sheet.
Step 3
Currently the VibWire-108 supports 2 pre-defined
temperature sensors configuration options that can
Start the Terminal emulator software and configure the communications
be assigned to each VW sensor input.
port to 9600 Baud, 8 data bits, 1 stop bit, No parity.
The Comm port number used by the USB-RS232 media converter is shown
in the Windows ‘Device Manager’ Window.
VibWire-108 User Manual V1.09
22
Step 4
Power on the VibWire-108, see instructions on page 6 with the terminal port connected to a laptop as shown on page 22.
After the ‘HELLO’ message flashes on the 7 segment display and the instrument is connect to the PC/Laptop as shown on page
22, then the main menu will appear. The Comm port setting are shown in the specification table.
Main Menu
1 System Maintenance
2 Thermistor type 1
3 Thermistor type 2
4 Diagnostics
5 Channel 0
6 Channel 1
7 Channel 2
8 Channel 3
9 Channel 4
A Channel 5
B Channel 6
C Channel 7
U Up. T Top.
Fig 20
22.3
Selecting the VW sensor output units.
The following procedure is for the VibWire-108-SDI12, VibWire-108-RS485,
and VibWire-108-modbus models only.
The VibWire-108 supports output units of Hz, Digits (Hz2), and SI units.
Main Menu
Frequency proc
1 System Maintenance
2 Thermistor type 1
3 Thermistor type 2
4 Diagnostics
5 Channel 0
6 Channel 1
7 Channel 2
8 Channel 3
9 Channel 4
A Channel 5
B Channel 6
C Channel 7
U Up. T Top.
0 = Hz 1 = Digits ( Hz2) 2 = SI Units
Important Note
where SI Units is by Quadratic Expansion
Channel 0
1 Frequency proc
2 Thermistor type
3 Cal A
4 Cal B
5 Cal C
6 Cal D
U Up. T Top.
1
1
1.0022E31
-2.1550E27
-1.1929E38
-2.3069E33
The ‘Thermistor Type’ calculation option determines which
calculation is used regardless to the calibration parameters
that are configured.
22.4
Temperature Sensor Configuration
The VibWire-108 uses the in-built thermistor inside a VW sensor
to measure temperature. The menu system enables two
different thermistor sensor details to be predefined and stored
into the instrument.
Thermistor type 1
1 Type
2 Resistance at T0 (ohms)
3 T0 (Celcuis)
4 Beta
5 Steinhart-Hart 0th order (A)
6 Steinhart-Hart 1st order (B)
7 Steinhart-Hart 2nd order (0)
8 Steinhart-Hart 3rd order (C)
U Up. T Top.
1
3312
22
5234
0.0
0.0
0.0
0.0
.The menu system enables both the VW sensor linearisation
and thermistor temperature equations to be configured. The
Fig 21
thermistor resistance and therefore temperature is calculated
using the Steinhart-Hart equation. The output SI unit is in Deg
For lower accuracy temperature readings or when the
C.
calibration factors are not known then the thermistor Beta value,
The VW sensor linearisation uses the industry standard T0 and R0 parameters can be assigned.
quadratic equation to convert the VW signal into engineering
units.
The parameters for this part of the instrument configuration can
be found on the VW sensor calibration data sheet.
Warranty Information
The information in this document is subject to change without notice. Keynes Controls Ltd . has made a reasonable effort to be sure that the
information contained herein is current and accurate as of the date of publication.
Keynes Controls Ltd. makes no warranty of any kind with regard to this material, including, but not limited to, its fitness for a particular application.
Keynes Controls Ltd will not be liable for errors contained herein or for incidental or consequential damages in connection with the furnishing,
performance, or use of this material.
In no event shall Keynes Controls Ltd . be liable for any claim for direct, incidental, or consequential damages arising out of, or in connection with,
the sale, manufacture, delivery, or use of any product.
VibWire-108 User Manual V1.09
23
23.0
Modbus supported instrument
- RS-485
The VibWire-108 supports Modbus protocol across the RS-485 digital network
and acts as a slave unit only.
Gnd/0V
+ RS-485
The layout of the registers used to hold the sensor data values is shown in the
tables below.
Fig 22
23.1
RS-485 Network Connection
Set-up
The VibWire-108-modbus has the calibration factors for the
sensors installed via the terminal port. See page 22 for details.
The same procedure for assigning calibration factors is used
throughout the VibWire-108 range.
1035.6
The number and type of sensor inputs to scan is assigned from
the keyboard using the menu system. See page 26 for more
details.
The instrument scans automatically at the preset sample period
and updates the register values upon completion of the operation. New data values are only transmitted to the Modbus
master upon receipt of the Read Register Input Command.
23.2
Data Format
23.3
Scanning The Instrument
The Modbus version of the instrument stores data into a series The VibWire-108 scans the Modbus network the automatically
of 4 byte registers as shown below. Information is stored as a at a preset time period.
floating point 4 byte number. The data is Hex format with the
high word being the first 2 bytes and the last being in the next 2 The User can select from scan period of:
bytes as shown.
1S, 5S, 15S, 1 MIN, 1 HR, 6 HR, 24 HR
System Information
The following Modbus command is used to get data from the
The last 2 registers in the VibWire-108 are used to check the VibWire-108
data integrity. Register with address 32 increments upon the
completion of an instrument scan and is used to show that the Read Input Registers (FC=04) command
instrument is still operating.
Register with address 34 increments when the VibWire-108
receives a new Modbus ‘Read Input Registers’ FC=04
command.
The tables below show how the registers holding the VibWire-108 data is stored.
Address Offset
Parameter
Description
16
Chan-0 Temp
High order word
Chan-1 Temp
High order word
Chan-2 Temp
High order word
Chan-3 Temp
High order word
Chan-4 Temp
High order word
Chan-5 Temp
High order word
Chan-6 Temp
High order word
Chan-7 Temp
High order word
Number of Scans
High order word
Number of Modbus
read attempts
High order word
17
18
Address Offset
Parameter
Description
0
Chan-0 Freq
High order word
20
Low order word
21
Chan-1 Freq
High order word
22
Low order word
23
Chan-2 Freq
High order word
24
Low order word
25
Chan-3 Freq
High order word
26
Low order word
27
Chan-4 Freq
High order word
28
Low order word
29
Chan-5 Freq
High order word
30
Low order word
31
Chan-6 Freq
High order word
32
Low order word
33
High order word
34
1
2
3
4
5
6
7
8
9
10
11
12
13
14
Chan-7 Freq
15
Floating Point Data Value
Tel: 0044 118 327 6067
19
Low order word
2 Bytes
Copyright AquaBat
2011-2012
High Word
Low order word
2 Bytes
35
Low order word
Low order word
Low order word
Low order word
Low order word
Low order word
Low order word
Low order word
Low order word
Low Word
VibWire-108 User Manual V1.09
24
23.4
RS-485 Network Connection & Installation
The VibWire-108-Modbus instrument will connect to any suitable Modbus system supporting RS-485 digital communications. This
could be a plant wide SCADA solution or simply a stand-alone system running on a PC or laptop. So long as a suitable
communications port is available then the instrument will communicate.
The image below shows how the VibWire-108-Modbus units are connected to the media converter or similar 485 digital
communications port. The Modbus operations are transparent over the network. The Keynes Controls USB-485 media converter
is shown but any other similar device can be used. The VibWire-108-Modbus instrument operates as a master /slave system
where the SCADA system or data recorder is the master and the instrument acts as the slave.
Fig 23
RS-485 RS-485 +
+12V DC
Sensor Supply
2135.8
The image below demonstrates how additional units can be connected together
to create larger distributed applications.
SCADA
Application
Data
Logger
/
SCADA Application
Fig 24
RS-485 Network
Data
Recording
/SCADA Application
RS-485 Network
1435.2
2135.8
Range 0 .. 1000 m
Expansion
Port
1435.2
2135.8
The VibWire-108 supports the full 4 wire gauge input and can use any in-built
thermistor temperature sensor. All of the vibrating wire sensor interfaces and digital
network port are protected by gas discharge tube in order to prevent damage by local
lightning strikes.
VibWire-108 User Manual V1.09
25
24.0
Keyboard - User Command Summary
The details below show the keyboard menu system built into the VibWire-108
Basic
Disp
PEROD
Menu-up & Down
ID
Tra
Menu-in & Out
Per = Period
Freq = Frequency in Hz
Pst = Percentage of range
Analg
Activate analogue outputs
Per
SERAL
Activate SDI-12 or 485 ports for data
Freq
C0d
Channel 0 Real-time results display
Pst
C1d
Channel 1 Real-time results display
C2d
Channel 2 Real-time results display
C3d
Channel 3 Real-time results display
C4d
Channel 4 Real-time results display
C5d
Channel 5 Real-time results display
C6d
Channel 6 Real-time results display
C7d
Channel 7 Real-time results display
Sensor scan period
Instrument identifier = 0 - 9 SDI12 1 .. 31 Modbus 0 .. 31 A .. Z RS485
Select number and type of sensor output for data
transmission when operating in cable free mode
Updated rate for transmitted data
Tra.int
Analogue output scaling only
Low frequency
CH0.LF
Vibrating wire sensor
500
Frequency range
600
CH0.RA
700
800
100
900
200
CH1.LF
1000
300
1200
400
1400
500
1600
600
1800
700
2000
800
2200
900
2400
1000
2600
2800
3000
5000
5S
60 S
360 S
ID Range
0..255
1S 0T
2S 0T
4S 0T
8S 0T
1S 1T
2S 2T
4S 4T
8S 8T
DISP := This option is used to select the type of engineering
results that are shown on the 7 segment display.
Per = 1/ Freq = period of oscillation in mSec
Freq = XXXX.X in Hz - units changed by terminal
Pst = Percentage of range
1S
5S
15S
1MIN
1HR
6HR
24HR
PEROD := Sensor Activation Period
Defines the sensor scan period for the instrument.
The analogue output channels are updated after each scan.
1S, 5S, 15S, 1min, 1Hr, 6Hr, 24Hr.
ID := System identifier number
Each instrument requires a unique identification number that is
required to locate a specific instrument upon a network.
Currently the identifier is an integer of range 0 .. 32.
TRa := Transmission Data Options. (Not used RS485/SDI-12)
To optimise the network bandwidth in order to ensure the
maxium number of sensors can be deployed the User is allowed
the percentage of range is used to optimise the settings for the to select the number and type of sensor inputs used on the
analogue output port in order to achieve the best result
VibWire-108 for data transmission across a network.
Example. A vibrating wire sensor showing a PSt = 0.1 on the
display and settings of LF (Low frequency) of 500 Hz and range
of 2000 Hz. This indicates that the results from the sensor is only
operating over the lower 10% of the defined range i.e 500 - 700
Hz
1S 0T
2S 0T
represents 1 vibrating wire sensors - no temperature
represents 2 vibrating wire sensors - no temperature
1S 1T
2S 2T
represents 1 vibrating wire sensor - 1 temp sensor
represents 2 vibrating wire senors - 2 temp sensors
Tra.int := Defines the rate of data transmission across a cable free network.
For the assigned range above the analogue output port has a
scaling of 0 - 2.5V DC using a 16 bit DAC (65536 levels) and will The transceiver fitted inside the VibWire-108 is powered on
therefore have 0V = 500 Hz & 2.5V = 2500 Hz, so
during the data transmission operation and powered off into a
sleep mode between updates.
resolution = (2500-500)/65536 = 0.03 Hz.
The faster the data transmission rate the greater the power
However with the instrument adjusted to operate over the range required to drive the instrument. A compromise is needed to
of 500 to 700 Hz as observed above then
adjust power requirements to the amount of data to be
transmitted to guarantee that not readings are lost. (Not used
0V = 500 Hz & 2.5V = 700 Hz so resolution = 200/65536
on RS485/SDI-12 networks)
= 0.003 Hz
PEROD := Sensor Excitation Period
24.1 Keyboard Operations
This option defines the update period for the sensor excitation The keyboard menu system has been designed to be easy to
and measurement operation. There is always a trade off use. Use the menu keys
between the sensor update rate and the power supply
requirements of the instruments.
Move up and down the menu system until the desired parameter
is shown in the display. Use the ‘Up’ and ‘Down’ keys to change
For fast dynamic changes a fast sensor update rate is required the values. Once the new value is selected press the ‘Menu
but for slow static measurements only a low update rate is Out’ button to store the new value.
required.
VibWire-108 User Manual V1.09
26
25.0
Vibrating Wire Sensors
The VibWire-108 supports most manufacturers sensors and a small summary of these is shown below.
Figure 35
Encardio-rite Vibrating Wire are well tested with the VibWire-108 and are the
recommended sensor range for this product range.
Frequency signals i.e. those generated using vibrating wire sensors are particularly
suitable for demanding environments such as that often occur within Civil Engineering
applications
Figure 36
Vibrating wire sensors ideally suit the harsh civil engineering environment since the
signals are capable of long transmission distances without degradation, tolerant of wet
wiring conditions and resistant to external electrical noise.
Specifications
Figure 37
Excitation:
Voltage Protection:
Thermistor:
Over-range:
Resolution:
Accuracy:
Thermal Effect:
Operating range:
Cable:
Typical range:
Nominal zero value:
Auto-resonance
Semitron Bi-Polar 230 V
3k Ohms at 25 oC
minimum twice pressure
0.025% FSO (minimum)
< 0.25 % FSO (see Notes)
< 0.02% FSO /oC
-20 oC +100 oC
2 pair PVC outer sheath.
3500-2200 Hz
3130 Hz
For additional details contact : Encardio-Rite Ltd India
Encardio-rite
Crack meters are available with ranges up to 100 mm
Crack meter
Resolution
Accuracy
Temperature effect
Operating temperature
Cable: 2 and 4 Core screened
0.025% of range
± 0.2% of range
–0.02mm/°C (typical)
–30 to +70°C
Joint meters are available with ranges up to 100 mm
Joint meters
Resolution:
Accuracy:
Temperature effect:
Operating temperature:
Cable:
0.025% of range
± 0.2% of range
–0.02mm/°C (typical)
–30 to +70°C
2 Core screened
Gauge Type:
Gauge factor:
Measurement range:
Resolution:
Coil Resistance:
Operating temp range:
Thermal coefficient:
TSR/5.5/T surface mounting strain gauge.
3.025 x 10⁻³ micro-strain per Hz squared.
> 3000 micro-strain.
Generally better than 1 micro-strain.
Approximately 100 ohms.
-200C to 800C.
11 ppm per 0C.
Surface strain gauge
Effective Gauge length:
De-bonded length:
Overall length:
Standard diameter :
Resolution :
Strain range:
Thermal expansion:
50 mm ( nominal )
175 mm
1.39 m
15 mm
0.5 micro-strain
2500 micro-strain
12 ppm /deg C
Rebar Strain meter
Range:
Resolution:
Accuracy:
Thermal Coefficient:
Operating Temp:
3,000 micro-strain, set mid-range.
1 micro-strain
± 0.1% FS.
11 ppm / °C.
-20 °C to 80 °C.
The details on this page have been obtained from the sensor manufacturers
web sites and are liable for change at any time.
Embedment Strain Gauge
VibWire-108 User Manual V1.09
27
26.0
Main Menu - Terminal Port
Models VibWire-108-SDI12 and VibWire-108-RS485 support a terminal menu system to enable the instrument to be configured.
Refer to page 22 for details of connecting the instrument to a ‘Terminal Emulator’ program running on a PC.
This is the Main Menu that appears on
starting the menu system
Quick Menu Guide
1.
Option 4 ‘Diagnostics’ - use menu system available here to
start a instrument scan on demand and observe data.
5.
Option 5 ‘Pluck Control’ - restricts sensor ping frequency
Used when poor quality sensors with 3rd harmonic
oscillations are encountered.
Fig 38 - Main Menu
27.0
Pluck Control
The pluck control system built into the VibWire-108 is a useful feature to activate upon observing unusual spikes in what should
be steady state data values for sensors that change little over time.
Spikes in the VW Sensor Data
Depending on how well a vibrating wire sensor is made the sensor coil could become damaged, or if the sensor extreme physical
shock once it is deployed. Damage to the sensor often means the coil seating has been damaged an the sensor can oscillate at
a different harmonic than the designed fundamental frequency.
In order to obtain the correct sensor frequency in the face of oscillations from higher harmonics then the pluck control feature is
used.
Important Note
Setting the Pluck Control
The ‘Initial Pluck ‘ defines the start frequency of the sensor scan.
Go to the ‘Pluck Control’ menu as shown in Fig YY below.
By default use the automatic sensor excitation ‘0’ as this gives the best result for the majority
of sensors.
Select the channel to be configured.
The ‘Initial Pluck’ frequency is a global setting and is of use only then the same model of sensor
is used on all sensor inputs.
Enter the ‘Centre Frequency’ for the normal operation of the sensor,
The operating frequency for the VW sensor input is now limited to a minimum frequency of ½ of the ‘Centre Frequency’, and to a
maximum of 2 x ‘Centre Frequency’. This range removes the third harmonic oscillation which is a common cause of spikes in VW
data .
Worked Example
Example - setup channel 0
Press item ‘2’
Set Frequency to ‘1000’
1000
Frequency Hz
3K Hz
3rd Harmonic Spike
1K Hz
Steady State Values
0
Fig VV opposite demonstrates how a typical
spike in a stream of steady state data values
will appear to the User.
The spikes in the data are often caused by
faulty seating of the sensor coil.
The Pluck Control option will remove the false
peaks caused by sensor oscillation away from
the fundamental operating frequency.
Fig 39 - Spike in data
Low Frequency
The pluck control range
Therefore
Centre Frequency
with
Centre
Low Frequency
Centre Frequency
Low Frequency
Mid Frequency
Max Frequency
800
400
800
1600
900
450
900
1800
1000
500
1000
2000
1200
600
1200
2400
High Frequency
Range = (½ x Centre Freq) - Centre Freq - (2 x Centre Freq )
Pluck Range = (½ x 1000)
Freq
=
Centre Frequency
-
1000 -
1000
Hz
High Frequency
( 2 x 1000)
= 500 Hz to 2 K Hz with 1 K Hz centre frequency
VibWire-108 User Manual V1.09
28
28.0
Firmware Upgrade Facility
Firmware Update
Using the Terminal Port menu system
Any new firmware is sent out from Keynes Controls technical support only.
Only a competent software engineer should undertake this task.
1. From the ‘Main Menu’ select option 1 ‘Systems Maintenance’
Keynes Controls offer a back to base firmware upgrade service. A small cost
is incurred if using this service.
2. The following menu will appear -
Make sure the latest firmware which is in the form of a text
data file, is stored into a suitable location.
Example firmware for this documentation is titled ‘vw101.txt’
Fig 40 - System Maintenance Menu
3. Select option 1 ‘Upload new firmware’
Once option ‘1’ is selected then the ‘Upload new firmware’
Window, as shown opposite will appear.
Locate and select the new firmware data file.
4. Using the HYPERTERMINAL menu system
Select ‘Transfer\Send Text File’ option.
Fig 41 opposite shows how the ‘Hyper-terminal’ software
appears once the firmware file is selected and data is being
sent to the sensor interface.
Fig 42 shows how the ‘Hyper-terminal’ emulator ‘System
Maintenance’ Window will appear once the firmware has
loaded into the sensor interface correctly.
Fig 41 - Uploading new firmware
The ‘Burning’ message has to be displayed to show the new
firmware has been loaded correctly.
…...................._ appears on the screen as the firmware
loads into the sensor interface.
‘Burning’
message
shows
that
the firmware has been loaded correctly.
Fig 42 - Firmware upload successful
VibWire-108 User Manual V1.09
29
30
Terminal Port Menu Screens
Main Menu
This is the default menu that appears upon activating the
terminal menu system.
Thermistor Type 1 - Menu
Models VibWire-108-SDI12 and VibWire-108-RS485 support 2
individually configured thermistor temperature sensors.
The sensors configuration details are stored as ‘Thermistor
type 1’ and ‘Thermistor type 2’.
The menu opposite shows the thermistor type menu.
Use this menu to set the thermistor calculation to Steinhart-Hart
or Beta.
Pluck Control - Menu
The pluck control menu system defines the operating range of a
vibrating wire sensor input channels.
Each vibrating wire sensor input can be individually configured.
Low Frequency
Centre Frequency
High Frequency
Range = (½ x Centre Freq) - Centre Freq - (2 x Centre Freq)
The image opposite shows the default Vibrating wire sensor
input channel configuration menu system.
Option 1 ‘Frequency’ - Hz , Hz2 or SI units
Repeat for each sensor input channel.
VibWire-108 User Manual V1.09
30
Case Study - Bore Hole Pump Control
Stand-alone Weir Control System with Data Logger
The following examples detail the use the VibWire-108 range of
instruments within water flow and control systems. Two
examples are shown. The first example demonstrates the
VibWire-108 as a stand-alone control system used to monitor
bore hole water and the second example, shows how the
VibWire-108 is used with a data logger to report on and control
the water flow in a v-notch weir.
For applications where a control system is required to let a set
amount of water to flow and to maintain a record of events then
a control system similar to that shown below will be required.
Apart from maintaining details of flow the control unit can also
act as an alarm system and shut of water flow should the
defined limited be exceeded.
Consider the example of the V-notch weir below. A dedicated
complex formula is required to calculate the discharge over the
bottom of the notch. There are a number of different formula
The VibWire-108 can be configured to operate as a stand-alone available for this calculation but they depend upon the water
control system when used with Vibrating wire piezometers and height at different positions within the weir.
the transistor output ports.
A series of vibrating wire piezometers are used to monitor the
Fig 43 shows a sealed bore hole with 2 piezometers deployed. water height and are connected to the VibWire-108. The
The lower level sensor reports the water level height. The top VibWire-108 communicates the water height details to a prosensor acts as a reference and reports the internal bore hole grammable logger, such as the Keynes Controls AquaLOG
pressure only.
systems. The logger is used to calculate the discharge and to
record the results.
The water level height measurement can be in error if there is a
build up of gas pressure in the hole and it is to correct for gas
Fig 42 shows the basic control
pressure changes that the reference is fitted.
system showing the VW-108
connected to a logger across a
SDI-12 network
digital network.
Freq Hz
Data Logger
Borehole Water Level Control
Alarm High H2
Hysterisis Band
Alarm High H1
Alarm Low L1
Sluce Valve
Control Unit
+12v DC
Time (min)
Trans Out
Figure 41
+12v DC
Alarm Low L2
Trans Out
Hysterisis Band
The logger can be used to
produce a permanent result
record that can be downloaded
by an operator and also to trigger
the transistor outputs within the
VibWire-108 when used for alarm
level control.
1205.4
The VibWire-108 is configured to activate the digital output when
the water height exceeds the higher alarm levels. Upon detection of a water level exceeding the pre-determined upper alarm
level then the transistor output is activated to switch a relay.
The instantaneous pressure
levels are monitored by the
logger and used within the Vnotch discharge formula.
Vibrating
Wire
Pressure
Sensor
Fig 42
The relay switching can be used to activate the ignition circuit on
the pump if it is powered by a petrol engine or switch the power
supply if an electric pump is being used.
Fig 45 shows the v-notch weir
profile. The water height is
measured accurately using a
As long as the Peizometer frequency settings are defined cor- precision vibrating wire sensor
rectly and a suitable hysteresis level is set, then the VibWire-108 and these types of sensors are
can run indefinitely to control a pump to maintain the water level very accurate and stable over
within a bore hole below a pre-set level.
long periods of time.
Summary
Fig 45
Barometer
AquaLOG
1205.4
V-Notch Weir
Sensor
Vibrating
Wire
Pressure
Sensor
Reference
Peizometer
The AquaLOG can record the
vibrating wire sensor data and
convert it into engineering units.
H
Vibrating
Wire
Peizometer
Figure 43
150 m
+12v DC
Trans Out
+12v DC
Trans Out
Pump Ignition
On/Off
Fig 44
The various sensors forming the weir monitoring system are
combined within the AquaLOG to determine the correct flow rate.
The Alarm operations of the AquaLOG can then be used to inform
an operator should pre-set conditions be exceeded.
Bore Hole
VibWire-108 User Manual V1.09
31
Vibrating Wire Sensor Applications
The details below show just a few of the applications for which
vibrating wire sensors are used. The best results from the
instrumentation are only achieved when a good understanding
for the overall structural behaviour is available. The examples
demonstrate the common uses of structural monitoring within
civil engineering applications.
A lot of vibrating wire sensor applications are undertaken with
the sensors buried into the structure such as within concrete or
within a bore hole. The vibrating wire sensors maintain very
accurate results without need for re-calibration over many years
and generally more reliable than other forms of sensor, less
prone to failure in damp conditions and relatively easy to install.
Displacement sensor on the
beam and attached to the
vertical support will increase
with the sliding motion of beam
Vibrating Wire
strain gauge
Crack meter gauge expands
in length as the crack grows
in size.
Surface strain gauge
The images opposite show sister bar
strain gauges and examples of their
installation and use. The sister bar strain
gauge comprises of two lengths of ribbed
rebar welded to a central gauge section.
The central gauge section has a
miniature stainless steel, vibrating wire
strain gauge element, fitted along the
longitudinal
axis
of
the
gauge.
Incorporated within the gauge section are
two coils for excitation and output of the
vibrating wire strain gauge element. This
type of gauge is particularly rugged and
reliable. They are particularly applicable
for strain measurements in mass
concrete pours where placing of concrete
is remote and uncontrolled such as
typically occurs in diaphragm walls or
deep piles.
Crack meter
Gauge
The embedment or dumbbell gauge
(See below) is designed to measure
strain in concrete. This vibrating wire
strain gauge is typically tied to a
reinforcing cage. It is usual to install
them in arrays of three or four gauges
at several depths horizons within the
structure.
The sister bars can be connected to the
VibWire-108 instruments.
VibWire-108 User Manual V1.09
32
Appendix - A
Updated 11/12/2013
VibWire-108/101
Temperature Measurement - Using the Steinhart-Hart Equation for temperature calculation
Introduction
The following technical note shows how to obtain the thermistor resistance values for a vibrating wire temperature sensor
connected to the temperature input of the VibWire-101 or VibWire-108 interfaces.
The VibWire-108/101 vibrating wire sensor interface supports the 4 wire sensor interface. Due to the wide range of temperature
sensors used in vibrating wire sensors, it is not possible to pre-define the temperature output values from the interface in
engineering units.
Both the VibWire-108 and 101 units give the temperature values in mV. The calculation for temperature from the sensor thermistor
is shown below
The circuit below shows the VibWire-108
temperature input with pull-up resistor completion
The VibWire-101 and 108 models use 2.4 V excitation for
the sensor thermistor.
2.4V Excitation
Vtherm = Voltage across thermistor
VR
3300 Ohm Pull-up resistor
VR
A
VibWire-108
Temp Output
Level in mV
= Voltage across pull up resistor
Vibrating Wire Thermistor
Vtherm
0V
Example. A VibWire-108/101 provides an output temperature value of 1086 mV then
I therm = (2.4 - V therm) / 3300
where 3300 = pull-up resistor value
where V therm = 1.086 V
therefore
I therm = ( Excitation volt - V therm ) / 3300(Pull-up Resistor) =
(2.4 - 1.086) / 3300 = 1.414 / 3300 = 0.398 mA
using Ohms Law
Note 1086 mV = 1.086 Volts
The Resistance of the Thermistor is calculated
R therm = V therm / I therm = 1.086 / 0.000398
=
2727.4 Ohm
Now 2727.4 ohms is the resistance of the thermistor at the at temp (T)
Temperature Conversion
The thermistor resistance value is converted to temperature using the Steinhart-Hart Equation.
T=
where T = absolute temperature in Kelvin R therm in Ohms.
1
C1 + C2 . ln\Rtherm + C3(lnRtherm)3
Conversion to Deg C is
T(C)=
1
C1 + C2 . ln Rtherm +
- 273.15
C3(lnRtherm)3
The sensor data sheet will show for the thermistor a calibration equation similar to that below. The values for the parameter
C1, C2, & C3 will be listed.
(1/T) = C1 + C2. Ln(Rtherm ) + C3 . Ln(Rtherm ) 3 - 273.15
temp-compcalv101.pdf
VibWire-108 User Manual V1.09
33
Example
In Vibrating Wire sensors is the 44005RC Precision Epoxy NTC Thermistor is commonly used for temperature monitoring
applications.
The data sheet for this product can be downloaded at
http://www.aquabat.net/downloads/1350009-2.pdf
– The thermistor data sheet is valid to 11/12/2013
refer to the manufactures data sheet for the latest information.
An example Excel spreadsheet that demonstrates the temperature calculations can be downloaded at
http://www.aquabat.net/downloads/ThermistorWorksheet.xls
Example
The VibWire-101 is can be set to give ratiometric or mV temperature values from the built in thermistor of a vibrating wire sensor.
depending upon the sensor configuration. Ratiometric values are calculated between the 3300 Ohm pull up resistor and
thermistor resistance and is value between 0 – 1. The Vibwire-101 has returned a value of 0.663 from the thermistor.
In the spreadsheet below the VW-101 gives a temperature value (Ratiometric) of 0.663. The constants A, B and C are from the
calibration data sheet. The spreadsheet below shows the temperature to be 7 Deg C,
ThermistorWorksheet.xls Screen image
Calculation of temperature based on voltage ratio
Voltage ratio
0.663
Input
Excitation (Ohm)
3300
Fixed
Thermistor resistance
6905
Calculated
Thermistor R0
3000
Thermistor property
A
1.41E-03
Thermistor property
B
2.37E-04
Thermistor property
C
1.02E-07
Thermistor property
Inv Temperature
3.57E-03
Temperature (Celsius)
Steinhart-Hart Calibration
Parameters obtained from
calibration data sheet.
7.0
Calculated value
Temperature
value
VibWire-108 User Manual V1.09
34
Appendix - B
Thermistor Temperature Calculation using the thermistor Beta Value
An NTC (Negative Temperature Coefficient) Thermistor is a passive electrical component whose resistance varies inversely with
temperature. It is often used as a temperature sensor inside vibrating wire sensors.
The relationship between resistance and temperature can be described with the ‘beta’ formula.
The VibWire-108 range of sensor interfaces offers the beta value temperature calculation as an option within the thermistor setup.
The Beta value thermistor calculation is a simplified version of the Steinhart-Hart equation that is most often used in temperature
measurement solutions.
For applications when the Steinhart-Hart calibration factors are not known then the sensor ‘Beta’ value can often be found on the
thermistor manufactures data sheet.
The example below demonstrates how the VibWire-108 calculates temperature
The temperature calculations are undertaken internally within the VibWire-108 and are not yet currently part of the Q-Log
software.
Refer to Page 23 for assigning the Beta value into the
where T = temp in units K (Kelvin)
B = Thermistor Beta value
T0 = Temperature at 25 o C
R0 = Resistance at 25 o C
and to convert Deg K to Deg C then To = Tk - 273
Units Deg K
298.0
where T0 = 25 Deg C
where R0 = resistance @ 25 Deg C
Resistance of thermistor
at 25 Deg C
where T = 24.8 Deg C
VibWire-108 User Manual V1.09
35
Sample Vibrating wire Displacement Sensor calibration data sheet
Appendix - C
The terms K(T1-T0) are the temperature
compensation terms for this sensor.
Temperature compensated readings only
work if the thermsitor operation is defined.
Main Menu
Frequency proc
1 System Maintenance
2 Thermistor type 1
3 Thermistor type 2
4 Diagnostics
5 Channel 0
6 Channel 1
7 Channel 2
8 Channel 3
9 Channel 4
A Channel 5
B Channel 6
C Channel 7
U Up. T Top.
0 = Hz 1 = Digits ( Hz2) 2 = SI Units
where SI Units is by Quadratic Expansion
The example above is for a VW Piezometer
and so the engineering units calculations vary
between the different sensor types.
For a Piezometer the local barometric levels are
taken into consideration.
The engineering units for this example is K Pa
Channel 0
1 Frequency proc
2 Thermistor type
3 Cal A
4 Cal B
5 Cal C
6 Cal D
U Up. T Top.
1
1
The term (S1-S0) is a constant offset that allows
for local atmospheric conditions and be taken
from a barometer module such as models
Barom-SDI12 or Barom-485.
The VW sensor units have to be set to ‘Digits’
that is Hz2/1000.
VibWire-108 User Manual V1.09
36
Sample Vibrating wire Piezometer Sensor calibration data sheet
VIBRATING WIRE INSTRUMENTS CALIBRATION CERTIFICATE
Serial No.
: 012453
Instrument Range : 0.00 to 50.0 mm
Calibration Date.
: 14th March 2014
Gauge Factors in mm
Ambient Temp.
: 23 Deg C
Barometric Pressure
: 1015 mb
Linear Gauge Factor (G) : (mm/digit) -0.0092090
Calibrator Personnel
: Ian Thomas
Polynomial Gauge Factor A: 0.000000024979750
Polynomial Gauge Factor B: 0.0089750451
Calibration Equipment :
Digital micrometer with scale
VibWire-108 sensor interface
Polynomial Gauge Factor C: 28.976750
Regression Zero:
Instrument Type
: Displacement Transducer
Period Gauge Factor (K
: 92.1053900
3185.7
Digits
Formulae:
Linear
Polynomial
Offset
E = G(R0 - R1)
E = AR12 + BR1 + C
C = -(AR02 + BR0)
Where R0 = is the initial zero reading at
the time of installation.
R1 = current reading Units Hz2/1000
(Digits)
These equations give displacement only without any
temperature compensation.
Displacement calculations within Q-Log
Q-Log is the free data display and recording software from
Keynes Controls Ltd.
Main Menu
Frequency proc
1 System Maintenance
2 Thermistor type 1
3 Thermistor type 2
4 Diagnostics
5 Channel 0
6 Channel 1
7 Channel 2
8 Channel 3
9 Channel 4
A Channel 5
B Channel 6
C Channel 7
U Up. T Top.
0 = Hz 1 = Digits ( Hz2) 2 = SI Units
where SI Units is by Quadratic Expansion
Linear
E = G(R0 - R1)
E = G.R0 - G.R1
where G.R0 is a constant term.
Channel 0
1 Frequency proc
2 Thermistor type
3 Cal A
4 Cal B
5 Cal C
6 Cal D
U Up. T Top.
1
1
0.000000024979750
0.0089750451
28.976750
-2.3069E-3
Enter this formula into Q-log and
the results will be in mm.
See
http://www.aquabat.net/QLOGFree/qlogv2.html
VibWire-108 User Manual V1.09
37
Index
Page No.
Description
2
Introduction
Hardware Options
Dynamic Measurements
Configuration, SI Units
3
Features Terminal Port, Q-LOG
4
Index
5
Care & Maintenance
Default Factory Settings
Required Software, Warranty Information
Front Panel
Circuit Board Features
SDI-12 Serial Network Connection
SDI-12 Network Operation
Multi-instrument Solutions
PC Data Acquisition System, Multi-instrument Data Logger Solution
RS-485 Serial Network Connection
Earth Connection
PC Data Acquisition - RS-485 Solution
Modbus RS-485 Network Connection
PC/Laptop Data Recording & Display System - Q-LOG application
Technical Specifications
System Test - Power on sequence
VibWire-108 Digital Communications
Command Structure & Operations across an RS-485 network
Timing Constraints RS-485 / SDI-12 Networks
RS-485/SDI-12 Command Format
Assigning Data Transmission over the SDI-12 or RS-485 network
Starting Data Acquisition Operation on a SDI-12 Network
Modbus version instrument
Instrument Identifier
Start Measurement Commands
Advice on the choice of the measurement instructions.
Possible Network Problems
SDI-12 Supported Commands
RS-485 Supported Commands
Examples Of Using RS-485/SDI-12 Commands
Changing the instrument ID number
ID Number Query
Start measurements for Instruments on a network
Start measurements using the concurrent command
Read data values from the VibWire-108
Temperature/Current loop Data Format
Connection to an Analogue Data Acquisition System
Theory of operation,
VibWire-108 Analogue Port Configuration
Optimising the Analogue Output Settings
Integration to the AquaDAT Analogue Sensor Interface
Real-time Frequency Display
Assigning the real-time display to a VW sensor input
Loud Speaker
Sensor Problems
Vibrating Wire Sensor Installation
Common Earth Points
PCB Jumper Settings
Lightning Protection
Terminal Port
Terminal Port Operation
Terminal Port Menu System
Selecting the VW Sensor Output Units
Temperature Sensor Configuration
Modbus Supported Instrument, Modbus Registers
Scanning the instrument
RS-485 / Modbus Network Connection & Installation
SCADA Application
Keyboard - User Command Summary
Keyboard Operations
Vibrating Wire Sensors
Main Menu - Terminal Port
Pluck Control
Spikes in the VW Sensor Data
Pluck control worked example
Firmware upgrade facility
Terminal Port Menu Screens
Case Study
6
7
8
9
10
11
12
13
14
15
16
17
18
19
20
21
22
23
24
25
26
27
28
29
30
31-31
Appendix A
Temperature measurements - Thermistor
Steinhart-Hart Thermistor worked example
Appendix B
Thermistor Temperature Calculation using the thermistor Beta Value
Appendix C
Sample VW Piezometer Calibration Data Sheet & Menu System Configuration details
Sample VW Displacement sensor Calibration Data Sheet & Menu System Configuration details
VibWire-108 User Manual V1.09
38


