1
Geotechnical Instrumentation
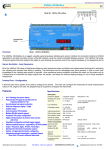
Data Recording & Display Software
Q-Log Data Recording Software
Advantages:
Free download for up to 10 Intelligent Sensors per network
36 sensors or interfaces on the professional version software.
Operates with the Keynes Controls SDI-12 / RS-485 media converts
Easy expansion using USB Ports
Graphical User Interface for sensor configuration and data display
Terminal screen to capture events & sensor diagnostics
Digital Panel Meter & Chart Plotting for simple data examination
CSV file format for easy upload into a spreadsheet
Enables multiple network strings to be supported into a single PC
Up to 256 Columns of data for each log file
Multi-instance Operations
USB-SDI12-Pro
media converter
Panel Meter Display
User-Defined Chart
1.0 Introduction
Q-Log is the Keynes Controls Data Recording and Display software and has been designed solely for use with intelligent sensors.
The software operates as a stand-alone package and uses the Keynes Controls SDI-12 and RS-485 model dongles for
communications to the sensors.
This software has been developed by Keynes Controls with the aim of ensuring data integrity and to remove where possible the
Users requirement to understand programming techniques.
Q-Log gives the User a simple Windows environment for setting up and using intelligent sensors supporting the SDI-12 or RS-485
digital communications interface. Data is stored into a log file in CSV format for simply examination by a spreadsheet for uploading
into a database. A series of panel meters and trend plots can be configured to display real-time results.
Q-Log uses a series of configuration files to define the setup and operation of a sensor. Any sensor or third-party interface that
supports industry-standard commands can be integrated into the software without any requirement for complex upgrades.
Q-Log is modular and new applications can be added or custom developments undertaken on request.
A Quick User Guide can be found on page 30.
Updated: 19/11/2014
Copyright Keynes Controls Ltd 2014-2015
1
Page No
1
Description
1.0
3
Introduction
System Requirements
Copyright notice
Log File Location
Installation Instructions
4
2.0
System Expansion
5
6
3.0
3.1
3.2
Software Windows Layout
Selecting the number of Panel meter Displays
Panel Meter Data Selection
7
4.0
4.1
4.1
5.0
5.1
Network Dongle Installation - RS 485 or SDI-12
USB-SDI-12 Media Converter Wiring Diagram
USB-RS485 Media Converter Wiring Diagram
Setting the COMM Port Number into Q-Log
Network Type Selection - SDI12/RS485
8
6.0
6.1
Scanning for Devices / Sensors
Device Setup
9
7.0
8.0
Starting & Stopping Data-Acquisition Operations
Console Screen
10
9.0 Comm Port Selection & Sample Rate Selection
10.0 Setting the Sample Rate
10.1 Sensor Selection
11
10.2 Manual Log File Layout Configuration
10.3 Instrument Identifier Strings
10.4 AquaLOG data into Q-Log
12
11.0 Charts
11.1 Chart Configurations - Y Axis Units - X Axis Units
13
12.0 LCD Panel Meter Display
12.1 Displaying Data
12.2 Panel Meter Display Layout Options
14
12.3 Panel Meter Titles/ Units On / Off
12.4 Assigning Engineering Units
15
13.0 Log File
16
14.0 In-Place-Inclinometer Data-Acquisition System
17
15.0 VibWire-108 based Q-Log Data Recording Application
15.1 VibWire-108 Multi-instrument application
18
15.2 Example VibWire-108 Data-Acquisition System Configuration
19
16.0 Sensor Configuration Files
17.0 Multi-Parameter Sensor Configuration - PIEZO-RM Example
20
18.0 VibWire-101-based Large Channel Count Q-Log Application
21
19.0 Example of a Multi-instrument Network System.
22
20.0
20.1
20.2
20.3
23
20.4 Identify the Modem Port
20.5 Remote Data Logger Telephone Number
20.6 Number of columns in the results file
24
20.7 Automatic Data Downloads
20.8 Automatic Download Options
20.9 Hourly Downloads - Continuous Operations
GSM Remote Monitoring
Modem Configuration
Modem Model Number
GSM Setup Options
21.0 Data on demand
21.1 Data Amounts
21.2 Data Correction Operations
22.0 Common Mobile Phone Network Error
25
22.1 Common Modem Errors
22.2 Example Download Options
26
23.0 Formula Processing
23.1 Example 1 - Crack Meter - Raw data Format Hz
27
23.2 Updating Data Values
SDI-12 & RS485 network
GSM Data downloads
23.3 Latest data values show in the Variable List
23.4 Example 2 -VibWire-108 configured to give results in digits formula modification
28
29
24.0 Example - Single VibWire-108-SDI12 Vibrating Wire Sensor Application
24.2 Selecting the VibWire-108 data options.
30
25.0 Strain Gauge Application
Bridge Circuit Options
31
26.0 Worked Example - Setting the calibration factors into the NP-Strain-1 card
Engineering Units
32
27.0 Strain Gauge Application - Q-Log Formula Processing
33
QLog Quick Installation & Set-up Guide
2
Supported Operating Systems:
Q-Log supports Windows XP, 7 and 8 Microsoft operating systems.
Minimum System Requirement:
1 G Hz Intel Processor 1 Gb RAM - any hard disk for data file storage.
Log File location:
Mydocuments/Q-Log/Log where Mydocuments is the standard Windows directory
Manual Download:
The complete package can be downloaded free of charge at:
http://www.aquabat.net/downloads/QlogSetupv1207.zip
Directory Location:
The files after installation can be found:
C:/’NAME’/user/My Documents/QLOG
where name is Identifier for the computer.
IMPORTANT INFORMATION
For Microsoft 7 and 8 operating systems the installation Account Type has to be ‘Admin’ as full access to the User file system for storage of the files.
Administrator account is required for software installation.
No. 1 - 4
USB-SDI12-Pro Media Converter Connections
SDI-12 Sensor
Earth
6
1 Gnd / 0V
N/A
5
2 +12V DC
SDI-12 Data 4
3 N/A
I-P-I Sensor Installation
For 1 to 4 I-P-I sensors simply connect
them directly to the USB-SDI12-Pro
network bus. The USB-SDI12-Pro device
powers the sensors directly from the USB
port of the PC without any external power
supply.
1
Software Installation:
The Q-Log software loads automatically into pre-set directory structure.
Make sure the User account being used for the installation of the software is of type ‘Admin’ If this is not the case create a User account with Admin - See Control Panel - User Accounts
Contact suitable IT personnel for installation rights.
Double-click on the QlogSetupv1207.zip file and follow the standard Windows software installation instruction
Setup Screen:
Press the ‘Next’ Button to start the installation
Press the ‘Finish’ Button at the end of the installation.
The information in this document is correct at the time of printing. Keynes Controls Ltd withhold the right to make changes without notice.
Please contact Keynes Controls Ltd for the latest details regarding this product
Copyright Keynes Controls Ltd © 2014 - 2015.
3
Gnd
2
+12V DC Supply
4
Gnd
A RS-485 Version of this media converter
is available from Keynes Controls Ltd.
Pin No
+12V SDI-12 Bus
To USB Port on a
laptop or PC.
SDI-12 Data
External 12V DC
Power Supply
2.0 System Expansion:
Q-Log is a fully-configurable general purpose data-acquisition system for sensors and interfaces deployed on the SDI-12 and
RS-485 digital networks. It is ideally suited to fixed installations with distributed networks into multiple sites; sensor testing in a lab
and for testing sensors and systems in the field.
In order to maintain data integrity and to simplify any post-processing operations, Q-Log runs as a separate program for each
network that is installed. Should any network fail due to a problem with a remote sensor or cabling damage, then this will not
prevent the rest of the networks from operating. Running separate networks isolates the PC from any problems and these can be
fixed, removed or updated as and when required.
There is no practical limit to the number of different network strings that can be used.
The image below shows 4 USB-SDI12/RS-485 media converts in use:
The professional Q-Log Software enables up to
36 sensors or instruments on a network
Example Network Type Installation Only - Free Version
Select image to download
a free copy of Q-Log
Operates on all Windows Laptops / PCs / Tablets
SDI-12 network 1 .. 10 Instruments / sensors
- 485
+ 485
0 .. 100m
Sensor 10 .. 19
- 485
RS-485 network 1 .. 32 Instruments / sensors
+ 485
Sensor 20 .. 29
0 .. 1000 m
The simplest form of data-acquisition system that can be created using Q-Log is by using
the handheld media converter as shown below. A single device is perfect for testing sensors
in the office, or lab, or for testing individual network strings when in the field.
Depending on the version of Q-Log in use, up to 10 sensors or interfaces can be used with
the free version software; or up to 36 sensors using the professional version of the software
on each network string.
A key feature of the flexibility of Q-Log is its ability to operate
with any third-party sensor, or to interface without the
requirements for complex upgrades.
Media Converter
Part No USB-SDI12-Pro
Q-Log uses a series of configuration files to define its
operation and these can be appended or edited to allow
third-party sensors not already supported.
Laptop / PC
Computer
All sensor configuration operations can appear in the tool
menu system for easy access.
USB
Data Link
The only stipulation for sensor integration into Q-Log is that a
sensor uses an ID string and industry-standard command sets.
4
3.0 Software Windows layout
The details below demonstrate where to find the Q-Log configuration options:
‘Device Setup’ Window
Instrument ID String
‘Q-Log Data Recording’ Window:
Configuration File Description
Scan for Devices
Start Column for first data item
in the Log file.
The Q-Log software scans the network
and lists the identified instruments
automatically. The network to be scanned
is that specified in the ‘Device Setup’
Window.
‘Device Calibration ’ Window
Sensor Offset
Calibration Factor
Sensor Gain
Calibration Factor
Display Identified Instrument/sensor list.
(Example of use see page 34)
Logging Configuration Window:
Enter Comm Port identified for USB media converter
Data Recording Sample Rate
Log Filename
Automatically create Log file name
Network Type Selection - SDI-12 / RS485
Auto Assign:
Title bar showing the Data Acquisition Status Message
Select the ‘Auto Assign’ menu
option. The data log will be
automatically configured for all the
identified instruments. The User
has the facility to manually adjust
the Log file layout.
This status line only appears when the data acquisition operations are active.
Title bar showing the Data Acquisition Status: No Data
The status bar is clear indicating no data acquisition operations.
‘Manual Commands’ Window:
Console Window
GSM Remote Monitoring Configuration
Configuration Window for the automatic
reporting operations when used with a GSM
modem. Set the data download schedule is
configured here.
View results from the manual commands directly inside the
‘Terminal Data’ Window.
An example of the use of the Auto Assign option is shown in the VibWire-101
multi-channel data-acquisition system on page 20.
Configuring a Vibrating Wire data-acquisition system can be a complex task. Using
the ‘Auto Assign’ option can speed up this process considerably. A single data log file
is created with the columns compactly laid out and with the correct titles and units.
The 49 Channel VW data-acquisition system uses a spreadsheet format to assign the
columns. The Auto Assign option calculates the cell positions D..AI = 32 cells, AJ.. AY
= 16 cells and AZ..BA for the single channel VW-101. 2 cells are used for the single
channel VW101 with Cell AZ for Freq and Cell BA for temperature.
5
3.1 Selecting the number of Panel Meters:
The following Windows are used to setup the Panel Meter Display:
‘View Data’ Window
View Tab
Panel Meters
Number of panel meters to display
real-time values
3.2 Panel Meter Data Selection:
‘View Data’ Window
‘Select Variable’ Window
Use this Window to select the data items to be displayed in the panel meters
6
4.0 Network Dongle Installation - RS485 or SDI12
When the USB-SDI-12 or the USB-485 media converts are installed onto the USB
port of a Windows operating system PC, or laptop, then a message similar to that
below appears on the task bar. This message shows that the dongle has been
correctly identified by the operating system and the driver is installing.
The dongle converts the USB port to a serial port for use with
the sensors. The USB media converter is identified in the
Windows operating system as a COMM port.
4.1 USB-SDI-12 Media Converter Wiring Diagram
SDI-12 Data
To find out which port is being used by the USB dongle go to:
+12V DC
Sensor Supply
Control Panel
System
Device Manager
There are minor differences in the screens that appear when
accessing the Device Manager Window from the different
versions of the operating system, however they all show devices
identified similar to the image below:
4.2 USB-RS485 Media Converter Wiring Diagram
+ RS485
+485
–RS485
GND
Gnd
View looking into media converter
COM 6 is shown
identified by the
operating system
as being in use
+12V DC Supply
COM 6: This is the port number used in the
Q-Log setup to identify the media converter
dongle port.
5.0 Setting the COMM Port Number into Q-Log
Once the media converter USB dongle has been correctly
identified by the operating system it can be used by the Q-Log
software.
This image is taken from the
‘Properties’ tab of the driver for the
USB dongle.
Q-Log currently uses a single USB dongle and this gives the
User up to 256 columns of data to be recorded at any one time.
The window shows the dongle
installed and operating correctly.
From the Q-Log Tab select: ‘Configuration’ menu option.
The ‘Logging Configuration’ Window will appear.
Select the Comm Port used by the USB
media converter from the pull-down list.
In the example opposite COM 6 has been
identified previously as the port in use by
the USB dongle
5.1 Network Type Selection
COM Port Selection List
Select the ‘Mode’ button
The network type options SDI-12 & RS-485 options
will appear.
Sample Rate
Enter the COM Port
number identified in
Device Manager List
here.
Select
Logging Configuration Window
Data Log File
Name & Storage Location
the
Network
Select the correct network type from the list.
Press the ‘OK’ button to confirm the network type.
Type
The network type is printed
on the label of the media converter
Options: SDI-12/RS485
7
6.0 Scanning for Devices / Sensors:
The Q-Log software scans the network for the intelligent
sensors or interfaces and displays each device in a table.
The image below shows the Q-Log main menu
As each device is identified its ID number and response tag is
shown in the table below. It is important that all sensors have a
unique ID number in order for them to be correctly identified.
From the ‘Q-Log’ Tab select: ‘Scan for devices’ option.
A table similar to that shown below will appear:
Sensor ID Number
In this example a
barometer with ID = 4
The Q-Log software has the network type assigned
Scan for devices makes locating and using the various sensors
and interfaces a simple operation.
Sensor response
message
Device List ’ Tab Q-Log Recorder Window
6.1 Device Setup:
Once a sensor has been identified by the scan, a list of different
configuration files supported by the sensor can be selected from
the ‘Configuration’ Tab.
1. Select the ‘Setup’ Tab and the following window will
appear.
Some sensors such as single axis I-P-I, have only 2 data items
to send across the network, such as angle and temperature. For
these sensors only a single Configuration file option is available.
Any unwanted data can be ignored in the data table.
Sensor Configuration
file options.
Other devices such as the VibWire-108 sensor interface have
many optional configuration files due to the number of Vibrating
Wire and temperature input sensor configuration options that
can be used.
A VibWire-108 using only 2 sensor inputs will respond faster
than a unit set for 8 sensors so choosing the best file to suit the
application will speed up the measurement operation.
‘Start Column’ Selection Tab
Action
Example: Storing data from a Dual-Axis I-P-I with ID=8 into a
data file. This example is based on the ‘List of devices’ shown
in the screen above.
Select the ‘Configuration’ Tab.
A list of configuration files will appear in the form of a pull down
menu. Select the most suitable file.
The Dual-Axis In-Place-Inclinometer returns 3 data values by
default. These are: X Axis (mm/m), Y Axis (mm/m) and Temp
in Deg C.
Storing Data
Select the ‘Start Column’ tab:
Store the data into the 6th column of the data log, i.e., Column
F where Column 1 = A.
A list of column locations in alphabetical order appears in the
form of a pull-down list.
Sensor ID=8 I-P-I Identifier
Standard Dual-Axis
Configuration File
Select the ‘Column storage location’ letter
for the start of the data storage.
Store X-Axis data into Column F
Once the Configuration File and Column
Storage parameters are set then:
Y-Axis will be stored into column G
and Temp into column H.
Additional parameters are stored into
the next consecutive cell.
Select ‘OK’ to store the new option.
8
D
E
F
G
H
6th column in
the data log
7.0 Starting & Stopping Data Acquisition:
8.0 Console Screen:
Before starting any data-logging operation make sure that all
devices on the network have been identified using the ‘Scan
for devices’ option.
The Q-Log is provided with a Console window to show each
command and response made by the sensors at each acquisition
operation.
From the Q-Log Tab select: ‘Start Logging’ option.
The window is ideal for diagnosing sensor setup problems.
The blue status LED's on the media converter should start to
illuminate when data is being transmitted.
The window saves only the last 1000 messages and instructions
to the sensors.
The
Activating the Console Window
mark will appear by the ‘Start Logging’ menu option.
Stopping Data Logging:
Select
Select the ‘Stop Logging’ Tab - see image below.
The ‘Console’ Window shows the response from the sensors
on the network or from the modem when when undertaking
remote recording operations.
The status LED’s on the media converter will no longer
illuminate and the tick mark will disappear.
View - Console
Start Data Acquisition
Stops Data Recording
Console Window
9
9.0 Com Port Selection & Sample Rate Selection:
COM Port Selection
Select the ‘Configuration’ menu option
And the ‘Logging Configuration’ Window
will appear.
Sample Rate
Data Log Filename
& location
Enter the ‘Com Port’ number for the USB
media converter being used.
Network Type
Logging Configuration Window
Logging Time Period
10.0 Setting the Sample Rate
Select the ‘Configuration’ Tab from the main Q-Log menu. The ‘Logging Configuration’ Window will appear.
Select the ‘Logging Interval’ Tab. A list of possible samples rates will appear in the pull-down menu list.
Select ‘OK’ button to store the new sample rate.
The sample rate is set the same for all the sensors on a network.
Important Note: The fast sample rate is limited to the speed in which the slowest sensor responds.
Device Identification String
Preset into the sensor or interface
Select the sensor engineering
units options here.
Sensor Option Selection
Enables different sensor options to
be used.
Assigns the start cell of the
sensor data into the data table making
up the log file.
A .. IU - Excel spreadsheet format.
10.1 Sensor Selection
Once the device on a network have been identified, then the different configuration options can be selected using the pull down
menu list that will appear under the ‘Configuration’ title from within the ‘Device Setup’ Window, see above. The device options
appear in this pull down menu list regardless of the type of network being used.
For example (See image above), a piezometer has been identified as ID=3 on a network. To adjust the sensor to use different
engineering units, such as water height in units of mmH20, mH20, inches, then simply select the sensor configuration items from
the available options list The ‘Configuration’ menu system will list options available for the identified sensor automatically.
10
10.2 Manual Log File Layout Configuration:
There may be occasions where the manual configuration of Log file is required, for
example, when adding a new sensor for a short period time. The columns in the Log
file are identified like columns in a spreadsheet.
D = the first column to which User data can be assigned.
To manually adjust the location of a sensor or interface in the data log file:
Select the device to be configured from the ‘Device List’ Tab of the Q-Log window:
The ‘Device Setup’ window will appear.
Select the new starting position for the data using the ‘Start Column’ pull down menu.
Example - Start column is D for a piezometer.
Once the new cell position is selected press the ‘OK’ button to save the new
configuration.
Important Note: Take care to check any configuration changes do not affect the
recording of other devices on the network. Setting the same recording cell for multiple
devices will corrupt the Log file.
10.3 Instrument Identifier Strings
Product:
ID string:
VibWire-101 VW sensor interface
13KEYNESCOVW101A011
VibWire-108 VW sensor interface
13KEYNESCOVW108A016
PIEZO-RM water level sensor
13KEYNESCOPRESR001
Barom-SDI-12 barometer
13KEYNESCOBAROMR003
I-P-I
13KEYNESCOIPINCL005
AquaDAT sensor interface
13KEYNESCOAQUDAT008
Single channel strain gage
13KEYNESCOSTRAIN027
The key to identifying a new sensor on a network is by the
Identifier String. The identifier string is unique for each
sensor type and instrument. This parameter has to be
known for the specified sensor to be used within Q-Log. If
this parameter is missing then the sensor will not be
identified and its data will be ignored by the software.
10.4 AquaLOG data into Q-Log
The AquaLOG data logger stores data into an internal data table that references data in exactly the same way as the common
spreadsheet packages such as Microsoft Excel. The first three values in each record are reserved and store the record number,
date, and time respectively. The first free position in the AquaLOG data table is column ‘D’.
AquaLOG Data Table Layout
A
Record No
AquaLOG Data Logger
B
Date
C
Time
D
E
F
736.01
1223.5
2334.7
When data is downloaded from the AquaLOG it is stored as a
CSV (Comma separated variable) text file.
The image opposite shows the ‘Variable List’ from the
main Qlog Window and also demonstrates how the
data values at cell positions in the AquaLOG data file
are referenced in the ‘Qlog’ Variable List.
Cell D
The AquaLOG log file cells are mapped to the same
cell location in the Qlog Variable List.
736.01
1223.5
2334.7
Example
The example above shows Cell D in the AquaLOG
data table is mapped to Cell D in the Qlog Variable
List.
11
11.0 Charts:
Chart Data Points:
The maximum number of data points that can be displayed into
The Q-Log software supports charts to show the overall trend a single chart = 1000.
for a specified data item in the Log file.
The free version of the software is limited to 4 simultaneous
charts. Q-Log is not meant to be an in-depth analysis tool, which
is best done in a spreadsheet or similar software.
11.1
Chart Configuration:
To make sure the software remains simple to operate the X- and
Y-Axis auto-scale.
Y-Axis Units:
The Y-Axis engineering units displayed on the chart are set in
the ‘Variable View Tab’ of the Q-Log window (see details on page
11). The engineering units are manually set so some knowledge
of the application will be required in order to make sure these
parameters are correct.
Barometer Chart
X-Axis Units
The X-Axis is always the time axis. The scale will depend directly
upon the specified sample rate.
Select the ‘Cell’ to be plotted
This is any column on the
Log file.
Number of data points to plot
100, 200, 500, 1000, Current Log
Set the Data Series, Background and Axis colours.
Selecting a Chart
Select the ‘View Tab’ in the Q-Log window.
Select the chart to plot: options ‘Chart 1 .. Chart 4’.
The un configured chart will appear.
Select the ‘Edit’ Tab and a menu system will appear.
Default Chart that appears before a cell is selected
Press the ‘Select Cell’ Tab. The ‘Select Variable’
Window will appear.
The example above demonstrates the selection of ‘Channel
1’ for an 8-Channel differential input AquaDAT sensor
interface to be displayed in a chart.
Un configured Chart
The example above demonstrates the selection of ‘Chart 3’ for the
next data plot.
Once a chart is configured it can be left running in the background.
Additional charts can be configured at any time.
For slow sample rates set the number of points to ‘Current Log’
12
Using the ‘Select Variable’ window:
Press the ‘Select’ button for the channel to appear in the
Chart.
The Chart Window will appear.
12.0 LCD Panel Operation:
Data values from any single network can be viewed as a series of panel meters, or as a limited number of real-time traces.
The data that is displayed is limited to values from sensors on a single network only. If there are two networks connected to a PC,
one being SDI-12, and the other RS-485, then only data values from the SDI-12 network can be observed together. Then data
from the RS-485 network can be viewed by running another version of Q-Log and having it setup to operate with the other sensors.
The example below shows a single AquaDAT interface
configured for 8-Channel Differential Inputs with an ID = 2:
View Tab
12.1
Displaying Data
After the network scan and all of the instruments or sensors have been
identified, it is then possible to select the parameters that are to be displayed.
Q-Log does not display all the possible parameters of which it has the
capability of storing and requires the User to select the values of interest.
Minimising the number of windows in the package ensures that the PC
resources being used for data recording and display purposes are never
overstretched. The data recording and displays will update reliably and this
leaves the computer free for other applications.
1. Select the ‘View’ tab
The options to select panel meter or chart display are shown.
Panel Meter Selection Tab
12.2 Panel Meter Display Layout Options:
Q-Log can be configured to display real-time values in the form of a series of panel
meters. The panel meters are displayed in the form of a grid. Each panel meter
can show the real-time data value, Channel Name and Units.
Setting the number of Panel Meters:
Using the View Data Window:
Select the ‘Edit’ Tab
Select ‘Number of panels’ tab
The list of possible panel meter display options will appear.
The display options show Row x Column. 4 X 2 = 4 rows 2 columns.
The example opposite shows a 4 x 2 Display
The example windows opposite were created based on using a single AquaDAT
sensor interface configured for 8 differential inputs.
4 x 2 Panel
13
12.3 Panel Meter Titles - Units - On / Off:
The panel meter display can be configured to show a ‘Title’ and ‘Units’
for each parameter being displayed.
The settings for the Panel Meter display are globally set for each page.
Title
Units
XX.XXXX
Switches Titles On/Off on the Panel Meter Window:
The LCD panel meter display can be configured to display
or remove the data item Title and Units.
Using the ‘View Data’ Window:
Select the ‘Titles’ option :
With tick mark selected the
Title will be displayed.
12.4
Displaying Engineering Units
The engineering units that are displayed on the screens are simply
entered into the table opposite as text. The sensors used to
acquire the data have to be suitably configured into the correct
engineering units. The example is going to insert engineering
units for use with an AquaDAT with ID = 2 for channel 0.
From the ‘Select Variable’ Window
Select the ‘Units’ cell to be configured.
Cell to be configured
This cell can be edited and values deleted just like a cell in a
spreadsheet.
Type the new ‘Units’ title into the specified cell:
In this example Channel 0 units is set to ‘mV’ .
Type ‘mV’ in the ‘Units’ cell for Channel 0.
mV
The image opposite shows mV entered for channel 0 of
Repeat the ‘Units’, ‘Titles’ update for all the required cells.
Press the ‘OK’ button to store the new units.
14
13.0 Log Files
Data is stored in up to 256 individual columns as a comma-separated variable text file suitable for importing directly into a
spreadsheet. The individual columns are identified in the same format as used by columns in a spreadsheet. Column D is the first
User-defined location for data storage. Columns A .. C are already used by Q-Log to store Record Number, Date and Time.
Each time a new configuration is made and the data recording operations are started then a new heading line is written to the Log
file. This action ensures that all related data is grouped together and that data values are clearly identified.
The Log file sample below shows how the log file will appear after a configuration change.
The column titles written to the Log file are those entered into the specified cells from the ‘Variable List’ tab from the main Q-Log
window. The example below shows a Piezometer with the name ‘Thames River 1’ with units in ‘m’.
The Thames River 1 sensor water height data is stored into column D.
Record,Date,Time,,,,
0,26 Jul 2015, 15:42:41,-0.170500,32.889999,0.000000
1,26 Jul 2015, 15:43:00,-0.171000,32.830002,0.000000
2,26 Jul 2015, 15:44:00,-0.169800,32.730000,0.000000
3,26 Jul 2015, 15:45:00,-0.169500,32.470001,0.000000
Record,Date,Time,Pressure(1),Temperature(1),,
0,26 Jul 2015, 15:46:01,-0.000200,32.459999,0.000000
1,26 Jul 2015, 15:47:00,-0.170800,32.560001,0.000000
Record,Date,Time,Thames River 1,Water Temp,,
0,26 Jul 2015, 15:47:31,-0.172600,32.459999,0.000000
1,26 Jul 2015, 15:48:00,-0.171900,32.490002,0.000000
2,26 Jul 2015, 15:49:00,-0.172200,32.509998,0.000000
3,26 Jul 2015, 15:50:00,-0.172800,32.509998,0.000000
4,26 Jul 2015, 15:51:00,-0.172700,32.470001,0.000000
5,26 Jul 2015, 15:52:00,-0.170500,32.529999,0.000000
6,26 Jul 2015, 15:53:00,-0.172600,32.470001,0.000000
7,26 Jul 2015, 15:54:00,-0.172500,32.480000,0.000000
8,26 Jul 2015, 15:55:00,-0.173300,32.509998,0.000000
9,26 Jul 2015, 15:56:00,-0.172400,32.630001,0.000000
10,26 Jul 2015, 15:57:00,-0.171400,32.660000,0.000000
A
B
C
Config Change
D
A = Record Number
B
=
Date
C = Time
Remote Data Logger System
The diagram below shows the minimum system hardware required to create a remote data logging system.
GSM Modem
Remote Data Logger
15
14.0 In-place Inclinometer Data Acquisition System:
The diagram below shows how simple a PC-based inclinometer data-acquisition system can be put together using the USB media
converter unit and the I-P-I range of sensors. All of the current inclinometers connect to a network and send values directly in
engineering units into data recorders or PC / Laptop data-logging systems.
Angles and temperature values are all acquired and converted into engineering units within the sensor and then transmitted digitally
across the network. This minimises noise and errors due to cabling losses and also has the advantage of fast installation and
simple maintenance.
Q-Log Application
SDI-12 network
Laptop / PC
Computer
USB
Data Link
- 485
+ 485
0..1 km RS-485 up to 10 I-P-I Free version
36 I-P-I Pro Version
SDI12-HB
Media Converter
I-P-I sensors support the ‘Concurrent’ measurement command.
I-P-I Tilt Sensor
I-P-I Tilt Sensor
Theory of Operation:
Adding additional sensors to the system is very easy with Q-Log. Just plug the new sensor onto the network and ‘Scan for devices’.
The new sensor will be identified and the results appended to the log file.
Should a number of new devices be required and they are located some way from the PC then the addition of a new network may
be the best option. Insert a new USB media converter into a spare USB port in the PC and start a further copy of Q-Log to identify
and store results from the new sensors.
Each time Q-Log is running a new Log file separate from any other Log file is created. Each Log file is limited to 256 columns in
order to simplify any data processing operations.
Auto-Zeroing
The I-P-I sensors are difficult to zero on installation. The Keynes Controls range of I-P-I can be automatically set to a starting
angle of 0 degrees at the start of an acquisition operation and the results thereafter shown in the charts or on the LCD panel meter
display.
16
15.0
VibWire-108 based Q-Log Data Recording Application:
The following example demonstrates a simple 8-unit VibWire-108 application that can be created using a single media converter
and the Q-Log data recording and display software.
In this application the SDI-12 network has been chosen for data transmission.
Expansion
Port
USB A-A
Extension Cable
1435.2
1435.2
Instrument ID=4
4 x VW + 4 x Temp
Location C1
Expansion
Port
2135.8
Instrument ID=5
2 x VW + 2 x Temp
Location C2
Instrument ID=6
6 x VW + 0 x Temp
Location D1
2135.8
Instrument ID=7
6 x VW + 6 x Temp
Location D1
1435.2
1435.2
Instrument ID=0
8 x VW + 8 x Temp
Location A1
2135.8
Instrument ID=1
4 x VW + 0 Temp
Location B1
Instrument Configuration
Instrument ID=2
6 x VW + 2 x Temp
Location A2
The VibWire-108 ID number for each instrument can be setup
using the Q-Log software, however, it is faster to configure the
instruments manually using the keyboard.
2135.8
Consider the system shown above to be wired-in and ready for
installation. The wiring installation details for the Vibwire-108 can
be found in the User manual.
Instrument ID=3
4 x VW + 0 Temp
Location B2
15.1 VibWire-108 Multi-instrument application:
A common application for Q-Log has traditionally been in the creation of distributed vibrating wire data-acquisition systems using
the VibWire-108 interface.
It does not matter which network type is being used since all operations are transparent to the User and have a common interface.
Based upon the simple example above using 8 x VibWire-108 instruments, all the User has to do to create the application is to
install the instruments and connect them to a suitable network media converter.
1. Start Q-Log
2.
Make sure the USB media converters have been suitably identified and then ‘Scan for devices’.
Q-Log will identify the instruments on the network and produce a list of devices in the ‘Variable List’ tab (see details on page 18).
The ‘Variable List’ shows a generic configuration of the instruments, and after they have been identified then all that is required
is to set the suitable configuration option into the software.
To simply any application set the VibWire-108 to operate with 8 sensors and simply select the correct number of channels for
storage by Q-Log. The software ignores unwanted data values should they be sent across the network. To optimise the system
for speed then the VibWire-108 instruments should be set to return only the number of data required by Q-Log.
17
15.2
An Example of VibWire-108 Data-Acquisition System Configuration:
The following configuration details are based solely upon the example vibrating Wire data-acquisition system shown on page 17.
The Windows below show what
1. Scan the network for all available devices.
Stage 1 - Identifying the instruments on a network:
Select ‘Scan for devices’ menu option.
After a few seconds the Device List will update and show
the updated table. The View Device table now shows the
generic name for each device along with the ID number.
Stage 2 - Selecting the instrument configuration:
2. For each identified device press the ‘Select’ button.
From the menu system that appears choose the option
that matches the instrument configuration.
VW-108 Concurrent 8 VW + 8 Temp
VW-108 Concurrent 4 VW + 0 Temp
3. Repeat the operation to configure all of the identified
instruments.
VW-108 Concurrent 6 VW + 2 Temp
VW-108 Concurrent 4 VW + 0 Temp
VW-108 Concurrent 4 VW + 4 Temp
VW-108 Concurrent 2 VW + 2 Temp
VW-108 Concurrent 6 VW + 0 Temp
VW-108 Concurrent 6 VW + 6 Temp
The example considers the VibWire-108 instrument only,
however, any other instrument or sensor on the network
is identified and configured in the same way.
VW-108 Concurrent 8 VW + 8 Temp
VW-108 Concurrent 8 VW + 6 Temp
VW-108 Concurrent 8 VW + 4 Temp
VW-108 Concurrent 8 VW + 2 Temp
VW-108 Concurrent 8 VW + 0 Temp
VW-108 Concurrent 6 VW + 6 Temp
Select the 6 VW + 6 Temp sensor option
VW-108 Concurrent 6 VW + 4 Temp
VW-108 Concurrent 6 VW + 2 Temp
Stage 3 - Automatically configuring the Log File:
4. Press the ‘Auto Assign’ menu option.
Auto-Assign option
From the main menu
First data item
location
Column A
B
C
D
After selection of the ‘Auto Assign’ menu option then Q-Log
automatically assigns the column locations for each data item
being sent from the instruments. The Each column is identified
in exactly the same way as that used in a spreadsheet.
For manual configuration simple press the ‘Config’ button and Column D in the results data table is the first free column into
move the start position of the data to a new location.
which User data can be stored. It should take just a few seconds
The new configuration setting will take effect as soon as the ‘OK’ to configure the Log File.
button is pressed.
Record No Date Time Data
18
16.0 Sensor Configuration Files:
The images below show a sample of the device configuration files available with Q-Log. The configuration files can be edited to
adjust their operation. Editing is done in any package that supports XML file structures.
To add a new device to Q-Log simply edit one of the example files and store under a new name. All configuration files use the
*.xml extension.
Barometer Configuration File
Instrument ID String
The following example shows the parameters transmitted by a dual-axis I-P-I on
receiving a ‘Start Measurement’ instruction. The parameters are preset into the
instrument.
The parameters A, B and E refer to mm/m - X Axis, mm/m - Y Axis, Temp Deg C.
This version of the configuration file I-P-I returns 3 data values and these will be
stored into consecutive columns in a Log file.
I-P-I Configuration File
VibWire-101 with 1 x MUX-16/32 Expansion Unit
Configuration File
17.0
Multi-parameter Sensor Configuration
Some sensors such as the PIEZO-RM range of sensors support a range of
different configuration options to set parameters such as local gravity, engineering
units, level offsets etc. Some management parameters such as the calibration
date, range etc. may be required to be viewed by the User before deploying the
sensor.
To observe management details such as the calibration date. Then
From the ‘Device List’ Tab of the Q-Log Window
PIEZO-RM Water Level Sensor
Press the ‘Config’ button adjacent to the the
chosen sensor. See image below.
4I13KEYNESCOPRESR001
Piezo 10 m range
5I13KEYNESCOPRESR001
Piezo 10 m range
PIEZO-RM Configuration
For the PIEZO-RM range of sensors and
no matter which digital network the
device is deployed on, then the
Configuration Window shown above will
appear.
Select ‘Tool’ button adjacent to the
parameter to be updated.
All of the additional configuration details
that are shown in the menu system
above are stored in the instrument
configuration file.
Other sensors will have similar
configuration Windows containing
different options.
19
18.0 VibWire-101-based Large-Channel Count Q-Log Application:
The application below demonstrates how the Q-Log software is used with the VibWire-101 instrument to create a large-channel
count vibrating wire sensor data-acquisition and display solution. The VibWire-101 is shown connected to the MUX-16/32 unit to
offer either a 16 x 4-wire and 32 x 4-wire sensor interface. A single channel VibWire-101 is included to demonstrate how
single-channel devices are handled within a large-channel count application.
MUX-16/32 Unit
2
3
4
Sensor 12V DC
1
MUX-16/32 Unit
0 Gnd
12 V DC
External
Power
Supply
SDI-12 network
ID = 0
32 x 4 Wire VibWire-101
or RS-485 network
MUX-16/32 Unit
Expansion Hub
Part No USB-SDI12-Pro
Optional
USB-SDI-12 Media Converter
Wiring Diagram
Part No USB-RS485-Pro
USB-RS485 Media Converter
.An external power supply for sensor excitation is required for this
version of the media converter. The power supply keeps the
sensors permanently active.
ID = 5
1 x 4 Wire VibWire-101
ID = 3
16 x 4 Wire VibWire-101
Use the manual for the VibWire-101 to obtain the correct wiring
details for this instrument and the MUX-16/32 unit.
Download the VibWire-101 manual here
VibWire-101 Vibrating Wire Data-Acquisition System:
http://www.aquabat.net/downloads/VibWire101UserManv3.pdf
The individual VibWire-101 instruments are configured using the
terminal port and RS-232/USB media converter. The VW-101
can only currently have a single sensor defined internally by the
Q-Log. When the MUX-16/32 units to create large channel
solutions then this device returns the results for each channel in
digits (Hz2). The formula processing in Q-Log adjusts the
readings for engineering units.
Example of the configuration Window used to to assign the VW
sensor and temperature sensor parameters required to obtain
engineering unit values back from the interface:
Each instrument is
Once the ‘Scan for Devices’ operation is completed then the
‘Device List View’ Window will appear as shown below.
The ‘Auto-Assignment’ button automatically aligns the data
table once the inputs are defined.
VibWire-101/VibWire-108 Sensor Interface only.
20
19.0 Example of a multi-instrument network system:
The following Q-Log example demonstrates the use of a range of intelligent sensors and the AquaDAT
interface to form a simple geotechnical application. This example could simply be one of a number
of distributed sensor systems around a site and can be expanded by incorporating additional USB
media converters to the PC.
USB
Data Link
PIEZO-RM ID = 4
SDI12-HB
Media Converter
Barometer
ID = 2
NP-Strain-1
Single channel strain gauge
ID = 7
I-P-I Tilt Sensor ID = 1
I-P-I Tilt Sensor ID = 0
Laptop / PC
Computer
Strain Monitoring / Crack Meter
AquaDAT Sensor Interface
ID = 5
NP-Strain-1 ID = 8
Temperature Monitoring
AquaDAT Sensor Interface
ID = 3
NP-Strain-1 ID = 9
Q-Log Application
The example below demonstrates how the ‘Device List’ tab will appear for the sensors shown above. These instruments have
been identified after a network scan and the data log configuration setup using the ‘Auto Assign’ operation.
Notice how the data from separate sensors goes into consecutive columns in the results table. The data assignment has been
made automatically but can be adjusted manually if required.
0I13KEYNESCOIPINCL005
1I13KEYNESCOIPINCL005
2I13KEYNESCOBAROMR003
3I13KEYNESCOAQUDAT008
4I13KEYNESCOPRESR001
5I13KEYNESCOAQUDAT008
6I13KEYNESCOPRESR001
7I13KEYNESCOSTRAIN001
8I13KEYNESCOSTRAIN001
9I13KEYNESCOSTRAIN001
I-P-I Dual Axis + Temp
I-P-I Dual Axis + Temp
Barometer mH20 + Temp Deg C
AquaDAT 6 DE Inputs
Piezo 10 m range
AquaDAT 8 DE Inputs
Piezo 10 m range
1 Channel Strain + Temp
1 Channel Strain + Temp
1 Channel Strain + Temp
D..F
G..I
J..K
L..Q
R..S
T..AA
AB..AC
AD..AE
AF..AG
AH..AI
21
GSM Remote Monitoring
The Q-Log application has been designed and tested using Telit GSM modem. Other models can be used however the Hayes
commands used to setup the modem may be different from those shown below.
The free version of Q-Log is limited to a single remote data logger outstation.
Modem Configuration
The following Hayes commands are used by the Telit GSM Modem
Modem : 9600 baud, 8 bit, no parity
PC Modem
Remote Logger
AT+IPR=9600
AT#SELINT=0
baud rate
original interface mode
AT&D2
AT&W
disconnect on DTR low
save
AT+IPR=9600
AT#SELINT=0
AT&S0=1
AT&D0
AT&W
baud rate
original interface mode
auto answer
ignore DTR
save
Modem Model Number
Telit GT-864 modem : Tried and tested modem that has been proven to be reliable
Modem Installation
To have the ability to download data upon demand then the modem on the remote logger has to be
continually powered. The power management is now quite efficient
GSM Setup Options
To activate the GSM remote data download features
Select Qlog - GSM from the pull down menu. The GSM Dialog Window shown below will appear.
1st Download Time
Remote Out-station Modem
mobile network data number
2 ND Download Time
Day tab
Modem Port Number
Day of week
Download selection
Number of columns in
the log file.
Standard Download Times
22
20.4 Identify the Modem Port
The modem Comm Port used by the PC is identified in the operating system using the Control Panel.
The example below shows how to identify the modem comm port using the Microsoft Windows 7 Operating System.
PC is identified from the
Control Panel - System - Device manager - Ports (Com & LPT)
The options may vary slightly between different versions of the Windows Operating System but is essentially the same as that shown below:
Select the Ports (Com & LPT) and a list of ports in use by devices connected
to the PC including the modem will be displayed.
One of the devices that will be identified will be the GSM modem.
In the example Com Port 8 is shown to be used
by the GSM modem.
Modem identified as Com 8
The Com Port number is use by the modem will
change depending on what hardware is in use
by the PC running Q-Log.
20.5 Remote Data Logger Telephone Number
Enter the Modem telephone number into the ‘Phone Number’ text box.
It is common for data SIMMS to be supplied with 2 x telephone numbers. Make sure the ‘Data Number’ is correctly identified
and entered into the text box on the GSM Dialog Window.
Select ‘OK’ button to store new parameters.
Remote Modem SIMM Data Number
07854135065 is a data number for the SIMM.
20.6 Number of columns in the results file
The number of columns of data that can be used to store data from the remote instrumentation can be defined.
Setting the number of columns simplifies any future data analysis operations and makes the files easier to handle in packages
such as Excel. Set the number of columns to be slightly larger than the number of data items returned by the remote data logger
system.
The example shows how to configure the log file for 40 columns of data.
Columns = 40
23
20.7 Automatic Data Downloads
Q-Log has the ability to download data from the remote data logger automatically or on demand.
Data can only be downloaded from a remote data logger so long as the modem connected to the logger can make a network
connection. In any Keynes Controls remote data loggers this is generally done by keeping the GSM modem powered continually.
20.8 Automatic Download Options
The data download options within Q-Log have been kept simple to make sure they are reliable.
The options for automatic down load are:
1.
2..
One download per day at preset time
Two. downloads per day at preset time
The aim of the download is to make sure the data is extracted reliably from the remote location. It is best practice to get the data
out as often as is practical in order to minimise data loss.
Each option can be set to operate for any day of the week and if the configuration is left unattended it will repeat the operation
week in ,week out until adjusted to stop. The days of the week for the download are set using the ‘Day’ Tab.
20.9 Hourly Downloads - Continuous Operation
3.
Hourly download.
The hourly download option takes priority over any other setting. Once activated Q-Log downloads data each hour any will do
this continually until stopped. This is the most reliable of operations and makes sure data is extracted fast and efficiently. The latest
recorded data is downloaded and appended to the Q-Log data files.
21.0 Data on demand
Data on demand is obtained by setting the first download time tab to a couple of minutes later than the current PC time.
On detecting the new download time the call will be made from the data logger PC running Q-Log to the remote data logger.
Information will be extracted and transferred to the data log file. All the data from the previous download until the latest record in
the data logger will be extracted and stored to the log file.
Set the time to 14:01:00 and the next
download will start when the clock reaches
this time.
21.1 Data Amounts
The most reliable form of data transfer is small data blocks at any one time. The GSM mobile phone network is most likely to allow
small amounts of data without any error but may be limited by the network provider to prevent large downloads.
21.2 Data Correction Operations
Once a remote data connection is made to the logger unit Q-Log examines the data logger log file and extracts only the latest data
that has been stored. Data is sent in blocks of 5 records so should the network fail only a minimum amount of data needs to be
re-sent.
22.0 Common Mobile Phone Network Error
The most common error observed in the remote transfer of data and shown in the ‘Terminal Port’ Window is:
No Carrier -
Most common occurrence is due to the failure of the mobile phone network and shows no data transfer possible
Solution:
If data has been sent previously and ‘No Carrier’ message is displayed then leave everything also
and wait for next scheduled download. The problem should be automatically solved by the network supplier.
To try a new download immediately simply adjust the time control to start the download immediately.
24
22.1 Common Modem Errors - Failure to Communicate
The most common cause of failing to configure the system for remote downloading is by installing the wrong type of SIMM into
one, or both of the modems used by the PC and remote data logger unit.
The modems supplied directly by Keynes Controls for remote data applications always uses the Hayes Command set for
configuration and testing. The Hayes command set contains a command that can identify the type of call being made from specified
SIMM installed in a modem.
Command:
AT+CRC=<mode>
Set command controls whether or not the extended format of the incoming call indication is used.
Para mater
<mode>
0 - disables extending format reporting (factory default).
1 - enables extended format reporting.
When enabled, an incoming call is indicated to the TE with unsolicited result code:
+CRING:<type>
instead of the normal RING.
where
<type> - call type:
DATA
FAX
- facsimile (TS 62)
VOICE - normal (TS 11)
22.1 Additional Commands
Command: AT+CRC?
Read command returns the current value of the parameter <mode>.
Command: AT+CTC=?
Test command returns supported values of the parameter <mode>.
22.2 Example Downloads
Timed Download
Hourly Download
Example - 2 data downloads daily at 02:00:00 AM and
21:00:00 each day except on Monday.
Example - Hourly download continuous operation.
In this example the hourly download takes priority over
any other setting.
Data will be downloaded each hour commencing from
the start of the setting of the ‘Hourly’ Option. The first
download will be at the start of the next hour.
25
23.0
Formula
Q-Log can be configured to undertake simple formula processing. Any complex data processing operation is best suited to post
process analysis using third party packages such Microsoft Excel, Matlab or Maple.
The main benefit for Q-Log applications is that it keeps all operations simple. There are no complex manuals to study and the
screens are intuitive. The various formulae are entered under ‘Formula’ tab from the main ‘Q-Log’ Window, see the image on page
XX.
One of the most common applications is to convert vibrating wire sensor details into engineering units.
VW Sensor Interfaces Data Operations
The VibWire-108-SDI12 and VibWire-108-RS485 model interfaces are intelligent devices and can have individual sensor inputs
configured to supply frequency data values as Hz, Digits ( Hz2 ), or engineering units.
The VibWire-101-SDI12 and VibWire-101-RS485 models support many more channels than the VibWire-108 interfaces, but in
order to minimise the hardware configuration they are restricted to supply frequency data values in Hz or Digits only.
User manual: http://www.aquabat.net/downloads/VibWire101UserManv3.pdf
Take care when deciding on the formulae to be used in any calculation that the data type being used is of the correct type.
The worked example in the next section shows how to convert VW crack meter frequency value into engineering units.
Example - Data Record
Record No
Date
Time
D
E
F
where
1200
29012013
11:00
2245
1124.6
2267.1
D = Crack Meter Data Hz
1201
29012013
11:10
2345
1126.7
2268.1
example data values only
23.1 Example 1 -
VW Crack meter
Raw Data Format:
Hz
A single vibrating wire crack meter is attached to a VibWire-108-SDI12 interface unit and connected to a laptop. The VibWire-108
has been configured to supply data values in units of Hz.
The data values
Engineering Units: mm
(milli-meter).
The crack meter as a F0 reading at installation of 2330 Hz, F1 is current sensor frequency from the results table, and the sensor
Calibration Const = 0.0795.
The crack meter data is configured to use Cell D in Q-Log variable list.
Formula used in the data processing:
E= K (F1 2-F02 ) / 1000 mm
Q-Log formula
W = K*((D*D) - (2330*2330)) / 1000 mm
Formula simplifies to
W = 0.000795 * ((D*D) - (2330*2330))
where W = Cell storing results
where T = K / 1000 = 0.0795/1000
where W = cell location in the Formula list.
There is no restriction to where the formula can be inserted into the table. It is good practice to keep the formula variables away
from the immediate data variables that change after each measurement.
26
23.2 Updating Data Values
The formula processing operates for both GSM connected data loggers and for network based sensors. The Q-Log software only
supports SDI-12 and RS-485 digital networks.
SDI-12 & RS-485 network
The data processing using the formula is undertaken automatically after each data acquisition operation.
To plot the calculated values make sure the processed cell is selected.
GSM Data Downloads
Data that is downloaded is processed as it is read by Q-Log. Since the remote download operation is not continuous the data
value most often shown in the ‘Variable View’ Window is the latest value that has been downloaded.
23.3 Latest data values show in the Variable List
Looking at the ‘Variable View’ tab data will appear as
Example Data
Value from VibWire Interface.
2345
Cell W
= 0.000795 * (D*D - 2330*2330)
The W cell is shown in this example but in practice any cell can be
used. It is good practice to keep the calculated values away from the
raw data values. This reduces the chance that the data can be
mis-interpreted.
The 2330 value is the F0 value
Alternatively
Crack Meter
= 0.000795 *((D*D) - (2330 * 2330))
V = 2330 can be set as a constant
and the formula can be changed to:
Cell W
= 0.000795*((D * D) -(V * V))
The calculated cell now shows the
engineering units in mm.
5.5749
23.4 Example 2 - VibWire-108 configures to give results in digits formula modification
Units = Digits (Hz2)
Formula becomes
Units : meters
W = 0.000795*(D -(2330 * 2330) )
or V = (2330 * 2330)/1000 = 5428.9
this formula will give the same answer as the above example but with the vibrating wire sensor undertaking some of the calculations.
Take care to set the units correctly.
27
24.0 Example - Single VibWire-108-SDI12 Vibrating Wire Sensor Application
The following pages shows how to configure a single VibWire-108-SDI12 in the Q-Log using the USB-SDI12-Pro media converter
configured to operate using Com Port 8 in the Microsoft Windows operating system. The VibWire-108-SDI12 has ID = 0.
A single Vibrating Wire interface can be powered directly from the USB-SDI12-Pro media converter.
SDI-12 Digital Network
USB-SDI12-Pro
2135.8
VibWire-108-SDI12
Step-1
Make sure that the Comm Port used by the
USB-SDI12-Pro media converter has been
identified correctly in the operating system.
In the example the USB-SDI12-Pro media
converter is using ‘Comm 8’.
Start Qlog
COM: 8
Step-2
Select the Configuration option and the
‘Logging Configuration’ Window will appear.
Set the Comm Port to 8
Set the Mode to ‘SDI-12’
when the details are inserted the Logging Configuration will
will look like that opposite.
Each SDI-12 sensor or interface uses an individual ID number to identify it on a network.
In this worked example the VibWire-108-SDI12 has an ID = 0.
Step-3
Select the ‘Scan for devices’ option.
The status LED indicator will flash and
after a few seconds the Q-Log screen will
show the VibWire-108-SDI12 has been
identified.
Q-Log Main Window
24.1 Data Acquisition Rate
The data acquisition rate is shown in the ‘Logging Configuration’ Window to be set at 2 mins.
Use the pull down menu options to adjust this figure. The VibWire-108 takes approximately 30 seconds to
scan 8 vibrating wire sensors.
28
24.2
Selecting the VibWire-108 data options.
The VibWire-108-SDI12 can be configured to use 1 to 8 vibrating wire sensors and return all of the data values. The maximum
number of data values that can be returned is 16. There are a maximum of 8 frequency values and 8 temperature values.
To minimise the scan time of the VibWire-108 then the number of channels in use is set on the device itself. The default configuration
of the VibWire-108 is 8 x Freq + 8 x Temp channels.
Step-4
Press the ‘Setup’ button and the ‘Device Setup’ Window will appear.
24.3 Store 8 x Frequency + 8 x Temperature Values
Select the Pull down menu options under the ‘Configuration’ title in the
‘Device Setup’ Window.
The number and type of data values that are stored to the data file are
shown in the list.
Select the option ‘VW108C 8 Freq 8 Temp’ and 16 values will be stored to
the data file.
Further Technical Information
The number of data values returned to Q-Log is set in the sensor or instrument. If the VibWire-108 is not physically configured to
return 16 data values then Q-Log cannot store them. The ‘0’ value will appear in any column in the data file when a value is missing.
To speed scanning of a series of vibrating wire sensors, the number of channels to be used can is set in the instrument.
It takes approximately 12 seconds to scan 4 channels of a VibWire-108. The instrument can only 4 x 2 = 8 values.
Data Table Positions
To position data into a specified column in the data file simply the start position using the pull down menu list available under the
‘Start Column’ in the ‘Device Setup’ Window.
The example above shows that the first data value from the VibWire-108-SDI12 is stored into column ‘E’.
Depending on the configuration option chosen the number of data values to be stored is automatically assigned.
A VibWire-108-SDI12 with 4 channels in operation will start at column ‘E’ and finish at ‘L’
29
25.0 Strain Gauge Application
The following pages details how to use the NP-Strain-1 single channel SDI-12 interface card to undertake a strain gauge
measurement.
A 1K Ohm ¼ bridge strain gage is attached to the NP-Strain-1 card.
The device is calibrated for the measurements to be undertaken and set to give engineering output values in micro-strain.
1 K Ohm
gage
Rs
Rs
Pin-1
2
3
4
The image opposite demonstrates how a ¼ bridge strain gauge is
connected to the NP-Strain-1 interface card.
Rs
¼ Bridge Strain Gage
Part No.
NP-Strain-1-SDI12
SDI-12 Data
OV
Q-Log Appliction
4
5
6
SDI-12 0V
SDI-12 Data
USB
Port
3
SDI-12 +12V DC
SDI-12 +12V DC
The image opposite demonstrates how to connect
the NP-Strain-1 card to a PC for data recording
operations.
2
SDI-12 0V
1
25.1 Connection to a PC
SDI-12 Data
SDI-12 +12V DC
USB Media
Converter
The USB-SDI12-Pro media converter powers the
NP-Strain-1 card directly from the computer USB Multiple NP-Strain-1 card system
port.
Multiple NP-Strain-1 cards can be connected
Part Numbers
together on a network.
USB-SDI12-Pro
NP-Strain-1-SDI12
Media converter
Single channel strain gauge
SDI-12 interface
Each individual device will be identified on the
network and data processed as described in the
examples below.
Further information
USB-RS485-Pro
SDI-12 or
RS485 network
NP-Strain-1
To USB port
Each individual card can be used
485 version media converter
25.2 Bridge Circuit Options
Strain calculation using 1, 2 or 4 active arms
The images below show how the different bridge
options are connected to the NP_Strain-1 card.
Full Bridge Strain Gauge
Strain
Gauge
½ Bridge Strain Gauge
Strain
Gauge
Pin-1
2
3
4
Strain
Gauge
Rs
N = 4 for full bridge
2 for half bridge
1 for quarter bridge
Pin-1
2
3
4
Strain
Gauge
Rs
Example circuit shows a full (N=4)
bridge strain gauge and thermistor
Example circuit shows a half (N=2)
bridge strain gauge and thermistor.
GF = Gage Factor
Ex = Bridge Excitation = 3.3 V
= strain
eo = Output Voltage
N = Number of effective arms
Bridge Zero Offset Correction
The NP-Strain-1 sensor does not zero correct the bridge
and assumes the User will correct the error in post
processing of the data.
3 Wire Strain Gauge Interface
¼ Bridge Strain gauge
Temperature coefficient of Gage Factor (TCGF)
Rwire
Rs
Rs
Rwire
Rwire
Rs
Example circuit shows a half bridge strain
gauge (N=2) with 3 wire interface - reduces
cable length effects.
Rs
Pin-1
2
3
4
This is the change of sensitivity of the device to strain
with change in temperature. This can be compensated
for in the calibration equations but it is recommended
to be post process corrected in any data analysis.
Rs
Example circuit shows a quarter (N=1)
bridge strain gauge and thermistor.
Temperature Measurement
A precision thermistor is used by the NP-Strain-1 card
to make local temperature measurements.
30
26.0
Worked Example - Setting the calibration factors into the NP-Strain-1 card
A ½ bridge strain gauge with resistance Ro = 350 Ohm with GF = 2.0 Excitation voltage = 3.3 V D, Range = +/- 1500 micro-Strain
is fitted to the NP-Strain-1 interface card. It is observed that the bridge offset is 0.23 V DC with no load.
It is noted under test using a strain gage calibrator that at 1500 micro-Strain bridge voltage = 0.2345 V DC and at
200 micro-Strain the bridge voltage was measured at 0.23066 V DC.
NP-Strain-1 card is to be configured to return data values in engineering units.
Engineering Units
In order to have the NP-Strain-1 card return data in engineering units then the strain gage calibration factors have to be set.
The output from the strain gauge is presumed to be linear over range
For the example above the following factors will be used m (gain) = 338.541
and Offset C = -778.8802
Yout = Vin . 338.541 - 778.8802 where Vin is the bridge output voltage as measured by the NP-Strain-1 card.
The calibration factors are included as examples only.
26.1
Entering Configuration values using Q-LOG
1. Scan the chosen network for devices
Identify the NP-Strain-1 card to have the calibration factors installed.
2. Press the ‘Config’ button from the ‘Device Calibration Window’ shown below will appear.
Select the ‘Strain Gauge’ option.
NP-Strain-1 card with ID = 3
This operation ensures that the correct number
and type of data is returned to the Q-LOG software.
SDI-12 Identifier string
Press the ‘Config’
button
Strain Gauge
sensor type
Start location in the
data table
Fig-2
Q-LOG Device Setup Window
ID number
3I13KEYNESCOSTRAIN027 Strain gauge
Identifier string for the strain gauge card
‘Device Calibration ’ Window
Enter -778.8802 - press ‘Set’ to confirm value - Offset value
Enter 338.541
- Scale value
Once the calibrations are set into the device then the
NP-Strain-1 card will report data values in engineering units.
25.2
Returned data values
Once the calibration factors are set, then the command
SDI-12 command:
RS-485 command:
3M! 3D0!
%3M! 3D0!
(Keynes 485 intelligent instruments)
will return
Data:
31
micro-Strain, Temp (Deg C)
27.0
Strain Gauge Application - Q-Log Formula Processing
The following example demonstrates how to use Q-Log software formula processing; to convert a direct strain gauge reading into
engineering units.
The same procedure to convert a raw voltage reading into strain value, regardless to the device making the reading. Keynes
Controls use the AquaDAT sensor interface, or the NP-Strain-1 card to make strain gauge readings.
Example
A ½ bridge strain gauge with resistance Ro = 350 Ohm with GF = 2.0 Excitation voltage = 3.3 V D, Range = +/- 1500 micro-Strain
is fitted to the NP-Strain-1 interface card. It is observed that the bridge offset is 0.23 V DC with no load.
It is noted under test using a strain gage calibrator that at 1500 micro-Strain bridge voltage = 0.2345 V DC and at
200 micro-Strain the bridge voltage was measured at 0.23066 V DC.
For the example above the following factors will be used m (gain) = 338.541
and Offset C = -778.8802
How to determine the value of the calibration factors is not part of this example.
Formulae
Output
-strain = Vin * 338.541 - 778.8802
where Vin is the war input voltage to the
NP-Strain-1 card.
The output from the strain gauge is presumed to be linear over range
Temperature
Celsius to Fahrenheit: (°C × 9/5) + 32 = °F
Therefore the formula for Q-Log will be
Strain:
[Cell D] =(O*338.541)-778.8802
Temp:
[Cell E] =(P*9/5)+32
– converts temp in Deg C from NP-Strain-1 card to Deg F
where 0 = raw strain data value
and P = temp in Deg C
1. Select the ‘Formula’ tab and the Window below will
appear.
2. Enter the strain and temperature formula into cells ‘C
and D’ respectively.
Q-Log - Main Window
Inserted formulae
This Window identifies the sensors and
interfaces that have been identified on the
network.
Real time results
Strain:
[Cell D] =(O*338.541)-778.8802
Temp:
=(O*338.541)-778.8802
=(P*9/5)+32
[Cell E] =(P*9/5)+32
Engineering units
Formula Window
value in
All of the formulae used by an application
are shown in this Window.
Strain
1772.247
62.69
Deg Fahrenheit
Panel meter 2 x 1 display used
to show present the results
acquired by the NP-strain-1
card.
62.69
17.05
Variable Window - shows real-time results
The Variable Window displays both the raw and
engineering data values.
2 x 2 Panel meter display
32
QLog Quick Installation & Set-up Guide
27.0
Installation
The installation file for Q-Log consists of a single Zip file that is freely downloaded from the Keynes Controls Web Site
Download the latest copy of the software from
http://www.aquabat.net/QLOGFree/qlogv2.html
Open the Zip file to obtain access to the QLog setup file within. This is an automatic operation for most Microsoft Windows
Operating systems.
Then
IMPORTANT NOTE
The Q-Log software communicates to the intelligent sensors using a network
connected to a PC using one of the media converters.
Start the application QLogsetup
Select components to install
Click next
Change the destination directory if required
Click Install
When completed click Close
Q-Log supports both RS-485 and SDI-12 networks.
For any sensors to be identified then the Comm Port being used by the media
converter has to be known.
Details of how to identify the Com Port in use are shown on Page 7. The actual
Windows screens will differ slightly between the different versions of the
Operating System but will be similar to what is shown.
The default Q-Log installation Window.
Select ‘Next’ to complete the installation.
QLog will now be available from your START menu
Starting up first time
Select START\Qlog
The default Q-Log Window as shown opposite will appear.
There are currently no instruments identified by the software.
33
On the QLog window select QLog\Configuration
The following Window will appear
Com Port
Enter the COM Port for the USB media converter used
to connect the sensors to the PC.
In this example the Com Port No is shown as 14.
Logging Rate
Select the desired sample rate from the pull down
menu options
The example shows a sample rate of 60 seconds
File Name
Enter the file name to store the results into the box
provided.
Mode
Ensure that the correct network media converter type
is assigned.
SDI-12 or RS-485
In this example the SDI-12 media converter is shown
being used.
34
Using the Logging Configuration Window select the following
1. COM Port. (The drop down box will provide a list of ports. To determine which one your devices are using select
‘START\Control Panel\System’ then click on ‘Device Manager’ and ‘Com Ports’. As there may be several Com Ports in
use on your computer verify your devices connection by disconnecting and reconnecting the USB lead. The Com Port
number in question will disappear and then reappear again in the list)
2. Ignore ‘Logging Interval’ for now, this can be adjusted later.
3. Enter a file name for Data Logging and click ‘New’
4. Select a mode from the drop down list, e.g. SDI-12 or RS485 for locally connected devices.
5. Click OK
Next select QLog\Scan for devices.
The list thus produced will allow setting up of relevant parameters for each device.
This completes the initial start-up procedure.
The relevant manuals for each device now needs to be read in conjunction with the QLog main manual for device specific set up
and configuration.
Installation Errors
The most common installation errors are:
1. Installation of Q-Log using standard User Account instead of ‘Admin Account’
35