1
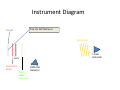
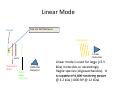
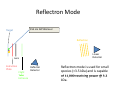
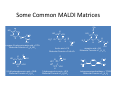
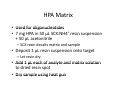
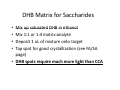
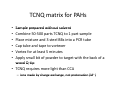
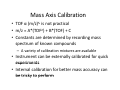
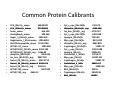
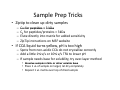
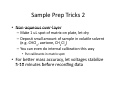
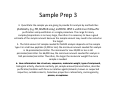
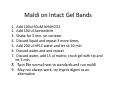
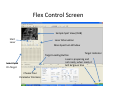
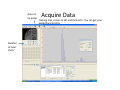
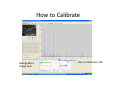
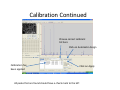
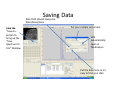
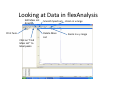
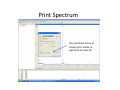
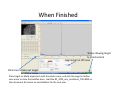
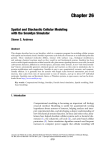
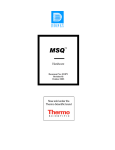
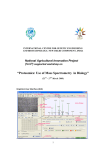
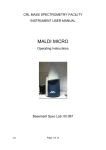
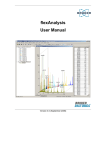
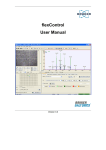
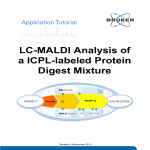
Autoflex Basic User Manual
Last Updated August 26, 2009
What is the Bruker Autoflex III?
• Time‐of‐flight mass spectrometer
– Ions of given same kinetic energy
• heavy ions travel slower than lighter ones
– Two modes of operation
• Linear (for labile molecules or anything bigger than 5kDa)
Linear (for labile molecules or anything bigger than 5kDa)
• Reflectron (great for small molecules and peptides)
– Capable of limited MS‐MS
• Instruments in Proteomics R&D Facility are MUCH better for MS‐
MS and MSn
• MALDI/LDI source
MALDI/LDI source
– 384 position target plate (~1 µL spot size)
– 355 nm frequency tripled Nd:YAG
q
y p
SmartBeam® laser
• Can photolyze labile groups, e.g. FITC labels
– Can analyze positive or negative ions (same spot)
What Samples Can It Run?
What Samples Can It Run?
• Biopolymers
– Peptides, proteins, DNA, RNA, oligosaccharides
Peptides, proteins, DNA, RNA, oligosaccharides
• Organometallic complexes
– Organometallic salts work great
• Some synthetic polymers
– Polypropylene glycol, PAMAM dendrimers
– Polycyclic aromatic hydrocarbons with TCNQ
l
l
h d
b
h
• Molecules that photoionize upon irradiation by 355 nm laser
nm laser
– Porphyrins
– Organometallic complexes
What Samples Can’tt It Run?
What Samples Can
It Run?
• “Dirty” samples
– Significant concentration of involatiles
• Glycerol, urea, most buffers, many detergents
– Alkali metal salts can be quite problematic
• RNA/DNA analyses require extensive desalting
• Molecules with significant vapor pressures
– Instrument is held at ~10‐7 torr
• Molecules that do not ionize in source
– Lack charge acceptor/donor site
Lack charge acceptor/donor site
– Cannot photoionize with N2 laser
General Sample Guidelines
General Sample Guidelines
• Purify analyte if possible
– Analyte
A l t should be 5 –
h ld b 5 100 µM in concentration
100 M i
t ti
– ZipTips can purify dirty samples (C4 and C18 are in MSF)
• Use only volatile solvents/buffers
Use only volatile solvents/buffers
– MeOH, H2O, acetone, CH3CN, THF, CH2Cl2, C6H6
– TFA, HOAc, formic acid, NH3, etc.
– Ionic strength < 30 mM (e.g. 0.1% v/v HOAc)
• Acidic conditions required for proper crystallization of many matrices
many matrices
– Lack of acidic conditions can be overcome in some cases
• Need at least 2 µL
Need at least 2 µL
Instrument Diagram
355 nm Nd:YAG laser
Target
R fl t
Reflectron
Linear
Detector
Lens
Extraction
Plate
Flight
Tube
Entrance
Reflector
Detector
Linear Mode
355 nm Nd:YAG laser
Target
R fl t
Reflectron
Linear
Detector
Lens
Extraction
Plate
Flight
Tube
Entrance
Reflector
Detector
Linear mode is used for large (
Linear
mode is used for large (>3.5
3.5 kDa) molecules or exceedingly fragile species (oligosaccharides). It is capable of 4 000 resolving power
is capable of 4,000 resolving power @ 3.2 kDa (1000 RP @ 12 kDa)
Reflectron Mode
355 nm Nd:YAG laser
Target
R fl t
Reflectron
Linear
Detector
Lens
Extraction
Plate
Flight
Tube
Entrance
Reflector
Detector
Reflectron mode is used for small species (<3.5 kDa) and is capable of 11 000 resolving power @ 3 2
of 11,000 resolving power @ 3.2 kDa.
MALDI Advantages
MALDI Advantages
• Technique is relatively simple
Volatilize and ionize labile molecules
• Volatilize and ionize labile molecules – Imagine electron ionization on a protein
• MALDI creates very simple mass spectra
y
p
p
– Ions are usually (M+nH)n+ or (M‐nH)n‐
– Only 1‐3 charge states are observed
• Usually 1 charge state for peptides < 4 kDa
U ll 1 h
t t f
tid
4 kD
• MALDI ideal for time‐of‐flight analyzers
– Theoretically unlimited mass range (130 kDa
Theoretically unlimited mass range (130 kDa done here)
done here)
• MALDI is very rapid (<1 min/spot)
p
p
( µ )
• Low sample consumption (1 µL)
• Wide array of matrices available for different analytes
Some Common MALDI Matrices
Some Common MALDI Matrices
HO
C
HC
H
C
C
H
CH3
CH
C
HO
C N
C C
H
C O
H3C O
C
C
OH
a-cyano-4-hydroxycinnamic acid = CCA
Molecular Formula =C10H7NO3
HO
C
HC
H
C
C
H
C
C
H
C C
H
C O
H3C O
C
C
C
C
H
CH
C
H
C C
H
C O
OH
sinapinic acid = SA
Molecular Formula =C11H12O5
O
HC
2,5 dihydroxybenozoic acid = DHB
Molecular Formula =C7H6O4
HO
CH
ferulic acid = FA
Molecular Formula =C
C10H10O4
C OH
OH
C
H
O
OH
O
C
H
C
HC
N
C
C OH
C
C
OH
H
3-hydroxypicolinic acid = HPA
Molecular Formula =C6H5NO3
N C
C N
N C
C N
tetracyanoquinodimethane = TCNQ
Molecular Formula =C12H4N4
CCA Matrix
CCA Matrix
• Good matrix for compounds <10 kDa
Good matrix for compounds <10 kDa
– Makes relatively homogenous flat spots
• Mix
Mix 10 g/L in 45% CH
10 g/L in 45% CH3CN, 5% (CH3)
CN 5% (CH3)2CO, 0.1% CO 0 1%
TFA in H2O (instructions on balance)
• Combine 1 part analyte with 5 parts matrix
– Ratio can be adjusted depending on sample
• Deposit 1 µL on target and let air dry
FA and SA Matrices
• Matrices for compounds >10 kDA
– Spots are not homogenous or flat
– Crystallization often must be assisted (tap spot)
• Sigma premix SA (directions on balance) – spots are made by mixing 5:1 matrix:analyte
spots are made by mixing 5:1 matrix:analyte
– Deposit 1 µL on target (no tapping required)
• Mix 0.15 M matrix in EtOH (alternate method)
–
–
–
–
–
32.4 g/L for FA, 33.6 g/L for SA
Mix 7 parts analyte + 3 parts matrix; put 1 µL onto target
Wait 30 sec
Tap spot with pipette tip until tiny crystals form
Stir crystals around so entire spot is covered with crystals
• SA and FA spots require more laser power than CCA
SA and FA spots require more laser power than CCA
HPA Matrix
HPA Matrix
• Used
Used for oligonucleotides
for oligonucleotides
• 7 mg HPA in 50 µL SCX:NH4+ resin suspension 50 µL acetonitrile
+ 50 µL acetonitrile
– SCX resin desalts matrix and sample
• Deposit 1 µL resin suspension onto target
Deposit 1 µL resin suspension onto target
– Let resin dry
• Add
Add 1 µL each of analyte and matrix solution 1 µL each of analyte and matrix solution
to dried resin spot
• Dry sample using heat gun
Dry sample using heat gun
DHB Matrix for Saccharides
DHB Matrix for Saccharides
Mix up saturated DHB in ethanol
Mix
up saturated DHB in ethanol
Mix 1:1 or 1:4 matrix:analyte
Deposit 1 uL of mixture onto target
i
f i
Tap spot for good crystallization (see FA/SA page)
• DHB spots require much more light than CCA
p
q
g
•
•
•
•
TCNQ matrix for PAHs
TCNQ matrix for PAHs
Sample prepared without solvent
Sample
prepared without solvent
Combine 50‐500 parts TCNQ to 1 part sample
Place mixture and 3 steel BBs into a PCR tube
Place mixture and 3 steel BBs into a PCR tube
Cap tube and tape to vortexer
Vortex for at least 5 minutes
Vortex for at least 5 minutes
Apply small bit of powder to target with the back of a wood Q‐tip
wood Q
tip
• TCNQ requires more light than CCA
•
•
•
•
•
•
– Ions
Ions made by charge exchange, not protonation (M
made by charge exchange not protonation (M+.)
Mass Axis Calibration
Mass Axis Calibration
• TOF α (m/z)½ is not practical
• m/z = A*(TOF2) + B*(TOF) + C
• Constants are determined by recording mass y
g
spectrum of known compounds
– A variety of calibration mixtures are available
y
• Instrument can be externally calibrated for quick experiments
• Internal calibration for better mass accuracy can be tricky to perform
be tricky to perform
Calibration Part 2
• The Autoflex III is prone to calibration drift
– Up to 0.25 amu
Up to 0 25 amu between successive spectra in reflectron
between successive spectra in reflectron
mode
– Up to 2 amu
Up to 2 amu between successive spectra in linear mode
between successive spectra in linear mode
• Instrument should be started at the beginning of each set of experiments (external calibration)
each set of experiments (external calibration)
• Calibrant masses need to as precisely defined as possible (3‐4 decimal places preferred)
ibl (3 4 d i l l
f
d)
• Calibration can be performed in FlexControl and FlexAnalysis
Calibration Mixtures
Calibration Mixtures
• 4700 mix
– Peptide mixture with masses from 379‐3659
• Mix F
– Protein mixture with masses from 2466‐8566
• Dextran D10
– Oligosaccharide mixture with masses from 600‐2500
Oli
h id
i
ih
f
600 2500
• Trypsinogen/Myoglobin
– Protein mixture with masses from 8,476 to 23,981
P t i
i t
ith
f
8 476 t 23 981
• Other compounds and mixtures are available, just ask Jon and Angie
ask Jon and Angie
External Calibration
External Calibration
• Calibrants and anlayte are in different MALDI spots
t
• Vials of 4700 mix and Protein mix F are in the red MALDI k
MALDI rack.
– Prepare spots as described previously
– For other calibrant mixes, talk to MSF staff
F
th
lib t i
t lk t MSF t ff
• Make new calibration spots daily
• Calibration tips
– Use 4 calibration peaks and a quadratic fit
– When using mix F, I find using only +1 ions gives better results
Internal Calibration
Internal Calibration
• Spot Preparation
– Mix 1 µL of calibrant mixture with 5 µL matrix
Mi 1 L f lib t i t
ith 5 L
ti
• This is for mix F and 4700 mix, other mixtures use different ratios
• Deposit 1 µL on target
– Mix 1 µL of analyte solution with 5 µL matrix
• Deposit 1 µL on target (control sample)
– Mix
Mix 1 µL of calibrant/matrix mixture with remaining 1 µL of calibrant/matrix mixture with remaining
analyte/matrix mixture
• Deposit 1 µL on target
• Record
Record mass spectrum and recalibrate the mass scale mass spectrum and recalibrate the mass scale
as described previously
Multiple tries may be required to find a useful
• Multiple tries may be required to find a useful calibrant:analyte ratio
Common Protein Calibrants
Common Protein Calibrants
•
•
•
•
•
•
•
•
•
•
•
•
•
•
•
•
•
CCA_[M+H]+_mono 190.05043
CCA [2M+H]+ mono
CCA_[2M+H]+_mono 379.09303
379 09303
heme_mono
616.198
desArgBrady_mono
904.468
Angio_II_[M+H]+_mono 1046.542
Angiotensin I M+H+mono 1296 6853
Angiotensin_I_M+H+mono 1296.6853
Glu1Fibrinopeptide_mono 1570.6768
ACTH(1‐17)_mono
2093.086
ACTH(18‐39)_[M+H]+_mono 2465.199
ACTH(18 39) [M+H]+ avg 2466 68
ACTH(18‐39)_[M+H]+_avg 2466.68
ubiquitin_[M+3H]3+
2855.923
Ins_bov_[M+2H]2+_avg 2867.782
Somat_28_[M+H]+_mono 3147.4714
Somat 28 [M+H]+ mono+1 3148 472
Somat_28_[M+H]+_mono+1 3148.472
Somat_28_[M+H]+_avg 3149.61
ACTH(7‐38)_mono
3657.929
ACTH(7‐38)_avg
3660.12
•
•
•
•
•
•
•
•
•
•
•
•
•
•
•
•
•
•
Cyt_c_equ_[M+3H]3+ 4121.03
Ubiquitin [M+2H]2+ avg
Ubiquitin_[M+2H]2+_avg 4283.446
4283 446
Ins_bov_[M+H]+_avg
5734.557
Cyt_c_equ_[M+2H]2+ 6181.048
Lysozym_[M+2H]2+ 7153.60
Myo equ [M+2H]2+
Myo_equ_[M+2H]2+ 8476.780
8476 780
Ubiquitin_[M+H]+_avg
8565.885
trypsinogen_[M+2H]2+
11991.47
Cyt_c_equ_[M+H]+ 12361.088
Lysozym [M+H]+
Lysozym_[M+H]+ 14306.20
14306 20
CarbAnhyd_II_M2H++ 14513.37
Myo_equ_[M+H]+ 16952.551
trypsinogen_[M+H]+
23981.93
CarbAnhyd II MH+
CarbAnhyd_II_MH+ 29025.74
29025 74
Myo_equ_[2M+H]+
33904.09
BSA_[M+2H]2+ 33216.
Trypsinogen (2M+H)+
58049.58
BSA [M+H]+
BSA_[M+H]+ 66431.
66431
A Word About Isotopes
A Word About Isotopes
• Instrument can resolve the isotopic pattern of compounds < 5 kDa in reflectron mode
• Many molecular weight calculators compute the isotopically averaged mass
–A
Assume 1.1% of C is 1 1% f C i 13C, not C
t 12C
• Monoisotopic masses are what we label in reflectron mode data
– All 12C, 1H, 14N, 32S, 16O
• Monoisotopic masses are NOT usually observed in linear mode for species > 2 5 kDa
mode for species > 2.5 kDa
• Be aware of which mass your computer program predicted
Monoisotopic vs. Average Mass
Monoisotopic vs. Average Mass
13C
0
13C
1
Linear
3660.18
Linear
1570.70
13C
0
13C
1
Reflectron
1570.81
In
ntensity
Intensity
13C
2
13C
1
13
3C
2
1570
m/z (Th)
Reflectron
13C 3657.96
3
13C
0
1560
13C
2
1580
3650
13C
4
3660
m/z (Th)
3670
Interpreting Data: Mass Defect
p
g
• Atomic weights are not integers (except 12C)
–
–
14N = 14.0031 Da; 11B = 11.0093 Da; 1H = 1.0078 Da
16O = 15.9949 Da; O 15 9949 D 19F = 18.9984 Da; F 18 9984 D 56Fe = 55.9349 Da
F 55 9349 D
• Difference from integer mass is called “mass defect” or “fractional mass”
– Related to nuclear binding energy
• Sum of the mass defects depends on composition
– H, N increase mass defect
H N increase mass defect
• Hydrogen‐rich molecules have high mass defects • Eicosane (C20H42)= 282.3286
– O, Cl, F, Na decrease it
O Cl F Na decrease it
• Hydrogen deficient species have low mass defects
• Morphine, (C17H19NO3) = 285.1365
• Average peptide: n*(C
Average peptide n*(C4.94H7.76N1.36O1.48S0.04)
Peptide Mass Defect Figure
Dependence of the fractional masses of predicted Caulobacter tryptic peptides on their nominal masses. The red squares represent the locations of the matrix‐alkali cluster masses [Figure from Karty et al in J. Chrom. B. v782 pp363‐383 (2002)].
Sample Prep Tricks
Sample Prep Tricks
• Ziptip to clean up dirty samples
–
–
–
–
C18 for peptides < 3 kDa
for peptides < 3 kDa
C4 for peptides/proteins > 3kDa
Elute directly into matrix for added sensitivity
ZipTip instructions on MSF website
ZipTip instructions on MSF website
• If CCA liquid turns yellow, pH is too high
– Spots from non‐acidic CCA do not crystallize correctly
p
y
y
– Add a little 1% v/v or 10% v/v TFA to lower pH
– If sample needs base for solubility, try over‐layer method
• Dissolve sample in NH
Dissolve sample in NH3 or other volatile base
or other volatile base
• Place 1 uL of sample on target, let dry completely
• Deposit 1 uL matrix over top of dried sample
Sample Prep Tricks 2
Sample Prep Tricks 2
• Non
Non‐aqueous
aqueous over
over‐layer
layer
– Make 1 uL spot of matrix on plate, let dry
– Deposit small amount of sample in volatile solvent p
p
(e.g. CHCl3, acetone, CH2Cl2)
– You can even do internal calibration this way
• Put calibrants in matrix spot
• For better mass accuracy, let voltages stabilize 5 10 i
5‐10 minutes before recording data
b f
di d
Sample Prep Continued
Sample Prep Continued
Samples for MALDI‐TOF analysis need to meet certain requirements for obtaining good spectra. The more careful you prepare samples (including early steps of isolation and preparation) the more likely a successful analysis will be. Here are p p
)
y
y
some guidelines of which kind of treatment is advantageous for mass spectrometric analysis and which is not
1. Avoid the use of non‐volatile agents like salts (NaCl, CaCl2, KH2PO4), detergents
(Tween, Triton, SDS), chaotropic agents (Urea, Guanidinium salts) and non‐volatile
solvents like DMSO, DMF, or Glycerol.
2. If you can’t avoid these agents, purify. Dialysis, ZipTips, and RP‐HPLC are good
purification methods if you use volatile solvents and buffers (e.g. 0.1% v/v
trifluoracetic acid, 10 mM NH4HCO3). After purification, lyophilize if possible. Ion
exchange beads may work well for salt removal.
3. Suitable solvents are ones that are volatile. For sample work up and purification:
water, ammonium hydrocarbonate, ammonium acetate, ammonium formate,
acetonitrile, trifluoroacetic acid.
Sample Prep 3
Sample Prep 3
4. Quantitate the sample you are going to provide for analysis by methods like:
photometr (e OD Bradford assa ) and ELISA HPLC is sef l sin e it allo s for
photometry (e.g. OD, Bradford assay), and ELISA. HPLC is useful since it allows for
purification and quantitation in a single procedure. The range for many
samples/preparations is not very large, therefore it is necessary to have a good
estimate of the sample amount because the sample amount may need to be varied on
the target.
5. The total amount of sample needed for MALDI analysis depends on the sample
type. For small mw peptides (1,000 or less) the minimum amount needed for analysis
is 16 picomoles/microliter. The minimum for mw 20,000 or less is 60
picomoles/microliter. For 66,000 mw, the minimum amount needed for analysis is
160 picomoles/microliter. Therefore, the larger the molecular weight the more
sample is needed.
6. Give information like: structure, sequence, molecular weight, type of compound,
6. Give information like: structure, sequence, molecular weight, type of compound,
biological activity, chemical reactivity, pH, sample amount/concentration, describe
purification/isolation with focus on relative agents/solvents, known or suspected
impurities, suitable solvents, hazardous properties: radioactivity, carcinogenicity,
poison or explosive
poison, or explosive.
Maldi on Intact Gel Bands
on Intact Gel Bands
1. Add 100ul 50uM NH4HCO3
2. Add 100 ul Acetonitrile
3. Shake for 5 min. on vortexer
4 Di
4. Discard liquid and repeat 3 more times
d li id d
t3
ti
5. Add 200 ul HPLC water and let sit 10 min
6. Discard water and and repeat
6. Discard water and and
7. Discard water, add 15 ul matrix; crush gel with tip and let 5 min
8 Spot like normal next to standards and run maldi
8.
S
lik
l
d d
d
ldi
9. May not always work, try tryptic digest as an alternative
Starting the Software
Starting the Software If closed click on this to analyze your data
y y
If closed click on this window to start the analysis
Flex Control Screen
Flex Control Screen
Sample Spot View (DHB)
Start Laser
Laser Attenuation
Laser Attenuation
Mass Spectrum Window
Target Indicator
Target Loading Button
Laser is preparing and not ready; when ready it y;
y
will be green also
Select Spot
Select
Spot
On Target
Choose Your Parameter File Here
Suggested flexControl Methods
Suggested flexControl
Use the 4 highlighted methods from above
Zoom in on peaks
Number of laser shots
Acquire Data
Acquire Data
Clicking max. cursor to left and Peak info. You can get your peak characteristics
How to Calibrate
How to Calibrate
Change Mass Change
Mass
Range Here
Click on Calibration Tab
Calibration Continued
Calibration Continued
Choose correct calibrant
list here
Click on Automatic Assign
Calibration has been applied
All peaks that are found should have a check mark to the left
Click on Apply
Calibrant List
•
•
•
•
•
•
•
4700 mix (masses from 904
4700
mix (masses from 904‐3660)
3660)
Dextran 680‐2350
Protein Mix F (masses from 2465‐8465)
i
i (
f
2 6 8 6 )
MSF Big proteins (masses 6181‐132861)
Porphyrins
4700 neg (902
4700 neg
(902‐3658
3658 negative ion)
negative ion)
You can make your own lists (see Jon or Angie)
Saving
Saving Data
Data
Data Path should always be:
Data\Group\User
Click the Click
the
“Save As… button to bring up the “Save Spectrum To File” Window
Put your sample name here
y
p
Will automatically t
ti ll
open in flexAnalysis
Put the date here so it’s easy to find your data
Looking at Data in flexAnalysis
Looking at Data in flexAnalysis
Edit Mass List directly
Print here
Smooth Spectrum
Delete Mass List
Click on Click
on “Find
Find Mass List” to label peaks
Zoom in x range
Zoom in x‐y range
Processing Data in flexAnalysis
Processing Data in flexAnalysis
Pick your method to Pick
your method to
process your data here (see window to right) and apply
Print Spectrum
Print Spectrum
Use pull down menu to choose print mode i.e. spectrum or mass list
When Finished
When Finished
Status showing target is in instrument
Beginning Cut off mass
Click once to take out target
Place target on Maldi prep bench with the plastic cover, and click the target in button once more to close the Autoflex door. Load the RP_4700_mix_conditions_700‐4000 so the instrument HV comes on and stabilizes for the next user.
Note: Never save a change to a method that’s been modified!
h d h ’ b
df d
DO NOT SAY “YES”
Online Billing
Online Billing
• Always
Always enter the samples online first before enter the samples online first before
you run your sample(s) so you can put your data base number in with your sample name
data base number in with your sample name
• Go to http://msf chem indiana edu/default htm to http://msf.chem.indiana.edu/default.htm
to
enter your sample(s)
• Log samples you run on the paper sheet next L
l
h
h
to the printer