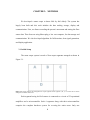
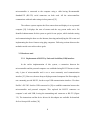
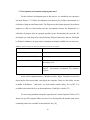
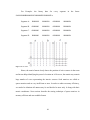
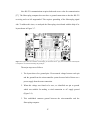
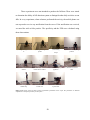
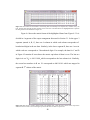
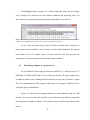
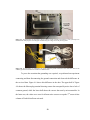
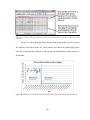
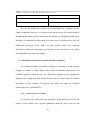
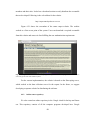
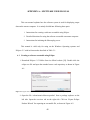
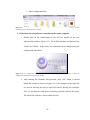
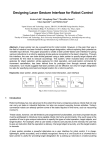
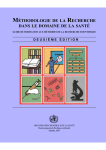
1
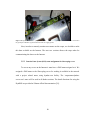
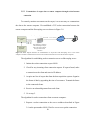
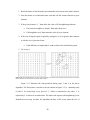
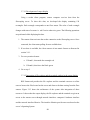
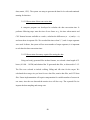
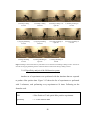
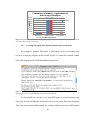
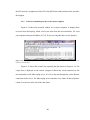
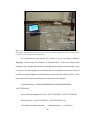
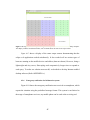
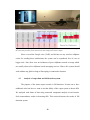
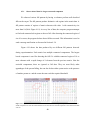
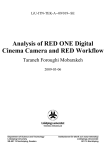
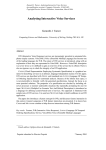
compatible with new computers. Figure 4-1 shows the data received on computer’s
terminal emulator. Each line in the figure shows one frame of data. The sensors’ activation
information for segments A, B, and C is sent between S and E representing starting and ending
words respectively. The time of occurrence of each frame is appended after comma.
Figure 4-1: Data received from microcontroller, connected on USB interface is displayed on receiving computer’s
terminal emulator, appended with its timestamp
We used the USB port for further implementation of this project, in particular to
observe the data on terminal emulator (SecureCRT) and the graphical display of the
sensors (Refer APPENDIX A:). We also developed memory efficient data storing
techniques as discussed next.
4.1.2
Storing the carpet sensor data in different formats
Figure 4-2 shows the picture of a person falling on the carpet. This fall produced
the raw data frames as shown in Figure 4-3. Each frame transformed into a matrix (Figure
4-4) and each matrix reduced into a CSV file (Figure 4-5) that requires much less storage.
This section illustrates the various formats of data.
Figure 4-2: Figure shows the person fallen down on the carpet. We used this scenario for showing the corresponding
data in different formats
35