1
SEAHATS
LAND TRIALS
WILLIE PETERS
February 1984
TECHNICAL REPORT
NO. 105
PREFACE
In order to make our extensive series of technical reports more readily available, we have
scanned the old master copies and produced electronic versions in Portable Document
Format. The quality of the images varies depending on the quality of the originals. The
images have not been converted to searchable text.
SEAHATS
LAND TRIALS
by
Willie Peters
Technical University of Delft
The Netherlands
Department of Surveying Engineering
University of New Brunswick
P.O. Box 4400
Fredericton, N.B.
canada
E3B 5A3
February 1984
Reprinted August 1986
TABLE OF CONTENTS
Table of Contents
ii
Acknowledgements
iii
1.
Objectives
1
2.
Equipment and Software
4
2.1
Software •
4
2.2
The PS-01 Radio Positioning/Echo Sounder Computer
2.3
Interface
7
The Mini-Ranger III Positioning System
9
3.
Design of Static Land Test
13
4.
Results of Land Test
17
s.
Sea Test Design
25
6.
Conclusions
28
31
References
Appendix A:
User's Guide
Appendix B:
Observations and calculations in surveying points
32
BRIDGE and 318NEW
38
ii
ACKNOWLEDGEMENTS
I would like to thank Dr. David Wells for giving me the opportunity
to come
to
Canada to work on the SEAHATS project.
And I would like to
thank Tim McCarthy, Harvey Nickerson, Hal Janes, and Pantelis Hourdakis for
their pleasant cooperation.
This work was supported in part by a Strategic Grant entitled "Marine
Geodesy"
and a
Strategic Equipment Grant entitled "Integrated Navigation
Microprocessor Equipment" both awarded to Dr. Wells by the Natural Sciences
and Engineering Research Council of Canada.
The possibility of working
through
the
International
in Canada on this project was arranged
Association
for
the
Exchange of
Students
for
Technical Experience (IAESTE).
A van was borrowed for these tests from the UNB Department of Civil
Engineering.
A Mini-Ranger III system was borrowed from the Bedford Institute of
Oceanography.
The assistance of Jack Davidson is appreciated.
This project forms the practical work required
degree from the Technical University of Delft.
iii
for
the Engineering
CHAPTER 1
OBJECTIVES
The SEAHATS system being developed at the University of New Brunswick
(UNB)
is
the
Surveying
Engineering
Apple-based
Hydrographic
data
Acquisition, and Track control System.
My work was to put the parts of the SEAHATS system together, test the
system, and look for possible improvements.
The SEAHATS system is an alternative to the present "HYNAV Navigator"
[Anon,
1982]
by
The
Marinav.
positioning system
[Motorola,
system
consists
1980), which we
of
a
borrowed
Mini-Ranger
from
the
III
Bedford
Institute of Oceanography (BIO) in Dartmouth, N.S.; an Apple II computer,
with software written by Tim McCarthy [McCarthy, 1983]; and a PS-01 Radio
Positioning/Echosounder Computer Interface, between these devices, designed
by Harvey Nickerson of the Centre for Advanced Microelectronics (CADMI) at
UNB [Nickerson, 1983].
The PS-01 is designed in such a way that it will be possible to use
other
positioning
horizontal
instruments
positioning
and
aboard
other computers.
a
vessel
and,
in
The system performs
the
future,
depth
determination will be possible by connecting a Skipper 802 echo sounder.
The
SEAHATS
system
computes
the
position
of
a
vessel,
gives
corrections on a display to the helmsman of the vessel every few seconds so
that
he
can navigate
along
a
pre-determined
positional information on a diskette.
survey line,
and
logs
The survey line can be a straight
line between two points (two waypoint mode)
or a circular path (a whole
circle or a part) around one point, for example, a shoal point in the water
(one waypoint mode).
1
2
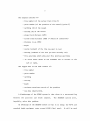
The display consists of:
- line number (of the survey line) [line #]
- point number (of the position of the vessel) [point #]
- northing [N] of the vessel
- easting [E] of the vessel
- along track distance [ATD]
- across track distance [XTD] (= amount of correction)
- distance to go [DTG]
- depth
- course (azimuth of the line you want to run)
- bearing (azimuth of the line you have actually run)
- five asterisks which show your five previous positions
-
an arrow which shows if the helmsman has to correct to the
left or right.
The logged data on the disk consist of:
- line number
- point number
- northing
- easting
- depth
- variance-covariance matrix of the position
- raw data observations.
A disadvantage of the HYNAV system is that there is a one-second lag
between the
position and depth samples.
The SEAHATS system will,
hopefully, solve this problem.
An advantage of the SEAHATS system is that it is cheap: the PS-01 and
required Apple equipment costs around $5000 (Can) total.
It will be used
3
for educational purposes aboard the UNB vessel, the Mary-0, but it can also
very well be used for bathymetric surveys near the coast.
After some problems we succeeded in making the system work and doing
a land-based test using a van.
Also we made the system work on the Mary-0.
Further tests and further improvements in the software are planned.
CHAPTER 2
EQUIPMENT AND SOFTWARE
2.1
Software
The software was written by Tim McCarthy.
it is written for an Apple computer.
computer.
The language is Pascal and
The test was done with an Apple II
For detailed information, see McCarthy [1983].
Small changes
were made which I shall mention in this chapter and in Appendix A.
The software consists of two programs.
The first program, PSOliNIT,
initializes the PS-01 interface by setting the date, time, sample interval
(the time difference between two consecutive observations measured by the
positioning instrument) and channel identification numbers (code numbers of
the two reference stations of the Mini-Ranger).
The second program, NAV,
handles all data initialization, handles navigation routines for one and
two waypoint modes, displays results, and logs
the data.
The
present
version of the NAV program (used for this report) has some differences from
the
version
least-squares
of
the
program
adjustment
was
documented
not
changed.
in
McCarthy
[ 1983].
The
(The changes are described
below.)
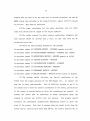
One of the changes that had to be made was to add a rejection of
wrong range observations (due for example to reflections).
program has
accepted
a bad
reading,
the calculated
Once the NAV
position is wrong.
Since the last position is used as initial coordinates for the calculation
of the next position, the rest of the calculated points will be far off
the actual position.
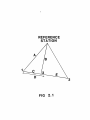
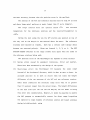
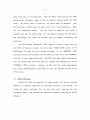
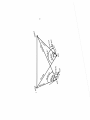
The rejection is done as follows (see Figure 2.1).
The ship moves from 1 to 2; a is the measured range at position 1; b
is the measured range at position 2; c is the distance between point 1 and
4
5
REFERENCE
STATION
1
E
3
FIG
2.1
6
point 2; d is the distance calculated by multiplying the sample interval
and the maximum speed of the vessel (which are both manually input by the
operator during program initialization).
b is not accepted.
Always d > c >a-b.
If a-b > d,
The program will give the message
****SPURIOUS RANGE READING**REJECTED****·
further
As a
improvement
(not
yet
implemented),
it would also be
possible to calculate the ship's speed between 1 and 2 from the coordinates
of 1 and 2 and use this to calculate the approximate coordinates of 3.
The
rejection criteria will be smaller and the approximate coordinates of 3 can
be
used
in
the
calculation of
position of point
This would
2,
so
fewer
not work when
the
position of
3 instead of using
iterations would
the
ship is
between 2 and 3) is bigger than c.
be needed
accelerating,
so e
for
the
the
fix.
(the distance
However, it would be a better method
when the ship's speed is constant.
The PS-01 is connecterl with the Apple by a RS-232 Super Serial Card
in
the
Apple.
In
the
PS-01
User's
settings of this card are given.
Guide
[Nickerson,
1983]
the
switch
The PS-01 has a buffer, which contains up
to 20 records with the range information from the Mini-Ranger.
Every time
the Apple program requests a record, the PS-01 sends one.
The
coordinates
adjustment
stations,
[McCarthy,
the
redundancy.
number
of
the
1983,
of
vessel
page
are
8].
observations
calculated
Since
is
we
always
by a
use
two,
least-squares
only
so
two
there
remote
is
The convergence criteria for the iteration is 0.5 metres.
program needs normally two or three iterations to reach that.
no
The
The number
of iterations is now fixed at three to save time.
During
the
test
using
the
van
the
little less often than every four seconds.
system
calculated
positions
a
The reading of the record from
7
the PS-01 takes a half second, refreshing the screen display takes 1.5 to 2
seconds, and the fix computation takes 1.5 to 2 seconds.
The 40 character
monitor display mode is used, instead of the 80 character mode optionally
available, because it is faster to refresh, and most of the text can be
seen on the 40 character screen.
To see the rest of the text, the operator
must hold down the 'CTRL' key and press 'A'.
To go back to the left half
of the page, press 'CTRL A' again.
For suggested
further
improvements to
the
program,
see
Chapter
6.
For some remarks on using the program, see the User's Guide (Appendix A to
this report).
2.2
The PS-01 Radio Positioning/Echo Sounder Computer Interface
The
PS-01
intelligent
interface
was
designed
and
MICROELECTRONICS/MICROELECTRONIQUE INC [Nickerson, 1983].
built
by
CADMI
For the present,
it acts as a data collection buffer between an Apple microcomputer and a
Mini-Ranger III positioning instrument.
The position data coming from the
Mini-Ranger is collected and temporarily stored in a local buffer of the
PS-01 along with time and date information.
The position data come from
two
data
channels
formatted
and
transmitted to the Apple microcomputer via an RS-232 interface card;
the
Apple
the
issues
on
the
commands
collection and
Mini-Ranger
to
the
III.
PS-01
transmission of data.
floppy diskette on the Apple computer.
The
on
the
is
RS-232
then
and
can control
Ultimately the data
is
stored on
The communication protocol has been
designed to be unspecific for the Apple; it can work well with almost any
computer with an RS-232 interface.
Also the microcomputer can be replaced
by a CRT or ASCII terminal for a printout.
PS-01
can
be
connected
with
other
radio
With a few slight changes the
positioning
instruments
(for
8
example, LORAN-C).
In the future the PS-01 will be interfaced to a Skipper 802 echo
sounder which provides depth data, as well as to other positioning systems.
The front panel contains only a power indicator lamp, the rear panel
a power switch, fuse holder, AC power cord, two RS-232 connectors and three
cables to connect to the Mini-Ranger III.
Data records are transmitted from the local buffer in the PS-01 to
the computer in the following format:
#nn yy-mm-dd hh:mm:ss A=xx AS=xx AR=xxxxxx B=xx BS=xx BR=xxxxxx DP=xxxxx CR LF
where nn is the number of data records left in the buffer
yy-mm-dd is the date the sample is taken
hh:mm:ss is the time the sample is taken
A/B are the transducer channel codes (01-04)
AS/BS are the signal strengths from channels A and B (the
Mini-Ranger III used for this test had no signal strength
option installed)
AR/BR are the observed ranges in metres
DP is the depth value from the echo sounder
(presently set to zero).
The record length, without CR (carriage return) and LF (line feed), is 72.
Each record sent from the PS-01 to the Apple is displayed on the Apple
monitor.
For complete information on the PS-01, see Nickerson [ 1983] •
Note
that the Mini-Ranger III Manual in Appendix F of this PS-01 manual refers
to an older type of Mini-Ranger than the one we used (which is described in
[Motorola,
1983]).
For
important
(Appendix A to this report).
user details,
see
the
User's
Guide
9
2.3
The Mini-Ranger III Positioning System
The Mini-Ranger III provides accurate determination of the position
of any mobile unit such as a hydrographic vessel (like the Mary-0); dredge;
aircraft; or land vehicle (as used in these tests).
It
system,
The Mini-Ranger III
operating on the
principle of pulse radar.
measures the range or distance from a
is a range/range
receiver-transmitter
(R/T)
station
located on the mobile unit to a minimum of two fixed reference stations
(remote
stations/transponders)
located on points with known coordinates.
We use two reference stations.
The elapsed time between the interrogation transmitted by the master
receiver/transmitter
reference
station
(R/T)
is
the
station,
basis
displayed on the range console.
for
and
the
determining
received
the
ranges,
from
which
each
are
The range console is used on board the
vessel and is connected with the R/T station.
metres.
reply
The ranges are displayed in
The range information together with the known coordinates of each
reference station can be trilaterated to obtain the position of the mobile
unit.
There
must
be
line-of-sight
between
the
R/T and
the
reference
stations, because the system operates at microwave frequencies (around 5500
MHz).
using
The minimum measuring range is 100 m,
standard
equipment,
and
up
to
the maximum range is 37 km
185 km with
optional
high-powered
equipment.
The measuring accuracy is 2 metres.
of a set of observations.
This is the standard deviation
A single observation can be 3 sigma (6 metres)
in error.
To minimize the position error the sites for the reference stations
should be selected so that the angle of intersection between the lines from
the R/T to the two reference stations is between 30° and 150°;
90° gives
10
the best accuracy, because then the position error is the smallest.
The antenna of the R/T and reference stations must be kept 60 em from
and above large metal surfaces or masts larger than 15 em in diameter.
The
range
temperature
for
console
the
does
reference
not
operate
stations
and
below
the
0°C.
The
minimum
receiver-transmitter
is
-50°C.
During the test using the van the R/T station was mounted on top of
the van,
and on the Mary-0 it was mounted above the mast.
stations were mounted on tripods.
between two returned pulses).
The reference
Each has a certain code (unique delay
These are denoted 1, 2, 3, or 4.
The REF
STATION SELECT switches on the range console must agree with the codes of
the reference stations being used.
The position error of the Mini-Ranger III depends on three factors:
(1)
System
errors
caused
by
equipment
tolerances,
jitter
and
weather.
These have been minimized by the design of the system.
(2)
Slant-range
error:
the
Mini-Ranger
III
measures
the
slant
range
instead of the horizontal distance, which is what we want to know.
accepted
practice
is
to
work
no
closer
than
ten
times
the
An
height
difference of the two antennas of the R/T and one reference station.
Under these conditions the resultant range error will be no greater
than 0.5 percent longer than the actual range.
The height differences
in the test area (for the van and the Mary-0) are too small to bring
this error into consideration. However, it would be possible to modify
the NAV program to automatically correct for slant range (requiring
the operator to input heights of reference station and vessel antennas
during initialization), using
11
r
where
r
is
0
[ 1 - (dh I r 0 ) 2 1112
0
the
observed
between reference
slant range, dh is the height difference
station and vessel,
and
rh
is
the
corrected
horizontal range.
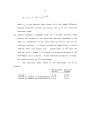
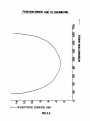
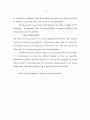
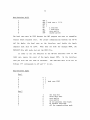
( 3)
Geometry changes:
affects
angle
the
of
reference
position
a
measured
accuracy of
intersection of
stations.
error
smallest error.
(see
range
the
a
certain
calculated position,
the
lines
A certain
Figure
has
from
the
R/T
accuracy,
depending on
to
each
intersection angle gives a
2.2).
Intersections
which
of
90°
of
the
the
certain
give
the
Figure 2.2 is based on a measuring accuracy of the
Mini-Ranger III of 2 metres.
If the measuring accuracy is 3 metres,
all position errors are 3/2 times bigger.
The
electrical
power
demand
of
the
Mini-Ranger
III
follows:
Voltage
Current on standby (no interrogation)
Current at maximum interrogation rate
Range Console
and R/T
Reference
Station
24 Vdc
2.5 A
24 Vdc
0.5 A
3.0 A
LOA
is
as
-12-
POSITION ERROR DlJ: TO GEOIVElliE
f
...8
0
<0
0
C\1
... ...
--~~~~C\1----0~--~~-=~~~--"~~--~o
,....
<
POSITION ERROR (M)
FIG 2.2
CHAPTER 3
DESIGN OF STATIC LAND TEST
For the land
The van is equipped with a power supply providing 120 volt
Engineering.
power
for
test we used a van from the UNB Department of Civil
the
PS-01,
Apple
computer,
disks,
and
monitor.
The
receiver-transmitter was mounted on an ski rack on top of the van. The rest
of the equipment was mounted on shelves in the van.
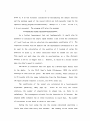
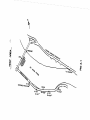
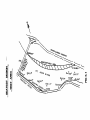
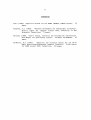
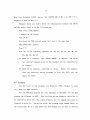
The test was done on Wednesday, 31 January 1984.
The test area is
east of the Princess Margaret Bridge in Fredericton (see Figure 3.1).
The
test area, control points and geometry are described in this chapter.
Control points on the south side of the St. John River were used to
Coordinates for the monuments
check the accuracy of the SEAHATS system.
were taken from microfiche of the Land Registration and Information Service
(LRIS) in the Maritime Provinces of Canada.
the
survey data about
every control
point
These microfiche contain all
in
New
Brunswick updated
to
January 1983.
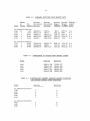
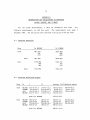
The Universal Transverse Mercator (UTM) coordinates, referred to the
ATS77 adjustment performed by LRIS, of the control used for this test are
shown in Table 3.1 (in metres).
Two new stations were established on the north side of the St. John
River,
for
the Mini-Ranger
called
"BRIDGE"
and
III reference
"318NEW"
(see
stations.
Figure
3.1),
These stations were
and
the
surveys
and
computations used to establish their coordinates are contained in Appendix
B of this report.
Point
242
on
the
Princess
Margaret
Bridge would
also
reference station point, because it is high above the river.
13
be
a
good
But it is
~~
I
""
r-1
I
i
m~
~
~~~~~-It
~~IGif,._.
"''"')~"'
i
81"
. "o~.
,,,~,
")~~
-~
-
4168
GEO METRIE::9411
G:1os•
4142
0:107
°
,..
pj
~
15
between a lot of steel, so instead we established the new point "BRIDGE"
under the Princess Margaret Bridge.
Point 318 was a well-situated point,
but the monument had been destroyed.
We established the new point "318NEW"
in the neighbourhood of 318.
Point 319 between the bridge and 318 cannot
be seen from the other side of the river.
TABLE 3.1
CONTROL STATION COORDINATES (SOUTH BANK)
Point number
Easting
Northing
4168
4167
4369
4142
4145
290307.050
290460.921
290814.231
291069.007
291622.501
737053.563
736758.568
736524.942
736373.952
736212.933
TABLE 3.2
REFERENCE STATION COORDINATES (NORTH BANK)
Point number
Easting
Northing
"BRIDGE"
"318NEW"
318
242
290532.551
292412.007
292410.111
290240.200
738015.403
736410.876
736421.289
737907.134
(Mini-ranger III code 2)
(Mini-ranger III code 3)
(destroyed)
(high on bridge)
Before the test the Mini-Ranger III range console was calibrated at
point 4142 by adjusting the REF STATION CAL screws.
The calibration should
be done in similar environment to that in which the instrument will be
operating, with the ranges approximately equal to the range of operation.
The van was driven along the Lincoln Road from point 4168 to 4145 and
then in reverse direction.
The length one way is around 1650 metres.
Two other LRIS points would have provided longer survey lines.
But
point 4185 was not found (back in a field), and point 4146 could not be
used because the reference stations are not visible from this point.
16
This test was a static test.
The van stopped at the control points
to check the accuracy of the coordinates determined by the SEAHATS system,
against the known LRIS values.
The control points were marked by poles.
A dynamic test will hopefully be done later.
In this case the van
would drive along the road without stopping, and the time when it passes a
mom.nnent is recorded for later comparison with the SEAHATS data at that
instant (requiring interpolation of the recorded SEAHATS data).
In order to check that the SEAHATS system can track rapidly changing
Mini-Ranger III ranges, the speed of the van was around 50 km/h.
This is
much faster than the speed of the Mary-0, which is normally around 15 to 20
km/h.
No problems were encountered.
CHAPTER 4
LAND TEST RESULTS
The two way test run in the van took about ten minutes to complete.
The SEAHATS sampling interval was set at four seconds (the assumed time
required for
observations).
the NAV program to complete the processing of one set of
The data recorded by SEAHATS on the Apple disc is shown in
Table 4 .1.
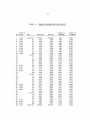
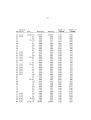
The forward run contained the first 57 fixes in Table 4 .1.
The NAV
program detected the end of the first line at fix 57 and stopped computing
fixes, as it is designed to do.
The van was turned around and the second
(reverse) line began at fix 58 about 70 seconds later.
Where there is a + sign beside the time in Table 4.1, SEAHATS did not
record a position fix, but according to the sample interval of 4 seconds,
there should have been one.
This happened 32 times.
Possible reasons for
this are
- there was an obstruction between the van and a reference station;
- there was a spurious range reading;
- the program skipped one record (since reading calculating
and displaying one record may take more than four seconds).
The recording of data onto the Apple disk stopped at fix 98.
reason is not clear.
the reverse line.
The
The realtime monitor display continued to the end of
At that point (control point 4168) the 'Distance to go'
value shown on the screen was 2 metres, which indicates that the position
fixing continued without problems.
In this single static test, the van was stopped near each control
point, and between four and ten four-second samples taken.
17
The average
18
TABLE 4.1
SEAHATS OBSERVATIONS AND RESULTS
Control
Fix point
Time
Northing
Easting
Range to
"BRIDGE"
Range to
"318NEW"
1
2
3
4
5
6
7
8
9
10
11
12
13
14
15
16
17
18
19
20
21
22
23
24
25
26
27
28
29
30
31
32
33
34
35
36
37
38
39
40
13:00:19
23
27
31
35
39
43
47
51
59+
01:03
07
11
19+
23
27
35+
39
43
51+
59+
02:03
07
15+
19
27+
31
39+
42
51+
55
59
03:03
11+
15
23+
27
31
39+
13:03:43
737054
7052
7050
7054
7052
7054
7051
7056
7055
7052
7035
7012
6982
6907
6865
6826
6753
6752
6757
6750
6748
6741
6721
6666
6631
6565
6541
6514
6513
6511
6511
6503
6485
6447
6423
6385
6376
6377
6376
736376
290309
0308
0310
0310
0313
0310
0308
0310
0309
0312
0319
0328
0342
0371
0389
0412
0453
0459
0459
0460
0467
0483
0505
0576
0613
0700
0747
0806
0807
0806
0811
0828
0863
0943
0985
1053
1068
1073
1073
291073
987
989
990
986
988
986
990
985
986
988
1003
1024
1050
1120
1159
1195
1265
1265
1260
1267
1269
1275
1294
1350
1386
1460
1489
1526
1527
1529
1529
1540
1565
1621
1655
1711
1724
1725
1726
1726
2199
2199
2197
2198
2195
2198
2199
2199
2199
2196
2184
2169
2147
2100
2073
2043
1989
1983
1983
1981
1974
1957
1932
1854
1812
1719
1670
1609
1608
1609
1604
1587
1551
1469
1427
1359
1344
1339
1339
1339
4168
4168
4168
4168
4168
4168
4168
4168
4168
4168
4167
4167
4167
4167
4369
4369
4369
4369
4142
4142
4142
4142
19
Control
Fix Point
41
42
43
44
45
46
47
48
49
50
51
52
53
54
55
56
57
58
59
60
61
62
63
64
65
66
67
68
69
70
4142
4142
4145
4145
4145
4145
4145
4145
4145
4145
4145
4145
4145
4145
4145
71
72
73
74
75
76
77
78
79
80
4142
4142
4142
4142
4142
4142
Time
Northing
Easting
Range to
"BRIDGE"
Range to
"318NEW"
13:03:51+
55
59
04:07+
11
15
23+
27
35+
39
47+
51
59+
05:03
07
11
15
06:23
27
31
35
39
43
51+
55
59
07:03
11+
15
19
27+
31
39+
43
51+
55
59
08:07+
15+
13:08:19
736376
6376
6375
6348
6321
6299
6246
6228
6219
6227
6220
6219
6221
6219
6220
6219
6221
6226
6224
6224
6224
6227
6228
6225
6226
6227
6226
6222
6216
6233
6276
6301
6352
6373
6382
6380
6382
6381
6382
736379
291073
1070
1076
1131
1171
1217
1324
1379
1492
1549
1621
1622
1623
1621
1623
1622
1636
1622
1620
1620
1621
1623
1622
1620
1604
1582
1542
1461
1408
1358
1263
1213
1123
1084
1065
1068
1073
1070
1072
291065
1726
1725
1728
1771
1810
1847
1938
1977
2036
2057
2099
2100
2099
2100
2100
2100
2106
2095
2095
2095
2095
2094
2093
2094
2085
2073
2054
2019
2000
1964
1886
1844
1765
1732
1718
1720
1720
1720
1720
1720
1339
1342
1336
1283
1244
1200
1100
1049
940
882
814
813
812
814
812
813
799
811
814
814
813
810
811
814
829
850
889
970
1023
1069
1157
1204
1290
1329
1347
1344
1339
1342
1340
1347
20
Control
Fix Point
Time
Northing
Easting
Range to
"BRIDGE"
Range to
"318NEW"
81
82
83
84
85
86
87
88
89
90
91
92
93
94
95
96
97
98
13:08:23
27
35+
39
47+
51
55
09:03+
07
11
15
23+
27
31
39+
43
51+
13:09:59+
736393
6405
6446
6464
6500
6511
6518
6516
6516
6517
6519
6546
6567
6589
6648
6679
6741
736753
291048
1018
0943
0904
0834
0813
0811
0807
0807
0810
0802
0748
0710
0672
0595
0558
0487
290453
1702
1681
1622
1595
1545
1530
1522
1524
1524
1523
1520
1485
1459
1433
1368
1336
1275
1265
1364
1394
1469
1509
1580
1602
1605
1608
1608
1606
1614
1669
1709
1749
1832
1873
1953
1989
4369
4369
4369
4369
21
ranges and positions for each of these stops are shown in Table 4. 2.
The
measuring accuracy of the Mini-Ranger III is 2 m, but a single observation
can be 6 m in error.
Therefore
the difference between the highest and
The difference
lowest four second observation could be as much as 12 m.
between the highest and lowest range reading in each set was not that high
for this test, but the test involved limited numbers of observations.
The
is
NAV
program
capable only of
is
written
single
precision
Whether this results in a
way.
Ranges
to
the
in
the
(6
Apple
PASCAL
language,
to 7 decimal digit)
which
arithmetic.
significant error was tested in the following
transponders
coordinates at each stop.
were
calculated
using
the
average
These calculated ranges were compared with each
of the averaged ranges. The maximum difference between the calculated and
averaged observed ranges is 0.6 m.
Simulations to evaluate the error resulting from the least squares
calculation of the coordinates in the program resulted in errors of as much
as 1m, but most times it was lower (the convergence criteria is 0.5 m).
This
is
a
much
Mini-Ranger
III
smaller
ranging
effect
than position errors resulting
errors.
For
example,
when
the
system
is
from
run
dynamically, only single observations are taken, which may have errors of
four to six metres.
Depending on the angle of intersection between the
range lines, this may result in position errors of six to nine metres.
The NAV program displays coordinates rounded off to integer values
(whole
metres).
Position
decimals in the coordinates.
errors
could
be
made
smaller
by
retaining
However, because the ranges are measured in
whole metres, the results would not be improved significantly.
So
the
uncertainty
in
the
Mini-Ranger III observation errors.
results
is
almost
totally
due
to
the
A good calibration before operating is
22
TABLE 4.2
Point
Number
of
Obsvns
AVERAGED POSITIONS FROM SEAHATS DATA
Average
Fix
Calculated
Numbers Easting
Average
Calculated
Northing
Average Average Highest Lowest
Ranges
Ranges
"BRIDGE" "318NEW" Range
In forward direction:
4168
10
1-10
4167
4
17-20
28-31
4369
4
37-42
4142
6
4145
51-56
6
290309.9
290457.75
290807.5
291071.67
291622.
737053.
736753.
736512.25
736376.17
736219.83
987.5
1264.25
1527.75
1725.33
2099.67
2197.8
1984.
1607.5
1340.33
813.
5
8
5
5
2
In reverse direction:
4145
7
58-64
4142
75-80
6
4369
4
87-90
291621.14
291068.83
290808.75
736225.43
736381.
736516.75
2094.43
1719.67
1523.25
812.43
1343.17
1606.25
4 m
8 m
3 m
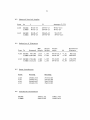
TABLE 4.3
COORDINATES OF OFFSETS FROM CONTROL POINTS
Point
Easting
Northing
4168
4167
4369
4142
4145
290312.136
290464.621
290812.214
291071.351
291623.238
737056.727
736762.268
736520.628
736378.323
736223.004
TABLE 4.4
m
m
m
m
m
DISCREPANCIES BETWEEN AVERAGED SEAHATS POSITIONS
AND OFFSETS CONTROL POINT POSITIONS
Point
Easting
Northing
In forward direction:
4168
4167
4369
4142
4145
2
6
5
0
1
4
9
8
2
3
In reverse direction:
4145
4142
4369
2
3
3
-2
-3
3
23
very important.
The problem of detecting and
throwing out unacceptable ranges
is
handled by program NAV by establishing a window (based on sample interval
and maximum velocity) around the previous range.
The next range must fall
Otherwise when a bad reading
within that window or it will be rejected.
occurs (say due to reflections), the resulting coordinates, which will be
used as initial coordinates in the next fix calculation, will be wrong, and
the next fix may be far off the real position.
The window used now is quite small: a sample interval of 4 seconds
with a maximum speed of the vessel of 20 km/h gives a window of 22 m.
This window could be made even smaller (see Section 2.1).
In Figure
2.1, c is always smaller than a-b, so c can be a certain percentage of a-b.
Two kinds of calculations could be used to reject more ranges.
method described in Section 2 .1.
One is the
Another way that could be used when the
ship's speed is almost constant (as on a survey line) is the following:
the program calculates the vessel's speed from the two previous positions.
From this it calculates the window (which will be smaller).
Also the
initial coordinates of the next point could be predicted, instead of using
the coordinates of the previous point.
The resulting position fix may
converge in fewer (maybe even one) iterations.
More tests have to be done.
From this single test without even a
complete disk output it is difficult to draw conclusions.
Dynamic testing
is especially important.
Another problem is to know more precisely the coordinates of the
reference points offset on the road from the LRIS control points monuments,
and just where the van will be stopping (for static tests) or where it will
be during dynamic
testing.
Even more challenging is
to know precisely
24
reference positions for dynamic testing aboard the Mary-0.
For this test, offset points from each LRIS monument were measured to
the edge of the road, perpendicular to the road. The coordinates of these
points are in Table 4. 3.
These offset points are on the side of the road
on which the van stopped during the forward run (except for point 4369).
Table 4.4 compares the reference coordinates in Table 4.3, with the
average SEAHATS coordinates in Table 4.2.
metres.
The differences are only a few
In future tests the van should be stopped as closely as possible
to the offset reference points.
Even more precision could be achieved by
removing the R/T unit from the van at each point and mounting it over the
LRIS monument itself.
CHAPTER 5
SEA TEST DESIGN
A test of the SEAHATS equipment was done aboard the Mary-0 in St.
Andrews, New Brunswick on 4 February 1984.
The goal of this test was not
to evaluate the accuracy, as for the land tests, but to judge the general
operation of SEAHATS on a moving vessel.
Convenient LRIS control points were not available,
so
the remote
stations were put on points, the coordinates of which were scaled from a
hydrographic chart.
The R/T station was mounted on the mast of the Mary-0, and the rest
of the SEAHATS equipment was mounted inside on a shelf.
making it work.
We succeeded in
The power supply of the boat (120V) was good.
We ran along a survey line, but the disk output was lost.
This is
probably because we used the wrong commands at the end of the line--not
'CTRL Q' and 'Q'(uit)--due to inexperience (see Appendix 'A').
Except during the period November to May, when the St. John River is
frozen, SEAHATS can be tested on the Mary-0 in the same test area as this
land test, east of the Princess Margaret Bridge.
can be used, namely "BRIDGE" and "318NEW".
The same reference points
The test area could likely
extend 1500 metres downriver (east) of the Princess Margaret Bridge.
In case of visibility problems with point "BRIDGE", point 242 could
be used.
This point is high on the bridge so it can be seen from far off.
It may be better to survey a point on the east side of the bridge (242 is
on the west
side).
The Mini-Ranger III transponder would have
installed higher than the 90 em high steel fence on the bridge.
to be
There will
be a large slant-range error near the bridge, so program NAV should be
25
26
modified first to correct for this.
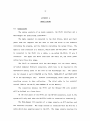
The Mini-Ranger III manual
selection of the shore sites,
[Motorola, 1980] gives the rule for the
in order to obtain a satisfactory position
error (namely a maximum position standard deviation of 7.7 m).
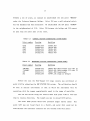
According
to
should
this
rule,
the
intersection
between 30° and 150°.
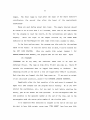
area
does
not
angle between
See Figure 5.1.
satisfy
this
rule.
the
two
ranges
be
Only a very small part in the test
In
the
middle
intersection angle is around 125° over the whole length.
of
the
river,
the
The best geometry
is along the southern shore of the river.
A one-waypoint test has to be done.
This is difficult to do on land.
On a boat it is a problem to know precisely the coordinates of the centre
point of the circle.
centre point,
could be run.
There are no control points in the water.
perhaps point 4369 could be used.
As the
Only a part of a circle
Perhaps a tracking EDM instrument could be mounted over the
centre point ( 4369)
to provide reference ranges to the boat.
If this is
not possible, control positions for the boat would have to be determined
from theodolite intersections, which will involve problems in synchronizing
the timing of the observations.
~,
~ ~~a11w"v
'
l'II"Jit·
~~--..~
I
r-C'l
I
sr. Jo/1,., "'ve,
~=87.
=·Yo•
'.·b
"FIJI
0::107.
~o~~~~JI
.~~
+
~~
G:111o
+
+
Ga129°
.,.
G=73°
....•
U)
~
CHAPTER 6
CONCLUSIONS
After some problems the system was put to work and tested. Hopefully
these
problems
are
solved
now and will
not
improvements in the software can be made.
with
the
Mini-Ranger
Hewlett-Packard
simulate
the
computer
of
Mini-Ranger
the
III
should
Department
and
PS-01,
Some
The system needs more testing
Software
III.
occur in the future.
of
be
written
Surveying
in order
to
for
the
Engineering
speed
up
to
software
development and testing.
Improvements which should be made in the software:
(1) The display should not scroll.
PS-01
and
the
spurious
debugging mode).
range readings
Display of the records from the
should
be
record
does
not
fit
for
a
from
the
PS-01
is
Changes to any of these
taken would be easily seen.
display fits almost perfectly onto the 40 character screen.
that
(except
Only values of northing, easting, line-running values,
and the arrows and asterisks should be displayed.
whenever a
omitted
is
the rightmost
column (/).
This
The only thing
This could easily be
changed.
(2) It would be better if the XTD value
(across
track distance
=
amount of correction) were shown near the newest asterisks or the arrow, so
the helmsman will see at a glance in what direction and how much he has to
correct.
values.
Now he has
to
look for
the XTD value between all
the other
This is especially important when there is a screen output every
few seconds.
(3) When the van was run in reverse direction during the test (in the
two waypoint mode, with the mobile unit at the end of line, enter in the
28
29
program that you want to do the same line in reverse direction) the OUT OF
RANGE arrows were pointing in the wrong direction, namely
of
>>>>>>>>.
<<<<<<<<
instead
This must be corrected.
( 4) The input coordinates (of the
shore stations),
and all other
input data should also be logged on the output diskette.
(5) The values entered for shore station coordinates, waypoints and
data options
should be entered
into a file,
so that they need not be
re-entered every time.
(6) There are some spelling mistakes in the program:
in procedure number 26 LINEWIDTH:DISTANC - DISTANCE appears on screen
in procedure number 28 INITIALOLDRANGE VARIAABLE - VARIABLE just comment
in procedure number 29 APPROXCOORDS MAXIMIN - MAXIMUM appears on screen
in procedure number 33 INITDATA WAYPIONT - WAYPOINT
in procedure number 31 LISTDATAOPTIONS DISABELED - DISABLED
in procedure number 34 LISTOPTIONS WAYPIONT - WAYPOINT
in procedure number 35 CHECKRANG3 MAXIMIN - MAXIMUM
in procedure number 37 RECIEVE RECIEVE - RECEIVE several places in program.
(7) The
program
should
calculate
the
initial
coordinates of
vessel from the ranges measured by the Mini -Ranger III.
user has to enter them manually.
the
At present the
This is difficult, because at sea it is
not always easy to know the present coordinates of the vessel, particularly
if the vessel is moving during or after the coordinates are entered.
present
the vessel must
program is
started
and
be
stationary at
known
initial data are entered.
coordinates while
The
At
the
program should
calculate the coordinates automatically immediately before or after the
start of the survey.
Note that at present when the vessel is far from the
survey line or circular path (more than 200m), the initial position has to
30
be entered as a waypoint, and the two-waypoint mode can be used to navigate
to waypoint 1 (for this part disk output is not necessary).
(8) The program is not very forgiving when you input a number in the
wrong way.
For example, when you input 260939,2 instead of 260939.2, the
program will give the message
'INPUT INVALID DIGIT'
and there will be an arrow
--->
at the beginning of the next line. However
there is no way of correcting it.
Whatever the next input is, there will
be another arrow at the beginning of the next line.
The only way out of
this trap is to restart the input from the beginning.
(9) Now the fastest display update rate is around every four seconds.
It
is
desireable
to
have
the
display
updated
as
fast
as
possible.
Hopefully the delay could be reduced to 2 seconds by changing the screen
update method to modifying only the characters being updated in the screen
memory map, rather than writing out a whole new screen each time.
There are no problems in using the PS-01 interface.
31
REFERENCES
anon. (1982). "Operator's manual for the HYNAV (NAVBOX, INDAS) system".
pages.
33
McCarthy, T.J. (1983).
"Software development for hydrographic surveying".
Project report for computer science 4993, University of New
Brunswick, Fredericton. 73 pages.
Motorola (1980). "User's manual, operation and installation instructions,
Mini-Ranger III positioning system."
Document 68-P03802R.
76
pages.
Nickerson,
H.J. (1983).
"Operation and technical manual for the PS-01
Radio Positioning/Echosounder Computer Interface...
Final report
for CADMI project 8302, Fredericton. 210 pages.
32
APPENDIX A
USER 1 S GUIDE
A.l
Connections
The system consists of an Apple computer, the PS-01 interface and a
Mini-Ranger III positioning instrument.
The Apple computer is connected to two disk drives, which get their
power from the computer and are used to read and write to the diskette
containing the program, and the diskette containing the output files.
The
Apple is also connected to a monitor, which needs 120 VaC power.
The Apple
is connected to the PS-01 via a cable, a so-called RS-232-C,
25 pin D
connector.
The Apple and PS-01 need both 120 Volts AC, and their power
cables have three wire plugs.
The PS-01 is connected with the Mini-Ranger III via three cables,
so-called Am phenol Military connectors, which have to be inserted in the
appropriate mating jacks on the rear of the Mini-Ranger III.
Two cables
are for channel A and B (CHA/CHB on the PS-01, CHANA-BCD JS and CHAN B-BCD
J4 on the Mini-Ranger III).
resulting errors
However interchanging these cables gives no
in data collection.
The third cable is for external
control (EXT on the PS-01, EXT CONTROL J2 on the MR-III).
The connection between the PS-01 and the Skipper 802 echo sounder
will be defined at a later date.
On
the rear panel of the PS-01 are two RS-232 connectors A and B. The
system will only work when the RS-232-C cable is connected to connector B.
The Mini-Ranger III consists of a range console, an R/T station, and
two reference stations.
The range console is connected with the R/T via a
cable which also supplies power to the R/T.
The range console receives its
33
power from two 12 volt batteries.
Take the three prong plug of the power
cable and put alligator clamps on the two smaller cables inside the thick
The white cable is positive,
cable.
each reference station gets its power from two 12 volt batteries.
are
four
connecting
The
cables.
Also
the black cable is negative.
red
cable
is
positive,
the
There
black is
negative and the two green cables are the jumpers between the batteries.
The
Mini-Ranger
III
needs
20
minutes
warm
up
before
calibrating
and
operating.
The PS-01 manual [Nickerson, 1983, Chapter 3, page 1] says that for
the PS-01 to function properly the front panel DISPLAY RATE control of the
Mini-Ranger III must be
fully counter-clockwise
in
the
'EXTERNAL'
(EXT)
position and that the channel code switches also must be in the 'EXTERNAL'
position to allow remote selection.
The PS-01 has been slightly changed so
that the system will also work when the channel code switches are in the
'INTERNAL'
(INT) position.
However, in this case the range measurements
will not be synchronized in time with the time tag assigned to them by the
PS-01 clock.
A.2
Switch Settings
Before the PS-01 is connected to a power source, the serial interface
should be configured using the dip switches internal to the chassis.
change the
switch settings,
retaining screws.
follows:
lift the
top cover after
removing
the
To
four
The switches are labelled 1 through 8 and must be set as
34
Baud Switches PS-01
1
2
3
OFF
OFF
OFF
ON
ON
ON
OFF
OFF
4
5
6
7
8
)
) baud rate
)
)
1.2k
1 stop bit
7 data bits
even parity
enable parity
The baud rate must be 1200 because the NAV program now uses an assembler
routine which requires this.
and
the
Apple,
the
baud
computer must also be
rate
1200.
For proper communication between the PS-01
on
the
interface
card
When they are both for
inside
the
Apple
example 9600,
the
PSOliNIT file will work, but not the MINI file.
In order
to set the switches on the RS-232 interface card in the
right way, remove the cover of the Apple (power OFF).
card you will see two rows of switches.
On
the interface
The switches have to be set as
follows ('O' corresponds to off and '1' to on).
Baud Switches Apple
Row 1
1
2
3
0
1
1
4
1
1
1
1
5
6
7
)
)
)
)
baud rate 1200
Row 2
1
2
3
4
5
6
7
1
0
0
0
0
1
0
one stop bit
seven data bits
even parity
even parity
do not generate line feeds
do forward interrupt
off for communications mode
35
Note that McCarthy [1983]
states that SWITCH ROW 2 NR 6 is OFF ('0').
Actually it must be ON ('1').
Whenever there are doubts about the communication between the PS-01
and the Apple, check it in the following way:
Type twice 'CTRL RESET':
] appears on the screen
Type IN 112
Hold down the CTRL key and press the A key at the same time
Then APPLE SSC: appears
Type T T
Give any of the following commands: TM
CM, ST, SD, SI, SA, SB, BY,
EX, RQ, ZR, ID, IN
If there is a response,
like 'OO=NO ERROR' , or similar, the PS-01
has received commands given by the computer and the communication
is alright.
If there is no response, something is wrong.
Check, for example,
that the baud-rate switch settings in both the PS-01 and the
Apple are right.
A.3
Software
For the input of the program, see McCarthy [ 1983, Chapter 3, page
16].
Here are some remarks:
For the PS01INIT program the code filename is PSOliNIT; for the NAV
program the filename is MINI.
be inserted in drive #4.
inserted in drive /15.
They are both on one diskette, which has to
The output diskette for the logged data must be
During the input, the program reads ranges twice, so
the vessel must be at a spot where the Mini-Ranger III is able to measure
36
ranges.
The first range is read after the input of the shore station's
coordinates,
the
second
time
after
the
input
of
the
approximate
coordinates.
Menus are used during manual data input.
The sample interval should
be chosen to be no less than 4 or 5 seconds, since this is the time needed
for
the
program to
display.
After
read
the
the record, do
input
of
the
the calculations and
sample
interval
SI,
the
update
VIDEO
the
RCVD
indicator on the Mini-Ranger III will light every time a sample is taken.
In the data options menu,
speed of the vessel.
the
SET
LINE
the program now also asks for the maximum
If only one survey line is used, 0 can be entered for
SPACING.
When
you
enable
disk
output
(answer
ENABLE/DISABLE DISK OUTPUT), the program asks for the file name.
1
for
Input
f/5: FILENAME
(FILENAME
can
be
different files).
records
the
any
name,
but
different
names
have
to
be
The lamp on disk drive #5 will now come on.
accumulated
data
is
logged
from memory
to
used
for
Every 20
diskette.
The
remaining records at the end of a line are logged when 'CTRL Q' is pressed.
Each time data are logged, the disk lamp comes on.
If you want an output
of all calculated positions, answer 0 for INTERSTA LOGGING DISTANCE.
Immediately after the last question of the main menu is answered the
Apple will take samples and the program starts running.
So if you have
entered the coordinates, etc., but you want
to wait before starting the
survey, just do not answer the last question.
In the two-waypoint mode the
last question is the waypoint number at the end of the line, and in the
one-waypoint mode the centre point number of the circular path.
It is important when execution is stopped at the end of the line and
you want to have disk output, never type 'CTRL RESET' (you lose your disk
37
output), and never remove the diskette (no end of file is written, so it is
not
possible
to read
to diskette later).
(hold down the 'CTRL' key and type
'Q').
written
'Q'
to diskette.
Then type
You must
first
type
'CTRL Q'
At this point the buffer will be
(quit).
execution in the middle of a line, type 'CTRL
Also if you want
Q'.
to
stop
38
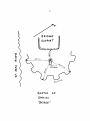
APPENDIX B
OBSERVATIONS AND CALCULATIONS IN SURVEYING
POINTS "BRIDGE" AND "318NEW"
For
the
angle measurements,
a Wild T2 theodolite was used.
distance measurements, an AGA was used.
November 1983.
B.l
The measurements were made 5
The new points were observed from points 4168 and 4142.
Observed Distances
From
To BRIDGE
To 318NEW
4168
987.779
.782
.779
2200.893
.896
.890
987.780
2200.893
1726.964
.964
.965
1343.471
.472
.472
1726.964
1343.472
Mean
4142
Mean
B.2
For
Observed Horizontal Angles
From
To
I
II
Average (I,II)Reduced angles
4168
BRIDGE
318NEW
4167
BRIDGE
354-11-55.6
87-59-20.1
133-27-58.2
354-11-53.3
174-12-12.2
267-59-35.3
313-28-11.7
174-12-15.2
354-12-03.9
87-59-27.7
133-28-05.0
354-12-04.3
4142
BRIDGE
318NEW
4145
BRIDGE
Mean for BRIDGE
354-12-04.1
000-47-47
107-19-03
125-06-30.5
000-47-46
000-47-42
107-18-54
125-06-24.5
000-47-41.5
180-47-37
287-18-45
305-06-18.5
180-47-37
Mean for BRIDGE
000-4 7-41. 8
000-00-00.0
93-47-23.6
139-16-00.9
000-00-00.0
106-31-12.2
124-18-42.7
39
B.3
B.4
B.5
B.6
Observed Vertical Angles
From
To
4168
BRIDGE
318NEW
4142
BRIDGE
318NEW
II
Average (I,II)
90-23-50
90-01-13
269-35-17
269-58-15
90-24-16.5
90-01-29
90-09-47
89-56-25
269-49-43
270-02-58
I
90-10-02
89-56-43.5
Reduction of Distances
EDM
Height
Target
Height
Zenith
angle
dh
Horizontal
Distance
BRIDGE 987.780
318NEW 2200.893
1.415
1.415
1.185
1.185
90-24-16.5
90-01-29
-7.31
-1.02
987.753
2200.893
BRIDGE 1726.964
318NEW 1343.472
1.360
1.360
1.185
1.185
90-10-02
89-56-43
-4.66
+1.58
1726.958
1343.471
From
To
4168
4142
Measured
Known Coordinates
Point
Easting
Northing
4168
4167
4142
4145
290307.050
290460.921
291069.007
291622.501
737053.563
736758.568
736373.952
736212.933
Calculated Coordinates
BRIDGE
318NEW
290532.551
292412.007
738015.403
736410.876
40
41
BRI1>'1E'
SufJPofi..T
SKe-ic.H
5714-TION
''B~Il>'E '1
o~
42
1..:.
(j)
Sl(~:lcll
oF
ST1411oN
• 31 B !JEw''