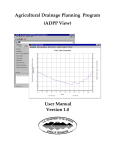
Download MU Extension Crop Water User Manual
Transcript
AGRICULTURAL
USER MANUAL
PUBLISHED BY UNIVERSITY OF MISSOURI EXTENSION
Crop Water Use Program for Irrigation
Divisions of Plant Sciences, Applied Social Sciences, Food Sciences and Bioengineering,
and Soil, Environmental, and Atmospheric Sciences.
Water is an important factor affecting crop
yields. The University of Missouri Extension
Service developed an on-line program (app)
to help farmers produce higher crop yields by
improving irrigation management. There is no
charge to farmers. This bulletin gives
information about the Crop Water Use (CWU)
application and explains how to set up fields
to track soil moisture.
How Does The Application Work?
The application estimates crop water use
from weather data. An equation for
calculating evaporation from soil and plants
(called evapotranspiration, ET) is used. The
application also calculates daily soil water
deficit balances for each field. Reports
include indexes to help farmers determine
when to irrigate.
Crop Water Use. The University of MO
Extension automatically downloads data
each day from a mesonet of agricultural
weather stations located across Missouri. ET
is
calculated
from
solar
radiation,
temperature, humidity, and wind. CWU uses
the Standardized short crop PenmanMonteith Evapotranspiration (ETo) equation
which was developed by a task committee of
the American Society of Civil Engineers. ETo
is the amount of combined water lost from a
reference crop (grass) and soil evaporation.
Authors
Gene Stevens, Zach Straatmann, Joe Henggeler,
and Andrea Phillips Jones are located at the Fisher
Delta Research Center in Portageville, Missouri.
John Travlos, Stephen Martin, Pat Guinan, and
Ray Massey are located on the University of
Missouri campus in Columbia, Missouri.
ETo is multiplied by a crop coefficient,
which is specific for the crop and growth
stage. The crop coefficients, except for
rice, come from UN Food and Ag
Organization
publication
FAO-56.
Beginning at planting, growth stages are
predicted from heat units for corn, rice, and
cotton. Calendar days are used for
soybean. This information is used to
estimate daily crop water use (ETc).
Soil Water Balance. Daily soil water deficit
is reported similar to a checkbook registry
which tallies rainfall and irrigation as
deposits and ETc as withdrawals. The soil
water deficit becomes more negative in
periods of low rainfall. When the soil profile
is full (field capacity), the deficit balance is
0. As water is extracted, the balance
becomes negative.
Acknowledgements. Funds
for field
research to validate this app were provided
by Cotton Incorporated, Howard G. Buffett
Foundation, and United States Department
of Agriculture- Agricultural Research
Service.
1
Getting Started
Enrollment. In a browser address box, type
this address to sign up and click “Sign Up”.
agebb.missouri.edu/horizonpoint/cropwater.
php. Read the Terms of Use. If you approve,
click “I agree” (Figure 1). Enter information
in the boxes (Figure 2). Name, phone
number are optional. Email address, User
Name, password are required.
Then on the third screen, you will have the
option to either launch the application now
and bookmark the link or request the
address by email (Figure 3).
Figure 3. Launch App or Request E-Mail Link.
If you request email link, an address with
32 random numbers and letters will be
generated. Only share your unique
address with people that you trust. You can
copy (Ctl C) and paste (Ctl V) the address
of the link to your computer and mobile
phone. This will save you time not having
to type in a password every day to check
your fields.
Figure 1. Introduction screen for CWU app.
The Crop Water Use App requires daily
weather from the Missouri weather station
mesonet to function. Currently, the
program only works when you have
internet access by WiFi or a cellular data
connection. Before beginning the set up
process, it is best to write down on paper
the names of all your fields with their
latitude and longitude, dominant soil
texture, and planned crop.
Latitude and longitude are used to estimate
rainfall from the National Weather Service.
Find the fields location on Google Earth or
go to each field and copy and paste the
locations from an app such Where Am I At?
(iTunes app store).
Example: Lat:
36.4151365, Long: 89.7010119. CWU
uses positive decimal degrees. Do not use
minutes and seconds.
Figure 2. Enter information and click submit.
2
Main Screen
Click on the bookmarked website address for
your farm in browser. The first screen that will
appear in the app is Main (Figure 4). This is
the starting place to add new fields, setting
the soil and crop information, monitoring daily
soil moisture, logging rainfall and irrigation
amounts, and requesting field reports.
The location cannot be changed now but it
is easy to delete and re-enter a field.
Select the dominant soil texture for the field
(Figure 6). This is used to estimate
available soil water holding capacity. For
more information about soils on your farm,
check the NRCS Soil Survey site:
http://websoilsurvey.sc.egov.usda.gov/Ap
p/HomePage.htm.
Figure 5. Enter latitude and longitude of field
Figure 4. The main menu screen.
Field Setup
Now, click on Add Field in the third row. In
the next screen, click on the top boxes and
enter the field name and decimal degrees for
north latitude and west longitude which are
both positive real numbers (Figure 5). If they
enter west longitude as a negative number
the program will correct it without error. Be
sure the correct GPS location for the field is
entered before clicking Submit. The title at
the top of the page will change to Edit Field.
Figure 6. Select soil texture for each field.
3
Although the lat/long is locked in, soil texture
for a field can be changed later to a finer or
coarser texture if needed.
USDA and can be found at this site:
http://www.nrcs.usda.gov/wps/portal/nrcs/
detail/mt/newsroom/?cid=nrcs144p2%200
56492
Click on Submit and Back to Main Menu. The
next step is setting up crop information. In the
Main Menu, click Setup Soils and Crops
(fourth row, second column). Then scroll to
the field name and click on na under Crops in
the second column.
Figure 8. Select the most common rate of water
that you will apply with the irrigation system.
Figure 7. Field/Crop information page for entering
field and crop information.
Select the planted crop in the field. The
default planting date is 12/31 (Figure 7).
Important: If crop and planting date are not
known yet, do not guess. Skip these boxes
and come back later. Other boxes on this
page can be entered even if crop and planting
date are not known. Click Submit to save the
information.
The next box on the page is Soil water deficit
on planting date (Figure 8). The soil water
balance works on the same principle as a
checkbook registry. Like a checkbook, CWU
needs a beginning balance. Unless spring
rainfall has been usually low, leave the
default value on zero (field capacity) for initial
soil moisture. A field method for estimating
soil moisture by hand was developed by
Fill in the rest of the boxes on this page.
The effective root depth for most crops in
Missouri is in the range of 18 to 24 inches.
If the soil has a restrictive layer from
compaction, enter a shallower depth.
During the season, the rooting depth can
be modified. Select the irrigation method
and default rate of water application. Leave
the allowable field water depletion at the
default 50% unless you want to be more
liberal with making irrigation applications.
Then click “Yes” on NWS Rainfall if you
want the program to automatically enter the
estimated rainfall amounts based on GPS
locations of the field. If you click yes, during
the season, you will also have the option to
substitute your rain gauge measurements
for individual rainfall events or completely
turn this feature off. Click “No” to never use
NWS rainfall estimates.
Now, repeat the Setup steps for other fields
until all are entered in the app.
4
Monitoring Daily Soil Water in Fields
In the Main menu (top row), click Field Status
or Field Summary to check daily water status
in each field. Field Status shows estimates for
each field individually for the current day
(Figure 9) and Field Summary shows
projected dryness indexes for all your fields
for today and the next week assuming no
rainfall occurs (Figure 10).
for today and the next week. To see the
most columns tilt the phone to landscape
position.
Figure 10. Main menu screen for checking soil
water dryness indexes for the next week.
As the crop grows and periods of low
rainfall occur, the values in the H2O deficit
inches will become more negative.
Figure 9. Field Status screen for checking daily
soil water deficits in individual fields.
To navigate between fields in Field Status,
swipe your finger right to left or left to right
across the bottom of the screen. As the
season progress, your fields in Field Status
will be sorted each day from driest to wettest
soils. The Dryness Index warns you when the
soil water deficit is coming close to the
Management Allowed Depletion (MAD) level
of the field which is the recommended trigger
for irrigation. The symbols (*,**,***, and XXX)
represent 70%, 80%, 90%, and 100% of
MAD, respectively. The value showing “Left
to trigger” is the percentage remaining
relative to MAD before the reserve water is
used. The text will change from green to
yellow then red as the soil dries.
In Field Summary, today’s soil water deficit is
shown for each field with the dryness index
Soils have different water storage
capacities, so no single soil water deficit
value is acceptable across all soils. For
example, crops growing on sandy soil
stress for water faster than crops on silt
loam soil. Factors used for calculating MAD
are soil texture, crop rooting depth, and
allowable depletion. Soil texture is used to
estimate available water holding capacity
(AWHC). The formula for MAD is AWHC x
Root Depth x Percent Allowable Depletion.
More details about water credits and debits
is found in the Field Detail screen. You can
find this screen from the Main menu or
clicking on a row in the Field Summary
table. This screen shows the daily values
for crop ET, inches of rainfall and soil water
deficit for the last week (Figure 11). To view
more days, click on “All Days” at the bottom
of the page. The second row of boxes will
be for entering rainfall and irrigation
amounts after the fields have been setup.
5
The NWS amount will still be displayed, but
it will not be used by CWU.
Figure 11. Detail page with water debits and
credits for single field in past seven days.
When soil water deficit values equals 70% of
the MAD level, the Dryness Index column will
display a single red asterisk. Without rain or
irrigation more asterisks will appear in the
following days.
Avoid letting the index
become red with XXX for several days. Once
a field soil becomes dry, crop yield is lost.
When the dryness index does not match soil
moisture sensors or visual crop water stress,
fine-tune the field setup by adjusting the
rooting depth or allowed depletion
percentage.
Entering Rainfall and Irrigations
Two options are available for entering rainfall
and irrigation events. Click on the water
faucet symbol (Figure 10, first column) in a
field row of Field Summary to navigate to the
Add/Edit Precipitation and Irrigation page
(Figure 12). If “Yes” was selected for NWS
rainfall in setup, the third column displayed
will be “NWS Precip”. To override NWS for a
specific day, enter the correct value in the
blue column labeled, “Field Precip”. The
rainfall amounts will be underlined indicating
the CWU is using the new value for that day.
Figure 12. Page to edit precipitation (rain) and
irrigation for amounts field.
To enter rainfall amounts in the program
click on a cell in the light blue column (4th)
corresponding the date that water was
applied. Likewise for irrigation, click on the
green column (far right). The irrigation
default rate that was entered in the setup
will appear (Figure 13). If needed, it can be
modified before clicking Submit. When
other fields receive the same amount of
irrigation, click the check boxes beside
their names at the bottom of the page.
Unfortunately, the 24 hour period for
rainfall at the National Weather Service is
not midnight to midnight. It is mid-morning
to mid-morning so a late afternoon rainfall
still will not been posted in the app at 6 am
the next morning. If you know how much it
rained in your rain gauge, enter it rather
than wait for an NWS update. When NWS
shows a rainfall amount but none actually
occurred, enter 0 in the blue Field Precip
column. When other fields on the farm also
received the same amount of rainfall (or
none), click the check boxes beside their
names at the bottom of the page.
6
becomes zero. In this case, a small
inaccuracy is not critical in the app.
Figure 15. Rainfall tracked by National Weather
Service radar.
Figure 13. Irrigation input page for entering
irrigation events for fields.
To access a report for printing go to Report
(3rd row, right column) in the Main menu
(Figure 4). Select the field to print and click
“Print” (Figure 14).
If you clicked “Yes” in the field setup for
NWS rainfall, compare your rain gauge
measurement to the rainfall amount in the
blue column, remembering amounts are
not posted at midnight. If it does not agree
closely, click on the column to override the
NWS amount. Balance the value of
exactness relative to the time required to
enter rain amounts from gauges.
The daily reference ET values used in the
CWU app is collected from the MU closest
electronic water station to your field. The
main variable in the Penman-Monteith
equation is solar radiation which is more
consistent across a region than rainfall.
Terms of Use
Figure 14. Example field reports showing daily
rainfall, irrigations, and ET crop.
NWS Rainfall and ET Accuracy
The greatest differences between NWS
rainfall estimates and field rain gauge
measurements usually occurs during isolated
storms (Figure 15). The NWS grid is too
coarse to accurately estimate rainfall in small
thunderstorms. When heavy rainfall occurs
on a field, the soil water deficit balance
reaches field capacity and soil water deficit
The Crop Water Use Application is a weather based prediction
model designed to aid farmers with irrigation management. It is
not intended to be a substitute for scouting fields. Always inspect
soil and crop conditions in each field before deciding whether or
not to irrigate. Under no circumstances including negligence,
shall the University of Missouri, or its Board of Curators, officers,
employees or agents, be liable for any incidental, indirect, special
or consequential damages (including damages for loss of
business profits, business interruption, and the like) arising out
of the use, misuse or inability to use this application or any
related documentation. Information is provided by the University
of Missouri Extension Commercial Agriculture Automated
Weather Station Network. The Commercial Agriculture
Automated Weather Station Network and the University of
Missouri give no warranty as to the accuracy, reliability, utility, or
completeness of this information. While we use care to provide
accurate weather/climatic information, errors may occur because
of equipment or other failure. Users of this weather/climate data
do so at their own risk, and are advised to use independent
judgment as to whether to verify the data presented. The
University of Missouri expressly disclaims all warranties, express
and implied, including, but not limited to, the implied warranty of
merchantability and fitness for a particular purpose.
7


