1
FAO AG:DP/ETH/82/010
Field Document 25
ASSISTANCE TO LAND USE PLANNING
ETHIOPIA
MANUAL
FOR
SPATIAL COMPUTERIZED
LAND EVALUATION SYSTEM
WITH SPECIAL REFERENCE TO THE
HIGHLANDS OF ETHIOPIA
VOL. 3 :
GILES
GEOGRAPHICAL INFORMATION
AND
LAND EVALUATION SYSTEM
USER MANUAL
by
G.Bechtold
with the assistance of Tadesse Andarge
THE PEOPLE'S DEMOCRATIC REPUBLIC OF ETHIOPIA
MINISTRY OF AGRICULTURE
LAND USE PLANNING AND REGULATORY DEPARTMENT
UNITED NATIONS DEVELOPMENT PROGRAMME
FOOD AND AGRICULTURE ORGANIZATION OF THE UNITED NATIONS
Addis Ababa, August 1989
This field document is one of a series of reports prepared during the course of the UNDP/FAO
project identified on the title page. The conclusions and recommendations given in the report are,
those considered appropriate at the time of its preparation. They may be modified in the light of
further knowledge gained at subsequent stages of the project.
The designations employed and the presentation of the material and maps in this document do not
imply the expression of any opinion whatsoever on the part of the United Nations or the Food and
Agriculture Organization of the United Nations concerning the legal or constitutional status of any
country, territory or sea area or of its authorities, or concerning the delineation of its frontiers of
boundaries.
i
Boeing Graph is a trademark of The Boeing Company
dBase is a trademark of Ashton Tate
Disk Optimizer is a trademark of Soft Logic Solutions Inc.
ESC/P (TM) is a trademark of Seiko Epson Corporation
Grab is a trademark of WordPerfect Corporation
Inset and WOrdstar 2000 are trademarks of MicroPro International Corporation
Lotus and 1-2-3 are trademarks of Lotus Development Corp.
IBM is a trademark of International Business Machines
Microsoft Basic, MS-DOS, QuickBasic are trademarks of Microsoft Corporation
This Manual refers to GILES version 2.2 of July 1989.
All rights reserved. Reproduction of any part of this Manual in any form whatsoever without FAO's
express written permission is forbidden.
The subject of this manual are subject to change without notice.
All efforts have been made to ensure the accuracy of this manual. However, should any errors be
detected, FAO would greatly appreciate being informed of them.
II
FAO. Manual for Spatial Computerized Land Evaluation System with Special Reference to
the Highlands of Ethiopia, vol.3: GILES. Geographical Information and Land Evaluation
System: User's Manual, by G. Bechtold. Addis Ababa, 1989, 296 pp. AG:DP/ETH/82/010,
Field Document 25
ABSTRACT
This Field Document forms a component part of a three-volume manual on a computerized land evaluation system for Ethiopia based on the principles of the FAO Guidelines on
Land Evaluation for Rainfed Agriculture (FAO 1983). It constitutes volume Ill of the Manual and
describes the computer aspects of the land evaluation, the software package GILES. Volume I explains the land evaluation methodology (FAO 1987 b), while volume 11 (1987 c) deals with the influence of environmental conditions on crop growth and crop development.
The software package GILES: Geographical Information and Land Evaluation System was
especially developed to fulfill the required tasks of project ETH/82/010 and ETH/87/006:
'Assistance to Land Use Planning', to execute agricultural suitability assessments, to define soil
conservation measures, to estimate carrying capacities on a spatial basis (1:50000 and 1:250000
scale) and to deliver cartographic information in an integrated, multidisciplinary approach.
After finalizing, GILES functions now in a wider context as a database carrier on national,
regional and subregional level to perform above mentioned duties and additional features of computerized mapping and information retrieval on spatial basis.
Part A (Chapter 1) is addressed to decision makers, politicians, government bodies, planners
(particularly land-use planners), supervisors, managers, NGOs etc. to be able to make efficient use of the output of GILES and to stimulize their request for data provided by
GILES.
Part B (Chapter 2 and 3) is for users to know about the facilities of GILES and how to retrieve
maps and statistics. Land evaluation specialists, physical resource experts, soil conservation specialists, technicians, statisticians etc. will be guided through the 'User's Manual'
with step-by-step explanations and references.
Part C (Chapter 4 and Appendices) is a mere reference strictly for system analysts to install, establish and understand the system and to enter, change or modify data.
GILES is transferable to any area, but main fields of applications will remain the assessment and interpretation of natural resources in developing countries at low cost level. It r"-IBM-compatible microcomputer with DOS operating system.
HI
ACKNOWLEDGMENTS
The Food and Agriculture Organization and the author are greatly indebted to all individuals and sections who assisted in the implementation of this report by providing information,
advice and facilities.
iv
TABLE OF CONTENTS
Page
LIST OF TABLES
vii
LIST OF MAPS
ix
ABBREVIATIONS
PARTA:
For Decision Makers, Politicians, Planners:
ASPECTS OF COMPUTERIZED INFORMATION AND
EVALUATION SYSTEM OF NATURAL RESOURCES
1.1 Need for establishment of natural resource data base
1.2 Introduction of computerized data base
1.3 Spatial information: GIS
1.4 GIS for land evaluation: GILES
1.5 Advantages and limitations of a computerized information and evaluation system
1.6 Support of planning activities
1
1
3
6
9
14
PART B:
For Users, Experts, Technicians:
GILES
2.1 Components of GILES
2.2 GIS aspect of GILES
2.2.1 Development
2.2.2 Structure
2.2.3 Map overlay
2.2.4 Principles of map digitizing and storing
2.2.5 Future system enhancements
2.3 Land evaluation aspects of GILES
2.3.1 Land suitability assessment
2.3.2 Recommendations for conservation based land use conservation measures
2.3.3 Population support capacity
2.4 Data structure requirements
2.5 Data input and output
2.5.1 Input
2.5.2 Output
2.6 Requirements
2.6.1 Hardware
2.6.2 Training
2.6.3 Costs
16
17
20
20
21
22
26
28
29
29
32
32
33
36
36
38
39
39
39
40
Page
42
USER'S MANUAL
3.1 Introduction
3.1.1 Setup of menus
3.1.2 Help facilities
3.2 Facilities
3.2.1 Main options
3.2.2 Specification of retrieved area
3.2.3 Specification of output
3.2.4 Setup of hardware
3.2.5 Transfer
3.3 How to ...
(References)
43
43
45
46
46
97
98
103
103
105
PART C:
For System Analysts:
DATA STRUCTURE
150
4.1 Introduction
4.2 Data files
(References)
150
153
Appendix 1 Set up and installation
Appendix 2 Tutorial
Appendix 3 Error messages / trouble shooting
Appendix 4 System requirements
Appendix 5 Computerized processing
Appendix 6 GILES files
Appendix 7 Land evaluation models
Appendix 8 Structure of programs
Appendix 9 Recommended ASCII codes
Appendix 10 Entered maps
257
REFERENCES
262
184
190
192
200
203
208
211
239
255
GLOSSARY
Part I: GIS and land evaluation
Part II: Computer
267
272
INDEX
275
vi
LIST OF TABLES
Pane
3.1
3.2
3.3
3.4
3.5
3.6
Main Options
Crosstabulation of overlay of main map with selected areas (example)
Area sizes (example)
Site specific information (example)
Individual climatic suitability ratings (example)
Individual soil suitability ratings (example)
47
59
61
63
66
70
3.7
Individual land suitability ratings (example)
LGP coding
3.9 Growing period charts (example)
3.10 Soil moisture balance dynamic (example)
3.11 Crop requirements per crop (example)
3.12 Crop requirements per specified land quality (example)
3.13 Calculation of precipitation values (example)
3.14 Generation of precipitation data and their calculation (example)
74
3.8
80
3.15 Area retrieval
3.16 Outprint scales on matrix printer
3.17 Outprint scales on plotter
3.18 Sample procedures
97
83
84
87
88
90
91
99
99
105
4.1
Data files
153
4.2
Structure of soil mapping unit composition
Names of land/structural characteristics
Considered crops
160
Sheet erosion hazard classes
A7.2 Conservation based land use recommendations
A7.3 Relative soil moisture saturation
A7.4 Available moisture holding capacity
A7.5 Moisture contribution due to organic matter
A7.6 Conversion actual to effective rainfall
213
A7.7 Groundwater contribution
A7.8 Conversion PET to effective evapotranspir.
A7.9 Frost hazard
A7.10 Frost constraint
A7.11 Drainage suitability
A7.12 N suitability
A7.13 P suitability
A7.14 Fertilizer response I
A7.15 Fertilizer response II
221
4.3
4.4
A7.1
vii
175
179
215
218
220
220
221
222
224
224
226
226
227
228
228
Page
A7.16 Flash flooding constraints
A7.17 Ponding constraints
A7.18 Sodicity suitability
A7.19 Salinity suitability
A7.20 Erosion hazard suitability
A7.21 Workability suitability
A7.22 Land evaluation rating due to erosion
A7.23 Land evaluation rating due to workability
A7.24 Maximum obtainable yield
A8.1
SEP values
229
230
230
231
232
234
235
235
238
239
A8.2 SM values of base maps
A8.3 NEXTDRAW values
A8.4 Plotter movement
241
253
253
viii
LIST OF MAPS
Page
3.1
Complete base map (example)
Aggregating base map (example)
3.3 Selective base map (example)
3.4 Parametric base map (example)
3.5 Overlay of base maps (example)
3.6 Land improvement map (example)
3.7 Climatic suitability map at 75 % prob. (example)
3.8 Climatic suitability map at 90 % prob. (example)
3.9 Soil suitability without land improvements (example)
3.10 Soil suitability with land improvements (example)
3.11 Soil suitability with land improvements (example)
3.12 Soil suitability with land improvements (example)
3.13 Land suitability map (example)
3.14 Sheet erosion hazard map (example)
3.15 Conservation based land use recommendation map (example)
3.16 Length of growing period map (example)
3.17 'Corridor map' (example)
50
3.2
51
3.18 'Boundary map' (example)
3.19 'Colored/hatched map' (example)
3.20 3D map (example)
101
52
53
55
58
67
68
71
71
72
72
75
77
79
82
94
102
103
ix
LIST OF ABBREVIATIONS
BS
CEC
DMBS
DD
DEM
DOS
DS
DTM
EC
ESC/P
FAO
GILES
GIS
HD
HPGL
kB
LE
LUPRD
LUT
MB
PA
PC
PET
PS
SIS
UTM
3D
- Base saturation
- Cation exchange capacity
- Database management system
- Double density (disk specification
- Digital elevation model
- Disk operation system
- Double sided (disk specification)
- Digital terrain model
- Electrical conductivity
- Epson standard code for printer
- Food and Agriculture Organization
- Geographical Information and Land Evaluation System
- Geographical Information System
- High density (disk specification)
- Hewlett Packard graphics language
- Kilobyte (1024 bytes)
- Kilobyte (1024 bytes)
- Land evaluation
- Land Use Planning and Regulatory Department
- Land utilization type
- Megabyte (1048576 bytes)
- Peasant Associations
- Personal Computer
- Potential Evapotranspiration
- Personal System
- Soil information system
- Universal Transverse Mercator Grid System
- 3 dimensional (display)
Trademarks not listed.
THE FIRST TIME ?
Before you do anything else:
- Have a look in Chapter 3 of this Manual
- Make a back up copies of GILES (see App.1, p.189)
- Install GILES in your system (see App.1, p.189)
- Proceed with 'How to start the first time' (Section 3.3.21; p.137)
GILES
PART A:
For Decision Makers, Politicians, Planners
Chapter 1) Aspects of Computerized Information and Evaluation System of Natural Resources
GILES/Para 1 for Decision Makers: Computerized Database & Evaluation
ASPECTS OF A COMPUTERIZED
INFORMATION AND EVALUATION SYSTEM
OF NATURAL RESOURCES
1.
This chapter describes the need for GIS in general and for GILES in particular, their advantages in form of large data handling, quality, output, speed, updating, and how politicians and
planners can make use of these advantages.
1.1 NEED FOR ESTABLISHMENT OF NATURAL RESOURCE DATA BASE
Ever-increasing population leads to pressures on the available resources of the land that
exceed its carrying capacity. Resulting overutilization leads to resource degradation: Soil erosion,
changes in flow regimes of rivers, changes in precipitation regimes due to deforestation, development of gullies, scarcity of fuelwood, to name only a few phenomena in Ethiopia. This results again
in a stronger overutilization and worse degradation.
Effective land-use planning is necessary if this degradation of natural resources is to be
stopped and optimal use to be nnade of the land for sustained and increased agricultural production to support the population.
This requires comprehensive information on land resources so that development
strategies can be assessed in terms of all relevant environmental relations, such as climate, soil,
land form, water etc. to define physical resources, but as well as of population, infrastructure,
agricultural activity to define demand and activities. The generally accepted response to this
process is the establishment of a management structure for natural resources.
The lack of adequate information, accessible to decision makers and planners, on which
natural resources management is based has been identified as one of the reasons for - up to now limited impact on the definition of appropriate land use plans and activities. It is in relation to this
point that set up and development of information systems to support resource management had to
be initialized.
Politicians, policy and decision makers, planners, supervisors, managers, development
agencies require more and better resource information I
The need to match the land requirements for producing food and supporting populations
to the resources of climate, soil, water, and available technology led to the assessment of the
suitability of the land for agricultural purposes, a powerful- and essential - tool in the hand of decision makers and land use planners.
GILES/Para 1 for Decision Makers: Computerized Database & Evaluation
2
Thematic mapping of earth resources prepared by the concerned specialists (soil scientists, climatologists, hydrologists, geologists, ecologists, land-use specialists) gave partly the
answer for those questions. They have been - and are - a source of useful information for resource
exploitation and management.
But the need for spatial data and spatial analysis has not been restricted only to earth
scientists. Additionally to informations about physical resources, decision makers need detailed information about the land and its rather economic and infrastructural characteristics.
In the past, data were collected and then documented in hardcopy form as tables or maps.
Indeed, the rapidly increasing population and environmental changes result in a fast change of
data and high need for fast, updated interpretation of those data. Formulation of essential actions
and plans therefore require faster, more and better data than in the past to handle - and hopefully
to solve - the problems of land degradation and population support.
But ultimate goal of resource monitoring must be to go one step further: to analyze not
only the supply but also the demand and the accessibility of the resources.
GILES/Para 1 for Decision Makers: Computerized Database & Evaluation
1.2 INTRODUCTION OF COMPUTERIZED DATA BASE
In the past, examples abounded of data collection exercises that got stuck in their own abundance of data which at one side was necessary to assess the resources - and potential - of the
land, on the other side could not be handled manually anymore. This need for handling large data
quantities of the environment for rather detailed assessments can highly be met by a new technology developed in the past and applicable on a wide scale only in the past 10 years: The electronic
processing of digital data by 'computer' !
The increasing capability and availability of computer and its technologies and experiences have a revolutionary effect upon the techniques available to those responsible for the
assessment and management of natural resources. This development was encouraged by
progressively cheaper, more user-friendly and better performing computer facilities.
Various attempts were made on global basis as well as on national levels in different
countries to develop and to install a computerized data base system of the resources inventory
(CDC 1986; Nag 1987; Shupeng 1987; Bellamy 1986, to name only a few). Until now, much emphasis has been put on information systems as data bases providing facilities to store and retrieve
these data.
It is not only the size of the data collected and interpreted, but often the prompt demand for information which can not be delivered rightly in the traditional, manual way. Most of the requests by
land use planners, governments, implementation agencies etc. are in high urgency. An important
objective of a data-processing system is to provide a rapid and comprehensive response to ad hoc
requests for data retrieval and interpretation.
Computerized storage encourages a wide range of available, immediate retrieval operations of the requested information - processed, modified, manipulated or raw, in the required way
of presentation.
It is not only one subject which allows the definition - the need and the potential - of natural
resources, but a number of parameters, being in a dependent interrelation with each other. One
influences the other. These interactions are difficult to assess and were in the past the cause for
misplanning, misinvestment and damage of the nature, even for many disasters caused by 'wrong
planning', i.e. planning based on wrong information supplied by the resource data base which
might not have considered the interactions.
The fact that the environmental data recorded by individual surveys are stored and available in digital and computer compatible form from the very beginning enhances this possibility of
allowing computers to complement man for an optimal use of the data (Hellden 1987).
The more complex transformation of data into adequate information and the need for
system's analysis of the complex 'man-environment' interaction, involving huge amounts of data
from different sources, calls for computer support.
GILES/Para 1 for Decision Makers: Computerized Database & Evaluation
4
Computerized modeling to simulate the environment takes - and particularly will take in
the future - these interactions into considerations.
Relatively simple examples are the assessment of the agricultural potential for specific
crops, as done in the land evaluation incorporated into GILES (see Section 1.4 and 2.3.1; p.7/29),
or the calculation of the erosion hazard (see Section 2.3.2; p.32).
Development of spatial models of land use may be a way towards the ultimate monitoring
system, where supply, demand and accessibility of resources are assessed in an integrated way.
Combined models describing supply and demand are defined and applied (e.g. carrying capacity
models).
Many of the parameters used for land resource management and essential for land use planning, are highly variable in space and time.
Spatial variability when inventorying and surveying the environment is normally accommodated by appropriate sampling density. Procedures for these are more (e.g. present land use)
or less (e.g. climate) established.
But inventoried variability depends on scale, timeframe of the survey and objectives of the
study. More detailed survey can bring better results (maps, data) than previous exercises.
Temporal variability in environmental factors can be very high. The methodology to
handle this variability is not well established.
Changes of climate, land use patterns, hydrological regimes, population, political boundaries can modify the characteristics - and the need and the potential of the land.
A reliable resource information system should always be up-to-date and corrected with the
latest available figures. Changes, updatings and corrections should be entered into the archives
('data base') as soon as they are available.
This chance is given through computerized storing and handling of data.
But updating is rather more than just modifying an aging data base; it implies resurvey and
processing new information. The updating modifications will result in always new, corrected, improved assessments of the agricultural potential and need for - eventually new - actions and plans
the land requires.
Often resource data are collected, but stored and organized in different institutions and in different formats. This intransparency does not lead to a high efficiency to support Government and
planners with the requested information. Established links to other natural resources data bases
are to permit easy exchange of data between databanks. E.g. setup of a National Soil Survey
databank of Ethiopia specialized on soil data was made in conformation with GILES; meteorological data are gathered and organized by the National Meteorological Service Agency NMSA, statistical data (census figures, yield estimates) by the Central Statistical Office CSO of Ethiopia;
proposal is made for a Sähelian natural resource database (CDC 1986).
GILES/Para 1 for Decision Makers: Computerized Database & Evaluation
5
If computerized compatibility is given, these data can - after being made available - be inserted into the present geographical information system.
f) Conclusions:
Establishment of a computerized database is not necessarily a capital intensive activity requiring mainframe computing facilities with high costs any more. Recent developments in computer hardware and software have placed the computer power required to run a GIS within the
scope of any average size office, as it is demonstrated in this Manual (for requirements, see Section 2.6; p.37).
Beside the fact that large data can be stored in a compact, organized manner, the most
fundamental and the most significant advantage of computerized processing is, that data may be
'rapidly retrieved in a wide variety of formats, aggregations' and manipulations (WMO 1985).
GILES/Para 1 for Decision Makers: Computerized Database & Evaluation
6
1.3 SPATIAL INFORMATION: GIS
Any land resources data base should be site specific ! Long term land use planning objectives require the identification of locations suitable - or not suitable - for a particular land use.
For planning and modeling purposes, it is not only the data being important, but rather the
spatial distribution of the environmental data in form of maps, which gives the essential information where actions have to be taken. It is evident, that land users require more and better mapping information (Cunningham et.a1.1984).
Presentation of environmental information in map form is a necessary tool for the planning
and management of natural resources, as well as for for research on the distribution and allocation
of resources. Maps can be seen as a means for communication between researchers, decision
makers and planners. The amount of information that can be presented in map form is tremendous. Both status, trends and projections can be presented in a conceptually simple way. To keep
pace with the increasing capacity to collect environmental - and structural - data through surveying
and the increasing demands of supplying data to users of all categories, the conventional data
handling methods should be supplemented by modern computer assisted techniques.
Any resource data base and interpretation on spatial distribution has to combine various
maps with different mapping units and to process their parameters. The mapping units of those
maps might be similar (if based on the same inventory, e.g. aerial photographs), but maybe they
are not at all (e.g. administrative boundaries compared with physiographic units, watershed
management with vegetation units). This can only be solved by more or less small resolution mapping systems which can be adjusted to all these different boundaries.
This can be offered by computerized means - with all the possibilities described above through so-called 'Geographical Information System': GIS. The principle of any GIS is to store
spatial information as different information layers in a grid system, enabling further processing and
retrieval.
The major advantage of a GIS is the possibility to integrate and analyze very large
amounts of data from different sources and with different themes for computer based generation of
new information layers, maps and statistics for planning purposes. The information available can
be presented in optional combinations.
In review of the present state-of-art, it is apparent that there is a high, but still unsatisfied
need for low-cost, easily usable GIS software running on readily available, cheap hardware that
emulate the capabilities of larger specialized systems. This need tries to be satisfied by the present
GILES system.
GILES/Para 1 for Decision Makers: Computerized Database & Evaluation
7
1.4 GIS FOR LAND EVALUATION :GILES
The present computerized data base of natural resources on spatial basis gives the possibility to assess land performance when used for specified purposes.
The assessment is directed towards the following objectives:
identify land suitable for arable and perennial cropping, livestock grazing and fuelwood
production, based on assessment of soil erosion hazard, present land degradation and
wetness limitations
identify suitable crops, areas where they can be grown, and estimating yields under different
levels of inputs and technology
assessing the land resource balance relative to present and projected population numbers
(population support capacity) to identify areas of particular need and areas most likely
to benefit from additional investment.
The results of this land evaluation will provide a rational basis for decisions on land use
which can be taken in accordance with national and regional development priorities.
Exploration and exploitation of new resources, new techniques and new input levels in
agriculture can increase the agricultural potential considerably. Steady change in environment,
land use, economic parameters and economic evaluation makes the land evaluation timevariable.
As soon as change in environment etc. is inventoried and assessed, it can be brought into the system for land evaluation.
That results in the pronounced need for new, fast executed land evaluation assessments.
High need exists for fast incorporation of these eventual changes of land use into the land evaluation procedure for immediate checking of the potential of new land use practices.
As in reliable evaluation systems with applicable results many parameters (land characteristics and land qualities) have to be incorporated, there is the understanding that such a system
should operate under computer assistance. This is even more true if such a database has to show
spatial distributions, i.e. thematic maps.
As larger the scale, e.g. moving from 1 Mio. to 1:50000 scale, as more data are gathered
and need to be processed for the different, in more detail defined objectives of land use planning
studies, which are rather for implementation than for project identification.
Generally it can be said, that as larger the scale is, as more reliable are the results of the
land evaluation and recommendations, which goes up to the level of giving site specific information, but as more complex are the models and more parameters ('Iand qualities') have to be considered.
GILES/Para 1 for Decision Makers: Computerized Database & Evaluation
8
This large amount of data can be processed only by computerized means, otherwise a
tremendous loss of information will lead to misrecommendations and misplanning.
This is the main objective of GILES.
Land evaluation exercises were executed by GILES in various areas of Ethiopia (see
App.10; p.257). Several land evaluation reports with accompanying atlases are published by the
'Land Use Planning and Regulatory Department' of the Ministry of Agriculture of Ethiopia (assisted
by FAO/UNDP project ETH/82/010 and ETH/87/ 006): FAO 1987 d; 1988 a; 1988 b; 1988 c; 1988
d.
GILES/Para 1 for Decision Makers: Computerized Database & Evaluation
1.5 SUMMARY OF ADVANTAGES AND LIMITATIONS OF A COMPUTERIZED
INFORMATION AND EVALUATION SYSTEM (GILES)
1.5.1 Advantages
Possibility to store large amount of data:
In GILES, it is possible, to store, integrate and analyze very large amounts of data derived
from different sources (e.g. different maps from different agencies), with different themes,
different scales and different level of detail for computer based generation of new information layers, maps and statistics for planning purposes.
A standard computer storage medium (40 Mb hard disk; 1988) can store more than 1500 different maps (map sheets).
Possibility to store all original data:
In conventional mapping systems it was necessary, to reduce
the origina( data greatly, in volume (or to classify) in order to make them understandable
and representable. Consequently, many local details were often filtered away and lost.
GILES makes it possible to organize the data storage without generalization, i.e. loss of
data, and to generalize them only when retrieved according to request.
Each map stored in GILES can have up to 700 different mapping units (e.g. soil types
shown on the map). For soil and administrative units up to 50 parameters (attributes') can
be entered and retrieved (e.g. drainage, texture, depth, population density, population support etc.).
Selection of level of detail:
The level of detail shown on the map produced by GILES can be selected by the user. The
degree of map generalization can be chosen, depending on the scale and the purpose.
d) Flexibility of scale:
GILES enables print or plot of the requested map within a wide scale range (e.g. thematic
maps of Ethiopia at a scale of between some 1:500000 and 1:6 Mio).
GILES/Para 1 for Decision Makers: Computerized Database & Evaluation
10
Combination of maps with other maps (spatial data):
GILES' maps can be overlaid and combined with other maps or map overlays (!). It is pos-
sible to consider the interactions between different ecological parameters or between
physical and administrative units.
Maps can be shown with requested attributes of up to 10 different base maps. Up to 5
crop suitability assessments (maps) can be overlaid to form a crop mix ('farming system')
suitability assessment.
Combination of maps with non-spatial data
('attributes', 'parameters'):
Maps can be retrieved in combination with entered non-spatial data in a specified content
through translation tables (e.g. 'parametric maps', see Glossary; p.267).
Out of the soil map e.g. 50 individual parametric maps can be retrieved with the translation
table 'soil type characterization'.
Correction and updating facilities:
Printed maps are static, qualitative documents, almost impossible to be changed. 'It is extremely difficult to attempt quantitative spatial analysis within the units delineated on a
thematic map without resorting to collecting new information for the specific purpose in
hand' (Burrough 1986).
In GILES, corrections due to a better survey, more reliable data base, updating on a
monitoring basis, changes in the environment, new delineation of administrative units etc.
can be easily inserted and hereby corrected maps or statistics can be printed.
Not only the data are continuously to be checked and corrected, it is also the interpretation of the data, the modeling, which can be revised due to new requests, new approaches
or new purposes (e.g. different scales, different requirements).
GILES/Para 1 for Decision Makers: Computerized Database & Evaluation
11
Facility of modeling:
Many advantages accrue when emphasis is placed on manipulation, analysis and modeling of spatial data in an information system.
This potential for dynamic simulation and modeling is offered by GILES. A number of options and scenarios can be easily modeled and compared with each other (e.g. what is the
quantitative advantage to drain a certain area). 'What if ?' analyses can be executed.
To overlay various spatial data with the incorporation of models ('algorithms') to assess
the agricultural potential and the environmental interactions is the main activity of GILES. A
large number of varieties of modeling is possible (the assessment of agricultural potential,
its need to sustain productivity etc.).
Speed of map print:
Processing of a map is faster than manual drawing of a map.
Error quality:
In any manual and computerized mapping system, it is impossible to avoid systematic errors completely. Advantage of GILES is that these errors can relatively easy be checked
and corrected.
Random errors (e.g. 'human errors') as they always might occur on hand-cirawn maps, will
be avoided by GILES.
Wide range of output forms:
GILES offers a wide range of different output forms: Maps plotted with boundaries of the
units, colored or black & white maps on plotter, maps on matrix printer with font symbols
or with grey scale, maps on computer storage media for later outprint, only legends of
maps on screen, printer or in spreadsheets. These maps can be retrieved for the entire
area or only for selected parts or small windows (see Section 3.2.3; p. 98).
GILES/Para 1 for Decision Makers: Computerized Database & Evaluation
12
1.5.2 Limitations
Necessity of computer facility:
At least one Personal Computer with peripherals ('hardware') is required, as listed in App.4
(p.200). Costs for the purchase of one hardware set is in the range of 1500 - 4000 US$
(1989, with tendency to be less in the future; see Section 2.1; p.17).
Power supply (electricity of 220 V or 120 V) is essential.
Know How of personnel:
To run any kind of computer equipment, manpower trained in the use and maintenance of
computer is essential. For the application of GILES, interactive manuals and help menus
offered during information request can train users within a few days time (see Section
2.6.2; p.39).
More difficult is the installation, maintenance and repair of computer. For this, expertise at
the level of good basic understanding of technics and electrics is required.
In many developing countries, service is not offered by computer dealerS or manufacturers. In Ethiopia, most computer hardware service is done by individuals getting acquainted with computer hardware at various levels.
Data entry of base maps:
Before retrieval or processing of maps or data, base maps (e.g. topography, soils etc.)
have to be entered ('digitized') into GILES.
Even though particular emphasis was given to efficient and user-friendly way of map
digitizing, this can still be a bottleneck of the system. Digitizing, in spite of modern table
digitizers, is time-consuming and enervating work: a drudge (Burrough 1987).
E.g. to enter a relatively detailed map of Ethiopia at a scale of, lets say, 1:1 Mio. might take
some 20-70 man hours (see Section 2.5.1; p.36).
GILES/Para 1 for Decision Makers: Computerized Database & Evaluation
13
Unawareness of clients:
The Government, ministries, development agencies and other potential clients are not fully
aware of the advantages of a fast computerized information system providing the essential
information within hours time. Thus, the necessary structural changes in work and infor-
mation flow and practices that would allow the advantages did not take place yet (see
Section 2.1.4; p.19).
Limited output graphics:
In the present GILES version (2.2) automated cartography is not fully established yet and
therefore output quality can not always be considered equal to well performed manual cartography.
GILES/Para 1 for Decision Makers: Computerized Database & Evaluation
14
1.6 SUPPORT OF PLANNING ACTIVITIES
'Only the use of the information produced by information systems can justify their existence: information systems have to support decision making.' (de Meijere/van de Putte 1987).
The assessments of the agricultural potential with and without improvements will guide
the formulation of land use plans through which this potential can be realized.
Beside the evaluation of areas or of crops being suitable, the planner can, based on political priorities, define rules for the identification of the areas with the highest potential or with the
highest needs for soil conservation and for an estimation of the cost/benefit relationship in each of
the areas selected. The characteristics selected to identify the areas might be any combination of a
high population density, a low available land/capita ration, a high, but not increasing annual crop
yield, a high precipitation variability, a medium or high soil loss or a specified slope.
Because planning is concerned with the future, the essence of planning is making projections of developments over a certain time period. The first projection that must be made in any
planning exercise is the 'autonomous' development situation ('the "without" situation'). This reflects
the development of processes as they will take place without (new) actions being taken.
A plan indicates a set of actions to steer the process in the desired action, with assumptions made and changes of the environment. The new scenarios can be evaluated. This can be
done easily if the assumed actions are integrated into an information system and characterize a
new, improved situation ('the 'with' situation').
To be able to make projections for a proposed set of actions, it must be possible to indicate in quantitative terms what the effects will be. The elaboration of scenarios used to be a very
laborious task and therefore only a limited number of alternatives were used for decision making.
Computer analysis facilitates this process and therefore enlarges the scope of information available
for decision making - and improves the quality of the output and reduces the chances of misplanning.
Because these data can be accessed, transformed, and manipulated interactively in a
geographical information system, they can serve as a test bed for studying environmental
processes or for analyzing the results of planning decisions. By using GILES in a similar way that a
trainee pilot uses a flight simulator, it is, in principle, possible for planners and decision-makers
to explore a range of possible scenarios and to obtain an idea of the consequences of a
course of action before the mistakes have been irrevocably made in the countryside itself.
It would be a tremendous and practically impossible task to carry out such operations
manually by combining and comparing map sheets, with different themes, scales and ages, with
each other.
It is only when the system has been made 'dynamic' that it can be used for making projections and therefore for planning, but it is also the dynamic aspect that is difficult to quantity. This
emphasizes the importance for planners to have a tool which enables them to test the effects of
various alternative actions and to assess the impact of the sensitivities on the assessment criteria
related to the objectives.
GILES/Para 1 for Decision Makers: Computerized Database & Evaluation
15
Specialized GIS systems 'are emerging as the major spatial data handling tool for solving
complex natural resource planning problems' (Nystrom 1986).
But development 'continued so fast that it outstripped the ability of managers to keep up.
Under these circumstances it was difficult for them to remain objective and to think of how the new
technology was really addressing the fundamental problems of mapping.' (Burrough 1986). At the
present, GIS systems are not being used as effectively nor as widely as possible for natural
resource assessments.
It was shown in this chapter that microcomputers have the potential to become a standard
tool for resource managers in decision-making, but the most important is that resource managers
are aware of the powerful tool they have in their hand and know how to use it in the most efficient
way.
With further development and higher acceptance of decision makers it can be assumed
that GILES will lead to considerable improvements in agricultural and environmental management
and control in Ethiopia in the future.
GILES
PART B:
For Users, Experts, Technicians
Chapter 2) GILES
Chapter 3) User's Manual
GILES/Para 2 for Users: GILES
16
2.
GILES
The present geographical information system GILES was developed particularly for the assessment of the potential of the land for agriculture and its need for conservation measures to sustain agricultural productivity in developing countries and additionally to establish a land resource
database.
There was a pronounced need of a computerized, fast, flexible system, capable of a high
level of detail, for multipurpose map retrieval and overlay to fulfill above mentioned requirements.
This led to the development of GILES: GILES now presents an interactive, grid-cell based,
low-cost, easy-to-handle GIS system with strong emphasis on map overlay, particularly for agricultural planning purposes, for the output of raster or plot maps and transfer of maps and statistics via
translation files into other software systems. Printer for various scales outprint, plotter and digitizing
tablet are supported, less attention is given in the present version to automated cartography. It
runs on any 'compatible' micro-computer with DOS system and with a harddisk. GILES is completely menu-driven and supported by help mains; queries by users will be responded immediately.
GILES as any GIS is scale independent (see App.10 for areas and scales in Ethiopia where
GILES is applied; p.257). But main advantage of GILES is the answer for improvement and sustaining of agricultural productivity, the land evaluation aspects of GILES, which can be carried out better at a medium (detailed or semidetailed) scale than at small scale.
Part of GILES is this Manual with the general description of GILES and its main facilities, a
user's manual with a tutorial that leads through the sample evaluation, background information on
land evaluation, instructions for installing and for interfacing to commercial databases.
Computer, GIS and land evaluation system brought with them a considerable amount of
jargon. For these not familiar with these new technologies, two Glossaries of terms used in this
Manual, are given at page 279-289.
GILES facilities consist of two components:
'Geographical Information System component', for thematic map retrieval, entry, modification
and (general) manipulation of spatial data. The theoretical background and some technical
aspects are discussed in:
see Section 2.2 (p.20)
'Land Evaluation system component', for specific processing of physical environmental maps
for the assessment of agri-cultural suitability and of conservation need for planning the
most appropriate land use:
see Section 2.3 (p.29).
GILES/Para 2 for Users: GILES
17
Before use can be made of the advantages of a computerized geographical information and land
evaluation system, some change of the methodology applied and some investment in hardware
see Sections 2.4-2.6 (p.33).
and training have to be done:
2.1 COMPONENTS OF GILES
Four components make up any kind of computerized processing such as GILES (see App.5;
p.203):
Computer hardware
Software: GILES
Trained personnel
Institutional context
2.1.1 Computer Hardware
In order to fulfill the above mentioned tasks, an information system should be:
- relatively inexpensive,
- limited in the demand on highly skilled technology and
manpower,
- the best technology affordable,
- robust and easy to maintain.
Therefore, emphasis at the selection of computer hardware to execute GILES was put on
low cost equipment with low maintenance requirements to give highest performance under difficult
environmental conditions (high temperature, extreme air humidity, dust, irregularity of power
supply), supply and maintenance difficulties. THe relatively young generation of micro-computers:
PC or PS/2 match these requests the best. Basically, they consist of four parts:
The CPU ('central part of the computer') is linked to information and storage units (RAM, ROM,
harddisk, disk drives) providing space for storing programs, map and general data.
Enhanced graphic facilities ('EGA' or 'VGA' screen and adapter) show by far better maps at the
screen than colored graphics equipment ('CGA') or black & white equipment.
Printer or plotter will present the maps and other kinds of processed data on paper (see App.4
for supported printers and plotters; p.200).
A digitizing tablet will convert data in map form into digital form (see App.4 for supported digitizing tablets; p.200).
Required hardware and costs are briefly in Section 2.6.1 (p.39) and 2.6.3 (p.40), in detail in
App.4 (p.200). Further explanations on computer processing are given in App.5.A (p.203).
GILES/Para 2 for Users: GILES
18
2.1.2 Software
GILES includes most of the important GIS processing techniques. Major capabilities include:
- Entry and verification of maps
- Non-spatial data base of attributes ('parameters', DBMS)
- Vector / raster conversion
- Storage of maps/data
- Retrieval of maps/data
- Overlay of maps
- Feature extraction of maps/data
- Manipulation of maps/data
- Display of data and maps on screen, printer, plotter
- Transfer of data and maps to other systems
- File utilities
The main options are explained in detail in the 'User's Manual' in Chapter 3 (in particular,
Sections 3.2.1 and 3.3; p.47/105).
The software package GILES is stored on six DS/DD diskettes (if HD, two disks). (For listing of all files, see App.6; p.208). Before using, GILES must be installed in the system: See App.1
(p.184).
GILES/Para 2 for Users: GILES
19
2.1.3 Trained Personnel
Experience with GILES can be made via context-sensitive on-line help on screen, with the
references of this Manual or in training courses.
Similar to nnost software, first output can be produced within few hours time for an experienced user. To get highly familiar with GILES and thus to make use of all facilities might take
1-3 weeks of intensive training (see Sections 2.6.2 (p.39) and 2.6.3b (p.41).
2.1.4 Institutional Context
'Management is just as important as technology'!
The wider use of GILES should not be inhibited by unawareness among potential users,
resistance to new technology and management problems.
In order to be used effectively, GILES has to be placed in an appropriate institutional context: This tool can only be used effectively if it is properly integrated into all planning procedures
and all clients are aware of the facilities of this planning instrument, in particular of the fast access
to the immense natural database and the chance of modeling.
Different methods of data collection and processing, different kinds of products and farreaching effects on the way land use planning is performed require tts full institutional establishment.
Only then GILES can perform as a fast and powerful planning tool.
Further reference is made to de Man (1984) recommending a series of guidelines to be followed relating mostly to the organizational and managerial aspects of GIS systems.
GILES/Para 2 for Users: GILES
20
2.2 GIS ASPECTS OF GILES
A Geographical Information System (GIS), as part of the present GILES, is a multipurpose
computer based information system for retrieval, administration, processing, integrated analysis
and cartographic and statistical presentation of any kind and combination of information which can
be defined in space.
In principal, a geographical information systern'has to answer:
What do I find on a given location ?
Where can I find a given object/condition/potential ?
GIS represent a rapidly developing field lying at the intersection of many disciplines among them cartography, computing, geography, photogrammetry, remote sensing, statistics,
surveying and other disciplines concerned with handling and analyzing spatially-referenced data.
They are of interest to a wide and increasing range of users, such as land and resource managers,
market researchers, planners and those responsible for utilities, to say nothing of administrators
and policy makers at all levels.
2.2.1 Development
The study of the spatial distribution of resources and of the characteristics of the land
started in a qualitative way. As in nnany new sciences, the first aim of many surveys was inventory -
to observe, classify, and record. Qualitative methods of classification and mapping were unavoidable given the huge quantities of complex data that most environmental surveys generated and which are essential for a reliable assessment of the reality, of the potential and of the need of
the land.
But with the large volume of data the problem of handling these data arose. Further, there
was a lack of appropriate mathematical tools for describing spatial variation and interrelation in a
quantitative way.
Comparing and even combining spatially-referenced data from different sources, different
scales, different topics is extremely difficult, especially within the time constraints imposed on
policy and decision makers. It was the advent of computer in the past 20 years that was the key
element in making effective GIS with rapid response times practical possibility. Only with the
availability of computerized processing and particularly of low-cost Personal Computers in less
developed countries (where the need for such assessments is the highest) it was possible, that:
- both the conceptual methods for spatial interpretation of the resources: the land
evaluation aspects of GILES,
- and the actual possibilities for quantitative thematic mapping and spatial analysis, the
geographical information system aspects of GILES have been able to blossom.
With computerized processing facilities of GILES it is now possible for all those responsible for collecting and presenting statistics of various kinds to automate the handling of such data
and thereby speed and make more flexible both production and analysis.
GILES/Para 2 for Users: GILES
21
The increasing interest in spatial characteristics of data collected by various surveys and
for various purposes can be fulfilled in an effective way only by computerized mapping means. In
the past, applications of computing to cartography was first concentrated on the production of
relatively simple thematic maps of statistical data for smaller administrative units. Only recently it
was possible to shift to more complex mapping and overlay methodologies.
As it was one of the largest requests to relate different categories of information for the
purpose of a fast retrieval and compilation for resources assessment and agricultural productivity
improvement, appropriate concepts and software for storing and handling the data were
developed in the present GILES.
In summary, GILES was developed due to:
- need of transparent system which can be modified by trained staff
- need to define and integrate models for agricultural planning (e.g. suitability assessments)
- need to be operated by those with no previous knowledge of computers
(no query language)
- need to overlay map with interaction relations
- high costs of specialized systems
- need for relatively low demand on highly skilled technology and manpower
- need for low-cost, insensitive output devices
- need for standard languages, operating systems and microcomputers to allow portability
- production philosophy underlying commercial software
GILES is the design of a GIS around the need for spatial analysis and handling geographical models rather than an enforcement of data and models into existing data structures (Clarke
1986; Tomlinson 1978).
GILES is operating in the 'Land Use Planning Department' (LUPRD) for the last three
years. Its outputs were applied for planning in various areas of Ethiopia (see App.10; p.257).
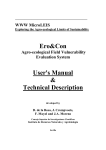
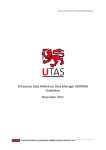
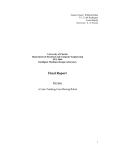
2.2.2 Structure of GILES
A functional GIS of the new generation, such as GILES, should be able to process attributes referring to a spatial distribution. Thus, part of the GILES modules consist of routines for
handling spatial distribution (coordinate systems, classically understood by "GIS") and one for the
handling of the data base with the parameters ('attributes'; classically understood by "DBMS"): This
is called a 'hybrid' system. These two components are linked by a 'pointer' (Aronson and
Morehouse, 1983) or 'identifier', which is done in GILES by the mapping unit number.
GILES/Para 2 for Users: GILES
Map retrieval
system
Map
22
<
>
Pointer, <
identifier
>
Database
Parameter, attribute
('characteristic')
(modified from Schaller 1987)
GILES is an 'integrated hybrid system', as the soil map and administrative map (and further maps on request) can be retrieved 'directly' (see Section 3.2.1.1; p.48) as well as can be
handled as pointers (pointer maps) where the soil mapping units or administrative units 'point' to a
particular, selected parameter ('attribute', 'land characteristic') which can be retrieved or
processed.
2.2.3 Map Overlay
2.2.3.1 Concept:
Because more and more detailed information concerning the environment is needed, and
because our environment is very complex, it is impossible for any one individual to acquire sufficiently detailed knowledge and understanding of all aspects of the environment. Experts of various
specializations therefore participate in the information or data handling which will result in the output, which may be presented maps, suitability assessments in form of maps or tables or plans for
better and more appropriate use of the land.
Previously, land evaluation started with integrated, multidisciplinary surveys, where attempts were made to 'find "naturally occurring" environmental units being relatively homogeneous
and which can be recognized, described and mapped in terms of the total interaction of the attributes' (Gestalt method; Burrough 1986).
But soon it was shown that the level of these surveys was too general and that it was impossible to retrieve specific information from them about particular attributes. This is particular the
case when new objectives, e.g. for the development of a specific area, were defined and previous,
multidisciplinary inventories had to give the information for newly defined purposes.
GILES/Para 2 for Users: GILES
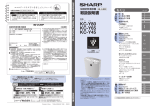
Information:
23
Maps
('spatial data')
Data entry:
Digitizing
Storage:
Data files
('genera data')
V
Retrieval of Base map
tion:
Map generalization:
Entry of tables
and codes
MAP files
Retrieval without modifica-
Characteristics,
Description of mapping units
('non-spatial data')
(e.g.soil map)
V
Aggregated map
(selected units)
1.manipulation
level:
V
Overlay of Base maps
(e.g.soil / precipitation map)
2.manipulation
level:
V
Processing of Overlay of Base maps
(e.g.length of growing period map,
suitability map)
3.manipulation
level:
V
Overlay of Compiled (configured) Map
(e.g.suitability per administrative units)
GILES/Para 2 for Users: GILES
24
With better understanding of the interactions of the various ecological parameters and with
the need for bet-ter assessment and estimates of the potential as well as of the needs of the land,
combined with the tendency to work for more applicable, practical results rather than small-scale
inventories only, the high demand arose to have relatively detailed, monodisciplinary resource
surveys and to combine and integrate them in a later stage by overlaying.
Thus, a ready market for the more conventional, monodisciplinary surveys remained, such
as those of geology, landform, soil, vegetation, land use, economy. This is executed in the 'Land
Use Planning and Regulatory Department' (LUPRD) where GILES was developed: Monodisciplinary surveys were carried out for physical and economic data collection in various areas of
Ethiopia where agricultural productivity is to be improved and land degradation has to be stopped
at semi-detailed scale (1:50,000) or small scale (1:250,000):
soils
inventoried by soil scientists,
topography
"
soil scientists and geographers,
climate
" (agro)climatologists,
vegetation
" ecologists,
land use
" ecologists,agronomists,
and (agro)economists,
economy.
" (agro)economists,
social attributes "
" (agro)economists.
All those data gathered in monodisciplinary approaches can be used for a wide range of
purposes and will serve for a long time as excellent individual databases.
The very essential - "essential" for the combined effort of the land use planning - task of
land evaluation is the combination of those relatively independently working and information
gathering work outputs. By this, it is the integration, or re-aggregation, of all the factors, influencing
the environment, to determine the potential (suitability) of land for a specific, appropriate kind of
land use.
A good and useful information system must provide links among all those various fields
and enable the experts to produce useful syntheses - although it is often difficult to find a common
language for people with such different backgrounds.
2.2.3.2 Technique:
A computer can store and process a large number of digital maps containing all possible
information on soils, altitude, climate, agricultural productivity, topography, cultural attributes,
water resources and so on.
Each map is converted into an integer data, two dimensional array. Different maps are
handled as different files (arrays). Core of the system is the formation and recall of a set of a spatially registered data layers, which are the various thematic maps.
GILES/Para 2 for Users: GILES
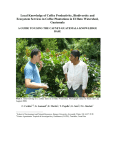
25
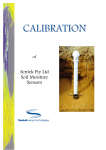
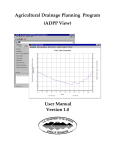
In its simplest form, the overlay concept is realized in raster data structures by stacking
two-dimensional arrays. This results in a three-dimensional structure as shown above. This overlay
concept is fundamental to most raster image processing.
Each thematic map (each layer) can be analyzed independently (without modification or
generalization) or in combination with a number of other maps (layers). In the latter case direct
reference is made to each overlay, not each cell.
Sample cell (E5, N4)
and intersecting
data sets
N'_'P
inventory
layers
Temperature
zonas
N6
Off° "
"
igosalIPP".
/1/.".
Resource
0°.
,A111/1°."(dippi-111W_
0000
1E0
El
E2
1111
E3
E4
6M
E5
E6
1E7
4"1Pw'
idNIP'.1
000.
,A0IP.w.-App.,'"
.giOrraIalLwiepr-,iip
Length of
growing period
in days
411MIIPPOwp."_.W
al/IIPPP",
OMMINI
IIMLIRMf .IIPWSP
,
Topography
SAIMOP. PariiPM4
....."1"126.1r7aLeradrigigiP
. . .1I I PP 7... No 1°'., -all
.
'20Pw-
0 1 I 6 Vi I 3 OPP.
l-'410SWAISMOPPI
lli.mNIPP"
,.....1....aft,
Soil type
Additional layers of
resource data or geographic information
such as country, state
or regional boundaries,
demographic and/or
economic data can be
entered to the GIS.
GILES/Para 2 for Users: GILES
26
2.2.4 Principles of Map Digitizing and Storing
2.2.4.1 Concept of Grid Cell:
To store and to overlay different location specific informations, they have to be in a form
processable by computer. As computer can work only in a digital manner, any area specific
processing, Le. any kind of maps, have to be in matrix form. There are two fundamental ways of
handling topological data: Raster form or vector form.
- The raster system is based on a rectangular array of cells, e.g. like a graph paper, splitting up
each 'map' into a large number of tiny grid cells ('pixels'). The location (within the system)
is given by coordinates of the horizontal x-axis and the vertical y-axis. Thus, each grid cell
is referenced by a row and column number and it contains a number presenting the number of the mapping unit and serving as a 'pointer' to the database (DBMS).
Through the x- and y-coordinates each location, i.e. each cell, can easily be - independently - addressed and all its geographical informations, e.g. soil type, altitude etc., can
easily be recalled.
Advantages of raster based systems are a computer congruent concept enabling direct
access to data arrays for processing and to storage media and therefore high speed, easy
overlay of maps (direct overlay of the pixels; see p.23), direct display and outprint facility,
easy access to neighborhood and 'island' processing. They require a reratively simple data
structure and are executable on cheap hardware. The primary output is a 'raster map'
which requires, if output on a printer, additional cartographic work to finalize the map.
Strong emphasis is given in these systems to area coverage and processing and easy
spatial analysis rather than to topological line and point features.
- Vector based systems consist of mapping units with their boundaries defined by a set of points
and lines ('vectors') between these points. Their primary output are 'polygon maps' with
elegant and accurate graphics.
Although they might provide better quality output, require sometime less storage capacity
of the computer and give better support to line features, they do not show the above
described advantages of raster systems. Overlays of several polygon maps, in particular
for modeling, are difficult.
The most obvious and effective matrix system is a space grid cell system following a
coordinate system. Many digitized computer systems use therefore this system. Thus, preference
is given in GILES to raster system rather than vector system.
Although GILES handles and manipulates maps internally in a raster system, raster/vector
conversion and vice versa are installed for digitizing (map entry through digitizing tablet) and for
plotting.
The application of a raster implies the careful decision of the size of the raster. The pixel
size determines the resolution at which the resource information is represented. It is of fundamental importance for:
GILES/Para 2 for Users: GILES
27
Accuracy (quality of results)
Outlook of the output maps
Time required for data entry and processing
Storage required
Any kind of selected grid cell size will be a compromise between acceptable detail and a
manageable time effort for data entry and processing.
With those considerations and for the ease of map entry, it is highly recommended to use
a 5x5 mm grid cell raster as standard for map entry into GILES. This pixel size still allows
manual handling. With this, it is even possible to raster thematic maps manually and then input into
the computer through the numeric keypad (recommended only in exceptional cases). It corresponds to the area of 0.25 cm2 which is seen as the smallest area capable of being represented
and described by observations (Bridges 1982; Vink 1963).
The mapping unit with the largest area within a grid is assumed to be representative for the
grid. According to Ankum (1986) the loss of information of one particular grid cell is 15-40 %. This
potential loss of information which is a disadvantage of grid cell systems, can efficiently be avoided
by reducing the area a pixel represents, through:
- Reduction of the grid cell size at map entry; indeed, this is limited because data entry with
smaller units than 5x5 mm is very tedious for the operator and can not easily be
checked and corrected; or:
- Enlargement of the scale for map entry, in which case the only disadvantage is the intermediate process of (photographical) enlargement of the map. With the use of
FX printers, a factor of 2.36 was found to be very useful. See Section 3.3.15 (1)
(p.122) for selection of map scale for entry.
The average loss of information on a scale of 1:50,000 when a 5x5 mm input grid pattern is
used (250 x 250 m) is calculated to be 0.94 - 2.50 ha, on a scale of 1:250,000 with the same 5x5
mm input grid pattern by using the above mentioned 'scale enlargement technique' 4-11 ha.
In the present land resource inventory, land evaluation and land use planning project
(LUPRD) some 300,000 ha were covered at a scale of 1:50,000 annually, or some 2,000,000 ha at a
scale of 1:250,000. Thus, a pixel size of 5x5 mm implies an allover amount of 50,000-70,000 pixel
per map of the area surveyed in one year, which can be entered in between 2 days and 3 weeks
(see Section 2.5.1; p.36). One thematic map of one study area takes some 100-200 kB storage on
disk. For many project sites, soil, altitude, and land use/land cover maps of one study area can be
stored on one disk (360 k drives of IBM-PC).
2.2.4.2 Technique:
For easy handling each map sheet is divided into four vertical strips called 'runs'. Each run
is covered by 28 columns (5 mm wide) and 111 rows (5 mm high). Thus, a map sheet is covered
by a raster with 112 x 111 cells (see Section 3.2.2; p. 97). Each run is stored in a separate data file
(binary, random access, no use is made of map compensation techniques, run length coding or
quadtrees, as computer storage is a minor constraint and in order to improve execution speed of
detailed maps).
GILES/Para 2 for Users: GILES
28
2.2.5 Future System Enhancements
It is shown that the integration of computer technology and spatial data for land evaluation
purposes can provide a user with a powerful tool for environmental analysis that greatly extends
the capabilities of conventional maps.
With hardware prices still declining in terms of processing power and storage capacity
available and demand increasing, there seems certain to be a trend towards small, decentralized
systems (Burrough 1986) to make a system like GILES accessible for any institution concerned
with natural resource inventories and land use planning.'
Although it would be a mistake to let our focus to become too narrow. Data base technology is rather new and not fully developed. Practically and conceptually, there are still a lot of
problems. But perspectives for the future can be very optimistic.
In general, positional and graphic output forms will be very much improved, ease of
retrieval and especially of entry will be improved in higher performances both in hard and in
software.
In particular, following additional options are not implemented in GILES, but envisaged,
partly developed and will be available in the next GILES version:
- Wider/continuous scale range for printouts on matrix printer
- Menu-driven modification of land evaluation
- Support of slope maps and aspect maps (at large scale)
- Advanced plot facilities with topographic features
(fully operational automated cartography)
- Flexibility of scale for map entry
(overlay/comparison of maps entered at different scales)
GILES/Para 2 for Users: GILES
29
2.3 LAND EVALUATION ASPECTS OF GILES
Among the reasons why previous GIS systems were not effectively used is that the com-
plex nature of many natural phenomena is poorly captured by conventional GIS methods
(Hogg/Stuart 1987). It was a major objective of GILES to overcome this problem by defining quantitative or semiquantitative interrelations, as set by the land evaluation methodology.
The principle objective of land evaluation is to select the optimum land use, taking into account both physical and socio-economic considerations and the conservation of environmental
resources for future use (FAO 1983).
Main emphasis to land use recommendations under the conservation point of view and to
soil conservation recommendation is given in Section 2.3.2 (p.32). The more detailed agricultural
potential assessment will be carried out crop-specifically and gives yield estimates, as described in
Section 2.3.1 (p.29). Social and economic parameters are considered to show the balance between potential and need of the land in Section 2.3.3 (p.32).
Thus, land evaluation is installed in GILES to:
assess the land suitability for crops and crop mixtures at defined levels of inputs and
management
derive recommended land use based on assessment of erosion hazard and wetness
limitations
assess the ability of the land resources of the area to support current and future levels
of population
2.3.1 Land Suitability Assessment
The 'agricultural potential' is defined in terms of five different 'crop suitability' classes with
approximately expected yields as a percentage of the maximum obtainable yield (see Table A7.24;
p.238):
Highly suitable ('Si'):
Potential production is high and sustainable from year to year.
Average yields: 80-100 %of the 'maximum obtainable yield'.
Moderately suitable ('S2'):
Potential production nnay be moderate or high, but is variable from year to year.
Average yields: 60-80 % of the 'maximum obtainable yield'.
GILES/Para 2 for Users: GILES
30
c) Marginally suitable ('S3'):
Potential prcduction is variable from year to year with considerable risks or difficulties in
maintaining continuity of output. In some years there may be failure to establish the intended crop.
Average yields: 40-60 % of the 'maximum obtainable yield'.
Very marginally suitable ('S4'):
In many years there will be failure to establish the intended crop.
Average yields: 40-60 % of the 'maximum obtainable yield'.
Not suitable ('N'):
Environmental conditions do not allow a continuous growth of the crop.
Average yields: Nil or less than 20 % of the 'maximum obtainable yield'.
The essential procedure of land evaluation is one of matching the resources of land with
the requirements of specific types of land use. 'Land' is taken to include all relevant features of the
land use environment, including climate and vegetative cover in addition to surface and soil features.
Emphasis is given to land suitability assessments for single crops. At the present, 42 crops
occurring in the highlands of Ethiopia (see Section 4.2.19; p.180) are defined with their ecological
requirements and allow a crop specific assessment. Similar evaluations are possible for forestry.
Single crop evaluations can be combined to assess the viability of existing and proposed
farming systems. Bearing in mind the influence of the level of inputs and management on crop
suitability, four levels of inputs were defined as follows:
a low level of inputs, corresponding to local unimproved crop varieties, no fertilizers or pesticides, no soil conservation measures
an intermediate input level of inputs, corresponding to limited use of improved seeds, fertilizers
and pesticides and some minor soil conservation measures.
a high level of inputs, in which improved seeds are used and at which fertilizer and pesticides
are used near optimum levels. Land preparation is mechanized and physical conservation
is carried out.
a high level of inputs, with mechanization, in which all farming operations, including harvesting,
are fully mechanized.
Various minor and major land improvements can be incorporated to show the potential of
the land under improved conditions. A few examples of this modeling are shown in Section 3.2.1
(p.47).
The ecological environment (soils, climate, present land utilization types, agronomic practices) is inventoried by field surveys and described in form of 'land characteristics' (e.g. slope,
drainage, altitude, precipitation, frost hazard). These land characteristics strongly interact in their
influence on crop growth and are combined in the definition of 'land qualities' (e.g. oxygen
availability, growing period). Land qualities are then compared ('matched') with the specific 'crop
requirements' of the particular crop. Details of land quality/ crop requirement models are given in
volume 2 of this Manual (FAO 1987 c).
GILES/Para 2 for Users: GILES
31
Land qualities are grouped and crop suitabilities are retrieved at three intermediate stages
of the evaluation to show:
- The climatic suitability, based on the land qualities temperature, moisture availability and frost
hazard
- The soil suitability, based on the land qualities oxygen availability, nutrient availability, nutrient
retention, rooting conditions, flood hazard, sodicity and salinity
- The final land suitability class is based on the combination of climatic and soil suitability, with
additional consideration of the land qualities workabilities and erosion hazard. The above
intermediate crop suitabilities are useful in identifying the source of constraints.
Detailed assessments are very useful for the suitability assessment of new crops and after
implementation of higher input farming systems or of certain land improvement(s). GILES enables
the mapping of the areas with the various suitability assessments.
Computerization of land evaluation is as more important, as greater the scale, because a
greater scale involves a higher level of detail and therefore more calculation (matchings) which are
time consuming as well as very attractive for errors. The map overlay functions go far beyond pure
Boolean algorithms.
Any land evaluation approach has to be continuously tested and corrected. Field checks
are required for both methodology as well as for crop requirements checking. Modifications of land
evaluation models can be easily inserted into GILES.
The entire methodology of land suitability assessment is explained in general in FAO 1986,
1983, in detail in volume 1 of this Manual (FAO 1987 b), summarized in App.7 (p.211).
GILES/Para 2 for Users: GILES
32
2.3.2 Recommendations for Conservation Based Land Use and Conservation Measures
Sheet erosion intensity ('erosion hazard'), expressed in t/ha/yr, can be calculated using an
erosion estimate model, adapted from the Universal Soil Loss Equation (USLE) by
Wischmeier/Smith (1978), modified to the conditions in the Ethiopian highlands by Hum' (1985).
This assessment is based on environmental conditions, such as rainfall, soil type, slope gradient,
slope length, as they occur in the area. Detailed explanation is given in App.7.1 (p.211). The loss is
grouped quantitatively in four classes of < 10 / 10-30 / 30-75 / > 75 t soil loss/ha/yr.
Recommendations for appropriate land use can be made for land use strategies and associated physical conservation works to minimize further degradation of the land resources. They
are based on the assessment of sheet erosion hazard, gullying status and several soil characteristics. Land use intensity, annual/perennial cropping, livestock production, production/conservation
forestry are recommended based on the conservation point of view (see App.7.2; p.215).
Through GILES, it is possible to assess these estimates and recommendations, to map the
individual units and to calculate their sizes per administrative unit.
2.3.3 Population Support Capacity
Population support capacity is determined by matching the potential productivity of land
resources with the food requirements of the population (and the forage requirements of livestock in
areas with a high livestock population) which form an essential component of the farming systems.
The results of this assessment indicate areas (e.g. administrative units) which are particularly critical with respect to supporting their population, and also areas with potential for surplus production.
Although GILES does not actually execute the matching between the potential and the
food requirement, it can supply all data for the population support capacity models, in particular
the quantitative assessment of the agricultural potential e.g. in suitability terms or in tons grain per
planning zone or per PA. Further explanations of the population support capacity model can be
found in Appendices in FAO 1988c, 1988d, 1989a.
Interfacing of the agricultural potential and existing farming systems is supported by
GILES through assessment of the suitabilities per agroecological zone and matching them with the
results of the socio-economic farming system survey, as it is done in the present FAO project in
LUPRD.
GILES/Para 2 for Users: GILES
33
2.4 DATA STRUCTURE REQUIREMENTS
A computer system - essentially an unintelligent, industrious slave - forces people, when
implementing tasks within it, to plan very carefully and to clarify all principles and operations. This
has resulted in the need for a precise structure and definition of data.
Data collection is the fundamental data operation, as its reliability governs the utility of all
the subsequent operations. The values should be sufficiently representative of the element or
parameter in space. The observation network density governs the representation in space. The
aspect of computerized processing should already be incorporated when monitoring and survey-
ing is done at field work. Aspects of feasibility and reliability of data under the aspect of data
processing have to be considered.
Soirsurveyors should be aware about the level of detail, e.g. processed spatial detail (28
ha at 1:250,000 inventory resolution with scale enlargement technique). A grid storage system requires some means of 'interpolating' randomly located survey data to a fixed grid (Giltrap 1983);
eventually the sampling design has to be redefined. Under the digital point of view a grid sampling
(stratified grid or stratified random) has many advantages at medium or large scale surveying.
The preparation of the data comprises the operations necessary to convert data from the
format in which it is received to a format suitable for input to the computer. This includes the need
to reorganize the data before entry: standardization of measurement units, grouping of all available and necessary data into classes (described and listed in Section 4.2, p.153), additional levels
of coding for storage purposes, and the estimation of derived parameters, e.g. estimation of temperature and Penman evaporation from climatological data.
For agricultural planning purposes, three groups of data are required for a system to give
the entire information set to allow decision making:
data on natural resources and agricultural potential:
soils, climate, water, topography, vegetation etc.
data on the use of the resources by the population:
present agricultural activities, crops, input,
farming systems etc.
data on the social and economic environments in which this
use of resources take place:
population, population growth, prices, supply, demand,
social infrastructure etc.
Aspect (a) is the main part of the GIS and land evaluation facilities of GILES, (b) and (b)
can be entered and retrieved on a spatial basis and overlaid with other data sets. A detailed list of
data essential for land evaluation is given in Volume 1 of this Manual (FAO 1987 b), a summary of
the considered physical land characteristics in Section 4.2.16 (p.176).
GILES/Para 2 for Users: GILES
34
e
Natural
Resources
(soils,climate
topography,
vegetation)
o.
Current Use
of Resources
(land use,
farming systems
crops,input)
e
Society &
Economy
(population,
prices,support
administration)
V
Database
GILES
Crop
requirements
< LandEvaluat ion
Models
Land Evaluation
graphic
packages
spreadsheet/
statistical
packages
V
Suitability assessments
Carrying capacity
Definition of constraints
Characteristics of agroecological/planning zones
Potential of agroecological/planning zones
These data are inventoried by remote sensing, field surveys, farm and crop surveys,
secondary data sources (statistics) etc. Particularly 'dynamic' data, such as population, management level, infrastructure data, need special attention. Very often they can change considerably
within shortest time. GILES is the tool to update the data set and perform updated calculations and
assessments.
At each step of resource data processing and mapping errors will occur: Delineation of
units depends on judgment of surveyor, transition zones of concrete phenomena have to be expressed by chloropleth maps, maps are rasterized, raster output maps have to be delineated etc.
Most of these errors can be minimized by careful checking, but complete avoidance is impossible.
Computers cannot intelligently ignore non-logical errors.
GILES/Para 2 for Users: GILES
35
At each stage there should be necessary and proper data verification and checking procedures to ensure that the resultant database is as free as possible from error. Only if the collected,
entered, stored and processed data are sufficiently reliable and 'error-free', GILES can give the requested information and thus justify the system.
Another, more severe problem of data validity arises when interpreting and modeling. Because this implicitly assumes that all information encoded is absolutely correct and contains no error components: One of the weakest points of modeling.
The whole land evaluation approach and all applied models have to be continuously
tested and corrected. This requires field check for both resource data as well as for methodology,
crop requirements, current and potential farming systems.
For further description of handling data in GILES, see Chapter 4 (p.150).
GILES/Para 2 for Users: GILES
36
2.5 DATA INPUT AND OUTPUT
2.5.1 Input
Two aspects of the data need to be considered separately for GILES: These are first the
geographical data ('maps') necessary to define the locations, and second, the associated attributes ('parameters', DBMS) that record what the cartographic features represent.
2.5.1.1 Map entry:
Maps do not usually lend themselves to direct placement on an automated device for entry
into digital form. Most of them are cluttered or loaded with colors, polygon-fill and labels.
Automatic scanning is therefore impossible (Fleet 1986).
Some options which are used to digitize maps are stereo digitizers with zoom-transfer
scopes, optical scanners that replace the digitizer in some applications, and remotely sensed data
fronn airplanes to satellites that can be converted to maps (Consoletti 1986). But none of them are
applicable and can be recommended for use on PCs within the cost range and technology input
presented here.
GILES gives the offer to enter maps through an interactive way of digitizing from existing
maps, aerial photographs or satellite images via digitizing tablet.
No experience or knowledge is required for map digitizing. (In some other GIS the
operator is required to build the topological links into the database while digitizing the line pattern
or to stop at each node or intersection). The whole procedure is menu-driven; entered units are
displayed with their shape and area size on on-line display: VVYSIWYG.
The basic principle is to surround the mapping unit by following its boundary with the
stylus till the starting point is reached. Depending on the size of the tablet, the starting point will be
read automatically (on tablets larger than one map run) or has to be entered with its x and y coordinates by the operator (on smaller tablets). No device buttons have to be pressed, no limitation of
speed. This simplicity of operation as well as feedback is provided in order to minimize errors, because these errors are usually tedious and expensive to correct.
Immediate check is made for 'dead ends' of line entry (area not closed), 'double assignments' (assignment of the area to a different unit before), correct vector/raster conversion, correct
labeling of the unit, digitizing within the active area of the tablet and proper function of interface
and tablet. Filling of the polygon is made automatically. Following the 'predominance method' cells
at the edge of the units covered by two or more units, are assigned to the unit predominating
within the cell.
The procedure of map entry is explained in Section 3.3.18 (3) (p.125). For explanation of
error messages see App.3 (p.192).
GILES/Para 2 for Users: GILES
37
The only preparation before map digitizing concerns the - eventual - enlargement of the
map (see Section 3.3.15 (1), p.122), cutting into various sheets and defining the map index (see
Section 3.3.15 (2) and 3.3.17; p.125).
Several digitizing utilities can be used, such as automatic replacement of units, individual
or selective replacement, boundary checking of the total area, 'cutting', filling of blank areas, check
for completeness (listing of blank, unassigned areas) or shifting parts of the map into the four main
directions.
Previous experiences in the LUPRD showed that entering a map of 1-3 m2 takes between
2 days and 3 weeks, depending mainly on the level of detail, i.e. size of the individual mapping
units (see Section 1.5; p.9). Average speed of entering is 30-50 linemeters per hour.
Maps of different input scales can not be compared and overlaid yet (see Section 2.2.5;
p.28).
In exceptional cases, for very small areas or for correction work maps can be entered by
overlaying a transparent raster and following the boundary with the numeric keypad (up, right,
down, left).
The presented way of digitizing is faster, cheaper and easier than of most other GIS systems because it does not require attention of details of topology, attribute-assignment or operation
of hardware and hardly any of software. Therefore, the time effort is almost equal to 'redrafting
maps' (which is seen as a faster way of map entry into complicated GIS system than the conventional way of digitizing (Fleet 1986)).
The best way to check that the spatial data have been correctly digitized is to get the computer to plot them, preferably on transparent or thin paper, at the same scale as the original. The
two maps can then be placed over each other on a light table and compared visually, working systematically from left to right and up and down across the map. Missing data, locational errors, and
other errors should be clearly marked on the printout and corrected in GILES either grid cell by
grid cell (for minor corrections) or by overwriting the existing, old values (with 'ALLN' option; see
Section 3.3.18; p.126).
2.5.1.2 Non-spatial data:
Non-spatial data ('parametersVattributes) are stored in DBMS, which forms part of GILES.
All data can easily be input following the option 'Database' at the Main Menu.
Most of the data can be entered directly into GILES as well imported from spreadsheet
files (through DIF format), e.g. from Lotus 1-2-3 (see Section 3.3.22; p.133). This gives the possibility to manipulate the data through spreadsheet or database software packages and to integrate and use them in GILES. In particular, this is applied for precipitation data (eventually from
other sources, such as the National Meteorological Survey Agency) or for comprehensive soil
mapping unit composition tables.
Non-spatial data are checked during entry and program execution for syntactical errors,
but that does not imply that careful checking of data does not need to be made after entry.
G1LES/Para 2 for Users: GILES
38
2.5.2 Output
All operations for retrieval of any kind of information ('output') are c,arried out in an interactive environment through a continuous, self-explanatory dialogue between the user and the computer ('menu-driven').
Maps can be displayed on screen in scrolling or high-resolution image mode, printed
directly through GILES or through screen dump utilities on printer or plotter or stored on disks in
various formats for further processing.
Experiences in LUPRD showed that font printing on matrix printer is the most preferred
output mode for large size maps. But it should be noted that it requires - like all rastermaps of GIS
systems - a considerable amount of 'afterwork' to finalize the maps: sticking the individual print
sheets together, to delineate and to label the units.
On small size maps (e.g. text maps) it is recommended to print the resolution map display
of the screen through screen dump utility.
Numeric data can be displayed on screen, printed or transferred to spreadsheet or
graphic packages for presentation as tables, graphs or charts or for statistical calculations.
The various output forms are discussed in Section 3.2.3 and in all 'Output' Paras. of Sections 3.2.1 (p.47).
GILES/Para 2 for Users: GILES
39
2.6 REQUIREMENTS
Requirements of GIS systems were very high in the past. Only the development, mass
production and inexpensive sale of microcomputers (PC) and the introduction of user-friendly
software did lead to a break-through in GIS applications. Moreover, in the past GIS systems required professional software engineers to run them and were extremely hardware dependent and
hence could not readily be transferred from one system (computer) to another.
GILES' data can be easily transferred from one system to another (by disks, communication cable, or modem; 6 seconds per map sheet at 9000 bps rate). The user-acceptance of the system can be compared with the one of commercial spreadsheet software, thus, no software engineers are required anymore.
2.6.1 Hardware
The package will run on any DOS operating system based microcomputer (PC) with a
harddisk. But recommendation is given to 'IBM-compatible' computers with high speed (if possible, 20 MHz or faster), fast hard disk access (if possible, 20 ms or faster) and extended memory
(some 2 MB).
The system was developed on IBM-PC/AT equipped with CGA and EGA facilities, Epson
FX printers and HP and Roland plotters as output devices and Summasketch and Houston Instrument tablets as input device. The program is written in Quickbasic Compiler language.
The detailed hardware requirements are listed in App.4 (p.200) with one version for the
minimum (1500 US$) and one for the optimum configuration (4000 US$; prices of July 1989).
Technical support for Personal Computer in Ethiopia like in many other developing
countries is still rather poor and less satisfactory. But - a great advantage of the present system the components of the required hardware are rather inexpensive and easy to exchange. E.g. malfunctioning of a board simply means to replace it.
2.6.2 Training
Personnel has to be trained to apply the system and to make use of all potential products.
They have to be able to retrieve all requested information, to enter the data and to contact, to offer
and advise the clients about the facilities of GILES.
Education of personnel is divided into two different level:
a) Level 'users, experts, technicians' should know how to retrieve data (maps, statistics, tables)
and to continue with and to interpret these data for the individual purposes. Additionally,
technicians and cartographers should be able to enter data.
Training can be autodidactic or in form Of training courses or workshops of a few days.
Knowledge of operating system, programming or electronics is not required.
GILES/Para 2 for Users: GILES
40
This chapter ('GILES') and Chapter 3 ('Users Manual') is in particular addressed to these
users.
b) Level 'system analysts': One or tvvo staff members should be completely familiar with the entire
system to set up or modify GILES on request, to make and organize back up copies and
to give advise to users.
Hardware maintenance (cleaning, checking hardware functions, replace spare parts)
should be done by the 'system analyst' (see App.4; p.200).
This experience can be gathered by working with GILES for a few weeks or by an intensive
training course. Knowledge about DOS and computer hardware is advisable.
Chapter 4 ('Data structure') and Appendices are addressed to the 'systems analysts' explaining the details of GILES, including the option (not a necessity) to change the
programs (source code and current compiler must be available).
2.6.3 Costs
Four separate elements of costs have to be considered. They will be discussed here and
compared with large, purely commercially oriented GIS systems:
Purchase: As GILES is designed to run on small PCs and the computing power of these smaller
machines increases rapidly, some 1500 US$ (minimum configuration) - 4000 US$
(optimum; prices of July 1989) are sufficient for one hardware system being able to run
GILES (see App.4; p.200).
Commercial GIS software in midrange systems require hardware of 25,000 to 150,000 $,
large systems for major GIS applications up to half a million dollar (Devine/Field 1986).
Personnel: Training new personnel to use the system is very essential !
Even though GIS are 'complicated by their nature', attempt was made to make GILES as
user friendly as possible with explanations in the menus, on-line Help menus, use of standard commands of commercial software and with this manual (see Help facilities in Section 3.1.2; p.45).
It will take a person having some experience with spreadsheet processing between a few
hours and a day to produce the first output, one or two weeks to run most of the facilities
of GILES.
GILES/Para 2 for Users: GILES
41
'The more you spend on the system, the more your training costs rise.' For expensive systems, access to a computer programmer and often to a maintenance technician is essential (Devine/Field 1986).
Digitizing: The main disadvantage of GILES experienced in the LUPRD, as well as of all GIS systems is the time delay and/or costs caused by the entry of maps into the system.
Data entry of one thematic map of, to say, 1-2 m2 with a medium level of detail (i.e. mapping units with an average size of some 5 cm2) takes some 2-4 days. But with a higher
level of detail (with units of 1 cm2 or even less, e.g.many soil maps) it might take 1-4 weeks
to enter such a map.
This is a common experience of GIS systems: 'Digitizing dwarfs every other cost of GIS'.
There can be only argued that this procedure has to be done only once for every map, the
entered map can be retrieved as many times and in as many versions as requested.
Maintenance and support: Maintenance for PC is rather uncomplicated. Care has to be taken
mainly for cleaning the system, particular in dusty environments (see App.4.4 for hardware
maintenance; p.202).
In case of a break down, the malfunctioning components (e.g. boards) have to be identified and replaced. This is not expensive, but might bring some delay, if spare parts are
not available in the country.
Large GIS systems require a software maintenance fee. 'Costs of software - and hardware
- rnaintenance rise with the purchase price of the system' which is in the order of 1 % of
the purchase price per month (for hardware) or more (for software).
GILES/Para 3.1 for Users: User's Manual
42
3 USER'S MANUAL
This chapter is addressed to the 'user' who wants to derive (or enter) any kind of maps or
data handled by GILES. No computer or GIS experience is required.
Section 3.2.1 (p.47) presents the main options of GILES, It is worthwhile to have at least a look in
the main features and to see what GILES can execute.
Sections 3.2.2 - 3.2.5 (p.97) explain how to define a number of settings for the retrieval of maps or
calculations, which are specification of the area or of the output, setup of the hardware
and transfer to other packages.
Section 3.3 (p.105) illustrates how to perform the most import tasks in an easy step-by-step
(menu-by-menu) description.
.
More detailed information is given in Chapter 4 and the Appendices for the 'system
analyst' who wants to set up or modify GILES. Information is given concerning the structure and
syntax of data files and programs.
The land evaluation approach is explained in App.7 (p.211).
GILES/Para 3.1 for Users: User's Manual
43
3.1 INTRODUCTION
3.1.1 Setup of Menus
When you start GILES, your screen appears as shown below:
'Status Bar'
V
MAIN
MENU
==> BaseMap (complete/aggregating/selective/parametric)\
Overlay of base maps
> Maps
Overlay/reprint of Previously Configured Map(s)
Area Sizes
site speci,fic Information
/ Tables
Climatic Suitability
Soil Suitability
> Suitab.
Land Suitability
Erosion hazard
Conservation Based Land Use Recommendations
/
Erosion
Length of Growing Period
Database (DBMS)
Entry of Base Map
Systematic Change of Base Map
Chaining of Various Procedures
File Operation
Shell to DOS
out (exit to system)
\
/ Data entry
\
/ Utility
\
> DOS
F1=Help F2=PreviousMenu F10=MainMenu Up Down(or1.1etter)ENTER=Select
'Command Bar'
Every GILES menu shows several options in different lines with the 'Command Bar' at the
bottom and the 'Status Bar' at the top.
GILES/Para 3.1 for Users: User's Manual
44
The indication arrow and the highlighting of the option can be moved up and down with
the numeric keypad on the right handside of the keyboard. To select an option, move the cursor to
the requested option, or press the first letter of the option, and press < Enter > .
Additional features of the menus are:
the call of a Help screen with context specific explanations: pressing F1
the repetition of the previous menu: pressing F2
the new start at the Main Menu: pressing F10
A sequence of menus will be displayed to define all parameters for the requested task.
No query language is installed, all menus are request-specific: The user should not worry
about query language syntax or about internal processing details, e.g. raster/vector conversions
or 'calculation of the length of the border of a quadtree' (as it was seen in another GIS).
When all parameters for the requested map are defined, the map will be displayed and, if
requested, printed, plotted or stored iftthe computer.
GILES/Para 3.1 for Users: User's Manual
45
3.1.2 Help Facilities
GILES has three kinds of help to offer. Two of them are on-line, one is given with the
reference to this manual.
3.1.2.1 Help for menu commands:
It consists of a brief description of the menu's current choices and of the selections made
so far. You don't have to press any keys or make any menu choices to get this description; it appears in form of:
- the command bar at the bottom of the screen which shows all currently active choices:
commands which can be executed (e.g. move cursor up and down)
- the status bar at the top of the screen which shows abbreviations of the options selected
until now: status of the selection procedure
- additional information is given in the menus to non-selfexplicatory options
3.1.2.2 Context-sensitive Help:
Context-sensitive help answers the questions about the various options in GILES' menus.
To use context-sensitive help, press Fi function key and see a synopsis of the present menu. Exit
the Help description ('Help Menu') by pressing the Space bar. There are 102 different Help Menus
installed.
At the Main Menu, the help answers are option specific. Thus, place the cursor on the option you want to know about, then press F1 function key to see the explanation help of the requested option.
3.1.2.3 Manual:
The present Manual gives further details about the options offered in each menu.
GILES/Para 3.2 for Users: Facilities
46
3.2 FACILITIES
The abundant facilities of GILES will be explained in this paragraph.
3.2.1 Main Options
The Main Menu offers the access to the retrieval or the processing of:
- Geographical information system facilities,
such as map retrieval, overlay, combinations;
in line 1 -5 (Section 3.2.1.1-3.2.1.5; p. 48-64)
- Land evaluation facilities
such as erosion hazard and land suitability assessment;
in line 6-11 (Section 3.2.1.6-3.2.1.11; p.65-79)
- Data entry,
such as map entry and data base management
in line 12 and 13 (Section 3.2.1.12/3.2.1.13; p.80-92)
- Utilities,
such as map correction, file copy etc.;
in line 14 - 16 (Section 3.2.1.14-3.2.1.17; p.93-96)
Each option is explained at the following pages with its functions, requirements, output
forms and references for further explanations.
Next page:
Table 3.1
Main Options
GILES/Para 3.2 for Users: Facilities
47
Page
-Base Map
Complete, selective or aggregat.
retrieval of base map
48
-Overlay of base maps
Overlay of base maps
54
Overlay,combination, retrieval
of previously stored map(s)
56
Calculation of area sizes
of mapping units
60
Overlay/reprint of prey.
configured maps
-Area sizes
-Site specific information--> Land Characteristics of
a particular location
Climatic suitability
62
> Assessment of climatic suitabil.
65
-Soil suitability
> Assessment of soil suitability
69
Land suitability
> AsseSsm'ent of land suitability
73
> Assessment of soil loss
due to sheet and gully erosion
76
-Erosion hazard
-Conservation based land
Assessment of recommendaland use recommendations> tions for conservations and
conservation based land uses
-Length of growing period
-Database
> Assessment of average and of
individual growing periods
>
-Entry of base map
78
80
Entry,correction and outprint of
mapping unit labels, soil & precipitation data, considered areas,
crop requirem., admin.charact.
85
Entry and correction of base maps
92
Systematic change of
base maps
>
Chaining of various
procedures
>
File operation
Shell to DOS
-Exit to system
Utility to change,adjust,move base
map following given criteria
93
Utility to chain climatic, soil,
land suitability assessments,
overlays, file operations
95
> DOS operations to copy,delete,
type files
96
> Shell to DOS
96
> Return to DOS
96
GILES/Para 3.2 for Users: Facilities
48
3.2.1.1 'Base map (complete/aooregating/selective/parametric):
Functions:
This main module of GIS facilities is for retrieval (display, print, plot or computer storage) of 'base
maps' with their entire area, one sheet, one run or one window in following versions:
- "complete map":
Retrieval of all units in the form they were entered,
Example: Altitude units (see p.50); all PAs
- "aggregating map":Retrieval of ('new') units which are aggregations of previous ('old') units;
form of map generalization,
Example: Altitude units 1000-1600 m aggregated into one unit, 1700-2400 m into
one. > 2400 m into one (see p.51); all mapping units with vertic properties
grouped together into a 'Vertisol' unit
- "selective map": Retrieval of selected units only,
Example: one planning zone (see p.52); only wetland units
- "parametric map": Retrieval of units in their content through translation table(s),
Example: slope map, drainage map out of soil map, population density map out of
administrative map.
Parametric maps can be:
"parametric-complete"
Example: Complete drainage map(see p.53);
complete slope map
"parametric-aggregating"
Example: Slope map with only three slope classes)
"parametric-selective"
Example: Slope map indicating areas with >25% only
For explanation and listing of 'basemaps' see p.124; for further explanations ofterms, see Glossary
(p.267).
GILES/Para 3.2 for Users: Facilities
49
Requirements:
Map (MAP files)
Mapping unit codes (MUC file)
Study area names (STAREA file)
For 'parametric maps': Translation table(s)
(e.g. soil mapping unit composition and soil type characterization (MCP and TCH files), or
administrative unit composition (ACH file)
Output:
Maps scrolling on screen, as high resolution image on EGA/VGA screen, printed on matrix
printer or plotter, or stored on disk as GILES file
('C:\INTERM\DGpCMPnnn.MAP' with 'DGpCMP.NAM')
or as ASCII file (DGOCMPmn.PRN'); or printed through screen dump utility
Area size tables on screen or printer
References:
Selection procedure: Section 3.3.3 and 3.3.4 (p.108/109)
Program structure: App.8.12 (p.245)
GILES/Para 3.2 for Users: Facilities
50
Map 3.1
Complete Base Map (Example)
Altitude Zones in Menagesha
1:1 000 000
elecils3-119 T
.101
:sJesn semped
I-9
deiAl
buRebaibbkl asug den (eldwex3)
pecinoio apniply sauoz u! eqsabeuen
000 000
GILES/Para 3.2 for Users: Facilities
52
Map 3.3
Selective Base Map (Example)
Planning Zone 7: Alaba Plain, in Haykoch & Butajira
1:1 000 000
GILES/Para 3.2 for Users: Facilities
53
Map 3.4
Parametric Base Map (Example)
Drainage Conditions in Menagesha
1:1 000 000
GILES/Para 3.2 for Users: Facilities
3.2.1.2 'Overlay of base
54
aps':
Function:
This program shows all areas fulfilling defined requirements.
Up to 10 Tnaps can be overlaid, for each map up to 30 mapping units can be defined as required,
following Boolean algorithm:
(unit 1 and/or unit 2 and/or ... and/or unit 30 of map A) AND (unit 1 and/or unit 2 and/or ...
and/or unit 30 of map B) AND
AND (... of map J) for display of unit I
(unit 1 and/or unit 2 and/or ... and/or unit 30 of map A) AND (unit 1 and/or unit 2 and/or ...
and/or unit 30 of map B) AND
AND (... of map J) for display of unit II etc.etc.
Areas which do not fulfill any of the required conditions in one or more of the overlaid maps are
displayed as blank (grey).
Example: A1-1 soil units in altitude of 1300 (±- 100 m)(see p.55)
Requirements:
Maps (MAP files)
Mapping unit codes (MUC file(s))
Study area names (STAREA file)
For 'parametric maps': Translation table(s)
(e.g. soil mapping unit composition and soil type characterization (MCP and TCH files), or
administrative unit composition (ACH file)
Output:
Maps scrolling on screen, as high resolution image on EGA/VGA screen, printed on matrix
printer or plotter, or stored on disk as GILES file
('C:\INTERM \DGpCMPmn.MAP' with 'DGpCMP.NAM')
or as ASCII file (DGOCMPmn.PRN'); or printed through screen dump utility
Area size tables on screen or printer
References:
Program structure: App.8.13 (p.247)
GILES/Para 3.2 for Users: Facilities
55
Map 3.-I5
Overlay of Base Maps (Example)
II
Vertisols units in 1400-1600 m asl in Yerer & Kereyu
GILES/Para 3.2 for Users: Facilities
56
3.2.1.3 'Overlav/reprint of previously configured map(s)':
Functions:
Beside the option 'Base map', this is the core of the geographical information facilities of GILES.
Overlays can be processed within this module, with the condition that the overlaid maps were
processed and stored beforehand through another module (e.g. through 'Base map').
Principally, there are 4 options:
- Reprint of one previously stored map
- Overlay of a 'main map' with a map 'selected areas map' with selected areas,
e.g.overlay of a suitability map with an administrative map, to analyze the suitability per
administrative unit.
Area crosstabulations can be transferred to Lotus-1-2-3 for further processing and
presentation.
If more than 70 mapping units ('selected areas') occur, the original map has to be split into
two (or more) selective base maps with mapping units 1-70, 71-140....
- Comparison of two (suitability) maps, in order to show the impact of land improvement
Example: see next page
- Combination of various crop suitability maps to produce a crop mix suitability map
Up to 5 crops can be overlaid by taking the lowest suitability of any of the selected crops
("law of the minimum") into consideration. This gives the overall
suitability for this crop mixture.
If the 'main map' does not have more than 10 different units and the overlaid 'selected areas
map' not more than 20 'selected areas', the overlay's result can be stored and overlaid again with
another 'selected areas map'.
Requirements:
Prepared ('previously configured') maps
('C:\INTERM\DGpCMPmn.MAP' with 'DGpCMP.NAM' files)
Study area names (STAREA file)
GILES/Para 3.2 for Users: Facilities
57
Output:
Maps scrolling on screen, as high resolution image on EGA/VGA screen, printed on matrix
printer or plotter, or stored on disk as GILES file
('C:\INTERM\DGpCMPmn.MAP' with 'DGQCMP.NAM')
or as ASCII file (DGOCMPmn.PRN'); or printed through screen dump utility
Area size tables on screen or printer or stored on disk
as ASCII file (C:\INTERM\GIL2LOTa.PRN) for further processing
= = =>
If the ASCII file extends a length of 240 symbols, continuation is given in file
GIL2LOTZ.PRN, then in GIL2LOTY.PRN, then in GIL2LOTX.PRN
References:
Selection procedure: Section 3.3.8(p.113) and 3.3.9 (p.115)
Program structure: App.8.14 (p.247)
co
Lo
GILES/Para 3.2 for Users: Facilities
59
Table 3.2
Crosstabulation of Overlay of Main Map with Selected Areas
(Example)
Suitability for Sorghum
under inte/mediate input level
in Haykopch & Butajira
in hectares
Planning
Planning
Planning
Planning
Planning
Planning
Planning
Planning
Planning
Planning
Zone 1
Zone 2
Zone 3
Zone 4
Zone 5
Zone 6
Zone 7
Zone 8
Zone 9
Zone 10
Si
S2
S3
S4
0
0
266
3992
174
12063
6687
22435
60754
18322
2592
0
0
156
2844
400
12626
12366
38356
80562
75969
80042
32324
8953
6306
7710
27156
16362
12429
12401
26306
17780
14487
4438
2415
807
6537
19066
0
0
N
42893
23595
25147
32619
28406
60878
39993
45182
127008
11119
GILES/Para 3.2 for Users: Facilities
60
3.2.1.4 'Area sizes':
Function:
Area sizes can be retrieved of mapping units of a selected map either for the total area, for an individual sheet or for one run of one map sheet.
Area size files as the basis for these calculations can be created during performance of this option.
Example: Areas of PAs and of altitude units in Hosaina with hectarages and percentages; hypsographic curve of Ethiopia (see next page).
Requirements:
Area size files (ARS files); or:
Maps (MAP files) and
Mapping unit codes (MUC file)
Study area names (STAREA file)
Output:
Area size tables on screen, printer or disk as ASCII file
\INTERM \GIL2LOTa.PRN) for further processing in Lotus
References:
Selection procedure: Section 3.3.13 (p.120)
Program structure: App.8.10 (p.245)
GILES/Para 3.2 for Users: Facilities
61
Table3.3
Area Sizes (Example)
Area Sizes of Administrative Units (PAs)
of Borkena
0101
0102
0103
0104
0105
0106
0107
0108
0109
0110
0111
0112
0113
0114
0115
0201
0202
3293
4306
3512
4337
1837
3131
1056
3200
4800
3125
6687
5193
4262
3050
4475
1075
2900
ha
ha
ha
ha
ha
ha
ha
ha
ha
ha
ha
ha
ha
ha
ha
ha
ha
1.1
1.4
1.2
1.4
0.6
1.0
0.3
1.0
1.6
1.0
2.2
1.7
1.4
1.0
1.5
0.4
1.0
%
%
%
%
%
%
%
%
%
%
%
%
%
%
%
%
%
Altitude Distribution
in Hosaina
1000-1200
1200-1400
1400-1600
1600-1800
1800-2000
2000-2200
2200-2400
2400-2600
2600-2800
2800-3000
3000-3200
3200-3400
3400-3600
m
m
m
m
m
m
m
m
m
m
m
m
m
asl
asl
asl
asl
asl
asl
as1
asl
asl
asl
asl
asl
asl
O ha
O ha
875 ha
24706
48456
67093
33975
21300
13668
9762
6943
2825
ha
ha
ha
ha
ha
ha
ha
ha
ha
O ha
O
O
0.4
10.8
21.1
29.2
14.8
9.3
6.0
4.3
3.0
1.2
O
%
%
%
%
%
%
%
%
%
%
%
%
%
GILES/Para 3.2 for Users: Facilities
62
3.2.1.5 'Site specific information':
Function:
Selection of this option will display any information stored in the system of a particular location
(grid cell) in tabular form.
The mapping unit and its explanation of the requested location (pixel) will be shown for all entered
'base maps'.
Additionally, further information is given for the occurring soil type(s), soil characteristics (drainage,
texture, slope, chemical parameters etc.), monthly and annual precipitation at various reliability
levels, mqnthly and annual temperature and potential evapotranspiration, administrative characteristics (population density, livestock population density, population support capacity, access to
roads etc.) as far as they were entered into GILES.
Example: Location in Borkena project area (see next pages)
Requirements:
Maps (MAP files)
Mapping unit codes (MUC files)
Soil mapping unit composition ('aSOIL.MCP' file)
Soil type names ('aSOIL.STN' file)
Soil type characterization ('aSOIL.TCH' file)
Altitude correlation ('aALT.COR' file)
Administrative unit characterization ('aADM.ACH' file)
Expected precipitation values ('aPREC.RLV' file)
Land characteristics names ('LCHAR.NAM' file)
Land characteristic classes names ('LCHATN.NAM' file)
Structural characteristic classes names ('aATN.NAM' file)
Study area names (STAREA file)
Output:
Listings on screen or printer
References:
Program structure: App.8.11 (p.245)
63
GILES/Para 3.2 for Users: Facilities
Table3A
Site Specific Information (Example)
Sheet 3
(Degaga)
Latitude:
Longitude:
UTM grid
Administrative unit:
Woreda (District)
INFORMATION ABOUT Borkena
/ Run 3 / x 10 / y 10
N
10:46:12-10:46:21
E
39:38:51-39:38:59
EB 708 906-EB 711 908
0111
Albuko
Kalu
Awrja (Province)
Welo
Region
6000-7000
Population
Present population density 75-100 /km2
6000-7000
TLU
100-150 /km2
TLU density
AGH (Arable+grazing land/household
1.5-2 ha
coded
coded
coded
coded
coded
coded
coded
as
as
as
as
as
as
as
1
5
2
1
5)
11)
6)
(coded as 7)
1C
Planning z9ne:
Agroecological zone:
(no)
2500 +- 100 m
Altitude unit
B5-1
Soil mapping unit:
Soil type of appr. 50 %
Soil type:
41
Drainage
somewhat excess.drained(coded as 6
L + cL
Texture (tops.)
coded as 20
Texture (subs.)
L + CL
coded as 20
Min.fragm. (tops.)
frequent (15-40 %)
coded as 3
Min.fragm. (subs.)
n.a.
coded as 9
Depth
shallow (25-50 cm)
coded as 3
Topsoil depth
deep (appr.30 cm)
coded as 4
Ponding
none-slight (< 1 day) coded as 1
Flash flooding
none
coded as 1
none
Flooding
coded as 1
Surface stoniness
very stony (3-15 %)
coded as 4
Surface rockiness
2 - 10 %
coded as 3
Erosion/gully/badland statusmoderate sheet/rill
coded as 3
Nec.f.gully measures
no eros.measures neces.(coded as
Mean slopes
25 - 40 %
coded as 8
Mean max.slopes
40-55%
coded as 9
T9pography
sideslope
coded as 8
Microrelief
moderate
coded as 3
Slope shape
complex
coded as 1
Slope length
< 50 m
coded as 1
Groundwater level
> 300 cm
coded as 8
Permeability
rapid
coded as 5
Consistence
hard/non-sticky
coded as 2
Structure (tops.)
fine
coded as 5
Surface sealing
non e to slight
coded as 1
Bulk density
medium
coded as 2
anic mat er
high (3 - 5 %)
coded as 3
N t) (tops.)
medium (0.1-0.15 %)
coded as 2
N t) (subs.)
n.a.
coded as 9
P
medium (5-15 ppm)
OrI avail) (tops.)
coded as 2
Ca rxc
very high (> 10 me)
coded as 4
Mg exd (tops.)
very high (> 5 me)
coded as 4
Mg exc
(subs.)
n.a.
coded as 9
K (exc) (tops.)
very high (> 0.5 me)
coded as 4
K (exc) (subs.)
n.a.
coded as 9
pH (tops.)
slightly acid (6-6.6)
coded as 4
pH (subs.)
n.a.
coded as 9
CEC (tops.)
high (> 20 me)
coded as 4
BS tops.)
medium (50-75 %)
coded as 3
BS
subs.)
n.a.
coded as 9
Na exc) (tops.)
low (< 6 %)
coded as 1
Na exc) (subs.)
low (< 6 %)
coded as 1
EC tops)
non-saline (< 2 mmhos) coded as 1
Ero ibility (kc)
kc 0.10
coded as 2
)
GILES/Para 3.2 for Users: Facilities
Soil type of appr. 50 %
Soil type:
62
Drainage
excessively drained
coded as 7
Texture (tops.)
variabel
coded as 1
Texture (subs.)
variabel
coded as 19
Min.fragm. (tops.)
Very frequent (40-75 %)(coded as 4
Min.fragm. (subs.)
n.a.
(coded as 9)
Depth
very shallow (10-25 cm)(coded as 2)
Topsoil depth
lim.byrootingdepth(<15 cm)(coded as 1)
Ponding
none-slight (< 1 day) coded as 1
Flash flooding
none
coded as 1
Flooding
none
coded as 1
Surface stoniness
very exceedingly stony > 50 %)
Surface rockiness
50 - 90 I
coded as 6
Erosion/gully/badland statusslight sheet/rill
coded as 2
Nec.f.gully measures
no eros.measures neces.(coded as
Mean slopes
40 - 55 %
coded as 9
Mean max.slopes
40-55%
coded as 9
Topography
sideslope
coded as 8
Microrelief
strong
coded as 4
Slope shape
complex
coded as 1
Slope length
50 m
coded as 1
Groundwater level
300 cm
coded as 8
Permeability
moderate
coded as 4
Consistence
loose/non-sticky
coded as 1
Structure (tops.)
massive or weak
coded as 1
Surface sealing
non e to slight
coded as 1
Bulk density
medium
coded as 2
Or anic matter
medium (1 - 3
coded as 2
t) (tops.)
medium (0.1-0.15 %)
coded as 2
t)
(subs.)
n.a.
coded as 9
low (<1 ppm)(< 5 ppm) coded as 1
1 avail) (tops.)
Ca rxc
very high (> 10 me
coded as 4
Mg exd (tops.)
very high (> 5 me)
coded as 4
Mg exc
(subs.)
n.a.
coded as 9
(exc) (tops.)
very high (> 0.5 me)
coded as 4
(exc) (subs.)
n.a.
coded as 9
pH (tops.)
slightly acid (6-6.6)
coded as 4
n.a.
pH (subs.)
coded as 9
CEC (tops.)
high (> 20 me)
coded as 4
BS top.
medium (50-75 %)
coded as 3
BS
su s.)
n.a.
coded as 9
Na exc) (tops.
low (< 6 %)
coded as 1
Na exc) (subs.
n.a.
coded as 9
EC tops)
non-saline
(< 2 mmhos)(coded as 1)
Ero ibility (kc)
kc 0.10
(coded as 2)
4A
Precipitation unit:
Land use/cover unit:
C2T.G5-G
IN
Linear Features
15 C
Annual temperature
Temperature of Jan.
14 C
15 C
Temperature of Feb.
Temperature of March
15 C
17 C
Temperature of April
Temperature of May
17 C
Temperature of June
17 C
Temperature of July
16 C
15 C
Temperature of Aug.
Temperature of Sept.
16 C
14 C
Temperature of Oct.
14 C
Temperature of Nov.
Temperature of Dec.
13 C
1159 m
Annual evapotranspiration
84 mm
PET of Jan.
93 mm
PET of Feb.
111 mm
PET of March
110 mm
PET of April
124 mm
PET of May
111 mm
PET of June
85 mm
PET of July
83 mm
PET of Aug.
85 mm
PET of Sept.
99 mm
PET of Oct.
87 mm
PET of Nov.
82 mm
PET of Dec.
c4-)
GILES/Para 3.2 for Users: Facilities
65
3.2.1.6 'Climatic suitability':
Function:
This option assesses the suitability of the climate of the requested area for the specific
soil/landscape situation or for an 'average' soil situation (with 100 mm moisture holding capacity).
Following 'land qualities' are considered:
- Length of the growing period (moisture conditions)
considering: precipitation at a specified reliability level, potential evapotranspiration; if
soil-specific: soil moisture holding capacity and drainage; crop characteristics for
transpiration and moisture uptake, annual or perennial crop
- Temperature
considering: altitude,
- Frost hazard
considering: altitude, topographic situation.
With the assumption of land improvement: irrigation, moisture constraints will be overcome. ---
These three environmental parameters are matched with the crop requirements to assess the
climatic suitability at the requested location for a crop. The suitability is expressed in terms of s1
('highly suitable'), s2 ('moderately suitable'), s3 ('marginally suitable'), s4 ('very marginally
suitable') or n ('not suitable'). This is the basis for the land suitability assessment.
The individual suitability ratings can be printed for testing.
Examples: Suttability at probability level of 75 % (dark pattern indicates high suitability et v.v.) with
high suitabilities (p.67) and at probability of 90 % with high
risk avoidance and therefore lower suitabilities (p.68)
Requirements:
Precipitation map ('DGPRECmn.MAP' files)
Altitude map ('DGALTmn.MAP' files)
For site-specific assessment: Soil map ('DGSOILmn.MAP'files)
Precipitation data ('aPREC.TVVY' file)
Altitude-temperature correlation ('aALT.COR' file)
Soil mapping unit composition ('aSOIL.MCP' file;
Soil type characterization ('aSOIL.TCH' file;
Crop requirements (CREQo files)
LUT/crop names ('LUT.NAM' file)
Mapping unit codes (MUC files)
Study area names (STAREA file)
GILES/Para 3.2 for Users: Facilities
66
Output:
Maps scrolling on screen, as high resolution image on EGA/VGA screen, printed on matrix
printer or plotter, or stored on disk as GILES file
\INTERM \DG1CMPmn.MAP' with 'DG1CMP.NAM')
or as ASCII file (DGOCMPmn.PRN'); or printed through screen dump utility
Area size tables on screen or printer
Individual suitability ratings on screen or matrix printer
Examples: s1 for 50 % reliability level with high
risk acceptance (left), s3 for 75 % reliability (right), see below
References:
Selection procedure: Section 3.3.5(1) (p.110)
Function: App.7.4 (p.227)
Program structure: App.8.18 (p.251)
Table 3.5
Individual Climatic Suitability Ratings (Example)
Estimated AWHC:
46 mm
Considered AWHC: 50 mm
.XXXWWXXXXXXXXXXX
XXXWWWWXX..
x....xXXXXXXx...
XXxXXXX...
XXWWWWWXXXXx......
........XWWWWXXx
XXXWWWWWWXXx..xx..
X.....xXXXWWWWWXXX
Xx..............xX
XXX. .XX.
XXXxxXXx
......xXXXXWWWWXXX
.....XXXXWWXXXx..X
XXx
XXxxXX
XxX
LGP:
XXX
X
120-216) days at requested reliability level
LQ moisture:
LQ temperate:
LQ frost:
s3
s3
67
GILES/Para 3.2 for Users: Facilities
Map 3.7
Climatic Suitability at 75 % Reliability (Example)
3
412
39x
Climatic Suitability for Sorghum in Haykoch & Butajira
GILES/Para 3.2 for Users: Facilities
68
Map 3.8
Climatic Suitability at 50 % Reliability (Example)
Climatic Suitability for Sorghum in Haykoch & Butajira
GILES/Para 3.2 for Users: Facilities
69
3.2.1.7 'Soil suitability':
Function:
This option assesses the suitability of the soil of the requested area for a specified crop.
Following 'land qualities' are considered:
- Oxygen availability
considering: drainage
- Nutrient availability or retention
considering: N, P, CEO, pH, bulk density
- Rooting conditions
considering: soil depth,nnineral fragments, consistence, bulk density
- Flood hazard
considering: flash flooding, ponding
- Sodicity / salinity:
considering: sodicity, salinity
With the assumption of land improvement: minor or major drainage measures, flood protection,
stone clearance, constraints will be partly or totally overcome.
These five environmental parameters are matched with the crop requirements to assess the soil
suitability at the requested location for a crop. The suitability is expressed in terms of s1 ('highly
suitable'), s2 (moderately suitable'), s3 (marginally suitable'), s4 ('very marginally suitable') or n
('not suitable'). This is the basis for the land suitability assessment.
The individual suitability ratings can be printed for testing purposes.
Example: "Without" (Map 3.9) and with improvement - scenarios.
It is shown that that drainage measures (Map 3.10) will increase the potential of PA 1139
by up to 310 t wheat, additional flood protection (Map 3.11) by another 320 t wheat. Major
conservation measures (Map 3.12) will not improve the situation (see p.71/72).
Requirements:
Soil map ('DGSOILmn.MAP'files)
Soil mapping unit composition ('aSOIL.MCP' file)
Soil type characterization ('aSOIL.TCH' file)
Crop requirements (CREQo files)
LUT/crop names ('LUT.NAM' file)
Mapping unit codes (MUC file)
Study area names (STAREA file)
Output:
Maps scrolling on screen, as high resolution image on EGA/VGA screen, printed on matrix
printer or plotter or stored on disk as GILES file
GILES/Para 3.2 for Users: Facilities
70
('C:\INTERM\DG2CMPmn.MAP' with 'DG2CMP.NAM')
or as ASCII file (DGOCMPmn.PRN'); or printed through screen dump utility
Area size tables on screen or printer
Individual suitability ratings on screen or printer
Examples: Without major land improvement ("without"situation): Not suitable (left); with
flood protection: S2 (right), see below
References:
Selection procedure: Section 3.3.5 (2) (p.110)
Function: App.7.5 (p.226)
Program structure: App.8.19 (p.251)
Table 3.6
Individual Soil Suitability Ratings (Example)
(without / with land improvement; here: flood protection)
without flood control:
Soil type: 14
LQ
LQ
LQ
LQ
LQ
LQ
LQ
drainage:
nitrogen:
si
phosphorus: si
nutrients:
foothold (depth):
flooding:
sodicity/salinity:
si
si
s3
si
SOIL SUITABILITY:
with flood control:
Soil type: 14
LQ
LQ
LQ
LQ
LQ
LQ
LQ
drainage:
nitrogen:
si
phosphorus: si
nutrients:
foothold (depth):
flooding:
sodicity/salinity:
SOIL SUITABILITY:
si
si
s3
s1
si
s3
GILES/Para 3.2 for Users: Facilities
71
Map 3.9 and 3.10
Soil Suitability Maps (Example)
Suitability for sorghum in Menagesha, without land improvement:
With minor drainage measures:
2
3
4
GILES/Para 3.2 for Users: Facilities
72
Map 3.11 and 3.12
Soil Suitability Maps (Example)
c) With minor drainage measures and flood protection:
ttt
0,,tttt t*8
6
At
5
,
sj,s
,
,
'tto
411
4,
.4
-.4,
d) With drainage measures, flood protection, major conservation:
1
S2
,
tttta'
11114
33
34
GILES/Para 3.2 for Users: Facilities
73
3.2.1.8 'Land suitability':
Function:
This option assesses the suitability of the land of the requested area for a specified crop, based on
the climatic and soil suitabilities. Thus, these two intermediate suitabilities have to be assessed first
and stored beforehand.
Following 'land qualities' are considered for the final land suitability assessment:
- Erosion hazard
considering: sheet erosion hazard (see Para.3.2.1.9), based on mean annual rainfall, soil
erodibility, slope length, mean maximum slope, land cover (with crop characteristic: erosion resistance); and soil depth, present gully status
- Workability
considering: slope, surface stoniness, rockiness,consistence
With the assumption of land improvement: minor or major conservation measures,
stone
clearance, constraints will be partly or totally overcome.
The climatic and soil suitabilities are combined and the two mentioned, additional environmental
parameters are then matched with the crop requirements to assess the land suitability at the requested location for a crop.
The - final - suitability is expressed in terms of Si ('highly suitable'; 80-100 % of maximum obtainable yield), S2 (moderately suitable'; 60-80 % of maximum obtainable yield), S3 ('marginally
suitable'; 40-60 % of maximum obtainable yield), S4 ('very marginally suitable'; 20-40 % of maximum obtainable yield) or N ('not suitable'; 0-20 % of maximum obtainable yield) and can be converted into potential yields (ton/ha). For 100% yield figures ('maximum obtainable yield'), see
Table A7.24 (p.239).
The individual suitability ratings can be printed for testing purposes.
Example: Suitability for wheat at 75 % LGP reliability (see p.75)
Requirements:
Climatic suitability map (DG1CMPmn.MAP' with 'DG1CMP.NAM' file)
Soil suitability map ('DG2CMPmn.MAP' with 'DG2CMP.NAM' file)
Precipitation map ('DGPRECmn.MAP' files)
Soil map ('DGSOILmn.MAP'files)
Precipitation data (aPREC.TWY' file)
Soil mapping unit composition ('aSOIL.MCP' file)
Soil type characterization ('aSOIL.TCH' file)
Crop requirements (CREQo files)
LUT/crop names ('LUT.NAM' file)
Study area names (STAREA file)
GILES/Para 3.2 for Users: Facilities
74
Output:
Maps scrolling on screen, as high resolution image on EGA/VGA screen, printed on matrix
printer or plotter, or stored on disk as GILES file
\INTERM \DG3CMPmn.MAP' with 'DG3CMP.NAM')
or as ASCII file (DGOCMPmn.PRN'); or printed through screen dump utility
Area size tables on screen or printer
Individual suitability ratings on screen or printer
Example: annual soil loss (t/ha/yr), erosion observation, erosion suitability, workability suitability, see below
References:
Selection procedure: Section 3.3.5 (p.110) and 3.3.6 (p.111)
Function: App.7.6 (p.237)
Program structure: App.8.20 (p.252)
Table 3.7
Individual Land Suitability Ratings (Example)
Precipitation mapping unit:
4
Soil mapping unit:
51
Soiltype:
41 (3.column)
ANNUAL SOIL LOSS:
25 t/ha/yr
Erosion observation:
3. class (203)
EROSION SUITABILITY:
s4
WORKABILITY SUITABILITY:
s3
GILES/Para 3.2 for Users: Facilities
'
Map 3.13
Land Suitability (Example)
75
GILES/Para 3.2 for Users: Facilities
76
3.2.1.9 'Erosion hazard':
Function:
The sheet erosion loss (expressed in tons soil loss per ha per year) can be calculated and mapped
based on environmental factors (such as rainfall erosivity, soil erodibility, slope gradient, slope
length and land use). Use is made of USLE/Wischmeier formula, specifically modified and tested
for Ethiopian conditions.
Additional attention can be paid to gully erosion hazard in the neighborhood of gullies.
Example: Sheet erosion hazard (see next page)
Requirements:
Precipitation map ('DGPRECmn.MAP' files)
Soil map ('DGSOILmn.MAP'files)
Soil mapping unit composition ('aSOIL.MCP' file)
Soil type characterization ('aSOIL.TCH' file)
Study area names (STAR EA file)
Precipitation data ('aPREC.TWY' file)
Output:
Maps scrolling on screen, as high resolution image on EGA/VGA screen, printed on matrix
printer or plotter, or stored on disk as GILES file
\INTERM \DGpCMPmn.MAP' with 'DGpCMP.NAM')
or as ASCII file (DGOCMPmn.PRN'); or printed through screen dump utility
Area size tables on screen or printer
References:
Function: App.7.1 (p.211)
Program structure: App.8.15 (p.248)
77
GILES/Para 3.2 for Users: Facilities
Map 3.14
Erosion Hazard Map (Example)
Sheet Erosion Hazard in Haykoch & Butajira (ton soil loss/ha/yr)
GILES/Para 3.2 for Users: Facilities
78
3.2.1.10 'Conservation based land use recommendations':
Function:
Recommendation for soil conservation measures and appropriate land use (major kinds of land
use) are defined on the basis of ecological conditions, such as erosion hazard (see 3.2.1.9), slope,
soil depth, erosion status, flooding, vertic properties.
Example: see next page
Requirements:
Precipitation map ('DGPRECmn.MAP' files)
Soil map ('DGSOILmn.MAP'files)
Soil mapping unit composition ('aSOIL.MCP' file)
Soil type characterization ('aSOIL.TCH' file)
Precipitation data ('aPREC.TWY' file)
Study area names (STAREA file)
Output:
Maps scrolling on screen, as high resolution image on EGA/VGA screen, printed on matrix
printer or plotter, or stored on disk as GILES file
\INTERM \DGpCMPmn.MAP' with 'DGpCMP.NAM')
or as ASCII file (DGOCMPmn.PRN'); or printed through screen dunnp utility
Area size tables on screen or printer
References:
Function: App.7.2 (p.215)
Program structure: App.8.16 (p.249)
GILES/Para 3.2 for Users: Facilities
79
Map 3.15
Conservation Based Land Use Recommendations (Example)
(For description of units, see Table A7.2; p.215)
GILES/Para 3.2 for Users: Facilities
80
3.2.1.11 'Length of growing period':
Function:
Moisture conditions of the location are expressed by the length of the growing period. The 'LGP' is
calculated for a number of years (e.g. 20 years, or less)
either: for a specified crop, or
for an 'average' crop; and
either: for the specific soil/landscape situation, or
for an 'average' soil situation (with 100 mm AWHC).
The LGP calculation is based on a decadal soil moisture balance considering actual and effective
precipitation , potential and actual evapotranspiration, soil moisture holding capacity, drainage,
and if crop-specific: crop characteristics for transpiration and moisture uptake, annual or perennial
crop. Decadal matching of the soil moisture with the crop requirement gives decadal declaration
as:
Table 3.8
Definition
dry
moist
humid
wet
LGP Considerations
no LGP
strong constraints, but accepted as LGP
optimum LGP conditions
wetness constraints, but accepted as LGP
Chart Lotus
x
X
W
The LGP assessment is calculated out of the LGP of the individual years, with consideration of the
specified reliability level.
The quantitative moisture balance per year and the growing period charts can be printed for testing purposes or transferred into spreadsheets (e.g. Lotus 1-2-3) for further processing or to
graphic packages (e.g. 'Boeing Graph') for 3D display.
Example: Non-soil specific LGP for an average crop at 75 % reliability level (see p. 82)
0
1
2
3
GILES/Para 3.2 for Users: Facilities
81
Requirements:
Precipitation map ('DGPRECmn.MAP' files)
Altitude map ('DGALTmn.MAP' files)
For site-specific assessment: Soil map ('DGSOILmn.MAP'files)
Precipitation data ('aPREC.TWY' file)
Altitude - PET correlation ('aALT.COR' file)
For site-specific assessment: Soil mapping unit composition ('aSOIL.MCP' file;
For site-specific assessment: Soil type characterization ('aSOIL.TCH' file)
For crop-specific assessment: Crop requirements (CREQo files)
For crop-specific assessment: LUT/crop names('LUT.NAM'file)
Mapping unit codes (MUC files)
Study area names (STAREA file)
Output:
Maps scrolling on screen, as high resolution image on EGA/VGA screen, printed on matrix
printer or plotter, or stored on disk as GILES file
('C:\INTERM \DGpCMPmn.MAP' with 'DGpCMP.NAM')
or as ASCII file (DGOCMPmn.PRN'); or printed through screen dump utility
Area size tables on screen or printer
Growing period charts on screen, printer or on disk as ASCII file ('C:\INTERM\GIL2LOTa.PRN')
for further processing in Lotus or for 3D display
Example for 20 years, see Table 3.9 (p.83)
Soil moisture balance dynamic on screen or printer
Example for 36 decades of 1.year, see Table 3.10 (p.84)
References:
Function: App.7.3 (p.216)
Program structure: App.8.17 (p.249)
GILES/Para 3.2 for Users: Facilities
82
Map 3.15
LGP Map (Example)
[TN%
9
il
Ir
Length of mean growing period in Yerer & Kereyu
GILES/Para 3.2 for Users: Facilities
83
Table 3.9
Growing Period Charts (Example)
Growing Period for Consecutive Years
.=dry, x=moist (30-60%rel.SM), X=humid (60-99%rel.SM),W=wet (100%)
Assumed AWHC:
100 mm
LGP for root.depth: 100 cm
Depletion ability: 50 %
Transpiration: .75
JanFebMarAprMayJunJulAugSepOctNovDec
XXx.XXx
.XXXXx..xXXXWXWX
XXXWWXXx
....xXXXXXXXXXxxX
XXx
.XXXXxxXXXXXXXXXX
XWXXx..X.
...x..X..xXXx.xXXX
XXXXx
......XXWXWXXXx..XXWWWWWXWWXXx
xx..xx..xXXXXXXXX
XXXXXXXXXx
..XXXx..xXx..XWXXW
XXXXx
xXXXX
XXXx
..... XX.XXx.Xx
XXXXx
. ..... x.xXXXWWXX
Mean Kremt:
at given reliability:
Belg Krmt
70
50
110
140
40
90
70
40
20
30
209 days
165 days
210
260
280
310
160
130
260
180
160
140
End
33
34
32
35
30
30
34
31
29
30
GILES/Para 3.2 for Users: Facilities
84
Table 3.10
Soil Moisture Balance Dynamic (Example)
Yr Dec Soil Topsoil
c
Prec Prec
moisturemoisture inf 10d 10d
beg end beg end
eff
mm mm mm mm
mm mm
1
1
1
1
1
2
1
1
1
5
6
3
4
1
1
7
8
9
1
1
1
1
1
1
1
1
1
1
10
11
12
13
14
15
16
17
18
19
1
1
1
1
20
21
22
23
0
0
0
0
0
0
0
0
0
0
4
0
4
0
4
2
0
0
42
18
42
18
0
0
0
0
0
2
0
0
0
0
58
37
35
58
37
35
74
74
100
100
100
100
100
100
100
100
100
0
0
0
0
2
0
20
0
0
0
0
0
20
20
20
20
20
20
20
20
0
0
0
0
4
0
2
0
20
0
0
0
0
0
20
20
20
20
20
20
20
20
20
0.8
0.8
0.8
0.8
0.8
0.8
0.8
0.8
0.8
0.8
0.8
0.8
0.8
0.8
0.8
0.8
0.8
0.8
0.8
0.8
0.8
0.8
0.8
0
0
0
0
0
0
0
0
26
21
0
0
26
21
4
3
76
61
2
0
0
7
8
1
0
0
6
6
94
75
8
6
24
74
79
77
62
42
93
19
59
63
62
50
34
74
GW kPET kPET PET
eff crp 10d
mm
0
0
0
0
0
0
0
0
0
0
0
0
0
0
0
0
0
0
0
0
0
0
0
0.6
0.6
0.6
0.6
0.6
0.6
0.6
0.6
0.6
0.8
0.6
0.6
0.6
0.6
0.6
1.0
0.8
0.8
1.0
1.0
1.0
1.0
1.0
0.8
0.8
0.8
0.8
0.8
0.8
0.8
0.8
0.8
0.8
0.8
0.8
0.8
0.8
0.8
0.8
0.8
0.8
0.8
0.8
0.8
0.8
0.8
mm
36.4
36.9
36.9
36.9
36.9
39.1
41.4
43.6
42.6
41.7
40.7
40.5
40.2
40.0
38.3
36.5
34.8
33.5
30.9
31.0
31.2
31.3
31.5
PET
10d
eff
mm
27.3
16.6
16.6
16.6
16.6
17.6
18.6
19.6
19.2
25.0
18.3
18.2
18.1
18.0
17.2
27.4
20.9
20.1
24.2
23.2
23.3
23.4
23.5
Soil LGP
moist.
top
%
%
0
0
0
0
4
0
2
0
0
0
.
.
.
0 x
21
.
0
.
11
.
42 100 X
18
0 x
0
0
0
0
0
0
0
0
0
0 X
.
.
.
.
58 100 X
37
35
74
100
100
100
100
100
0 X
0 X
100
100
100
100
100
100
W
W
W
W
W
W
GILES/Para 3.2 for Users: Facilities
85
3.2.1.12 'Database':
Functions:
This option is for input, change, display or printout of all data files of the 'general data' (DBMS,
non-spatial data, i.e. all data except maps). (The spatial data (maps) can be entered and changed
through option 'Base map entry').
Output and modifications of data files can be handled in several versions. It is possible to
- declare a new data file
- change/modify the size (dimensions) of an existing data file
- import a data file (one column) from Lotus file
(C:\INTERM \LOT2G1Lc.DIF, numbered between A and E)
- change/modify data
- see the data on screen
- outprint the data
- transfer the data set to a Lotus file
(C:\INTERM \GIL2LOTc.DIF, numbered between A and E)
Before entering or importing data into a file, it has to be first declared (1.option) and the dimensions have to be defined (2.option).
Requirements:
Concerned file(s)
Study area names (STAREA file)
Output:
Storage on disk
References:
Selection procedure: Section 3.3.22-28 (p.134-142)
Data structure: Section 4.2 (p.150)
Program structure: App.8.8 (p.244)
Out of the 14 data sets which can be accessed through 'Database' option, 3 shall be discussed in
more detail:
GILES/Para 3.2 for Users: Facilities
86
Suboption a: 'Crop requirements'
Functions:
This DBMS option is for input, change, display or printout of the 40 crop requirements and characteristics which are handled by GILES for the crop suitability assessments either per crop or per
land quality/ requirement:
Minimum temperature requirements )
Maximum temperature requirements ) for Si / S2 / S3 / S4
Minimum LGP requirements
)
suitability classes
Maximum LGP requirements
Increase for minimum LGP requirement with altitude
Increase for maximum LGP requirement with altitude
Rooting depth for moisture uptake
Evapotranspiration rate
Ability to uptake not readily available soil moisture
Average uptake of available water holding capacity
Annual / perennial plant
Frost sensitivity
Drainage sensitivity
Ponding and flooding sensitivity
Requirements on N uptake
Requirements on P uptake
Requirements on K uptake/fertilizer response
Required rooting depth
Germination requirement
Flash flooding sensitivity
Sodicity sensitivity
Residual moisture plant
Requirements for workability
Salinity sensitivity
Resistance to erosion
Requirements:
Crop requirements (CREQo files)
LUT/Crop names ('LUT.NAM' file)
Study area names (STAREA file)
Output:
Storage on disk (CREO files)
Listing on screen or printer
Example: wheat (see p.87); drainage (see p.88)
References:
Selection procedure: Section 3.3.12 (3) (p.119)
Data structu. re: Section 4.2.20 (p.182)
Program structure: App.8.7 (p.244)
GILES/Para 3.2 for Users: Facilities
87
Table 3.11
Crop Requirements per Crop (Example)
Crop Requirements for Maize at medium input level:
T min
(1-40 C)
s1
s2
s3
s4
T max
(1-40 C)
LGP max
(1-365
(1-365
days)
days)
14
s4
12
26
30
34
38
s1
140
s2
s3
120
100
si
s2
s3
LGP min
16
15
s4
90
s2
s3
265
310
355
365
si
s4
LGP min regression (0-20 days/100m)
10
LGP max regression (0-20 days/100m)
8
Rooting depth for moist.uptake (50/100/150 cm)
150
kc (evapotranspiration)
(1-150 %)
70
Not readily available soil water (1-100 %)
40
AWHC uptake
(1:100 mm/2:150 mm)
2
Perennial plant
Frost sensitivity (1:to1/2:mod.to1/3:mod.sens/4:sens)
3
Drainage sensitivity (1:to1/2:mod.to1/3:mod.sens/4:sens)
3
Ponding/flooding sensit. (1:to1/2:mod.to1/3:mod.sens/4:sens)4
N requirements (1:v.low/2:low/3:med./4:high/5:v.high)
4
4
4
Rooting requirements
(1:>0/ 2:>10/ 3:>25/ 4:>50/ 5:>100/ 6:>150 cm)
si
s2
s3
s4
Germination requirement (1:low/2:medium/3:high)
Flash flooding sensitivity (1:low/2:medium/3:high)
Sodicity sensitivity (1:low/2:medium/3:high)
Residual moisture plant
Workability requirement (1:low/2:medium/3:high)
Salinity sensitivity (1:to1/2:mod.to1/3:mod.sens/4:sens)
Erosion resistance (1-100 %)
5
4
4
3
2
2
3
2
3
10
GILES/Para 3.2 for Users: Facilities
Table 3.12
Crop Requirements per Land Quality (Example)
Crop requirements of Frost Sensitivity:
Sorghum
sensitive
Maize
moderately
Rice
sensitive
Wheat
moderately
Barley
tolerant
Teff
moderately
Oats
tolerant
Field Peas
moderately
Haricot Beans
sensitive
Horse Beans
tolerant
Chick Peas
moderately
Lentils
moderately
Vetch
moderately
Soybeans
moderately
Coffee
sensitive
Tea
moderately
Banana
sensitive
Citrus
sensitive
Sugarcane
sensitive
Pepper
sensitive
Shallot
moderately
Tomato
sensitive
Irish Potato
moderately
Sweet Potato
sensitive
Cabbage
tolerant
Pineapple
sensitive
Sisal
sensitive
Niger seed
sensitive
Sesame
sensitive
Sunflower
moderately
Safflower
tolerant
Flax (linseed)
tolerant
Tobacco
sensitive
sensitive
Cassava
Cotton
sensitive
Groundnut
sensitive
moderately
Pearl Millet
Finger Millet
moderately
sensitive
Grape
tolerant
Ensete
sensitive
Cow Pea
Maize (short LGP variety)moderately
sensitive
tolerant
sensitive
tolerant
sensitive
tolerant
tolerant
sensitive
sensitive
tolerant
tolerant
sensitive
sensitive
sensitive
sensitive
GILES/Para 3.2 for Users: Facilities
89
Suboption b: 'Study areas'
Functions:
Each study area is defined by following parameters:
Name
- Working abbreviation (3 or 4 letters)
- Scale of data entry
- Number of soil types
- Individual sheets with
-- names
-- working abbreviations (3 or 4 letters)
-- relative position of sheet to previous sheet
N,S,W,E coordinates (latitude and longitude)
- Additional maps (in addition to soil, altitude, precipitation, land use/cover, administration,
agroecological ng zone)
Requirements:
Study area names (STAREA file)
Output:
Storage on disk (CREQ files)
Listing on screen or printer
References:
Selection procedure: Section 3.3.15 (p.122)
Data structure: Section 4.2.19 (p.180)
Suboption c: 'Precipitation data'
Functions:
It allows the entry of (monthly or decadal) precipitation data through keyboard or from Lotus files
(LOT2GILa.DIF), their correction and retrieval, and their processing and transfer into GILES internal
precipitation data files (áPREC.TWY) for GILES land evaluation processes.
GILES/Para 3.2 for Users: Facilities
90
Table 3.13
Calculation of Precipftatbri Values (E(arnple)
*******t*****mmoxmmmtmmitwmwmmttmxwmmmm*
Station°
Motta
1
t
LOO
s
Et
1
2
3
4
5
6
7
8
12.9
25.2
26.2
36.3
33.2
68.5
110.7
81.4
23.3
69.0
28.3
3.9
358.3
313.9
11
12
4.1
10
EM
12.0
23.0
44.1
47.0
86.5
119.7
157.5
69.8
24.6
9
n
J
6
7
7
6
t
s
D
0
0
DE
El
16.8
34.5
44.1
47.0
86.5
12.1
23.0
26.2
36.3
33.2
68.5
6119.7
7 358.3 110.7
8313.9
8157.5
8
8
7
93.0
28.1
4.8
CID
81.4
23,3
63.8
28.7
3.8
0
EE
LE
5
6.9
4
24.2
35.3
35.9
79.7
11.5
25.0
19.5
35.0
44.1
7
7
6
6109.5
10.7
35.5
35.3
35.9
79.7
53.8 109.5
341.8
290.3
158.5
108.0
57.2
64.0
11.1
57.6
11.6
6
CCV
CCV
'0
0
EV
7 541.8 106.6
8290,3 70.1
8158.5 22.9
6
87.9
74.9
7
p
CS
CS
0
8.2
10.8
22.7
19.5
35.0
44.1
53.8
106.6
70.1
22.9
72.1
56.7
6.9
0.29
0,33
0.00
0.00
0.00
0.00
0.00
0.00
0.00
0.25
0.13
0.14
167
103
101
55
55
97
97
55
55
49
49
31
31
24
24
14
14
85
67
99
89
71
62
64
1280
1239
#M*W4M**WW4t$###WMM**4#M*#****$,Mt#MT#M*1:4*M***341
Station
LOD
E
E
2
3
4
5
6
7
8
9
10
11
12
E
ME
MD
1
Felege Berhan
2
10.0
7.6
15.5
28.9
24.9
38.8
19.2
55.5
29.3
81.5
101.5
35.4
9.9
6.3
26.3
54.2
87.2
140.8
315.7
251.4
144.1
45.5
13.7
5.4
4
4
3
3
3
E
0
DE
ED
10.1
31.1
26.3
54.2
87.2
10.5
39.2
24.9
38.8
19.2
55.5
29.3
81.5
71.3
28.4
9.9
6.0
3140.8
4315.7
5251.4
5180.1
4
56.9
13.7
3
8.2
5
CM
n
S
-,0
CS
3
2
3
3
3
0
0
EM
rm
an
Et
8.7
23.3
37.0
40.8
78.7
17.6
31.5
63.4
25.6
13.9
14.7
41.2
37.0
40.8
78.7
3135.1
4408.3
5248.9
48.5
28.0
60.5
168.9 163.6
4
4
69.4
25.2
2
10.4
4
cCV
CS
CE
0
0
19.1 0.25
41.6 0.50
63.4 0.00
25.6 0.00
13.9
48.5
28.0
60.5
cCV
0.00
0.00
0.00
0.00
135.1
408.3
248.9
211.1 115.0 0.20
31.7 0.20
38.5
73.1
14.2 0.00
14.0 28.0
8.1 0.33
9.7
13.9
202
130
135
171
63
18
101
36
36
171
63
18
7
7
24
97
24
55
43
56
51
93
58
54
'1331
1255
##X*;43MtEMMMWW*MS#M4******4**t********#M#**$M$414##
.Station
ton
n
S
tE
2
2.3
5.2
3
45.7
L
.k11
1
Finote Salan
3
q
D
1M
2.9
8.2
26.1
S0.4
9
9
9
S
E
CS
0
0
Et
Et
4.1
11.7
45.7
38.7
2.7
8.8
26.1
30.4
3fl
4
CE
E
S
0
DO.I
4
5
4
9
9
99
CS
CE
0
0
LE
CCV
CCV
k
k
0
0
EM
Et
DI
1.8
6.8
35.9
36.2
2.3
8.7
20.1
28.5
2.8
14.0
35.9
2.2 Op
12,8
79
9.0 0.J6
20.1 0.00
1z8
64
36.2
28.5 0.00_7
IN 34.32 IN
13236.2
11201.0
MI
Q2,3
60.5 236.2
P6
42.,6
86 "
3452A
.q.5
%
r
56
91
GILES/Para 3.2 for Users: Facilities
Table 3.14
Generation of Precipitation Data and their Calculation (Example
_
90%
tE
years mean sd P mean
sd
P
mean
sd
with w/o-- --0- 00
0
-0
prec.
expected <mmcalculatedmm)))
exo.rainf.at reliab.of
80%
75% -66%- 50% 25%
Et
tE
DE
Et
-0 - -
Et
Et
rt
%
Et
tr
El
%
VALUES OF PMU1
MONTHLY
17
16 26; 17.2
15.020
169 31: 43
15 13; 42.8
18.216
0
0
0
24
73
181
0
24
27
_32
38
49
61
69
73
78
86
101
193
7189
22
21 86.5
22.8
4
37
44
47
52
60
75
199
1161
21
21
63.5
22.3
1
83
93
97
102
112
128
199
11115
23
21113.8
26.3
1
83
93
97
102
112
128
195
51115
23
21111.7
29.2
3
;
189
208
215
226
245
277
200
01250
47
01243.5
59.6
0
1
152
167
172
181
196
221
200
01200
37
01200.3
46.7
0
:
83
93
97
102
112
128
1
198
21115
23
21113.2
27.4
61
69
73
78
86
101
1
197
3189
22
2186.9
8
14
16
20
, 26
193
71
32
19
5;
4
12
30
70
159 41;
15
16 17;
0
ME
143 57;
391
170
ANNUAL VALUES
1
PNU
OF
12.3
14.9
36.2
22.7
83.5
27.4
63.2
22.6
113.2
27.5
108.9
33.7
243.5
59.6
200.3
46.7
11
112.1
29.3
20.5
21
85.6
22.9
31.8
20.7
4
30.7
21.1
15.9
18.0 211
12.7
17.2
1
1
;
1
1
1
1
summation through the years
757
877
925 1028 1216 1598
1102.1 107.2
1102.1 107.2
01
summation through the months
196
1127.1
1102.2
*****t***txxml:mmmu***3:***t*tmmt******************t*m*mmm*
exp.rainf.at reliab.of
90%
Et
80%
75%
66%
50%
25%
Et
EL
la
ME
DM
liTELY
13
20
23
49
VALUES
years mean sd P
mean
sd
P
mean
sd
with w/o
0
00
0
0
0
prec.
expected (mmcalculated))»m»
El
en
%
Et
%
17.2
7
EL
EL
OF PMO2
34
481
187 131
40
20
5139.2
54
62
761
189 111 66
20
51 65.6
-
5
51
193
17
9'
27
Et
71
89
IC
1
7
10
1
GILES/Para 3.2 for Users: Facilities
92
3.2.1.13 'Entry of base map':
Function:
This is the option to enter maps ('base maps') in digitized form into the computer. In particular, it is
possible to:
- enter mapping units,
- display maps on screen,
- highlight uncovered (blank) areas (grid cells),
print uncovered (blank) areas (grid cells),
- correct single locations (single grid cell),
enter data (mapping units) by latitude/longitude,
fill all blank areas in a specified window with a mapping unit,
and to store them as map files.
Additionally, it is possible to measure areal units (areas) or linear units (lines).
Requirements:
Mapping unit codes (MUC file)
Study area names (STAREA file)
Original map
Recommended: 29-112-transparent overlay
Output:
Storage on disk (MAP files)
Printed list of blank pixels
References:
Selection procedure: Section 3.3.18 (3) (p.126) and 3.3.17 (p.125)
Program structure: App.8.5 (p.243)
GILES/Para 3.2 for Users: Facilities
93
3.2.1.14 'Systematic change of base maps':
Functions:
This module serves as a utility to modify base maps, to:
- overlay and check two maps, if they are identical in covering the same total area (with automatic
assignment on request, 'cutting')
- replace ('substitute') mapping units (not more than 700) ) to form a modified / new
- aggregate mapping units (not more than 700)
)
'base map'
- shift (move) parts of a map
- define corridors along roads (only for 'LIN' maps)
- compare two mapping units of two different maps for their identity,
with eventually new assignment
Example: Corridor map (see next page)
Requirements:
Maps (MAP files)
Mapping unit codes (MUC files)
Study area names (STAREA file)
Output:
Maps (MAP files)
Print list of pixels showing discrepancies
References:
Selection procedure: Section 3.3.18 (6) (p.127)
Program structure: App.8.6 (p.243)
GILES/Para 3.2 for Users: Facilities
94
Map 3.15
Overlay of Base Maps (Example)
Roads and 'Corridors' in Menagesha
GILES/Para 3.2 for Users: Facilities
95
3.2.1.15 'Chaining of various selections':
Functions:
Chaining of following GILES procedures can be stored in a queue and processed one after the
other:
- climatic suitability assessment
- soil suitability assessment
- land suitability assessment
- nnap overlay of 2 nnaps
- DOS copy operation
Crop, input level, land improvement(s) for suitability assessments, specification of source and target for file copying, map specification for map overlays will be entered for each chained procedure.
All processes will be made for the entire study area; definition of windows is not possible.
Requirements:
as requested by the individual processes
Study area names (STAREA file)
Output:
Queue (C:\INTERM \CONTFILE.DAT' file), requesting the individual processes
References:
Selection procedure: Section 3.3.14 (p.121)
Program structure: App.8.4 (p.242)
GILES/Para 3.2 for Users: Facilities
96
3.2.1.16 'File operation':
Functions:
With this option, it is possible to:
- copy files,
- erase files,
- show the content of an ASCII file,
- list directories.
Thus, DOS commands are supported.
Requirements:
Concerned files
Study area names (STAREA file)
Output:
(DOS processing)
References:
Program structure: App.8.3 (p.242)
3.2.1.17 'Shell to DOS':
Function:
Shelling to DOS is possible. Return to GILES is made by typing 'EXIT' at the DOS prompt.
It is not recommended to load resident programs such as 'Inset' in shell mode.
3.2.1.18 'Exit to DOS':
Function:
By this option, GILES will be left and return is made to the operating system.
97
GILES/Para 3.2 for Users: Facilities
3.2.2 Specification of retrieved area
The retrieval of maps can be defined for a specified area:
- for the entire study area, or:
- for one, individual (entire) map sheet
(Sheet is one part of the study area defined in the map index (see Section 3.3.15 (p.121) and
App.10 (p.259), or:
- for one run (quarter) of one sheet
(Run is a vertical strip covering one quarter of one map sheet), or:
- for a part of one run ('window')
('Window' is a rectangular part of a run defined by its N, S, W, E margin;
see 'How to define a window'', Section 3.3.7; p.112).
Run
..Study area
Sheet...
The definition will be set in 2 - 4 steps (study area/sheet/ run/window selection). As smaller the
requested area is, as more menus (selection steps) have to be passed:
Table 3.15
Area Retrieval
> Study
Area
Total area
Sheet a
Sheet b
Sheet c
Sheet d
Sheet e
Total run
Run 1
Run 2
Run 3
Run 4
---Window-->
(S/N/W/E)
GILES/Para 3.2 for Users: Facilities
98
3.2.3 Specification of output
Output of maps and tables can be:
display on screen: - scrolling mode (with fonts/letters)
- high resolution image mode
- hardcopy on paper: - matrix printer (through GILES)
printer (through screen dump utility)
- plotter (through GILES)
storage on disk: - GILES format (extension MAP)
- ASCII format (extension PRN)
For display on CGA or MDA screen, only scrolling of the grid cells at the monitor in
'scrolling mode' (showing letters/fonts) is possible (raster map). Fonts can be changed to give a
gradual shading pattern (either only for the requested map or permanently; see Section 3.3.11;
p.118 and App.9, p.255).
High resolution images display either the entire area or one map sheet in up to 16 colors.
This is only possible in EGA, VGA or PGA mode.
Zooming during or after display is not possible. If zooming is requested, it has to be set
through window definition (see Section 3.2.2. p.97).
Through GILES it is possible to print large size maps for all map version either on printer
or plotter. A matrix printer (Epson FX, EX, LX, RX, MX, LQ or compatible) prints raster maps showing a font for each grid cell. Fonts can be changed (see above).
If a high resolution display is installed, it is recommended to use screen dump and edit
utility software for printout of small size text nnaps. Good experience is made with 'Inset' (by
MicroPro), somehow less, but still satisfying results can be made with 'Grab' (by WordPerfect),
'Egaprint' (public domain) or similar packages (see 'How to dump a screen', Section 3.3.31;
p.147).
The advantages of matrix printers for map print are high speed, low costs (paper, ribbon),
and easy handling. The disadvantages are the lower quality, the relatively small width of the paper
(at 132 column paper print width is 28 cm) making it necessary to stick the various runs together
manually, and the limited range of scale: Only 9 different outprint scales are supported in the
present version:
GILES/Para 3.2 for Users: Facilities
99
Table 3.16
Outprint Scales on Matrix Printer
Ratio
outprint scale /
map entry scale
E.g.
input of
1:50,000
1:106,000
results in output scale of
1.00
1: 50,000
1: 59,000
1: 75,000
1.18
1.50
1.70
2.00
2.36
2.50
3.00
3.92
1:85,000
1:100,000
1:118,000
1:125,000
1:150,000
1:196,000
1:106,000
1:125,000
1:159,000
1:180,000
1:212,000
1:250,000
1:265,000
1:318,000
1:415,500
*
*
Plotting of maps by plotter requires more care for handling, is more expensive and slower,
but quality is bet-ter, has more manipulation options and can produce colored maps.
At HP or Roland plotter, outplot maps can have a scale of:
Table 3.17
Outprint Scales on Plotter
Ratio
outprint scale /
map entry scale
(0.50)
0.70
10.00
(20.00)
E.g.
input of
1:50,000
1:106,000
results in output scale of
(possible, but not recommended)
1: 35,000
1:
74,000
1:500,000
1:1,060,000
(possible, but not recommended)
At map plotting, it is possible to overlay the plot of various maps by leaving the paper in
the plotter and "run" the next map.
GILES/Para 3.2 for Users: Facilities
100
Labels can be plotted with full length, with short form or can be omitted. They are
automatically centered, but individual character placement can be selected by omitting and then
plotting the labels individually at the requested spot. Label size is adjusted to the scale within a certain range.
Tables can be printed with any kind of printer. It is possible to print the legend at the end
of the map or only the legend with the area sizes (without map).
No direct support is given to manipulate tables or to produce graphs or charts out of
numeric data, but data can be transformed in to specialized spreadsheet or graphic packages for
manipulation and presentation.
Processed maps and tables can be stored on computer storage media, i.e. disks. The
only accepted drive/subdirectory specification for storing is C:\INTERM\.... From there the configured GILES files (nnaps: 'DGaCMPmn,MAP' with 'DGpCMP.NAM' files) or ASCII files (maps:
'DGOCMPmn.PRN' files or tables: 'GIL2LOTc.PRN' files for processing in Lotus) can be copied to
other disks or subdirectories using GILES utilities or DOS commands. DIF map files can be translated from ASCII files using Lotus environment (see Section 3.3.28 (3); p.143).
ETS0
O
TETI
OeTT
Cell
o
4-)
ca
(0
-1
TOo
251,0
OPP()
BOTO
60;0
914,0
6:;70
PTO
2060
T060
0
PTIO
TvP0
2TTO
:CPO
()CVO
121
'2P0
22P0
GILES/Para 3.2 for Users: Facilities
102
Mar 3.20
'Colored hatched Map' (Example)
GILES/Para 3.2 for Users: Facilities
103
3.2.4 Setup of hardware
The hardware is set up automatically (selection of screen and graphic adapter). Software
and 'general data' must be installed in drive C:, subdirectory ' \LANDEVV.
The default drive for maps is C:, subdirectory \aDG \ (where a is the working abbreviation
of the area), but can be modified through menu. If a virtual disk (e.g. D:) with at least 250 kB is installed, retrieval can be accelerated by copying the map(s) (MAP files) to the virtual drive and to
retrieve from there (see 'How to speed up map retrieval', Section 3.3.30; p.145).
3.2.5 Transfer
Transfer to and from other software packages is made in following formats:
Boeing Graph 1
ASCII
4
WK1
(or DIF)
Lotus
DIF
2
GILES
ASCII
dBase
3
ASCII
Recommended is the process through Lotus 1-2-3 if available.
1
or similar 3D graphic packages
or similar spreadsheet packages
3 or similar database packages
4
with extension .DAT
2
-o
105
GILES/Para 3.3 for Users: How to ...
3.3 HOW TO ...
In this chapter various procedures are described step-by-step ('menu-by-menu') in their
default versions. The selected options can be modified, e.g. instead of retrieving the 'whole study
area' it is possible to ask only for one sheet, or can be combined. Various other output forms, not
listed here, can be selected. Following functions are explained:
Table 3.18
Sample Procedures
Requested Procedure
Additional map, definition of
Aggregation of units through Lotus 1-2-3
Aggregation of units for retrieval or
further processing in GILES
Area sizes, calculation of
Base map, complete
Base map, parametric
Boundary, check of project area
Chaining of processes
Crop, adding
Crop requirements, change/entry of
Crosstabulation
'Cutting'
Exit
Font (outprint symbol), change of
Import of Lotus 1-2-3 file into GILES
Import of precipitation data from Lotus 1-2-3
'Inset', use of
Map, adding
Map, preparation for entry
Map, entry of
Mapping unit, adding
Mapping units, entry of
Mapping units, change at base maps
Mapping units, change to form new base maps
New area, start with
Overlay of complete map on 'selected areas'
Parametric map
Plotting
Screen dump (through 'Inset')
Screen dump (within GILES)
Speed up of map retrieval
Start
Start, first time
Stop of program execution
Study area, adding
Suitability, climatic, for a crop
Section
Page
3.3.16
124
3.3.23
134
3.3.23 or: 134
5
3.3.13
3.3.3
3.3.4
3.3.18
3.3.14
3.3.12
3.3.12
3.3.9
3.3.18
3.3.2
3.3.11
3.3.22
3.3.28
3.3.31
3.3.16
3.3.17
3.3.18
3.3.32
3.3.18
3.3.19
3.3.20
3.3.15
3.3.9
3.3.4
3.3.10
3.3.31
3.3.33
3.3.30
3.3.1
3.3.21
3.3.29
3.3.15
3.3.5
(1-7)
(6)
120
108
109
128
121
119
(3) 119
115
(5) 128
(2)
107
118
133
142
146
124
125
126
147
126
129
130
122
115
109
117
146
149
145
107
132
144
122
(1) 110
GILES/Para 3.3 for Users: How to
...
Suitability, soil, for a crop
Suitability, land, for a crop
Suitability for a crop mix
Transfer of area sizes into dBase
Transfer of area sizes into Lotus 1-2-3
Transfer of crosstabulation into dBase
Transfer of crosstabulation into Lotus 1-2-3
Transfer of growing period charts into Lotus
Transfer of mapping unit codes into Lotus 1-2-3
Transfer of maps into ASCII code
Transfer of maps into DIF code
Transfer of maps into Lotus 1-2-3
Transfer of print files into Lotus files
Window, regular
Window, irregular
3D display/DTM, retrieval of
106
3.3.5
(2) 110
3.3.5
110
3.3.6
111
3.3.25
137
3.3.24
136
3.3.25
137
3.3.24
136
3.3.27
140
3.3.23 (1) 134
3.3.26 (1) 139
3.3.26(1-3)139
3.3.26(1+2)139
3.3.23 (2) 134
3.3.7
112
113
3.3.8
139
3.3.26
GILES/Para 3.3 for Users: How to ...
107
3.3.1 How to Start
Make sure the C> prompt is on screen indicating that the default drive is C: at root directory level.
Type
GILES <Enter>
and the first GILES display will appear on screen prompting for the Main Menu.
If problems occur during execution and Quickbasic version 4.0 is installed, GILES has to be started
by:
\QUICKB4\013 /RUN \LANDEV\SELE1
3.3.2 How to Exit GILES
Press F10 function key
(unless you are already in the Main Menu)
Main Menu: Select 'out (Exit to system)' and return to DOS
GILES/Para 3.3 for Users: How to ...
3.3.3 How to Retrieve a Complete Base Map
'Complete' means non-aggregating, without (map) generalization.
Select area and map
1.1) Main Menu: Select 'Base map (complete/selective/aggregating/parametric)'
1.2) Select study area
1.3) Select 'Whole study area'
1.4) Accept 'C:<--- default'
1.5) Accept the default subdirectory
1.6) Select map
1.7) Select 'Complete map'
Select output form
2.1) Select 'Map/data on screen only' for display
2.2) With high resolution mode:
Select 'High resolution image'
Select: 'No'
Select: 'Right column' and <Enter>
108
109
GILES/Para 3.3 for Users: How to ...
3.3.4 How to Retrieve a Parametric Map
A parameter is a land characteristic read out of the
altitude
(e.g.temperature range) or precipitation map, or a structural characteristic (e.g.population density,
soil (e.g.drainage,
slope),
access situation) read out of the administrative map through translation tables. It is possible to
retrieve a specific map of one characteristic:
Select area and map
1.1) Main Menu: Select 'Base map (connplete/selective/aggregating/parametric)'
1.2) Select study area
1.3) Select 'Whole study area'
1.4) Accept 'C: <--- default'
1.5) Accept the default subdirectory
1.6) Select 'Parametric map'
1.7) Select 'Complete map'
1.8) Select considered parameter ('Land/structural characteristic', e.g.drainage)
Select output form
2.1) Select 'Map/data on screen only' for display
2.2) With high resolution mode:
Select 'High resolution image'
Select: 'No'
Select: 'Right column' and <Enter>
GILES/Para 3.3 for Users: How to
...
110
3.3.5 How to Assess the Land Suitability for a Crop
Assess the suitability of the climate for the requested crop
1.1) Main Menu: Select 'Climatic suitability'
1.2) Select study area
1.3) Select 'Whole study area'
1.4) Accept 'C:<--- default'
1.5) Accept the default subdirectory
1.6) Select '75 %'
1.7) Select 'With consideration of occurring soils'
1.8) Select crop and input level
1.9) Select 'No'
1.10) Select 'As (1) with storage
1.11) With high resolution mode: Select 'High resolution'
1.12) Accept the default storage number 1
1.13) With high resolution mode: Select: 'No' and 'Right column' and <Enter>
After retrieval of the map:
1.13) Press Space to return to Main Menu
Assess the suitability of the soil for the requested crop
2.1) Main Menu: Select 'Soil suitability'
2.2) Process through all menus with the selection of the area, considered crop, input level
and land improvement(s), as above
-- which has to be equal with the previous selection
2.3) Select 'As (1) with storage ...'
2.4) With high resolution mode: Select 'High resolution'
2.5) Accept the default storage number 2
2.6) With high resolution mode: Select 'No' and
'Right column' and <Enter>
After retrieval of the map:
2.6) Press Space to return to Main Menu
Combine the climatic suitability with the soil suitability
and take management and conservation factors into consideration
3.1) Main Menu: Select 'Land suitability'
3.2) Process through all menus with the selection of the area, considered crop, input level, land
improvement(s), as above
-- which has to be equal with the previous selections
3.3) Select 'Map/data on screen only' for display
3.4) With high resolution mode: Select 'High resolution'
3.5) Select 'no'
3.6) With high resolution mode: Select: 'No' and 'Right column' and <Enter>
After retrieval of the map:
3.6) Press Space to return to Main Menu
GILES/Para
3.3
3.3.6 How to
for Users: How to
...
111
Combine Crop Suitabilities to Form a Crop Mix Suitability Assessment
Assess the crop suitability for the first crop
1.1) Process the crop suitability map as described under
'How to assess the land suitability for a crop' (Section
1.2) Select 'As (3) with storage of ...'
1.3) Select #3
3.3.5; p.110),
After retrieval of the map:
1.4) Press Space to return to Main Menu
Repeat step 1 for each crop of the crop mix,
but store the map(s) under different number(s),
(e.g. in step 1.3 #4 for the second crop,
#5 for the third crop etc.)
Overlay these maps to form the crop mix suitability map
3.1) Main Menu: Select 'Overlay/reprint of previously configured map(s)'
3.2) Select study area
3.3) Select 'Whole study area'
3.4) Accept 'C:<--- default'
3.5) Accept the default subdirectory
3.6) Select 'Map/data on screen only' for display
3.7) With high resolution mode:
Select 'High resolution image'
Select: 'No'
Select: 'Right column' and <Enter>
3.8) Select the option with the number of suitability maps
3.9) Select the line with the 1.suitability map
3.10) Repeat step 3.9 for the other suitability maps
After retrieval of the map:
3.11) Press Space to return to Main Menu
but:
GILES/Para 3.3 for Users: How to
...
112
3.3.7 How to Define a Window at Map Retrieval
A window is defined as a rectangular part of the map of the project area (see Glossary: window, irregular window)
Start with the selection of the required map as described in the other 'How to ... ' Sections
At the selection of the area, proceed as follows:
2.1) Define the window at the map using the 29-112-transparent: (see p.125)
Write down the x and y coordinates
2.1) Select study area
2.2) Select the map sheet of the window
2.3) Select the run (quarter of a sheet) of the window
2.4) Enter:
southern margin of the window: 1-111
(y/row number of the 29-112-transparent)
northern margin of the window: 2-112
(y/row number of the 29-112-transparent)
western margin of the window: 1-28
(x/column number of the 29-112-transparent)
eastern margin of the window: 2-29
(x/Column number of the 29-112-transparent)
Continue with the selection of the required map as described
in the other 'How to ...' Sections
GILES/Para 3.3 for Users: How to ...
113
3.3.8 How to Define an Irregular Window
and to Print Thematic Maps of This Window
An irregular window is the area defined by one homogeneous characteristic (e.g. the area of a
Peasant Association or the area of a valley) having an irregular (not rectangular) shape.
Define the irregular window
1.1) Main Menu: Select 'Base map (complete/selective/aggregating/parametric)'
1.2) Select study area
1.3) Select 'Whole study area'
1.4) Accept 'C:<--- default'
1.5) Accept the default subdirectory
1.6) Select the map by which the window is defined
1.7) Select 'Selective/aggregating map'
1.8) Enter '1'
1.9) Select 'Enter right now'
1.10) Select the unit
It is possible to add another mapping unit(s) !
When finished, select 'Not more in this unit'
1.11) Select 'As (1) with storage ...'
1.12) With high resolution mode: Select 'High resolution image'
1.13) Choose one of the proposed numbers (e.g. #9)
1.14) With high resolution mode:
Select: 'No'
Select: 'Right column' and <Enter>
After retrieval of the map:
1.15) Press Space to return to Main Menu
If the total number of mapping units of the 'main map' is not known:
2.1) Main Menu: Select 'Database'
2.2) Select study area
2.3) Select 'Mapping unit codes'
2.4) Select map
2.5) Select 'See the data'
2.6) Note the number of the last unit (except 'OUT') and press any key
2.7) Select 'Return to Main Menu'
2.8) Press Space to return to Main Menu
GILES/Para 3.3 for Users: How to
...
114
Prepare the 'main map'
3.1) Main Menu: Select 'Base thematic map' (or any other map option)
3.2) Select study area
3.3) Select 'Whole study area'
3.4) Accept 'C: <--- default'
3.5) Accept the default subdirectory
3.6) Select map
3.7) Select 'Complete map'
If more than 70 mapping units occur at
the 'main map', see Section 3.2 (3)
3.8) Select 'As (1) with storage ...'
3.9) Choose one of the proposed numbers, but not the one chosen under step 1.10 (e.g.4)
3.10) Continue as described in the other 'How to ...' Sections
After retrieval of the map:
3.11) Press Space to return to Main Menu
Make the overlay for the irregular window
4.1) Main Menu: Select 'Overlay/reprint of previously configured map(s)
4.2) Select study area
4.3) Select 'Whole study area'
4.4) Accept 'C:<--- default'
4.5) Accept the default subdirectory
4.6) Select 'Map/data on screen only' for display
4.7) With high resolution mode: Select: 'High resolution image'
4.8) Select 'No'
4.9) With high resolution mode:
Select: 'No'
Select: 'Right column' and <Enter>
4.10) Select 'Overlay of main map with selected areas'
4.11) Select the main map, as defined under step 3.9
4.12) Select the select area, as defined under step 1.13
4
After retrieval of the map:
4.13) Press Space to return to Main Menu
GILES/Para 3.3 for Users: How to
...
115
3.3.9 How to Define 'Selected Areas' and to Retrieve Crosstabulation Statistics
'Selected areas' are defined by homogeneous characteristics (e.g. PAs). Any map can be overlaid
with those 'selected areas' (e.g. suitability assessment = 'main map', PAs = 'selected areas').
Define the 'selected areas'
1.1) Main Menu: Select 'Base map (complete/selective/aggregating/parametric)'
1.2) Select study area
1.3) Select 'Whole study area'
1.4) Accept 'C: <--- default'
1.5) Accept the default subdirectory
1.6) Select the map by which the selected areas are defined
1.7) Select 'Complete map'
1.8) Select 'As (1) with storage ...'
1.9) With high resolution mode: Select 'High resolution image'
1.10) Choose one of the proposed numbers (e.g. #9)
1.11) With high resolution mode:
Select 'No'
Select 'Right column' and <Enter>
After retrieval of the map:
1.12) Press Space to return to Main Menu
If the total number of mapping units of the 'main map' is not known:
2.1) Main Menu: Select 'Database'
2.2) Select study area
2.3) Select 'Mapping unit codes'
2.4) Select map
2.5) Select 'See the data'
2.6) Note the number of the last unit (except 'OUT') and press any key
2.7) Select 'Return to Main Menu'
2.8) Press Space to return to Main Menu
GILES/Para 3.3 for Users: How to
...
Prepare the 'main map'
3.1) Main Menu: Select 'Base thematic map' (or any other map option)
3.2) Select study area
3.3) Select 'Whole study area'
3.4) Accept 'C: <--- default'
3.5) Accept the default subdirectory
3.6) Select the map
3.7) Select 'Complete map'
If more than 70 mapping units occur at
the 'main map', see Section 3.2 (3)
3.8) Select 'As (1) with storage ...'
3.9) Choose one of the proposed numbers, but
not the one chosen under step 1.10 (e.g.4)
3.10) Continue as described in the other 'How to ...' Sections
After retrieval of the map:
3.11) Press Space to return to Main Menu
Create the crosstabulation 'main map' - 'selected areas'
4.1) Main Menu: Select 'Overlay/reprint of previously configured map(s) '
4.2) Select study area
4.3) Select 'Whole study area'
4.4) Accept 'C: <--- default'
4.5) Accept the default subdirectory
4.6) Select 'Map/data on screen only' for display
4.7) With high resolution mode: Select: 'High resolution image'
4.8) Select 'Yes', if you want to transfer the table to Lotus
Select one of the five 'GIL2LOTa.PRN' files
4.9) With high resolution mode:
Select: 'No'
Select: 'Right column' and <Enter>
4.10) Select 'Overlay of main map with selected areas'
4.11) Select the main map, as defined under step 3.9
4.12) Select the 'selected areas', defined under step 1.10
After retrieval of the map:
4.13) Press Space to return to Main Menu
116
GILES/Para 3.3 for Users: How to
...
117
3.3.10 How to Plot
Prepare the map
1.1) Select the map to be plotted
(This can be any map offered by GILES,
e.g. map overlays, LGP map, suitability map etc.)
But due to the limitation of color pens, it is recommended not to select maps with more
than 8 different units !
1.2) Select 'As (1) with storage of ...'
1.3) Select the number of storage (e.g. #4)
After retrieval of the map:
1.4) Press Space to return to the Main Menu
Initiate plotting
2.1) Main Menu: Select 'Overlay/reprint of previously configured nnap(s)'
2.2) Select study area
2.3) Select 'Whole study area'
2.4) Accept 'C: <--- default'
2.5) Accept the default subdirectory
2.6) Select 'Map/data on screen and map on paper by plotter (4)'
2.7) With high resolution mode:
Select: 'No'
Select: 'Right column' and <Enter>
2.8) Enter the scale
2.9) Select '1 map, previously produced and stored'
2.10) Select the map to be plotted, defined under step 1.3
Install the plotter and give the required parameters
3.1) Load the pen holder with the pens:
black
0.7 mm
black
0.3 mm
3...: any color 0.3 mm
3.2) Load the plotter paper against the left rail (close and parallel, but not too tight !) and align
with the rear guide (small white line)
3.3) Select 'no'
3.4) Select 'Mapping unit name'
3.5) Select 'Black 0.3 mm'
3.6) Select 'Black 0.3 mm'
3.7) Select 'Solid lines'
After plotting:
3.9) Enter 'N' for no title outprint
3.10) Press 'N' for no additional symbols
GILES/Para 3.3 for Users: How to
3.3.11 How to Chan e Fon
118
...
s
sm. Unit Ou
int S
bols
At line printers, each grid cell is printed with a symbol characteristic for the occurring mapping unit.
These outprint symbols can be changed (e.g. to make them darker or brighter), either permanently through this procedure or temporarily. See App.9 (p.255) for a list of recommended
fonts and ASCII codes.
1.1) Main Menu: Select 'Database'
1.2) Select study area
1.3) Select 'Mapping unit codes'
1.4) Select map
1.5) Select 'See the data'
1.6) Note the number (left column) of the mapping unit(s) which outprint symbol(s) are to be
changed and press any key
1.7) Select 'Mapping unit codes'
1.8) Select the map
1.9) Select 'Enter/change part of the data'
1.10) Enter the number of the mapping unit (see step 1.6)
1.11) Press <Enter> to leave the mapping unit,
then enter the number of the.new symbol (font) (see App.9; p.255)
1.12) Enter "n"
1.13) Save ("Y", then "YY")
1.14) Select 'Return to Main Menu'
GILES/Para 3.3 for Users: How to ...
119
3.3.12 How to Add a Crop
At the present, 43 crops (mainly those being used and/or have a potential in the highlands of
Ethiopia) are entered into GILES with their requirements to allow suitability assessments. The list of
these crops is found in Section 4.2.19 (p.181).
Additional crops can be entered by:
If the total number of crops is not known:
1.1) Main Menu: Select 'Database'
1.2) Select any project area
1.3) Select 'LUT/crop names'
1.4) Select 'See the data'
1.5) Press <Enter> two or three times, till you reach the
last page note the number of the last crop and press any key
1.6) Select 'Return to Main Menu'
1.7) Press Space to return to Main Menu
Enter the crop name (in 'Iut.nam' file):
2.1) Main Menu: Select 'Database'
2.3) Select any project area
2.4) Select 'LUT/crop names'
2.5) Select 'Enter/change part of the data'
2.6) Enter the number of the first blank line (number of crops + 1, see step 1.5)
2.7) Enter the name
2.8) Save it and return to Main Menu
("Y", then "YY" and 'Return to Main Menu')
Enter the crop requirements (in 'crego.dat' file):
3.1) Main Menu: Select 'Database'
3.2) Select any project area
3.3) Select 'Crop requirements'
3.4) Select 'no'
3.5) Select the (new) crop
3.6) Select 'Low'
3.7) Enter the crop requirement for the specific quality
in integer numbers (accepted ranges are indicated)
Or: Press <Enter> to leave the previous code.
3.8) Repeat step 3.7 for all qualities
To scan through all requirements, hold <Enter>
F2 function key brings you back one line.
3.9) Repeat step 3.1-3.8 for 'intermediate' input level
3.10) Repeat step 3.1-3.8 for 'high' input level
3.11) Press Space to return to Main Menu
GILES/Para 3.3 for Users: How to
...
3.3.13 How to Calculate Area Sizes
1.1) Main Menu: Select 'Area sizes'
1.2) Select study area
1.3) Select 'Whole study area'
1.4) Accept 'C:<--- default'
1.5) Accept the default subdirectory
1.6) Select the map
1.7) Indicate if you want outprint on paper or only display on screen
1.8) Select 'no' (if you do not want the figures transferred into Lotus worksheet file)
1.9) Select 'yes' (if the area size files are already prepared)
1.10) Press Space to return to Main Menu
120
GILES/Para 3.3 for Users: How to
...
121
3.3.14 How to Chain Processes
Time consuming processing can be stored in a chain file ('C: \landev\contfile.dat') which executes
the requested procedures one after the other.
Create chain file
1.1) Main Menu: Select 'Chaining of various procedures'
1.2) Select study area
1.3) Select the procedure which should be processed first/next
1.4) Select crop
-1.5) Select input level
1.6) Select land improvement
1.7) Select 'No' for map outprint
1.8) Select 'No' for legend outprint
1.9) Enter if you want to store the map and eventually
the storage number (1-9)
1.10) Enter 'No' for transfer of output tables to Lotus
Repeat step 1.3- 1.10 for each selected procedure to be next in the chain file
Leave the entry mode and start processing
3.1) Select 'End and START'
GILES/Para 3.3 for users: How to
...
122
3.3.15 How to Start With a New Area
If this is the first area, see under 'How to start first time':
Section 3.3.21 (p.133)
1) Select the scale for map entry
The scale of map entry into GILES can vary.
It is recommended to have the map entry scale being 2-4 times greater than most of the
output maps or inventory maps by enlarging the base maps photographically by this
factor. This will smoothen the curves of the mapping units and make map entry easier.
The map entry scale should by no means be smaller than the output maps !
Particularly, the factor 2.36 is highly recommended because that allows the outprint of
maps on matrix printer in the same scale as the base thematic maps (unmodified scale).
E.g. at inventory scale of 1:250,000, it is advisable to enlarge the maps to the scale of
1:250,000 * 2.36 = approx. 1:106,000
As more the map scale will be enlarged, as smaller will be the area covered by one individual pixel and as more detailed will be the information.
( scale (in thousands) * 5) 2
Area size of one pixel (ha) 10000
Eg.: Entry Scale
1: 50,000
Pixel Coverage
Pixel Size
1:106,000
250 x 250 m
530 x 530 m
28.09 ha
1:250,000
1250 x 1250 m
156.25 ha
6.25 ha
2) Define the map sheets of the area
Split the map of the whole area into 55.5 x 56.0 cm (HxW) sheets, eventually photographically enlarged.
If an adjacent nnap was entered into GILES before, it is recommended to extend the sheet
frame to the new area.
Otherwise, you start with a reference point in the central part of the project area being the
junction of either latitude/longitude or UTM grid system. This reference point should be
the corner of the four adjacent map sheets. Then process from these four sheets into all
directions.
GILES/Para 3.3 for users: How to ...
123
This is the setup of the 'map index', i.e. the definition of the relative location of the map
sheets (Example, see App.10; p.257). There are 4 runs on each map sheet: Each 55.5 cm x
14 cm (HxVV) (see Section 3.2.2; p.97 and 3.3.17; p.125).
3) Enter required parameters into GILES (in 'starea.nam' file):
3.1) Main Menu: Select 'Database'
3.2) Select any area
3.3) Select 'study areas'
3.4) Select 'Change the size (dimension) of the data set'
3.5) Enter: 1 ('add additional area')
3.6) Enter the name of the new project area (up to 15 letters; e.g. Ethiopia)
3.7) Enter the working abbreviation (3 or 4 letters; e.g. ETH)
3.8) Enter the scale (as defined under step 1)
3.9) Enter the number of soil types in the project area
1
(not: soil mapping units)
3.10) Additional maps can be entered by giving:
1
- map theme (map name; e.g. Evapotranspiration)
- working abbreviation (3 or 4 letters; e.g.PET)
If no (or not more) additional maps shall be indicated, press <Enter>
3.11) For all map sheets of the area, there must be entered:
- all sheet names
- working abbreviation of all sheets (one letter
or one digit; <Enter> for proposed default: 1..)
- relative position to the previous sheet:
1 one to the right 6 down and one to the left
2 two to the right
7 down and two to the left
3 three to the right 8 down and three to the left
4 four to the right 9 down and four to the left
5 one down
- N,S,W,E coordinates of sheet frame (in latitude and longitude, with decimals)
3.12) Save, return and exit to DOS
1
Not essential
GILES/Para 3.3 for users: How to
...
3.3.16 How to Define an Additional
Following maps are predefined and already installed:
Soil map
Altitude map
Precipitation map
Land use/land cover map
Administrative map
Agroecological zones map
Planning zones map
For these 7 maps the following procedure can be omitted.
Up to 9 additional new maps can be specified:
Define the new additional map
1.1) Main Menu: Select 'Database'
1.2) Select project area
1.3) Select 'Study areas'
1.4) Select 'Enter/change part of the data'
1.5) For the first additional map, give: 101;
for the second additional map, give: 102 etc.
1.6) Enter the title of the specific map (up to 15 letters; e.g. trifolium map)
1.7) Enter working abbreviation (3 or 4 letters; e.g. TRI)
1.8) Save and return to Main Menu
Enter the mapping unit codes
See Section 3.3.18 (2); p.126.
124
125
GILES/Para 3.3 for users: How to ...
3.3.17 How to Prepare a Map For Entry
If the scale is not chosen yet, decide on the scale for map entry (see 'How to enter a new area',
3.3.15(1); p.122).
If the area is not divided into various map sheets, follow the criteria given under step 2 of 'How
to start with a new area' (Section 3.3.15; p.122) to decide on map sheet divisions and mark
them at the map(s) of the area.
Prepare a transparent with 29-112 grid cell system, with:
- 28 columns: vertical line no.1 as the left margin of the leftmost column, line no.29 as the
right margin of the rightmost column,
- 111 rows: horizontal line no.1 as the bottom margin of the bottom row, line no.112 as the
top margin of the top row.
Each grid cell is addressed by the coordinates of its left bottom corner
I
This 29-112-transparent covers-one 'run'. Four runs cover one map sheet:
11.111E1I
1.111111.
iG
III111
1111111LUMIN
4
.....p...........
......
..................
.....................
aM111111111111111111111
1111111111
JO
gpormrir
i.
Mr
1111111111111111111 .
prprarrampum
i
simi012
41;
8
Cut the map in such a way that a row of 2 or 3 'map sheets' form one piece.
Cut holes along the margins and mark precisely the margins of
each sheet and each run VERY ACCURATELY !
Overlay the 29-112-transparent form and check each run.
Write sheet and run number on all runs.
MINI
4
2G
GILES/Para 3.3 for users: How to ...
126
3.3.18 How to Entera Map
If the map is not prepared yet, split it into different map sheets as described under
'How to prepare a map' (see previous page).
Enter the mapping unit codes of the map (if the codes are not entered yet)
2.1) Main Menu: Select 'Database'
2.2) Select project area
2.3) Select 'Mapping unit codes'
2.4) Select the map
(If the map is not defined yet: See 'How to define an additional map'; p.124)
2.5) Select 'Declare a new data set' and confirm with 'Yr.
2.6) Enter the number of mapping units of this map
(Number of units = number of different units)
2.7) Enter the code (label) of the first mapping unit
2.8) Enter the ASCII code (36-126) for the font (outprint symbol) of the first mapping unit
(e.g. 36: $ ),
but keep ASCII symbol 46 reserved for the last mapping unit ('OUT') !
See App. 9 for recommended ASCII codes !
2.9) Repeat step 2.7 and 2.8 for each mapping unit
2.10) Save ("r, then °YY") and return to Main Menu
Enter one run of the map
3.1) If a digitizing tablet is available, connect the tablet through its communication (serial)
cable to the serial port of the computer and (if necessary) the power supply cable to
the transformer unit of the tablet.
3.2) Place the map on the digitizing tablet in such a way
that the margins of the map are
ABSOLUTELY PARALLEL TO THE FRAME OF THE TABLET !
Small holes along the map sheet d[vision are useful help.
3.3) Main Menu: Select 'Entry of base map'
3.4) Select project area
3.5) Select sheet
3.6) Select run
3.7) Accept 'C:< default'
3.8) Accept the default subdirectory
GILES/Para 3.3 for users: How to
...
127
3.9) Select map
3.10) Choose 'digitizing tablet'
3.11) Only with large tablets:
Place the cursor exactly at position 1/1
(left bottom comer of the run) and press <Enter>
3.12) Press <Enter>
3.13) Select 'Enter a unit'
3.14) Select one mapping unit at the map and enter the code (label) of this unit.
3.15) Only with small tablets:
Select one point of the boundary of the selected mapping unit, read its coordinates
from the 29-112-transparent and enter them.
3.16) With small tablets:
After beep, place the stylus
exactly at the crossing of vertical and horizontal
lines of the given coordinates,
With large tablets: After beep, place the stylus anywhere at the boundary of
the mapping unit,
then follow the unit boundary with the stylus pressed down or with the cursor and
surround the entire unit.
It is possible to go back, to form 8-shape-like units or to go beyond the margin of the
run.
At any place it is possible to lift the stylus off, then press <Enter>, 'C' and continue
with the keypad or with the stylus.
3.17) When reaching the starting point, lift the stylus off and press <Enter>.
3.18) For checking purposes, give the unit code, eventually the x and the y coordinates
again.
3.19) The unit shall be displayed at the screen, the area calculated and return to the entry
menu. Continue with step 3.13.
If the entered area or parts of it were previously assigned to another mapping unit, a message will appear and ask for the correct unit of this grid cell. Enter:
'N' if the current ('new') assignment is correct for the indicated pixel
'P' if the previous assignment is correct for the indicated pixel
'ALLN' If the current ('new') assignment is correct for the indicated pixel and all following
'ALLP' if the previous assignment was correct for the indicated pixel and all following
'SP' if only one particular mapping unit shall be replaced with the new assignment,
but all others remain unchanged
'C' if neither the current nor the previous assignment is correct for the indicated pixel.
For any error message, see App. 3 (p.192) for trouble shooting.
3.20) Mark the unit as entered (e.g with a tick mark)
3.21) Repeat step 3.13-3.19 for all mapping units.
After entering all mapping units:
3.22) Check properly the whole map; corrections of single grid cells can be made through:
Select 'Correct a single grid cell'
GILES/Para 3.3 for users: How to
...
128
Press <Enter> if the code is correct
3.23) Select 'See the area on screen and highlight the blank areas' to check for
full coverage.
If there are pixels not entered yet, enter them in any of the above described way
(efther step 3.13-3.20 or 3.22).
3.24) If there are many blank pixels:
Select 'See the area and print the blank areas'
After checking:
3.25) Select 'Save (and/or exit)'
Repeat step 3 for each run of each map.
Check the boundary of the project area
The 'outside' boundary of the project area of all maps have to be identic,al. Therefore, it is
recommended to have one reference map (e.g.altitude map or soil map) the other input
maps refer to.
5.1) Turn the printer on
5.2) Main Menu: Select 'Systematic change of base maps'
5.3) Select project area
5.4) Select 'Whole study area'
5.5) Accept 'C: <--- default'
5.6) Accept the default subdirectory
5.7) Select map
5.8) Select 'Check the outer boundary of the map wtth a reference map'
5.9) Enter the reference map (3 or 4 letters, e.g. ALT)
5.10) Select 'Assignment of pixels being outside to OUT ('cutting') and outprint of the
pixel(s) if the map is too small'
5.11) Select 'same name'
5.12) Retum to Main Menu
Run the area sizes (for creation of area sizes files)
6.1) Main Menu: Select 'Area sizes'
6.2) Select project area
6.3) Select 'Whole study area'
6.4) Accept 'C:< default'
6.5) Accept the default subdirectory
6.5) Select map
6.6) Select 'Map/data on screen only'
6.7) Select 'No'
6.8) Select 'No'
6.9) Return to Main Menu
GILES/Para 3.3 for users: How to ...
3.3.19 HQW tO Change Mapping Units of Base Maps
It is recommended to have a listing of the mapping units first:
1.1) Tum the printer on
1.2) Main Menu: Select 'Database'
1.3) Select project area
1.4) Select 'Mapping unit codes'
1.5) Select map
1.6) Select 'See and outprint the data'
1.7) Without saving, retum to Main Menu
('N', 'Return to Main Menu')
Mark the units to be changed on this list
Enter the changes
3.1) Main Menu: Select 'Systematic change of base maps'
3.2) Select project area
3.3) Select 'Whole study area'
3.4) Accept 'C:< default'
3.5) Accept the default subdirectory
3.6) Select map
3.7) Select 'Replace/aggregate old units with new'
3.8) For each replacement:
Enter the old mapping unit number (not unit)
-to replace what?and the new mapping unit number
- to replace with what?and press <Enter>
3.9) In case of wrong entry, press 'N' instead of the last
<Enter> and enter the previous change again
3.10) After entry of all changes, give "000"
After modification of the map:
3.11) Select 'No'
3.12) Enter 'N' and retum to Main Menu
Check the mapping unit codes if they are still valid
4.1) Main Menu: Select 'Database'
4.2) Select project area
4.3) Select 'Mapping unit codes'
4.4) Select map
4.5) Select 'See and outprint the data'
4.6) Return to Main Menu
129
GILES/Para 3.3 for users: How to
...
130
3.3.20 How to Aggregate Mapping Units to Form a New Base Maps
1) Before entering GILES use DOS to produce a temporary dummy 'mapping unit code file with
the old mapping units:
1.1) Type at C: prompt:
COPY \ADG \Am.MUC \AIDG \_an.MUC
where: A abbreviation of study area
, e.g.HOS
m abbreviation of theme of old map, e.g.ADM
n abbreviation of theme of new map, e.g.PLZ
2) It is recommended to have a listing of the mapping units:
Proceed as in step 1 of 'How to change mapping units of base maps', Section 3.3.19 (p.130)
3) Give each unit the new unit number on this list
4) Enter the aggregations
4.1) Main Menu: Select 'Systematic change of input maps'
4.2) Select project area
4.3) Select 'Whole study area'
4.4) Accept 'C: <--- default'
4.5) Accept the default subdirectory
4.6) Select map
4.7) Select 'Replace/aggregate old units with new'
4.8) For each replacement:
Enter the old mapping unit number (not unit)
-to replace what?then the new mapping unit number
- to replace with what?then press <Enter>
4.9) In case of wrong entry, press 'N' instead of the last
<Enter> and enter the previous assignment again
4.10) After entry of all assignments, 'OUT' has to be given:
Enter the old mapping unit number for 'OUT'
(total number of old units + 1)
then the new mapping untt for 'OUT'
(total number of new untts + 1)
4.11) After entry of all changes, give "000"
After modification of the map:
4.12) Select 'yes' and give the abbreviation,
same as n in step 1, e.g. 'PLZ'
4.13) Enter 'N' and return to Main Menu
GILES/Para 3.3 for users: How to
...
131
Run the area size and check that no unit with a number greater
than the last unit of the aggregated list occurs
Proceed as in step 6 of 'How to enter a map' (Section 3.3.18; p.129)
Enter the new mapping unit codes of the map
6.1) Main Menu: Select 'Database'
6.2) Select the project area
6.3) Select 'Mapping unit codes'
6.4) Select map
6.5) Select 'Declare a new data set' and enter 'YY'
6.6) Enter the total number of mapping units of this map
(Number of units = number of different units + 1)(see step 4.9)
6.7) Enter the code (label) of the first mapping unit
6.8) Enter the ASCII code (36-255) for the font (outprint symbol) of the first mapping unit
(e.g. 36: $ ), See App. 9 (p.255) for recommended ASCII codes !
6.9) Repeat step 6.7 and 6.8 for each mapping unit
6.10) Enter 'OUT' as the code (label) of the last unit
6.11) Enter ASCII code '46' as =print symbol of mapping unit 'OUT' (.)
6.12) Save (Y, then YY) and return to Main Menu
Run the area sizes again: See above (step 5)
If error message 'Calculated unit does not fit to mapping unit codes' occurs, one or more
units were forgotten: See for trouble shooting in App.3: 'Calculated ....' (p.192)!
GILES/Para 3.3 for users: How to
...
3.3.21 How to Star-t the First Time
Select the scale for map entry
The scale of map entry into GILES can vary.
Read and follow step 1 of 'How to start with a new area' (Section 3.3.14; p.121)
Define the map sheets of the area
Read and follow step 2 of 'How to start with a new area' (Section 3.3.14; p.121)
Enter required parameters into GILES (in 'starea.nam' file):
3.1) Main Menu: Select 'Database'
3.2) Select any area
3.3) Select 'Study areas'
3.4) Select 'Declare a new data set'
3.5) Enter the number of project areas (e.g. 1)
3.6) Enter the maximum number of map sheets covering the project area
3.7) Enter the name of the project area (up to 15 letters; e.g. Ethiopia)
3.8) Enter the working abbreviation (3 or 4 letters; e.g. ETH)
3.9) Enter the scale (as defined under step 1)
3.10) Enter the number of soil types in the project area
1
(not: soil mapping units)
3.11) Additional maps can be entered by giving:
1
- map theme (map name; e.g. Evapotranspiration)
- working abbreviation (3 or 4 letters; e.g.PET)
If no (or not more) additional maps shall be indicated, press <Enter>
3.12) For all map sheets of the area, there must be entered:
- all sheet names
- working abbreviation of all sheets (one letter
or one digit; <Enter> for proposed default: 1..)
- relative position to the previous sheet:
1 one to the right 6 down and one to the left
2 two to the right 7 down and two to the left
3 three to the right 8 down and three to the left
4 four to the right 9 down and four to the left
5 one down
- N,S,W,E coordinates of sheet frame (in latitude and longitude, with decimals)
3,13) Save, retum and exit to DOS
1
Not essential
132
GILES/Para 3.3 for users: How to
...
3.3.22 How tO IMPOrt a Lotus 1-2-3 File
1) Create a Lotus worksheet file
Following criteria for the structure of the Lotus spreadsheet have to be considered:
For the import/aggregation of mapping unit codes:
aa) It can contain 2 or 3 or more columns:
Column A: mapping unit label (as string)
Column B : number (as value) (e.g. number of newly assigned mapping unit)
Column C : label for newly assigned mapping units
ab) Blank rows or rows with another content,
e.g. a label not being a mapping unit label
in column A, are allowed, but ignored by GILES
For the import of characterization tables:
ba) It can contain 2 or 3 or more columns:
Column A : number of soil type/administrative unit (as value)
Column B or C or .. : class number (as value)
bb) All columns must contain a value !
No labels are allowed, no blanks !
2) Translate this file into a DIF file
2.1) Save this file under the name 'LOT2GILa' preferably in subdirectory C:\INTERM
(where g: let-ter A-E)
2.2) Quit 1-2-3 and select option Translate' in Lotus ( / 0 Y T)
2.3) What do you want to translate from: Select the installed Lotus version
2.4) What do you want to translate to: Select DIF
2.5) Source file: Type 'C:\INTERM \LOT2GILa'
(where g as above)
2.6) Target file: Accept the same name
2.7) Process wtth translation
2.8) Leave Translate and Lotus
3) This DIF file can be read by GILES
133
GILES/Para 3.3 for users: How to ...
134
3.3.23 How to Aggregate Mapping Units for Outprint Through Lotus 1-2-3
This is particularly recommended if a large number of mapping units occur or have to be aggregated for retrieval or further processing in GILES. For a small number, say less than 20, it is
faster to aggregate them through GILES.
Copy the mapping unit ccxies from GILES into LOTUS
1.1) Main Menu: Select 'Database'
1.2) Select the project area
1.3) Select 'Mapping unit cc>des'
1.4) Select map
1.5) Select option 'See and transfer the data in Lotus file CAINTERM\GIL2LOTa.PRN'
(where a: letter A-E)
1.6) Without saving, exit GILES
('N', 'Return to Main Menu', 'Exit to system')
Convert this print file into a Lotus worksheet file
2.1) Enter Lotus 1-2-3
2.2) Change directory to CAINTERM ( / F D)
2.3) Import the 'GIL2LOTa' print file as text ( / F I T ; where a as above)
Treat this file as any Lotus worksheet file,
but do not change column A and
be aware that only numeric values in column B will be read in GILES
Translate this file into a DIF file
4.1) Quit 1-2-3 and choose option Translate' in Lotus ( / Q Y T )
4.2) What do you want to translate from: Select the installed Lotus version
4.3) What do you want to translate to: Select DIF
4.4) Source file: Type 'CAINTERM\LOT2G1La'
(where A as above)
4.5) Target file: Accept the same name
4.6) Process with translation
4.7) Leave Translate and Lotus
GILES/Para 3.3 for users: How to ...
135
5) Select the map through GILES
5.1) Type 'GILES' at the C: prompt
5.2) Main Menu: Select 'Base map (complete/aggregating/selective/parametric)'
5.3) Select project area
5.4) Select 'Whole study area'
5.5) Accept 'C:< default'
5.6) Accept the defautt subdirectory
5.7) Select map
5.8) Select 'Selective/aggregating map'
5.9) Enter the total number of new mapping units (highest value in column B; see step 4.5)
5.10) Select 'Import from Lotus file LOT2GILa'
(where a as defined in step 1.5)
5.11) Continue with the selection of the requested map as described in the
other 'How to ...' Sections
GILES/Para 3.3 for users: How to ...
136
3.3.24 How to Transfer Area Size Tables / Raw Data (DBMS) / Crosstabulation into Lotus
During selection of overlaid/calculated map (e.g.see 'How to calculate the area sizes' or 'How to
overlay selected areas'), choose the transfer into a Lotus file:
1.1) Select 'yes' and choose one of the five 'GIL2LOTg.PRN' files
(where g letter: A-H)
Convert this print file into a Lotus worksheet file
2.1) Enter Lotus 1-2-3
2.2) Change directory to CAINTERM ( / F D)
2.3) Import the 'GIL2LOTg' print file as numbers ( / F I N) , where g as above
In case of crosstabulation (selected areas):
Row 1 is the total area,
row 2-84 are the overlaid windows/selected areas;
column 1 is number of the selected area,
columns 2-83 are the mapping units of the 'main map'.
Eventually you have to fill blank parts of this matrix have to be filled with zeros.
Rows with 0 can be deleted.
If any row has a length of more than 240, continuation to the right is in file GIL2LOTZ.PRN, then
in GIL2LOTY.PRN, then in GIL2LOTX.PRN !
If column 1 has a number greater than 1000, this row is the right extension of the row above
(row 1000+ n is the right extension of row n).
GILES/Para 3.3 for users: How to ...
137
3.3.25 How to Tran0u a Area Size TaWn I Rmv
dBne
1) During selection of overlaid/calculated map (e.g.see 'How to calculate the area sizes' or
'How to overlay selected areas'), choose the transfer into a Lotus file:
1.1) Select 'yes' and choose one of the five 'GIL2LOTg.PRN' files
(where g letter: A-H)
A) If Lotus is available:
Convert this print file into a Lotus worksheet file
2.1) Enter Lotus 1-2-3
2.2) Change directory to CAINTERM ( / F D)
2.3) Import the 'GIL2LOTg' print file as numbers
( / FIN ) , where a as in step 1
In case of crosstabulation (selected areas), see remarks of step 3 of Section 3.3.24 (p.136).
Insert a heading row
4.1) Insert a row above the data as row 1 (I W I R)
4.2) Label each cell of this row where data occur in the same column with a name beginning
with a letter (e.g.COL1, COL2)
4.3) Save this sheet under a new name ( / F S)
Translate the spreadsheet file into dBase format
5.1) Quit 1-2-3 and select option Translate' in Lotus ( / Q Y T)
5.2) What do you want to translate from: Select the installed Lotus version
5.3) What do you want to translate to: Select dBase
5.4) Source file: Enter the name as chosen in step 4.3
5.5) Destination file: Accept the same name
5.6) Select 'Worksheet'
5.7) Process with translation
5.8) Leave Translate and Lotus
Enter dBase and retrieve the file
GILES/Para 3.3 for users: How to
...
138
B) If Lotus is not available and dBase version Ill+ is used:
Create an empty dBase file
2.1) Enter dBase Ill+
2.2) Create a dBase file either from Assist or from dot prompt ('CREATE...')
2.3) Define the structure by giving field names, selecting 'numeric' as the type, a sufficient width
(e.g. 10), decimals (if necessary) for as many columns as there are in the source
(GILES) file
Translate the print file into dBase
3.1) Enter from dot prompt:
APPEND FROM CAINTERM\GIL2LOTa.PRN TYPE DELIMITED
(where a number as chosen in step 1.1)
GILES/Para 3.3 for users: How to ...
139
3.3.26 How to Retrieve a DTM (3D Display)
and :
How to Transfer Maps Into Lotus 1-2-3
For further processing in spreadsheets (e.g.Lotus 1-2-3) or for transfer into graphic packages for
3D display (e.g. 'Perspective' or Boeing Graph), it is possible to convert GILES' maps into ASCII or
DIF formats:
Convert the map into print files (ASCII format)
1.1) Main Menu: Select 'Base map (complete/aggregating/selective/parametric)'
or any other option for map retrieval
1.2) Select the project area
1.3) Select the sheet (or 'Whole study area')
1.4) Accept 'C:< default'
1.5) Accept the default subdirectory
1.6) Select the map (e.g.'Altitude')
1.7) Select 'Complete map'
1.8) Select 'As (1) but with storage...'
1.9) Select 'print file for 3D display'
After retrieval of the map:
1.10) Press Space to return to Main Menu
Import the print files into Lotus spreadsheet files
2.1) Enter Lotus 1-2-3
2.2) Change directory to CAINTERM ( / F D)
2.3) Import the 'DGOCMPbc' print file as numbers ( / F I N)
2.4) If there are more than one run:
Locate the cursor at the right side of the displayed Lotus sheet (column 'AC', 'BE' or 'CG')
and repeat step 2.3 with the next run
2.5) Save this sheet under 'C:\INTERM \DGOCMP' and exit Lotus
Load the worksheet files into 'Boeing Graph' or 'Perspective'
3.1) Load '3D'
3.2) Load the file CAINTERM\DGOCMP
(e.g. in Boeing Graph:
F3: Data Manager
F2: File Manager
F1: File Load )
3.3) Manipulate the 3D display the way you like
GILES/Para 3.3 for users: How to
...
140
3.3.27 How to Transfer LGP Charts into Lotus 1-2-3
To demonstrate the pattem of the growing period at a certain location, tt is possible to transfer the
growing period on decadal basis of all observed years into Lotus 1-2-3 and further to graphic
packages.
Define the location of the LGP assessment (preferabiy of one grid cell only)
Overlay the 29-112-transparent on the map and note the GILES coordinates: sheet, run, x, y
Assess the LGP
2.1) Main Menu: Select 'Length of growing period'
2.2) Select project area
2.3) Select sheet of the required location
2.4) Select run of the lcication
2.5) Give the S, N, W, E coordinates of the location
2.6) Select 'Whole study area'
2.7) Accept 'C:< default'
2.8) Accept the default subdirectory
2.9) Select ' 75 %'
2.10) Select 'Average crop'
2.11) Select 'Pure function of the climate'
2.12) Select 'Maps/data on screen only'
2.13) Select 'No'
2.14) Select 'No'
2.15) Select 'Yes: screen and transfer in Lotus file GIL2LOTA.PRN'
After retrieval of the map:
2.163) Press Space and <Enter> to return to Main Menu
Import the print file into Lotus spreadsheet file
3.1) Enter Lotus 1-2-3
3.2) Change directory to CAINTERM ( / F D)
3.3) import the 'GIL2LOTA' print file as numbers ( / F I N)
GILES/Para 3.3 for users: How to
...
3.4) Manipulate and process the data:
The number in the spreadsheet stands for the relafive soil moisture saturation,
as explained in Section 3.2.1.11 (p.80)
columns 1-36 stand for 36 decades of the year,
column 37 for the mean (ength of the 1.rainy season,
column 38 for the mean length of the main season,
column 39 for the decade number of the end of the main rainy season,
the rows for the consecuttve years,
the row at the bottom of one LGP block:
number of soil mapping unit/precipitation
mapping unit/altitude mapping unit/coded LGP number
3.5) Save this spreadsheet under 'C:\INTERM\DGOCMP'
4) Load the worksheet file into 'Boeing Graph' or 'Perspective'
4.1) Load '3D'
4.2) Load the file 'C:\INTERM\DGOCMP'
(e.g. in Boeing Graph:
F3: Data Manager
F2: File Manager
F1: File Load )
4.3) Manipulate the 3D display the way you like
141
G1LES/Para 3.3 for users: How to
...
142
3.3.28 How to Import Precipitation Data From Lotus
1) Enter precipitation data into Lotus 1-2-3
Following criteria for the structure of the Lotus spreadsheet have to be considered:
Data must be either on monthly or decadal basis.
The first cdumn must contain the recorded year in numbers of 1900-1999
C) The second and consecutive columns (columns 2-13 for monthly,
2-37 for decadal data) shall contain the precipitation data in mm as values,
not as labels.
Decimals are allowed.
Blank cells are read as 0. Missing data are therefore interpreted as 0-rainfall.
Blank columns or any labels (e.g. 'x' for missing data) are not allowed.
Blank rows or rows with text are accepted. They will be ignored by GILES.
2) Create a Lotus file with one station
2.1) Delete the rows above and below the data rows of one selected station ( / W D R)
2.2) Save this file under 'CAINTERM \LOT2GILa'
(where a: letter A-Z)
3) Translate this file into DIF file
3.1) Quit 1-2-3 and select option Translate' in Lotus ( / Q Y T)
3.2) What do you want to translate from: Select the installed Lotus version
3.3) What do you want to translate to: Select DIF
3.4) Source file: Type 'CAINTERM \LOT2GILA'
(where A as above)
3.5) Target file: Accept the same name
3.6) Process with translation
3.7) Leave Translate and Lotus
GILES/Para 3.3 for users: How to ...
4) Import the individual station files into GILES ('aPREC.DAT')
4.1) Enter GILES by typing 'GILES' at the C prompt
4.2) Main Menu: Select 'Database'
4.3) Select project area
4.4) Select 'Precipitation data'
4.5) Select 'Import precip.data of a station from Lotus file LOT2GILa.DIF'
4.6) Select 'No'; or:
Enter the number of stations (precipitation unfts)
Data by month or decade: Enter 1 or 2
4.7) Give the number of the DIF file you like to import (see step 3.5)
4.8) Give the number (not the mapping unit code !)
of the precipitation mapping unit these data are for
4.9) Another station: Answer 'Y',
if more DIF files are prepared
5) Repeat step 2-4 for each mapping unit
6) Combine all stations into one GILES file ('aPREC.TWY)
This processing can only be performed if no data are missing!
6.1) Main Menu: Select 'Database'
6.2) Select project area
6.3) Select 'Precipitation data'
6.4) Select 'Transfer complete precipftation data set in final TWY file'
6.5) Data by month or decade: Enter 1 or 2
143
GILES/Para 3.3 for users: How to
...
144
3.3.29 How lo Stop Program Execution
There are different means to stop, to correct the selection procedure or to stop the map processing or retrieval:
If a wrong decision was made at the previous or one of the previous menus:
Press the F2 function key to retum to the previous menu (or menus)
and choose the right selection.
If the whole selection was wrong or the F2 does not work:
Press the F10 function key (or F10 and <Enter>) to prompt you back to the Main Menu
and start again with the selection.
If the retrieval of the map (scrolling at the screen) shall be stopped with continuation afterwards:
Press the space bar to stop as well as to continue.
If processing or map retrieval shall be stopped:
Press the F10 function key to prompt you back to the Main Menu.
GILES/Para 3.3 for users: How to
...
145
3.3.30 How to Speed Up Map Retrieval
Harddisk access is always a limtting factor in retrieving large data amounts. Virtual disks can speed
up the retrieval process considerably.
Transfer the map(s) from the harddisk to the virtual disk
1.1) Main Menu: Select 'File Operation'
1.2) Select project area
1.3) Accept 'C:< default'
1.4) Accept the default subdirectory
1.5) Select the map
1.6) Press any key
1.7) Select 'Yes'
1.8) Select 'Copy'
1.9) Select D:'
1.10) Accept the default subdirectory
Perform the requested task retrieving data from the virtual drive
2.1) Start with the selection of the required map as
described in the other 'How to ... ' Sections
2.2) In menu 'Where are the maps ?': Select the virtual drive (D:)
2.3) Continue with the selection of the required task
GILES/Para 3.3 for users: How to ...
146
3.3.31 HOW to Dump the Screen
Screen dumping is a fast and easy way to save and print hardcopies of high resolution images on
EGA/VGA screens. Most of the text maps in this manual are produced by screen dump utility
'Inset' (by MicroPro). As best experience was made with this utility and images can easily be imported into wordprocessor (Wordstar 2000), it will be explained here.
Load 'Inset' as memory resident program
1.1) At C: prompt, change default directory to 'Inset', e.g. CD: \WS2000 \GRAPHICS
1.2) Type 'Inset' and press <Enter>
1.3) After 'Inset' menu appears, press <Enter>.
Prepare and display the map on screen
2.1) At C: prompt, type 'GILES'
2.2) Retrieve the requested map as high resolution image
Dump the screen
3.1) At the final display of the map, press RightShift together wfth PrintScreen
3.2) Move the selection with the arrow keys to 'Save'
3.3) Type the name of the file to save
3.4) Press <Enter>
3.5) Leave 'Inset' by <Escape>
3.6) Press Space to return to Main Menu of GILES
3.7) Select 'out (Exit to DOS)'
Edit and print through 'Inset'
4.1) At C: prompt, press RightShift together with PrintScreen
4.2) Move the selection with the arrow keys to 'View'
4.3) Type the name of the file with the image (step 3.3)
4.4) Press <Enter>
4.5) Edit the image, as required
4.6) Define the window with commands: 'Modify', 'Clip',
Move the left and top frame with the arrow key to the correct distance from the most
extreme point of the study area (see App.10; p.257) or test new configuration
and press press <Enter>
Do the same with the right and bottom frame
4.7) Define the size with the options: 'Modify', 'Expand', 'Inches'
and enter width and aspect ratio, then <Esc>
4.8) 'Save'
4.9) Print the image with commands: 'Print', 'Go'
GILES/Para 3.3 for users: How to
...
147
3.3.32 How to add a Mapping Linn
During map entry it can happen that a mapping unit which was not predefined is found at the map.
This unit has to be entered to the definition of the mapping units (mapping unit code file).
Add the unit to the mapping unit code file
1.1) Main Menu: Select 'Database'
1.2) Select project area
1.3) Select 'Mapping unit codes'
1.4) Select map
1.5) Select 'Change the size (dimension) of the data set'
1.6) For each mapping unit to be added, increase the total number of units by one
1.7) Enter the new units with their mapping unit code
(label) and with their corresponding ASCII symbol
1.8) After input of all new unit(s), give "N"
1.9) After display, save ("r, then `YY") and return to Main Menu
Rearrange the mapping unit ccxie file during or after map entry
(Unit 'OUT' has to be the last one)
2.1) Main Menu: Select 'Database'
2.2) Select project area
2.3) Select 'Mapping unit codes'
2.4) Select map
2.5) Select 'See the data'
2.6) Check which unit is the 'OUT' unit (number a) and which is the last one (number b)
2.7) Select 'Mapping unit codes'
2.8) Select map
2.9) Select 'Enter/change part of data'
2.10) Enter the number of the previous unit of 'OUT' (number a)
and give code and ASCII-Symbol of the last unit (number 12)
2.11) Enter the number of the last unit (number I:2) and give code 'OUT' and ASCII-symbol '46'.
2.12) After input, give "N"
2.13) After display, save ("Y", then "Yr) and retum to Main Menu
G1LES/Para 3.3 for users: How to
...
3) Rearrange the map files to the new mapping unit codes definition
> Right after step 2 ! <
3.1) Main Menu: Select 'Systematic Change of Base Map'
3.2) Select project area
3.3) Select 'Whole study area'
3.4) Accept 'C:< default'
3.5) Accept the default sutxiirectory
3.6) Select the map
3.7) Select 'Replace/aggregate old units wfth new unfts'
3.8) Enter number g as 'Old unit NUMBER'
3.9) Enter number t as 'New untt NUMBER' and press <Enter>
3.10) Enter number as 'Old unit NUMBER'
3.11) Enter number g as 'New unit NUMBER' and press <Enter>
3.12) Enter "000"
3.13) Select 'No'
148
GILES/Para 3.3 for users: How to
...
3.3.33 How to dump a screen image within GILES
Dump the screen
1.1) Retrieve the requested map as high resolution image
1.2) After final display, press F9 function key
1.3) Give the number (1-9) of the stored image
Retrieve the screen dump
2.1) Main Menu: Select 'Overlay/reprint of previously configured maps'
2.2) Select 'Screen dump'
2.3) Choose the number of the saved image (step 1.3)
149
GILES
PART C:
For System Analysts
Chapter 4) Data Structure (References)
Appendices
GILES/Para 4.1 for System Analysts: Data Structure
150
4 DATA STRUCTURE (References)
4.1 INTRODUCTION
This chapter is addressed only to the system analyst who is setting up GILES with all data
entry and processing facilities.
It is possible to run GILES following the menus on the screen or the Users Manual in the
previous Chapter: No knowledge of the structure of GILES, of the data files or of the programs is
required !
Even though, this chapter serves three functions:
To prevent that GILES becomes a 'black box', not knowing what is going on with the
maps overlays and evaluation assessments
To give system analysts the chance to modify the maps or the data in the most efficient
way
To help in case of troubie shooting
This chapter is only for the system analysts which have
an appropriate knowledge about computer processing,
data structuring, DOS and high-level languages !
This chapter shall only work as a reference !
The software package consists of
21 programs partly to be overlaid during program execution,
22 types of data files serving specific processing needs
Perhaps the most important technical topic wtthin the field of GIS concerns the appropriate data
structures for storing and manipulating very large quantities of spatially-referenced data
(Coppock/Anderson 1987).
Even though this should not be the concern of the user, it is part of the problem of setting up a
new database, e.g. of a new study area. Therefore, the 'system analyst' installing or modifying the GILES
system should be awre of the structure of all data files. This is explained in detail in Section 4.2.
GILES/Para 4.1 for System Analysts: Data Structure
151
General Retrieval Procedure for Land Evaluation
Computer
File
MAP
<---Mapping unit code
V
Mapping Unit
V
'Base map'
<
Translation Table
V
Land Characteristic
V
'Parametric base map'
<-- Land Quality Model
V
Land Quality
<-- Land Evaluation Model
V
Land Suitability Assessment
MUC
GILES/Para 4.1 for System Analysts: Data Structure
152
In the particular case of processing soil maps and soil data, one additional step is
required as soil
mapping units can consist of more than one soil type:
Computer
File
MAP
<-- 'Mapping unit code'
file of soil map
MUC
V
Soil Map ing Unit
<-- Soil mapping unit
composition
MCP
V
Soil Type
<-- Soil type characterization
TCH
V
Land (Soil) Characteristics
<-- Land Quality Models
in soil suitability
assessment:
'sosuit'
V
Land (Soil) Quality
<-- Rating system of land
quality models
in soil suitability
assessment:
'sosuit'
V
Land (Soil) Suitability Assessment
The 'Mapping unit codes' files handle the decoding of computer internal map files into understandable mapping codes (equals to 'indicator; see Section 3.2.3; p.98)
Translation tables handle the decoding of computer internal files into a specific information
retrieval through an information matrix.
GILES/Para 4.2 for System Analysts: Data Structure
153
4.2 DATA FILES ( REFERENCES )
4.2.1 Description of Data Files
Each file has a file narne of rvot more than eight characters, a pericxi and a file name extension (file
type) of three characters. All file names and extension names are defined as follows:
Table 4.1
Data Files
Data
Digitized maps
Area sizes
Mapping unit codes
FilT
DGbmn
ARSbm
ab
Soil mapping unit composition SOIL
SOIL
Soil type names
SOIL
Soil type characterization
aALT
Altitude correlation
Administrative unit
aADM
characterization
aPREC
Precipitation raw data
aREL
Raingauge relations
Gamma distribution of precipiaGAM
cation data
Expected precipitation values
at given reliability level aPREC
Precipitation figures of
(up to 20) years
aPREC
Land characteristic names
LCHAR
Land characteristic class
names
LCHATN
Structural characteristic
aATN
class names
LUT/crop names
LUT
Study area names
STAREA
Crop requirements
CREQo
Help menus
HELP
Configured map files
Explanation files
1
The short reference name is printed in bold.
Name
.MAP
.DAT
MUC
.MCP
.STN
.TCH
.COR
ACH
Explanation
Subp.
directory Sect.
\ADG\
\ADG\
\ADG\
4.2.2
4.2.3
4.2.4
155
157
158
\LANDEV\
\LANDEV\
\LANDEV\
\LANDEV\
4.2.5
4.2.6
4.2.7
4.2.8
160
162
163
165
.DAT
.DAT
\LANDEV\ 4.2.9 167
\LANDEV\ 4.2.10 168
\LANDEV\ 4.2.11 169
DAT
\LANDEV\ 4.2.12 170
.RLV
\LANDEV\ 4.2.13 171
.TWY
.NAM
\LANDEV\ 4.2.14 172
\LANDEV\ 4.2.15 174
NAM
\LANDEV\ 4.2.16 176
.NAM
.NAM
.NAM
DAT
.TXT
DGRCMPmn.MAP
DGRCMP .NAM
\LANDEV\
\LANDEV\
\LANDEV\
\LANDEV\
\LANDEV\
4.2.17
4.2.18
4.2.19
4.2.20
4.2.21
\INTERM\ 4.2.2
\INTERM\ 4.2.2
177
178
180
182
183
156
171
GILES/Para 4.2 for System Analysts: Data Structure
154
where: A
short form of study area name (abbreviation,
3 or 4 letters; e.g. BORK, BICH, HOS)
short form of map theme (abbreviation,
3 or 4 letters; e.g.SOIL, ALT, PREC)
see Glossary: Predefined maps
m map sheet number (1-9, followed by A-Z)
n run number of the map sheet (1-4)
2 1 or 2
p number 1-9
All files, except of the first three and of the last two types, belong to the 'general data set' and are
therefore in the GILES subdirectory \LANDEV\.
Files of the first three types are located in the area specific subdirectory (e.g. \ETHDG \), if stored
on harddisk. If floppy disks are used (e.g. for backup), one complete map (e.g.altitude map of
Ethiopia) should be stored on one disk together with the mapping unit code Tile and the area
size files (e.g. all DGALTmn.MAP files with ETHALT.MUC and ARSALTm.DAT).
Files of the last two types are created only for temporary use.
GILES/Para 4.2 for System Analysts: Data Structure
155
4.2.2 Digitized Map File ('MAP file')
Function:
All entered base maps are stored in digitized form in map files with extension MAP. The principle of
map digitizing based on a grid cell system is explained in Section 2.2.4 (p.26). These files are the
basic information carrier of inventoried data any map outputs are derived from.
These files will be created or modified through option 'Entry of base map' of the Main Menu (see
'How to enter a map', p.126).
Nomenclature:
The syntax of these map files is:
DGbmn.MAP
where: b
in
n
theme of map (e.g.SOIL, ALT, PREC, VEG, ADM, AEZ)
see Glossary: Predefined maps
map sheet number (1-9, followed by A-Z)
run number of map sheet (1-4)
e.g. DGSOIL43.MAP digitized soil map of the 3.run of map sheet 4
The area name is not incorporated in the file name. Thus, care has to be taken, that the map files
are always stored on the sulxiirectory of the right area (e.g. C: \ETHDG \)
!
Structure:
Each digitized map is split into four runs consisting of:
111 rows in N-S-direction and 28 columns in W-E-direction.
Each run is constituted by one random-access digitized map file, i.e. 4 map files make up one map
sheet. Each run is input and read as a random access file with:
column number of the grid cell (X, starting with 1 at the W margin, up to 28 at the E margin),
as the field number,
row number of the grid cell (Y, starting with 1 at the S margin, ending with 111 at the N margin),
as the record number.
The pixel is stored with Its number of the occurring mapping unit which serves as 'pointer'.
Therefore, each digitized map file has 111 records, and takes 6272 bytes of computer memory. An
average study area consisting of 5-10 map sheets (some 60000-120000 pixels) takes some 150250 kB (for file sizes see App.6; p.208).
GILES/Para 4.2 for System Analysts: Data Structure
156
Example:
The pixel (6.25 ha) of the soil map of Borkena, sheet 4, run 1, column (x coordinate) 12, row (y
coordinate) 89 is stored in file DGSOIL41 under record 89, field number 12. It has value 29, which
stands for the mapping unit C2-3, expressed by the symbol
on computer outprint maps.
**********************
Special form of MAP files:
'Configured' Map File ('CMP file')
Function:
Each map retrieved, compiled or modified through GILES can be stored as a 'new map' in a
'composite' map file in C:, subdirectory \INTERM \. They can be retrieved for further processing or
reprint through options 'Overlay/reprint of previously configured map(s)' or - in case of suitability
assessment - through 'Land suitability' of the Main Menu.
These 'configured' map files are stored, if one of the options 'as (..) but with storage on
C:\INTERM\ 'in the output selection menu is chosen and the storage number p (see below) is
defined (range 1-9). With storage number 10, a similar configured map is stored which is reserved
for retrieval in ASCII.
They are always created together with the documentary file 'DGpCMP.NAM' explaining the
'configured' map file.
Nomenclature:
The syntax of these map files is:
DGpCMPmn.MAP
together with DG CMP.NAM
where: m map sheet number (1-9, followed by A-Z)
n run number of map sheet (1-4)
p storage number (1-9): 1 climatic suitability
2 soil suitability
3 land suitability
e.g. DG1CMP43.MAP climatic suitability map of the 3.run
of map sheet 4
with DG 1CM P.NAM
Structure:
The structure is the same as explained as above, but saving and retrieving differ slightly: Each pixel
consists of two letters; all pixels of one row form one string which is added to array DCBA$(1..111).
GILES/Para 4.2 for System Analysts: Data Structure
157
4.2.3 Area Size File ('ARS file')
Function:
For each base map the area sizes of all mapping units are compiled and stored in the area sizes
files. The area sizes for the entire study area, for each individual map sheet or for each map run
can be retrieved through option 'Area Sizes'.
The area size files are created through menu 'Did you run the area sizes before ?' (option 'no')
when retrieving the area sizes (see 'How to calculate the area sizes'; Section 3.3.13; p.120).
Nomenclature:
The syntax of these area sizes files is:
ARSbm.DAT
where:
theme of map (e.g.SOIL, ALT, PREC, VEG, ADM, AEZ)
see Glossary: Predefined maps
m map sheet number (1-9, then A-Z)
e.g.ARSSOIL4.DAT area sizes of the digitized soil map of sheet 4
The area name is not incorporated in the file name. Thus, care has to be taken, that the map files
are always stored on the subdirectory of the right area (e.g. C:\ETHDG\) !
Structure:
Running through a map (run) will count the number of pixels occurring in the particular run for
each individual mapping unit. The number of the mapping unit serves hereby as the record number in these random access files, the run number of the map sheet as the field number.
Example:
The outprint of the area sizes of the administration units of Borkena is shown in Table 3.3 (p.61). It
can be seen that the Peasant Association 0117 covers some 2268 ha, equals 0.9 % of the total
study area.
GILES/Para 4.2 for System Analysts: Data Structure
158
4.2.4 Mapping Unit Code File (MUC file')
Function:
The mapping unit code file with extension MUC contains all codes (mapping symbols) of a particular thematic map of a project area including the symbols represented in map outprints (fonts).
These mapping unit codes are given by the authors of the map. It is the only data set which has
to be entered before the map input ('digitizing') starts because each mapping unit has to be input with its given symbol (mapping unit code).
First definition arxi later modifications are made through option 'Database' in the Main Menu, then
'Mapping unit codes'(see Section 3.3.18(2); p.126). Altematively, the codes can be input into Lotus
and then imported into GILES.
In case of changing the mapping unit, attention has to be given that all concerned mapping units
will be labeled with the new codes afterwards ! (See 'How to add a mapping unit', Section 3.3.32;
p.147).
Through changing the second code, it is possible to modify the outprint code for the individual
mapping unit(s) (see 'How to change fonts': Section 3.3.11, p.118, and App.9, p.255 for recommended fonts).
Nomenclature:
For each project area and for each thematic input map, a separate list of mapping unit codes are
given by its author(s). This is entered into:
212.MUC
where: a
name of study area (e.g. BORK, BICH, HOS)
see Glossary: Predefined maps
theme of map (e.g.SOIL, ALT, PREC, VEG, ADM, AEZ)
e.g. HOSADM.MUC codes of the mapping units of the administration map of Hosaina
The area name is not incorporated in the file name. Thus, care has to be taken, that the map files
are aJways stored on the subdirectory of the right area (e.g. C:\ETHDG \) !
Structure:
The soil mapping unit code file is a two-dimensional array with the number of rows equals to the total number of mapping units and with two columns. Thus, each line stands for one mapping unit.
Column 1 gives the name of the mapping unit (e.g. A1-2), column 2 gives the number of the symbol on the map outprint (in ASCII code).
(In the programs ('digittabVdatach) the mapping unit code file is converted to the array
ACOD$(a,b) and MUC$(a,b)) respectively).
Together with the digitized map files (see Section 4.2.2; p.171) and the area size files (see Section
4.2.3; p.173) they are the only data files to be stored under the subdirectory of the area name !
GILES/Para 4.2 for System Analysts: Data Structure
159
mple:
In the soil map of the Borkena study area, 57 different mapping units were identified by the soil
inventory,e.g.A1-1 (flat alluvial soil, printed as "a") or L (Lithosols, printed as "0").
No.
Mapping
Unit Code
ASCII code
for printout
1
M1
2
A1-1
A1-2
A1-3
A1-4
100
B6
126
3
4
5
55
56
57
(58
OUT
Printout on
matrix printer
64
97
98
99
48
42
46
a
o
A good map should have as many selfexplicatory codes as possible. This request has to be fulfilled
by the authors. At soil maps e.g. there are various standard systems of coding the soil associations; mapping unit codes of the administrative maps can be a combination of the number of the
district plus the number of the Peasant Association, e.g. 0115: 15.PA in Woreda 01.
GILES/Para 4.2 for System Analysts: Data Structure
160
4.2.5 Soil Mapping Unit Composition File ('MCP file')
Function:
The soil mapping unit composition file with extension MCP gives the information about the various
soil types forrning a soil mapping unit. In homogeneous areas at large inventory scales, a mapped
soil unit (recommendable with an appr. minimum size of not less than 50 ha at the scale of
1:50,000) will consist of one soil type. In heterogeneous areas and in smaller mapping scales,
several soil types will forrn a mapping unit: soil associations. In the present GILES version, up to 4
different soil types will form a mapping unit.
These files are created or modified through option 'Database' of the Main Menu, then option 'Soil
Mapping Unit Composition'. Altematively, the composition table can be input into Lotus and then
imported into GILES.
In case of a change, care has to be taken that the soil type characterization file might have to be
adj usted.
Nomenclature:
For each study area, a separate soil mapping unit composition is given by the soil survey. It is filed
under the name:
aSOILMCP
where: a
name of study area (e.g. BORK, BICH, HOS)
e.g. BORKSOIL.MCP information about the composition of all soil mapping units of Borkena
Structure:
The soil mapping unit composition file is a two-dimensional integer array with each row standing
for one soil mapping unit (a). Therefore, this array has as many rows as soil mapping units occur
(MAXUNS). The column indicates the importance of the soil type in the soil mapping units.
Table 4.2
Structure of Soil Mapping Unit Composition
Column
Dominance
1
>90 %
2
75 %
3
50 %
4
50 %
5
25 %
6
25 %
7
25 %
If a figure exists in the first column, it indicates the dominant soil (> 90 % coverage of the unit).
Figures in the following columns give the soil type coverage in the association.
8
25 %
GILES/Para 4.2 for System Analysts: Data Structure
161
(This data array is handled in the programs under the name of SMUCP%(g,12) with a not greater
than MAXUNS, k not greater than STPMU).
Example:
In the Borkena study area, the soil mapping unit composition looks like:
Soil Types
Soil
Mapping
Unit
Area Coverage
>90%
1
2
3
5
0
0
56
64
(The numbers 5,17,1,4,64 are soil types)
70%
50%
50%
25%
25%
25%
25%
0
0
0
0
0
0
0
1
0
0
0
0
0
0
0
0
0
17
17
0
0
4
GILES/Para 4.2 for System Analysts: Data Structure
162
4.2.6 Soil Type Name File ('SIN file')
Function:
Different soil types are occurring in each area. Due to the scale of the inventory it is mostly not
possible to map the so il units, but only soil complexes (soil associations, soil complexes, or 'soil
mapping units'). The list with the names of all occurring soil types (in some studies called '(and
units') is given in this soil type name file with extension SIN.
Input and modifications Is made through option 'Database' of the Main Menu, then option 'Soil
Type Names'. Alternatively, the names can be input into Lotus and then imported into GILES.
The soil type names are not essential for land evaluation assessments.
Nomenclature:
The name of these soil type name files is:
aSOIL.STN
where: a
name of the study area (e.g.BORK, BICH, HOS)
e.g. BORKSOILSTN list of the soil type names of Borkena
Structure:
The soil type name file is a one-dimensional string array with the number of soil types as its size.
(Depending on the purpose of the retrieval of these files, they are handled in the programs either
as STN$(a) array or as MUCVa) array with a not greater than AMST and STN respectively).
Example:
In Borkena, there are 64 soil types, beginning with no.1 as an eutric Gleysol (Gel) and ending with
no.64 as Uthosol (I).
No.
1
2
3
64
Soil
Type
Gel
Ge2
Gcl
I (in B6/L)
GILES/Para 4.2 for System Analysts: Data Structure
163
4.2.7 Soil Type Characterization File (TCH file'l
Function:
The soil type characterization file with extension TCH gives all essential information about the 50
soil specific land characteristics for each soil type occurring in the study area. This list of land
characteristics is determined by the necessity for land evaluation. All values in this file are coded
following the legend of the land characteristics (LCHATN file, see Section 4.2.16; p.176). The
specific parameters for these land characteristics for the considered soil type are taken out of this
file after the soil type is called through the soil mapping unit composition file (see Section 4.2.5
above).
Entry or modifications can be made through option 'Database' of the Main Menu, then through option 'Soil type characterization'. Alternatively, the table can be input into Lotus and then imported
into GILES.
It is recommended to print first the land characteristics (LCHATN file) to see the classes and their
ranges.
Nomenclature:
For each study area, the specific land characteristics for each soil type are given by the soil inventory. The name of this file is:
gSOIL.TCH
where: g name of study area (e.g. BORK, BICH, HOS)
e.g. BORKSOILTCH information about all land characteristics of all soil types in Borkena
Structure:
The soil type characterization file is a two-dimensional integer array with the soil types as the rows
and the land characteristics as the columns. Therefore, it has as many rows as soil types and as
many as 50 rows.
(In the programs, the soil type characterization file is converted into the STCH%(g,,b) array wfth g
not greater than AMST, .t2 not greater than 50).
GILES/Para 4.2 for System Analysts: Data Structure
164
Example:
There are 64 soil types in Borkena study area, giving a soil type characterization file of 64 rows and
50 columns. Each figure stands for the specific land characteristic class of the referring soil type,
e.g. soil type no.20 (Lo2, in line 20) has in land characteristic no.4 (mineral fragments of the topsoil, in column 4) a value of 2, which stands for a mineral fragments content of 0-15%).
Soil
Drai
Type
nage
1
2
3
20
63
64
t
Texture
top sub
Min. fragm. Soil Tops .
top sub
depth depth
3
3
3
16
16
9
9
1
16
3
7
7
Pond. Flash
.
flood.
1
1
6
2
3
9
1
6
1
2
0
16
1
1
6
3
9
1
0
17
17
2
1
5
3
1
1
19
19
19
19
4
4
9
9
2
2
1
1
1
1
1
1
1
0
0
0
0
GILES/Para 4.2 for System Analysts: Data Structure
165
4.2.8 Altitude Correlation File ('COR file')
Function:
Temperature and potential evapotranspiration correlate to a high degree with the altitude as]. The
values to calculate the annual and monthly temperature and potential evapotranspiration out of the
altitude are given in this attitude correlation file with extension COR. Thus, it presents climatic land
characteristics. For both the temperature and the potential evapotranspiration the intercept as well
as the slope of the regression can be read out of this data file.
If the PET-altitude correlation varies in the study area, it is possible to define a second PET-altitude
correlation being effective in selected, predefined precipitation mapping units.
The formula
y=a-b*x
where: a
b
x
intercept (C or mm)
slope (C/100 m or mm/100 m), positive
altitude (in 100 m)
enables the calculation of the mean annual and monthly temperatures (C) or of the annual and
monthly potential evapotranspiration (mm/year).
Entries or changes can be made through option 'Database' of the Main Menu, then option
'ALtitude correlation'. Monthly PET figures can be entered with:
intercept and slope of the regression of every month, or:
intercept and slope of the annual PET regression and the monthly percentages of the
annual amount.
Nomenclature:
The values for the definition of the regression equation are calculated out of the temperature,
potential evapotranspiration, and altitude figures of the meteorological stations. The data files are
stored under the name:
gALT.COR
where: g
name of study area (e.g. BORK, BICH, HOS)
e.g. BORKALT.COR correlation figures for the estimate of annual and monthly temperature and
PET values
GILES/Para 4.2 for System Analysts: Data Structure
166
Structure:
The altitude correlation file is a two-dimensional array with two columns: one for the intercept of
the regression line, the other one for its slope, and vvfth 26 or 39 rows (if two PET-altitude regressions occur): Row 1 stands for the annual temperature, row 2-13 for the monthly temperature
figures, row 14 for the annual potential evapotranspiration, row 15-26 for the monthly potential
evapotranspiration figures, eventually rows 27-39 for the monthly potential evapotranspiration
figures of the second regression.
(In the application programs, this file in assigned to the array ALT(,) with
not greater than 39, b
either 1 or 2).
Example:
In the Borkena study area, the intercept (a) for the temperature of July is 33.8 C, the regarding
slope is 0.71 C/100 m. Therefore, the July temperature at 2000 m is
y = 33.8 -0.71 * 20 = 19.6 C.
0.60
Temperature annual 30.5
0.50
January 26.7
"
"
February 28.1
0.52
GILES/Para 4.2 for System Analysts: Data Structure
167
4.2.9 Administrative Unit Characterization File ('ACH file')
Function:
The administrative unit characterization file with extension ACH gives any information about the 50
structural characteristics for each administrative unit (e.g. PA) occurring in the study area. All
values in this file are coded following the legend of the structural characteristics (aATN.NAM file,
see Section 4.2.17; pin). The specific parameters for these structural characteristics for the administrative unit are taken out of this file.
Entry or modifications can be made through option 'Database' of the Main Menu, then option
'Administrative unit characterization'. Alternatively, the table can be input into Lotus and then imported into GILES.
It is recommended to print first the structural characteristic classes (a.ATN file) to see the classes
and their ranges.
Nomenclature:
The syntax of these files is:
aADM.ACH
where: a
name of study area (e.g. BORK, BICH, HOS)
e.g. BICHADM.ACH information about all structural characteristics of all administrative units
in Bichena
Structure:
The administrative unit characterization file is a two-dimensional integer array with the administrative units as the rows and the structural characteristics as the columns. Therefore, it has as many
rows as administrative units (e.g. PA) and 50 columns.
Handling and structure of this file is similar to the 'soil type characterization file (TCH), see Section
4.2.7 (p.163).
mple:
There are 162 Peasant Associations in the Hosaina study area, giving an administrative unit
characterization file of 162 rows. Each value stands for the specific structural characteristic class of
the referring PA.
The form of this matrix is the same as of the soil type characterization file, see Section 4.2.7
(p.163).
GILES/Para 4.2 for System Analysts: Data Structure
168
4.2.10 Precipitation Raw Data File f'PREC.DAT file")
Function:
The raw monthly or decadal rainfall data are entered into this file and give the possibility for further
processing (calculation of mean, standard deviation etc., interpolation of data, generation of rainfall
data) or for direct input (if the data set is sufficient) for length of growing period calculations or for
climatic suitability assessments.
Data entry mode can be accessed through option 'Database' in Main Menu, then option
'Precipitation data', then option 'Input precipitation data'. As an alternative, precipitation data can
be entered into Lotus 1-2-3 spreadsheets and then incorporated through above mentioned options
with option 'Input of one station from Lotus file' into the 'Precipitation raw data' file (see 'How to
import precipitation data', Section 3.3.28; p.142).
Nomenclature:
The syntax of this file is:
aPREC.DAT
where: a
name of study area (e.g. BORK, BICH, HOS)
e.g. BICHPREC.DAT monthly precipitation figures of all precipitation mapping units of the
Bichena area
Structure:
In this sequential file the rainfall (in 1/10 mm) is stored for each station unit for each
month/decade for e,ach recorded year. Missing data are coded as -990. A figure at the begin of the
file indicates whether monthly or decadal data are recorded.
Example:
The precipitation data set in this file looks like any datasheet of precipitation data recorded at
Meteorological Agencies wtth the years as the rows and the months/decades as the columns, e.g.:
1961
1962
3.964
1980
Jan Feb
53.4 32.4
0
12.6
34.6 12.4
41.9 23.9
Mar
Apr
May
79.5
91.0
27.9
79.4
53.4
40.5
23.5
34.9
12.6
x
0 0 0
0
0
65.8
...
GILES/Para 4.2 for System Analysts: Data Structure
4.2.11
169
Rainqauge Relation File CREL file')
Function:
If the available rainfall data set is not sufficient (i.e. many missing data), it is necessary for the calculation of long-term mean values to refer to nearby situated raingauges with a similar rainfall pattem and to compare with the data available there.
This is done through option 'Database' of the Main Menu, then option 'Precipitation data', then option 'fill missing data (interpolation model)'.
For this interpolation model it is necessary to know about the reference relations between the raingauge stations. These references are stored in the 'Raingauge relations' file. They have to be entered before processing of the interpolation. Rules defining the references between raingauges
have to be followed strictly (see App.7.7; p.237).
Nomenclature:
The syntax of this file is:
aREL.DAT
where:
name of study area (e.g. BORK, BICH, HOS)
e.g. BICHRELDAT reference relations of all raingauge stations in Bichena area
Structure:
In this sequential file the relations are stored for each station unit as a two-dimensional array with
the rows (1.dimension) standing for precipitation units and 7 columns standing for:
1
Station number
2-4 Reference station number (1-3 reference stations accepted)
5-7 Weighting of these 1-3 reference stations
mple:
Station
1
2
3
4
Reference station
I
II
4
3
6
0
3
3
0
2
III
0
1
0
8
of I
Weighting
of II of III
1
1
0
2
0
1
0
1
0
3
1
1
GILES/Para 4.2 for System Analysts: Data Structure
170
4.2.12 Gamma Distribution of Precipitation File ('GAM file')
Function:
To execute the gamma distribution for processing of a poor rainfall data base, mean (without the
months of no-rainfall), z, ndard deviation (without the months without rainfall) and the probabilityof-no-rain have to be known. They are stored in the 'gamma distribution of precipitation file'. Based
on these figures, gamma distribution is applied to create any number of precipitation values. These
data have to be entered before processing starts.
The access is through option 'Database' of the Main Menu, then option 'Precipitation data', then
option 'calculate long term averages' or 'generate randomly distributed rainfall figures'.
(The results of the interpolation model (see Section 4.2.11, above) can be stored in a different
gamma distribution file, called 'gRES.DAT').
Nomenclature:
The syntax of this file is:
aGAM.DAT
where: 2 name of study area (e.g. BORK, BICH, HOS)
e.g. BICHGAM.DAT characterization values of all precipitation
mapping units of Bichena
Structure:
The sequential access file stores:
monthly mean without the months without rainfall,
monthly standard deviation without the months without rainfall, and
probability of no rainfall
for each month/decade for each precipitation mapping unit in mm.
Example:
Columns 10-12 of the processed precipitation data of one station in Table 3.13 (p.90) show hovv
the gamma distribution output data.
GILES/Para 4.2 for System Analysts: Data Structure
171
4.2.13 Expected Precipitation Values at Given Reliability
('RLV file')
Function:
The precipitation map supports the information about the mean and the precipitation to be expected at 6 reliability levels (90%, 80%, 75%, 66%, 50%= median). These data are stored in the
'Expected precipitation values at given reliability file' with extension RLV (see Section 4.2.11,
above, and App.8.22; p.253).
They can be retrieved for any location by option 'Site-specific information' in the Main Menu.
Nomenclature:
The syntax of these files is:
gPREC.RLV
where: a
name of study area (e.g. BORK, BICH, HOS)
e.g. BICHPREC.RLV annual and monthly mean and annual and monthly precipitation to be
expected at 4 reliability levels of all precipitation mapping units of the Bichena area
Structure:
The random access file with 7 records for the different reliability levels is stored under record number:
(mapping unit - 1) * 13 + month + 1, or:
(mapping unit - 1) * 13 + decade + 1
Example:
The example of site-specific information retrieval in Table 3.4 (p.63) gives the lines with the annual
and monthly precipitation to be expected at various reliability levels as the output of this file.
G1LES/Para 4.2 for System Analysts: Data Structure
172
4.2.14 Precipitation Figures of (20) Years File (TWY file')
Function:
The calculation of the growing period to be expected has to calculate first the growing periods of a
number of years (e.g. 20 years) and then to incorporate the reliability level. Therefore, the
monthly/decadal precipitation figures of the considered period (i.e. 20 years) have to be taken out
of this 'precipitation figures of (20) years file' with extension TWY. This is essential in the application programs for the assessment of the growing period.
Monthly or decadal precipitation figures of all mapping units of the study are,as are either:
collected by Meteorological Services on monthly or decadel basis, input and then converted
from 'precipitation raw data file' (...PREC.DAT) to this 'precipitation figures of (20) years
file' (.TWY) by option'Database' in the Main Menu, then option 'Precipitation data' and
finally option 'Transfer into TWY file'; or:
if the original data base is not available or not very reliable, monthly precipitation figures will be
simulated ('generated') out of the 'gamma distribution file' (...GAM.DAT) through option
'Database' in the Main Menu, then option 'Precipitation data', then option 'Produce randomly distributed rainfall figures'. The generated monthly or decadal precipitation figures
of (20) years will be stored under this 'precipitation figures of (20) years' file.
Nomenclature:
These precipitation figures are stored under file name:
APREC.TWY
where: a
name of study area (e.g. BORK, BICH, HOS)
e.g. BICHPREC.TWY original or simulated monthly precipitation figures of (up to 20) years of all
precipitation mapping units of the Bichena area
Structure:
This file is random access file with 26 different fields containing the rainfall values of (20) years and
additionally expected and simulated mean(0) (not used), standard deviation(0) (not used) and
probability-of-no-rain (not used) of a particular month/decade of a particular mapping unit. The
record number of the file gives the information about month/decade and mapping unit (station) by
the formula:
(mapping unit - 1) * 12 + no.of month + 1, for monthly data; or:
(mapping unit - 1) * 36 + no.of decade+ 1, for decadal data
GILES/Para 4.2 for System Analysts: Data Structure
173
The first record is reserved for two control variables:
Generated (1) or not (0) in field 1,
monthly (12) or decadal (36) data in field 2.
All values are stor
in integer figures in their ten times value.
Example:
The data look like any other precipttation data (e.g. in file 'precipitation raw data', ...PREC.DAT),
but without any data gaps ('x').
GILES/Para 4.2 for System Analysts: Data Structure
174
4.2.15 Land/Structural Characteristic Name File CLCHAR file')
Function:
139 characteristics concerning the 'land (physical properties) or the 'structure' (infrastructure or
administration) can be entered and retrieved from GILES.
The first 89 land characteristics are measurable or estimatable 'physical' at-tributes of the land to
describe the land qualities and thus the ability of the potential of the land for certain land uses.
They serve as the main input for land suitability assessments and are retrieved through soil
(mapping) units, altitude or precipitation (mapping) units.
Up to 50 characteristics describe the population, infrastructure, administration and food situation,
based on administrative units (e.g. PA) and therefore referring to administrative maps.
The names of these land/structural characteristics are stored in this land/structural characteristic
name file'.
Modifications can be made through option 'Database' of the Main Menu, then option
'Land/Structural characteristics names'.
Nomenclature:
The name of this one file is:
LCHAR.NAM
and is accessible for any project area in the same way.
Structure:
This file is a random access file converted into a one-dimensional string array with 139 lines; each
line stands for the name of one land/structural characteristic.
mple:
The first 26 land characteristics refer to physical soil properties, no. 27-50 to chemical soil
properties, no.51-89 to climatic land characteristics, no.90-139 to structural characteristics. Not all
of them are finally defined.
175
GILES/Para 4.2 for System Analysts: Data Structure
Table 4.3
1 Drainage
2 Texture (tops.)
3 Texture (subs.)
4 Mineral fragment (tops)
5 Mineral fragment (subs)
6 Depth
7 Topsoil depth
8 Ponding
9 Flash flooding
10 Flooding
11 Surface stoniness
12 Surface rockiness
13 Erosion/gully/badland
14 Necessity for gully
erosion measures
15 Mean slope
16 Mean maximum slope
17 Topography
18 Microrelief
19 Slope shape
20 Slope length
21 Groundwater level
22 Permeability
23 Consistence
24 Structure (tops.)
25 Surface sealing
26 Bulk density
27 Organic matter
28 N t (tops.)
29 N t (subs.)
30 P avail (t°Ps-)
31 Ca exc
32 Mg exc (t°Ps')
33 Mg exc (subs.)
34 K exc (tops.)
35 K exc (subs.)
36 pH (tops.)
37 pH (subs.)
38 CEO (tops.)
39 SS (tops.)
40 BS (subs.)
41 Na exc (tops.)
42 Na exc (subs.)
43 EC (tops.)
44 EC (subs.)
45 Soil type
46 Erodibiltty (kc)
Names of Land/Structural Characteristics
49 (not defined yet)
50 (not defined yet)
51
Annual temperature
52-63 Monthly temperature
64 Annual PET
65-76 Monthly PET
77 Annual precipitation
78-89 Monthly precipitation
90 Woreda (District)
91
Awraja (Province)
92 Region
93 Population
94 Present population density
95 Population density in 10 y
96 Population density in 25 y
97 PA members
98 TLU
99 TLU density
100 Cows
101
Oxen
102 Cattle (total)
103 Cattle density
104 Sheep
105 Sheep density
106 Goats
107 Goats density
108 Equines
109 Equines density
110 Access
111 Education
112 Medical situation
113 Population support capacity
114 Population support capacity in 10 y
115 Population support capacity in 25 y
116 AGH (Arable + grazing land/househ)
117 Surplus producing Woredas
118 Ongoing Farming Research
119 Livestock Canying Capactty
120 Grazing Pressure
121 (not defined yet)
139 (not defined yet)
GILES/Para 4.2 for System Analysts: Data Structure
176
4.2.16 Land Characteristic Class Name File (LCHATN file')
Function:
Each of the 50 soil land characteristics (see Section 4.2.15, above) is grouped into discrete classes
with individual class ranges and Gass names. They are filed under this 'land characteristic class
name' file.
The names can be retrieved or changed through option 'Database' in the Main Menu, then 'Land
characteristic classes names'.
Attention: Soil characteristics being used for land evaluation assessments should not be redefined!
Nomenclature:
The name of this one file is:
LCHATN.NAM
and is accessible for any project area in the same way.
Structure:
This file is a random access file with 50 (=total number of land characteristics) as the total number
of records. Thus, the number of the considered land characteristic is the taken record number, the
class within this land characteristic is the field number.
At the retrieval, the names of the called land characteristic are converted into a one-dimensional
string array with 30 lines. Each line stands for the name of one land characteristic class.
The handling and structure of this file is similar to that of aATN.NAM file (see Section 4.2.17) which
handles structural characteristics but area-specifically.
Example:
The land characteristic class names of the first land characteristic: drainage, are as follows:
1 very poorly drained
2 poorly drained
3 imperfectly drained
4 moderately well drained
5 well drained
6 somewhat excessively drained
7 excessively drained
GILES/Para 4.2 for System Analysts: Data Structure
177
4.2.17 Structural Characteristic Glass Name File CATN file')
Function:
Up to 50 structural characteristics can be set to define the characteristics of the administrative
units (see Section 4.2.16 above). The class names within these structural characteristics are filed
under this 'Structural characteristics classes file', individually for ch area.
The names can be retrieved or changed through option 'Database' in the Main Menu, then option
'Land/Structural characteristic class names'.
Nomenclature:
The syntax of these files is:
aATN.NAM
where: a
name of study area (e.g. BORK, BICH, HOS)
e.g. HOSATN.NAM structural class names of Hosaina study area
Structure:
This file is a random access file with 50 (=total number of structural characteristics) as the total
number of records. Thus, the number of the considered structural characteristic is the taken record
number, the class within this structural characteristic is the field number.
At the retrieval, the names of the called structural characteristic are converted into a onedimensional string array with 30 lines. Each line stands for the name of one structural characteristic
class.
The handling and structure of this file is similar to that of the LCHATN.NAM file (see Section 4.2.16)
which handles physical characteristics.
Example:
The structural characteristic class name of the third structural characteristic: population density, in
Hosaina area reads as:
1
2
3
<25 cap/km2
20 - 50 cap/km2
50 - 75 cap/km2.
GILES/Para 4.2 for System Analysts: Data Structure
178
4.2.18 LUT/Croo Name File ('LUT file')
Function:
Several crops were selected by either being representative or dominant for the (sub)tropical highlands or as having a high potential for the future development in this environment.
This list is given in the 'LUT/crop name file.
In a next stage, these crops can be combined to crop mixtures and later to farrning systems ('Iand
utilization types'). Thus, in the first instance, this file - as well as the respective suitability assess-
ments - will handle the names of crops (e.g. wheat, sorghum, coffee), species and generally
defined major kinds of land use, in the second instance the names of crop mixs (e.g.barleyensete-horsebean zone).
A more accurate, but more time consuming method for the assessment of crop mix suitabilities is
to overlay the suitability assessments of the various components (crops) by 'overlay previously
configured maps'.
Modifications can be made through option 'Database' of the Main Menu, then by option 'LUT/crop
names' (see 'How to add a crop', Section 3.3.12; p.119).
In case of a change care has to be taken that the referring crop requirements have to be changed
as well.
Nomenclature:
The name of this one file is:
LUT.NAM
and is accessible for any project area in the same way.
Structure:
This file is a random access file converted into a one-dimensional string array; each line stands for
one crop name.
GILES/Para 4.2 for System Analysts: Data Structure
179
Example:
In the present version, this list is:
Table 4.4
List of Considered Crops
1 Sorghum
2 Maize
3 Rice (paddy)
4 Rice (upland)
5 Wheat
6 Barley
7 Teff
8 Oats
9 Field Peas (pis.arv.)
10 Haricot Beans (phas.v.)
11 Horse Beans (vic.f.)
12 Chickpeas (cic.ar.)
13 Lentils
14 Vetch
15 Soybeans
16 Coffee
17 Tea
18 Banana
19 Citrus
20 Sugarcane
21 Pepper
22 Shallot
23 Tomato
24 White potato
25 Sweet potato
26 Cabbage
27 Pineapple
28 Sisal
29 Niger seed
30 Sesame
31 Sunflower
32 Safflower
33 Flax (linseed)
34 Tobacco
35 Cassava
36 Cotton
37 Groundnut
38 Peari millet
39 Finger millet
40 Grape
41 Ensete
42 Cow Pea
43 Maize:Short LGP var.
44 Testcrop A
45 Testcrop B
46
47 (Cattle)
48 (Sheeps/goats)
49 (Fuelwood Forest)
50 (Conservation Forest)Function:
GILES/Para 4.2 for System Analysts: Data Structure
180
4.2.19 Study Area Name File ('STAREA file')
Names and stored characteristics of the considered areas (project areas, regions) where data are
gathered from, entered and retrievable (in the particular subdirectories), are listed in this file. In
particular:
1) Study area name
2) Working abbreviation (3 or 4 letters)
3) Scale of map input (in thousands)
4) Total number of soil types per study area (not essential)
5) Names (list) of additional maps, beyond the predefined set which is: soil, altitude,
precipitation, land use/land cover, administration, agroecological zones,
planning zones
6) Working abbreviations of these additional maps (3 or 4 letters)
7) Names of all map sheets of the project area
8) Working abbreviation of these map sheets
(1 number or 1 letter: 1-9, then followed by A-Z)
9) Relative position of these map sheets to the previous
sheet, where:
6 one down and one to the left
1 one to the right
7 one down and two to the left
2 two to the right
3 three to the right 8 one down and three to the left
4 four to the right 9 one down and four to the left
5 one down
10) N,S,W,E coordinates of these map sheets
Modifications, in particular the entry of new areas, map sheets or additional maps, can be made
through option 'Database' of the Main Menu, then option 'Study areas' (see 'How to add a new
area', Section 3.3.15; p.122).
Nomenclature:
The name of this one file is:
STAREA.NAM
and is accessible for any project area in the same way.
3tructure:
This file is a random access file where parameters 1-4 are stored in one (area-specific) record and
the names and abbreviations of the map sheets (parameter 7 and 8) and, if existing, of the additional maps (parameter 5 and 6).
The number of study areas and the allover maximum number of sheets per study area is saved under record 1.
GILES/Para 4.2 for System Analysts: Data Structure
Example:
Stored data of Borkena study area are:
Study area name : Borkena
Study area abbreviation: BORK
Scale of inventory and data entry: 1:50000
Maps: Soil
Altltude
Precipttation
Land use/cover
Administration
Agroecological Zones
Planning Zones
Linear Features (addftional map)
Mapsheets:
Degaga
no.= working abbreviation: 3
Relation: 2 (two to the right)
N: 11.00
S: 10.75
W: 39.50
E: 39.7545
Harbu
no. =working abbreviation: 4
Relation: 1 (one to the right)
N: 11.00
S: 10.75
W: 39.7545
E: 40.0091
Rabel
no.=working abbreviation: 9
Relation: 6 (one down and one to the left)
N: 10.75
S: 10.50
W: 39.50
E: 39.7545
Kemise
no.=working abbreviation: A
Relation: 1 (one to the right)
N: 10.75
S: 10.50
W: 39.7545
E: 40.0091
181
GILES/Para 4.2 for System Analysts: Data Structure
182
4.2.20 Crop requirement File ('CREQ file')
Function:
The crop requirements describe the various biological characteristics and thus different requirements of crops. They correlate to the land qualities and are expressed with the same (qualitative or
quantrtative) classes as the land qualtties. They are called by the suttability assessment programs
whenever they are required for the matching procedure.
The crop requirements are entered - or can be retrieved - through option 'Database' in the Main
Menu, then option 'Crop requirements' (see 'How to change the crop requirements', Section 3.3.12
(3); p.119).
Nomenclature:
There are two crop requirement files:
CREQ1.DAT and
CREQ2.DAT
Structure:
The number of the crop functions as the record number, the considered quality or characteristic is
the field number. CREQ1 handles crop requirements 1-20, CRE02 21-40.
(The required crop requirements will be checked at the beginning of each application program and
then converted into single variable, such as FLDSENS).
Example:
Example of the crop requirements of wheat is shown in Table 3.11 (p.87) and of all considered
crops for drainage tolerance in Table 3.12 (p.88).
GILES/Para 4.2 for System Analysts: Data Structure
183
4.2.21 Help Menu File CTXT
Function:
This is a GILES intemal file to present context-sensitive help menus individually for each menu of
GILES.
At the Main Menu, he4p menus are individual for each line (option) to present information about
each general facility of GILES.
In the present version, 102 help menus are installed.
They are called by pressing FI function key at the top left side of the keyboard whenever a menu is
displayed.
Modifications can be made through option 'Database' of the Main Menu, then option 'Help menus'.
Nomenclature:
The name of this one help file is:
HELP.TXT
Structure:
Help information is stored in 10 lines in a random access file (each line forms a field). The record
number is given as the menu number shown at the top of the help screen.
Example:
Examples can easily be retrieved by pressing F1.
GILES/Appendix 1: Set Up and Installation
184
Appendix 1
SET UP AND INSTALLATION
This appendix describes how to install GILES in your computer:
Getting started
Configuration
Hard disk installation
Transfer of GILES from one system to another
Backup
App 1.1) GE1 IING STARTED
GILES software system consists of:
6 disks containing all programs and data files:
GILES-1
GILES-2
GILES-3
GILES-4
GILES-5
GILES-6 (general data)
(Listing of all fijes is given in App.6; p.205)
4 disks with sample for tutorial and demonstration:
GILES-SAMPLE-1 (general area data)
GILES-SAMPLE-2
GILES-SAMPLE-3
GILES-SAMPLE-4
Manual of GILES
The system is not copy protected.
GILES/Appendix 1: Set Up and Installation
185
All disks should be backed up on separate disks before the first
installation. This can be done by the DOS command DISKCOPY:
If you have two floppy disk drives:
Type DISKCOPY A: B: , then press <Enter>
If you have one floppy disk drive:
Type DISKCOPY A: A: , then press <Enter>
Insert disk GILES-1 in drtve A
Insert a blank, formatted, double-sided disk in drive B
(tf not existing, in drive A) and press <Enter>
Follow the instruction on the screen
Repeat procedure 2 and 3 for disks GILES-2,GILES-3, GILES-4, GILES-5, GILES-6
The Epson printer (or compatible) should be set up to print in ESC/P mode (see your printer
manual).
***
App.1.2) CONFIGURATION
Every time the computer boots, it checks for the configuration file (CONFIG.SYS). To have GILES
on the computer, this file should allocate 20 as the number of concurrently open files and approximately 30 disk buffers.
Additionally, it is recommended to allocate memory (at least 250 kB) to a virtual disk CD:) drive,
using extended memory (if installed).
Therefore, the configuration file must contain:
FILES = 20 (or greater), and
BUFFERS = 30 (or greater).
A virtual disk drive D (or E) should be installed.
These lines can be inserted or modified in the CONFIG.SYS file through the DOS editor 'edlin' or
through a wordprocessor.
***
GILES/Appendix 1: Set Up and Installation
186
App.1.3) HARDDISK INSTALLATION
GILES will be installed (for the first time) on a hard-disk-system by following procedure. Only if you
get new equipment, you may need to repeat this procedure. Some 4 MB should be free on the
harddisk before installation of GILES.
Make sure the C prompt is on screen
(if not, type C:)
Insert disk GILES-1 in drive A
Type A:INSTALL FROM A <Enter>
Keep disk GILES-1 in drive A
Follow the instruction: Type \LANDEV\GILESIN FROM A
Follow the instructions on the screen and change disks GILES-2, GILES-3, GILES-4,
GILES-5,GILES-6,
(GILES-SAMPLE-1, GILES-SAMPLE-2, GILES-SAMPLE-3, GILES-SAMPLE-4)
By this installation, four subdirectories will be created:
CALANDEV\ to store programs and general data files of GILES-1, GILES-2, GILES-3,
GILES-4,GILES-5,GILES-6
C:\INTERM\
to store intermediate map files
C: \WORKD \ as an auxiliary directory
C:\BORKDG\ to store map files of GILES-SAMPLE-a
and all files will be copied to C:\LANDEV\ or C:\BORKDG\.
Additionally, it copies the file BRUN40.EXE essential for program execution of QuickBasic compiler
programs to the root directory C. If it is already in a directory (e.g.DOS subdirectory) with installed
path, ft can be taken out.
For each project area stored on disks, you have to:
Make sure the C prompt is on screen
(if not, type C:)
<Enter>, e.g. MKDIR \ETHDG
Type MKDIR \aDG
Insert the first disk with data/maps of the additional project area into drive A
Insert the disk with 'General area data' of the project area into drive A
Enter 'GILES' and use the 'File operation' option of the Main Menu to copy all files of
the 'General data' from A:\LANDEV\ to CALANDEV\
OR:
5) Type: COPY A:\LANDEV\*.* C:\LANDEV\*.*
GILES/Appendix 1: Set Up and Installation
187
6) Enter 'GILES' and use the 'File operation' option of the
Main Menu to copy all files from A: \gDG \ to C: \gDG \
OR:
Type COPY A: \gDG \*.* \gDG \*.*
Repeat pr
where g
<Enter>
'u re 6 with each disk of the considered area
name of study area (abbreviation, not more than 4 letters, e.g. BORK)
***
App.1.4) TRANSFER OF GILES FROM ONE SYSTEM TO ANOTHER
If you want to copy the entire GILES system from the harddisk to floppy disks or to copy it
(possibly in an upgraded version) into a hard-disk system where GILES is already installed, you
can use two additional commands of GILES:
aa) To copy GILES out from the system:
Make sure the C prompt is on screen
(if not, type C:)
Insert disk GILES-1 in drive A or B
Type: \LANDEV \GILESOUT TO a <Enter>
Follow the instructions on the screen and insert disks GILES-2, GILES-3, GILES-4, GILES-5
and GILES-6
where
is the drive with the target disk (A or B)
Additionally for each study area, you have to copy the data (general area data, map files, area
sizes files and mapping unit codes) to disks. Start with the sample area BORK, Le. g is BORK in following procedure:
Insert a blank, formatted, double-sided disk in drive A
Create a subdirectory: MKDIR A:\LANDEV
Enter 'GILES' and use the 'File operation' option of the Main Menu to copy all files of
the 'General data' from CALANDEV\ to A:\LANDEV\
OR:
7) Type: COPY C:\gDG\g*.* A: \gDG \*.*
8) Insert a blank, formatted, double-sided disk in drive A
9) Create a subdirectory: MKDIR A: \gDG
GILES/Appendb< 1: Set Up and Installation
188
10-12) Enter 'GILES' and use the 'File operation' option of
the Main Menu to copy all files of a map from
C: \gDG \ to A: \gD \
OR:
Type: COPY \gDG \DGb??.MAP A:\gDG\*.*
Type: COPY \gDG\gD.MUC A: \gDG \*.*
Type: COPY \7DG\ARSD'?.DAT A:\gDG\*.
<Enter>
<Enter>
<Enter>
Repeat procedure 8-12 with each map of the considered
project area
where g
D
name of study area (abbreviation, not more than 4 letters, e.g. BORK)
theme of map (abbreviation, not more than 4 letters, e.g. SOIL, ALT)
see Glossary: Predefined map
If more project areas have to be copied out, replace a with the abbreviation name of the additional
project area and go back to step 5.
bb) To copy (an updated version of) GILES into a harddisk system
where GILES is already installed in:
Make sure the C prompt is on screen
(if not, type C:)
Insert (new) disk GILES-1 in drive A or B
Type: \LANDEV\GILESIN FROM g <Enter>
Follow the instructions on the screen and change disks GILES-2, GILES-3, GILES-4, GILES-5,
GILES-6
where a is the drive with the source disk
For each addttional project area stored on disks, you have to:
Make sure the C prompt is on screen
(if not, type C:)
If no subdirectory for the considered project area is installed yet,
type: MKDIR \gDG <Enter>
Insert the disk with 'General area data' of the project area into drive A
Enter 'G LES' and use the 'File operation' option of the Main Menu to copy all files of
the 'General data' from A:\LANDEV\ to CALANDEV\
Insert the first disk with data/maps of the additional project area into drive A
GILES/Appendb< 1: Set Up and Installation
189
Enter 'GILES' and use the 'File operation' option of the Main Menu to copy all map files of a
disk from A: \eDG \ to C:\aDG\
OR:
Type COPY A:\gDG\*.* C:\aDG \*.*
<Enter>
Repeat procedure 5 - 7 wfth each disk of the area
where 2
name of study area (abbreviation, not
more than 4 letters, e.g. BORK)
If more project areas have to be copied, replace
project area and go back to step 2.
with the abbreviation name of the additional
App.1.5) BACKUP
Making backup copies of data stored on disks is an essential data processing practice with any
computer. Backup copies should be made frequently and consistently.
At the stage of data entry, following back up copy can be recommended:
- daily back up copies alternatively to one of two 'daily backup sets"
- every one or two weeks back up copies to a "weekly backup set"
Backup copies have to be made of 'general data set' (non-spatial data) as well as of recently
entered/modified map data. Both of them can be made through the 'File operation' option of the
Main Menu.
Two back up copies of finalized study areas should be stored on floppy disks. Recommended is a
subdirectory for the study area (e.g. A:\ETHDG\... or A: \BORKDG \...) and the label of the disk
should carry the study area name. Diskettes should be kept in a dry, clean place and be rewritten
regularly (i.e. every two years).
GILES/Appendbc 2: Tutorial
190
Appendix 2
TUTORIAL
A Quick Introduction:
This chapter will show you how to retrieve information, lets say a map, without knowing anything of
GILES.
First thing is to install GILES in your system (micro computer with hard disk). Thus, go first through
App.1 if GILES is not installed yet. For an experienced DOS user, it will take only a few minutes to
install GILES (which is nothing else but adjusting the configuration file, creating three or four subdirectories and copying all GILES files into the harddisk).
Then, start GILES by typing 'GILES' and press <Enter>. It will prompt you to the opening screen
and after pressing any key, as proposed on the screen, to the MAIN MENU. This menu shows you
all the facilities of GILES.
GILES menus typically show a number of options in different lines with a 'Command Bar' at the
bottom, the 'Status Bar' at the top and the menu number in the upper right corner. All the options
you can do within one menu are shown in the Command Bar.
At color screens, one line (one option) will always appear in 'reverse video', highlighted, with an arrow on the left. This is the option which will be chosen when <Enter> is pressed. You can move
up and down by pressing the up or the down button on the keypad on the right handside of the
keyboard.
Try to move up and down. If you are at the bottom and continue to go down, it will jump automatically to the top.
Once you press <Enter>, the next menu will appear. If you made a wrong decision, pressing the
function key F1 at the left top of your keyboard will bring you back to the previous menu (at least in
most of the cases). Once you think you are completely wrong, press function key F10 and come
back all the way to the Main Menu.
From the Main Menu, you can get out of GILES by going down to the bottom line called 'out (Exit
to System)' and then pressing <Enter>.
Try it - and come back again by entering 'GILES' and <Enter> !
If the example area of Borkena/Ethiopia is installed in your system, as proposed for your installation (see App.1), try a first map retrieval:
GILES/Appendix 2: Tutorial
191
HOW to display a base thematic map, i.e. altitude map ?
Step
1
2
3
4
5
6
7
8
9
10
11
12
1
2
Selected
Line
1
e . g .
1
3
1
e.g.3
1
1
2
1
2
1
Selected
Option
Base map
(Selected area) 2
Whole study are.
C: <-- pefault -L
\....\
Altitude
Complete map
Map/data on screen only
High resolution image
No
Right column
<Enter>
Assuming that all data and programs are stored on harddisk
E.g. Borkena, Ethiopia
In a very similar way, Section 3.3 ('How to ...') will help you to get familiar with the most important
options of GILES.
Section 3.3 (p.105-149)
is therefore to be understood as
Tutorial, part II.
GILES/Appendix 3: Error Messages / Trouble Shooting
192
Appendix 3
ERROR MESSAGES / TROUBLE SHOOTING
Error
Message
Button
released
Sorry, do
it again
Error Cause
Occurrence
!
Map digitizing
Stylus released;
or:
active area of
digitizing
tablet left or
to close to its
margin
Trouble
Shooting
Press <Enter> and
enter this unit
again, starting at
the same starting
point
Bad test:
Unplug and
plug the
transformer
again
Digitizing
tablet
initialization
Digitizing
tablet does not
react on signals
of computer; or:
no handshake
Calculated
unit does
fit to mapping unit
codes
Area size
calculation
Occurring mapping
is greater than
total number of
mapping units in
MUC file 4
Check which unit(s)
were forgotten (by
running the area
sizes with the old
MUC file) and
assign them (with
their number) to
the correct new
mapping unit
Climatic suitability files
Try another drive
and path; or:
press F10, exit
and look in
other drives for
missing files; or:
create climatic
suitability
Climatic sui- Land
tability not evaluation
procedure
in this
drive/path
(DG1CMPxx.MAP)
not in the
mentioned drive/
path
See under error
message:
'No interface'
If problem remains,
digitizing tablet
has to be checked
(IC and wiring)
GILES/Appendix 3: Error Messages / Trouble Shooting
193
Data file ..
Selecfor this
tion of
studyarea not options
input yet
Requested data
are not entered
yet; or:
datafile is in
another drive or
another subdirectory
Press F10, select
option °Database'in
Main Menu, proceed
with other menues
and enter the data
Double assign-Map digiment at ...
tizing
Listed grid cell
assigned
previously to
another unit
If current (new)
assignment is ok,
press 'N',
if previous assignment is correct,
press 1P',
if neither current
nor previous assignment is correct,
press 'C',
if current assign
ment is correct for
the indicated and
all following
cells,press 'ALLN',
if previous assignment is correct for
the indicated and
all following
cells,press 'ALLP',
if only one particular unit shall be
replaced with the
new unit, but all
others remain unchanged, press 'SP'
Load paper
Print of
into printer, maps
turn printer
on-line and
press any key
Printer is out
of paper; or:
not on-line;or:
not connected;
Load paper into
printer, turn printer on-line again
and press <Enter>
or:
not on
Lotus file
not prepared
yet
Selection of
options
File 'LOT2GILx'
for selection of
mapping unit
codes not
declared; or:
not converted
into DIF file; or:
not stored in
C:\INTERM
Press F10, enter
Lotus 1-2-3 and
create requested
file
(See 'How to aggregate mapping
units' Section
3.3.23);
or:
look in other
directories for
file
'LOT2GILx'
GILES/Appendix 3: Error Messages / Trouble Shooting
Mapping unit Seleccodes (file.) tion of
not entered
options
yet
Mapping unit
codes of this
map not entered
yet
No interface: Digitizing Communication
Unplug and
tablet
not established
plug transfor-initialimer again
zation
194
Press F10, select
option 'Database'
in Main Menu, then
'Mapping unit
codes', proceed
with other menues
and enter the mapping unit codes
Unplug the cable
digitizing tablettransformer from the
transformer, plug it
in again and try it
again by pressing
<Enter;
repeat this procedure 5-10 times;or:
check, if the transformer has power;or:
check, if the cable
tablet-computer is
in serial adapter
board for serial
interface 1; or:
open the computer
and check if the
serial adapter board
(for serial interface 1) is properly
installed;
if possible,check
interface by plugging another serial
device(e.g.serial
printer,modem,Brooklyn bridge); or:
unplug the cable
from
serial adapter board
open the digitizing
tablet and check the
pin layout 21
Not at starsting point
Map digitizing
Entered mapping
unit is not
'closed'
('dead end')
If you want to continue at the last
location (by stylus
or keypad),
press 'C',
if you want to start
allover again with
this unit, press 'A'
GILES/Appendix 3: Error Messages / Trouble Shooting
195
Previously
entered:
codes
Map digitizing
Mapping unit code
and starting coordinates are
different than
entered before
digitizing
If most recent data
are correct, press
'Y' and start again
with this unit;
if recent data are
not correct, check
them, enter 'N',
code and coordinates
again
Printer is
not on
Selection of
options
Printer is not
Turn printer on; or:
turn it on-line; or:
load printer with
paper; or:
check cable and
connections
If no printer can be
connected, press F2
or F10 and repeat
selection procedure,
but without print
request
on;or:
not connected;
or:
not on-line; or:
out of paper
Soil suitabi- Land
Soil suitability
lity not in
evaluation files
this drive/
procedure
(DG2CMPxx.MAP)
path
not in the
mentioned drive/
path
Try another drive
and path; or:
press F10, exit
and look in
other drives for
missing files; or:
create soil
suitability
Sorry, this
map is not
finally
input yet
Selection of
options
Map is not entered Press F10, prepare
yet (MAP files
the maps and enter
are not created)
them (see 'How
to enter a map',
Section 3.3.18)
Sorry,
Map digitizing
Stylus moved
too fast
(communication
buffer overflow)
Selection of
options
Subdirectory is
not created (thus,
no maps are
accessible),
eventhough study
area listipg
shows it
too fast
Subdirectory
not found
Press <Enter> and
enter this unit
again, starting at
the same starting
point
> See under error
>
message:
> °This study
>
area is not
>
installed yet'
GILES/Appendix 3: Error Messages / Trouble Shooting
196
Suitability
of different
input level
than loaded
Land
The climatic and
evaluation soil suitability
procedure are of a different input
level than defined
just right now
Either: accept it
by pressing "YY"
Or: press "N", exit,
try it again; or:
load/create
climatic and soil
suitabilities of
the requested
input level
Suitability
of different
LUT than
loaded
Land
The climatic and
evaluation soil suitability
procedure are of a different crop/LUT
than defined
just right now
Either: accept it
by pressing "YY"
Or: press "N", exit,
try it again; or:
load/create
climatic and soil
suitabilities of
the requested
crop/LUT
Suitability
of 2 diff.
input levels
were loaded
Land
The climatic suievaluation tability (DG1..)
procedure and the soil
suitability
(DG2..) are of
different input
levels
Either: accept it
by pressing "YY"
Or: press "N", exit
and load/create
climatic and soil
suitabilities of
the same
(requested) input
level
Suitability
of 2 diff.
LUTs were
loaded
Land
The climatic suievaluation tability (DG1..)
procedure and the soil
suitability
(DG2..) are of
different crops/
LUTs
Either: accept it
by pressing "YY"
Or: press "N", exit
and load/create
climatic and soil
suitabilities of
the same
(requested) crop/
LUTs
Map digiTablet area
Sorry, tizing
left
do it again
!
Active area of
digitizing
tablet left or
too close to its
margin; or:
stylus released
Digitizing Digitizing
There is no
tablet not
communication: tablet
initiali- functioning
Check the
zation
cable from
tablet to
transformer
Press <Enter> and
enter this unit
again, starting at
the same starting
point
Check power supply of
digitizing tablet
(transformer); or:
check if transformer
is connected to main
source; or:
check output voltage
with voltmeter
(+ 12 V); or:
check if transformer
GILES/Appendb< 3: Error Messages / Trouble Shooting
197
warmsup,then ok);or:
check cable from
transformer to tablet
with all connections;
or: unplug power
cables and plug them
in and try it through
the menues again; or:
check cable from
tablet to computer;
or: check if serial
plug is in serial
adapter; unplug it,
plug it in and try it
again
Try all other recommendations: If it
does not work, open
the digitizing tablet
and check the input
voltage (right where
the power cable comes
in): + 12 V
This study
area is not
installed
yet
Selection of
options
Subdirectory is
not created (thus,
no maps are
accessible),
even though study
area lisq.ng
shows it -1-;
or:
study area is
not entered yet
This subdirec-Selectory is not
tion of
allowed
options
Wrong subdirectory declared;
or:
backslashes forgotten at begin
and end of subdirectory
Too tricky
Map digishape
tizing
Split it into
two and start
!
Too many 'stalactites' (more than
10 times crossing
of the boundary
Press F10 and check,
if the
requested area is
listed;
if yes, create a new
subdirectory at the
data drive by:
MKDIR C:\áDG and copy
resp. enter all available map files and
MUC files into this
subdirectory, any
other data files into
subdirectory INTERM;
if no, press F10,
select option 'Database' in Main Menu,
'Study area names'
and enter the data
(See Section 3.3.15;
p.117)
Press <Enter> and
give correct subdirectory with backslashes at front and
end (e.g.\ETHDG\)
Press <Enter>, enter
a starting point,
enter half of this
unit (with half of
GILES/Appendix 3: Error Messages / Trouble Shooting
again
of this unit in
one row)
Unit too big! Map digiSplit it into tizing
two and start
again
1 line not
correct
Do line ..
again
!
Map digitizing
198
the 'stalactite'
area), then enter
the rest of this
unit
Entered unit is
too large (more
than 5700 coordinates in 1 mmgrid system;
boundary longer
than appr. 1000
5 mm grid cells)
Press <Enter>, enter
half of this unit,
starting at the same
starting point,
then enter the rest
of this unit
Not correct data
processing of
Note this line and
press <Enter> to
continue, after
successful processing of this
unit, enter the
part of this unit
which falls in
line ..
(malfunction of
communication
buffer flow)
line ..
again
(+ 2 lines)
7
Program
execution
Out of memory
3
9
Program
execution
Subscript out of
range
3
24
Program
execution
Device timeout
3
25
Program
execution
Device fault
3
27
Print of
maps
Out of paper
Load paper into
printer, turn printer on-line again
3nd press <Enter>
53
Program
execution
File not found
3
57
Program
execution
Device I/O error
3
Disk full
Break program execution by CTRL-break,
free some space at
the default drive or:
change disk or drive
and start again
61
Program
execution
GILES/Appendix 3: Error Messages / Trouble Shooting
199
69
Map digitizing
Communicationbuffer overflow
Press <Enter>, 'save'
the entered map and
continue with the
'old' map
71
Program
execution
Disk not ready
Close disk drive
door; or:
change floppy disk,
or: check cable(s)
from disk drive to
controller board; or:
change disk drive
75
Program
execution
Path/file access
error
3
76
Program
execution
Path not found
3
1
This can happen, if a 'starea.nam' file is modified (e.g.a new
area is added) and then copied to another computer, without
creating the corresponding subdirectory/ies.
2
For pin layout of dititizing tablet cable, see App.4 (p.202).
3 These errors are very unlikely, but can occur in some situations. It is recommended to note all messages shown at
the screen and to press <Enter> to continue or to start
again. The displayed error messages should be reported
to the systemanalyst.
4
This can occur after assignment of mapping units to form new
base map and redefinition of 'mapping unit codes' if
units were forgotten.
GILES/Appendix 4: System Requirements
200
Appendix 4
SYSTEM REQUIREMENTS
GILES requires the following hardware and software:
App.4.1) MINIMUM HARDWARE CONFIGURATION
:
Personal Computer 'PC-compatible or 'PS/2-compatible'
Memory of 384 KB
DOS operating system (version 2.10 or higher)
Harddisk and one floppy disk drive (HD with at least 4 MB free space)
Dot matrix printer at ESC/P (Epson) standard code 5 9
Estimated costs for this minimum configuration:
1500 US$
App.4.2) OPTIMUM HARDWARE CONFIGURATION :
Personal Computer 'AT-compatible' or 'PS/2-80-compatible' 1
Memory of 1-2 MB 2
DOS or OS/2 operating system (DOS version 3.10 or higher)
Virtual disk driver (VDISK, Above Board or similar) 3
Harddisk with at least 30 MB and access faster than 20 ms and one floppy disk drive
(HD wtth at least 5 MB free space)
EGA or VGA facilities (multiscan monitor and EGA/VGA adapter)
Serial interface 7
Dot matrix printer Epson FX or LQ or compatible 5 9
or: Color ink printer
Plotter at HP-GL standard code (ISO A3 size or greater) 6
Digitizing tablet at Summasketch or Houston Instrument standard code 4 7
Back up system for uninterruptible, continuous, regulated power supply (UPS)
Estimated costs for this optimum configuration:
4000 US$
Large size digitizing and plotting facilities at ISO Al or AO (ANSI D or E) will increase the costs by
approximately 4000 US$ (or more). 4 6
GILES/Appendix 4: System Requirements
201
App.4.3) SOFTWARE RECOMMENDATIONS
Not essential for GILES execution, but recommended for additional processing or presentations:
Inset (EGA-Print for 24 dot matrix printer), Grab or any other screen dump utility:
for hardcopy outprints of screen displays
Lotus 1-2-3, Quattro or any other spreadsheet/database software
reading ASCII file ('print files') and writing DIF files:
for data processing of GILES data
Perspective, Boeing Graph or any other graphic package, reading DIF or ASCII files:
for DTM, 3D displays
QuickBasic Compiler : for modifying source code
App.4.4) HARDWARE MAINTENANCE
For maintaining and checking of the PC it is recommended: 8
daily:
- to check the harddisk logically
'CHKDSK'
weekly:
- to aggregate fragmented files
of the harddisk (cluster)
'OPTIMIZE' Disk-Optimizer
- to check harddisk and its files
physically
- to clean all floppy disk drives
monthly:
- to check the entire system
DOS
'DT c:/m' Norton
Disk drive cleaning kit
Diagnostic disk, or:
Advanced diagnostic disk
GILES/Appendix 4: System Requirements
202
1
Recommended: More than 20 MHz speed
Recommended: More memory (e.g. 2 MB) for installation of
extended virtual disk to increase the speed
3
Recommended: Intel Above-Board
2
4
5
6
Recommended: Summasketch MM 1200 series or preferably:
Houston Instrument 8000 series
Recommended: Epson FX,EX,LX,RX,MX,LQ printers
Recommended: HP 7475A plotter for ISO A3 (ANSI B) size,
HP 758x plotter for ISA Al (ANSI D) size,
Roland plotter
7 Pin layout for digltizing tablet:
Pin at 25-pin
D-shell communication
plug (e.g.IBM-PC)
Pin at 9-pin
D-shell communication
plug (e.g.IBM-AT)
Summasketch:
RCPU
TCPU
GND
2
3
3
2
8
1
2
3
2
3
7
4
5
Houston Instrument :
8
1+4+6+9
Connected with
each other
8
For maintenance and storage of data, see App.1.5 (p.189).
9 For direct GILES outprint, the printer has to recognize
following print commands:
ESC-P
ESC-M
ESC-W
15 (ESCSI)
ESC-3
ESC-3
ESC@
ESC-x
Print style: Pica size
Pitch 10
Print style: Elite size
Pitch 12
Print style: Enlarged
Pitch 200 %
Print style: Condensed
Pitch 60 %
Line spacing n/216" (LX/EX/FX series)
Line spacing n/180" (LQ series)
Printer initialization
Set/cancel letter-quality
Only ASCII codes are printed (characters 127-159 are not used) !
For printers with different print commands, it is recommended to make use of commercial screen
dump utilities.
GILES/Appendix 5: Computerized Processing
203
Appendix 5
COMPUTERIZED PROCESSING
To have GILES - as any other computerized processing - functioning, basically 4 components are
required:
Hardware
Software
Trained personnel (experienced users)
Institutional context (awareness of decision makers
about facilities)
***
App.5.1) HARDWARE:
'Every part of the computer, you can touch, is hardware'.
The enormous advances made in electronic technology now enable the integrated circuitry for any
specified applications to be miniaturized and reliably manufactured on a mass scale. These small,
low cost integrated circuits have become popularly known as 'chips'.
The main chip, the heart of a computer is the processor or Central Processing Unit (CPU). This
processor consists of a single silicon chip, which is a black plastic chip of some 30 x 30 mm with
integrated silicon circuits right in the center of the computer. There are a number of different
processors in the various computers, at the present the most common ones are the 8088, 80286 in
the IBM-PC/AT, 80386 or 68030. The processor is nothing magical - it is just a bunch of electronic
circuits. It is definitely not a 'brain'. '(PCW 1984).
This CPU stores all program instructions, stores the necessary data, and brings these two sets of
information together to execute a program.
Beside the processor, the most important hardware part of a computer is its memory, because all
programs and data have to be stored. There are two types of memory: Read Only Memory (ROM)
and the badly-named Random Access Memory (RAM). ROM is so-called because the processor
can 'read' (get things out of) its contents, but is unable to 'write to' (put things in) it.
GILES/Appendix 5: Computerized Processing
204
It is possible to write to the RAM as well as to read from it. This means that the processor can use it
to store both the program it is running and data (information). The second important difference is
that RAM needs a constant power supply to retain its contents: as soon as the power is off, you
lose your program and data.
(The storage capacity of a computer is described by the size of its memory, which is the 'number
of characters' which can be stored. Each character makes one byte, 1024 (characters or) bytes
make one kilobyte (or 1 k). 512 k of an IBM-PC/AT for example mean, that in its memory (ROM)
512 * 1024 = 524,288 characters can be stored, the expanded version of the IBM-PC/AT contains
640 k which is the potential storage of 655,360 characters).
The most common media for permanent storage are floppy disk drive and harddisks. Floppy disks
are circular pieces of thin plastic coated with a magnetic recording surface similar to that of tapes
and with a diameter of 5 1/4 inch (13 cm) or 3 1/2 inch (9 cm). The disk drive, to write on and to
read from these disks, comprise a high-speed motor to rotate the disk and a read/write head. The
disk is divided into concentric rings ('tracks') which are in turn divided into small blocks by spokelike divisions ('sectors') and which define the storage capacity of the disks (360 KB, 720 KB, 1.2
MB, 1.44 MB). The advantage of floppy disks is the easy transfer of data from one computer to
another.
Less transferable, but more efficient is to store data on ha rdd is ks. Their capacity starts around 10
MB and rises to 40, 70 or more MB. Besides offering a much greater capacity, harddisks are more
reliable and considerably faster.
Most of the Personal Computers have the CPU, ROM and RAM on the 'mother board at the bottom of the machine, while a number of boards fitting into slots at the mother board enable the
communication flow between the mother board and the various devices: These input and output
devices are essential because computers need some way of communicating with the outside
world.
The most common input device is the keyboard where data and commands can be entered like on
a typewriter.
The monitor (or visual display unit, screen, cathode ray tube) is the standard output device to display messages or to show entered or processed maps, tables, text. MDA (monochrome display
adapter), CGA (colored graphics adapter), EGA (enhanced graphics adapter), VGA (video
graphics adapter) and PGC (professional graphics adapter) stand for various graphic facilities
(adapter in the computer and screen) with different resolution (up to 800 x 600 pixels on screen
and more) and different number of colors (up to 16 and more).
There are a large number of peripherals to produce hardcopies of the output on paper:
Dot matrix printers print symbols (letters or graphic symbols) through a system of number of
needles (e.g. nine needles above each other moving along the line: 9 pin printer, e.g. Epson EX
printers; similarly 24 pin printer, e.g.Epson LQ printer) in black or with colors. Daisy wheel printers
use a daisy wheel like a daisy wheel typewriter. Laser jet printers for better quality printing and ink
jet printers with high-quality colored prints are becoming more popular.
GILES/Appendb< 5: Computerized Processing
205
Plotters draw pen(s) on a fiat surface and thus allow much better quality of maps or graphics outPut.
An input device is the digitizing tablet which consists of a board with an embedded wire grid in
the tablets top and a stylus. The stylus is used to follow the lines on the map laid on the board. The
x-y-coordinates of the lines are recorded at some interval which can be selected either manually,
depressing a button to store the current x-y-values of the cursor, or automatically as It is done by
GILES.
Video digitizers (to read graphics or maps through a video camera system) and scanners (to read
graphics, maps, text) are not fully operational and therefore not recommendable for GILES for the
time being, but with some more development they might perform another input possibility in the future.
UPS (Uninterruptible Power Supply) can provide continuous, regulated, noise-free ac power to the
computer system. In case of power failure, power break down or power spikes they guarantee a
safe power supply.
The hardware requirements of GILES are listed in App.4 (p.200).
App.5.2) SOFTWARE:
A general-purpose device needs some way of knowing what to do. We do this by giving the computer a set of logical instructions called a program. The general term for computer programs is
'software'. It is the combination of hardware and software which provides the computer resource.
Any kind of programs must be written in a form the computer can recognize and act on - this
achieved in a code known as a computer language. There are literally hundreds of different languages around: Basic, Forth, Pascal, Logo, C, Fortran, Cobol to name but a few. These are known
as high-level languages because they are symbolic, operating at a level easily understood by
people but not directly understood by the processor, thus they approach the sophistication of a
human language.
There are also low-level languages, assembly language, and machine code: Machine code (or
machine language) is called a low level language because it operates at a level dose to that
'understood' by the processor. Between high-level languages and machine code is a low level language known as assembly language or, coloquially assembler. This is a mnemonic code using
symbols which the processor can quickly convert into machine code.
A program written in a high-level language must be converted into binary code before the processor can carry out its instructions. There are two types of program to do this translation:
The first of these is a compiler which translates our whole program permanently into machine
code. When we compile a program, the original high-level language version is called the source
code while the compiled copy is called the object code. Compiled programs are fast to run but
hard to edit. If we want to change a compiled program, we either have to edit it in machine code
(extremely difficult) or we have to go back to a copy of the source code. For this reason there is a
GILES/Appendix 5: Computerized Processing
206
second translation program: an interpreter. An interpreter waits until we actually run (use) the
program, then translates one line at a time into machine code - leaving the program in its original
high-level language. This makes tt slower to run than a compiled program, but easier to edit.
The most popular high-level language is Basic. Basic is an acronym of Beginners All-Purpose
Symbolic Instruction Code. PJthough originally intended as a simple introductory language, Basic
is now a powerful and widely used language in tts own right.
The advent of powerful minicomputers and microprocessors has led to a resurgence in the use of
Basic, as tt is more suited than Fortran to use on these smaller machines. For this reason Basic
language capability and its level of compatibility have also been extended. Added to the fact that
BASIC already perform:. better than Fortran in the areas of character string and matrix handling
and input/output, tt would appear to be a most suitable language for those parts of any data base
system which must be developed by the user. However, this should be weighted carefully against
the availability of programming expertise in developing countries. ... Nevertheless, the increasing
use of mini-computer and microprocessors will develop Basic expertise.'
Previously faced problems with Basic, such as low processing speed and unstructured programming style, is now overcome by Basic compiler, particular of the second generation which allow
high speed and structured programming. GILES is written in this language (Microsoft's QuickBasic
4.0).
As a link between the hardware configuration and the software writ-ten in any computer language,
an operating system is essential to run the access of the programs to CPU, RAM, ROM and disk
storage media. At Personal Computers, mainly DOS is used, others are CP/M, XENIX, UNIX,
OS/2. The present version of GILES is developed under DOS 3.20 environment, but it will function
under OS/2 (in protected mode) as well.
For general purposes (i.e. by far more than 90 % of computer applications), there is no need to
design programs as there is a large collection of commercial software available. Thousands of
programs cover most of the application needs which are, to mention only a few:
Word processing: Wordstar, Word, Multimate, Wordperfect
Desktop publishing: Ventura Publisher, Pagemaker
Spreadsheets (calculation and organisation of tables): Lotus, Quattro, Multiplan, Supercalc,
Excel
Database (storage and retrieval of data): dBase, FoxBase, R:Base
Integrated packages: Symphony, Framework, Open Access, Works
Statistics: Microstat, SPSS, SAS, Statgraphics
Graphics: Boeing Graph, Halo, Concorde, Harward Presentation, Perspective
CAD (computer aided design): AutoCad, VersaCad
Utilities: Norton; Brooklyn-Bridge, Smalltalk; Sidekick
GIS: GILES, ARC/INFO, ERDAS, Terra-Pak, MAP, Cries, GIMMS
(All mentioned names are trademarks).
Particular attention shall be given by GILES users to screen dump utilities. They allow high-quality
hard copy printouts of screen displays on printer: Inset, EGA-Print, Grab.
GILES/Appendix 5: Computerized Processing
207
Most of them are menu-driven, easy to understand and to leam and support many help-menus and
translation facilities.
Software GILES consists of 6 DS/DD or 2 DS/HD diskettes (see App. 1 and 6; p.184/208; wtthout
tutorial, source code).
App.5.3) TRAINED PERSONNEL: USERS EXPERIENCE
App.5.4) AWARENESS OF DECISION MAKERS
These important aspects of the use and application of computer processing are explained in Section 2.1 (p.17).
GILES/Appendix 6: GILES Files
208
ADDerdx6
GILES FILES
Software package GILES on disk 1-5 (if HD, one disk)
'General data set' on disk 6
Source codes on disks 7-10 (if HD, one disk)
Samples for tutorial lessons on disk SAMPLE1-SAMPLE4
(if HD, two disks)
App.6.1) SOFTWARE PACKAGE GILES
Explanation
page
Explanation
page
Content of GILES-1:
GILES.BAT
GILESIN.BAT
GILESOUT.BAT
GILESBAS.BAT
Content
GILESCMPL.BAT
SELE1.EXE
SELE3.EXE
239
242
DIGITTAB.EXE
DATACH.EXE
DATASTA.EXE
242
243
243
GRIDSUP.EXE
245
GRIDCOMP.EXE
245
CREQ.EXE
ARSIZE.EXE
243
243
EROS.EXE
EROREC.EXE
246
247
CLSUIT.EXE
249
LANDEV.EXE
249
ADJUST.EXE
GAMMA.EXE
SCRDMP01.PCT
251
252
SCRDMP02.PCT
SCRDMP03.PCT
SCRDMPO4.PCT
of GILES-2:
GRIDINF.EXE
GRIDMAP.EXE
Content of
GILES-3:
SELEDOS.EXE
SELECONT.EXE
Content of
242
242
GILES-4:
247
LGP.EXE
Content of
244
244
GILES-5:
DIGITHLP.EXE
SOSUIT.EXE
PINPUT.EXE
242
249
249
209
GILES/Appendix 6: GILES Files
2) 'GENERAL DATA' ON DISK GILES-6
Content of
GILES-D:
BORKATN.NAM
BORKSOIL.MCP
BORKSOIL.STN
BORKSOIL.TCH
BORKALT.COR
BORKPREC.DAT
BORKPREC.RLV
BORKPREC.TWY
BORKREL.DAT
BORKGAM.DAT
BORKADM.ACH
177
160
162
163
165
168
171
172
169
170
167
CREQ.BAS
ARSIZE.BAS
DIGITTAB.BAS
DIGTTBSB.BAS
DIGITHLP.BAS
COMMONIN.BAS
DECISIN.BAS
MENPLIN1.BAS
MENPLIN2.BAS
254
252
GRIDSUP.BAS
GRIDSPSB.BAS
GRIDCOMP.BAS
GRIDCPSB.BAS
LGP.BAS
LGPSB.BAS
ERORECSB.BAS
DATACH.BAS
DATACHSB.BAS
DATASTA.BAS
GAMMA.BAS
SIZEMOD.BAS
SELE1.MAK
DIGITTAB.MAK
DATACH.MAK
GRIDINF.MAK
GRIDMAP.MAK
GRIDSUP.MAK
GRIDCOMP.MAK
EROS.MAK
EROREC.MAK
LGP.MAK
CLSUIT.MAK
SOSUIT.MAK
LANDEV.MAK
BRUN40.EXE
183
HELP.TXT
CREQ1.DAT
CREQ2.DAT
LCHAR.NAM
LCHATN.NAM
LUT.NAM
STAREA.NAM
182
182
174
176
178
180
DUMLIN.MUC
SCRDMP05.PCT
SCRDMP06.PCT
183
3) SOURCE CODES ON DISK 7-10
Content of GILES-7:
SELE1.BAS
SELE1SB.BAS
SELE3.BAS
SELEDOS.BAS
SELECONT.BAS
Content of GILES-8:
GRIDINF.BAS
GRIDIFSB.BAS
GRIDMAP.BAS
GRIDMPSB.BAS
Content of GILES-9:
EROS.BAS
EROSSB.BAS
EROREC.BAS
Content of
GILES-10:
CLSUIT.BAS
CLSUITSB.BAS
SOSUIT.BAS
SOSUITSB.BAS
LANDEV.BAS
LANDEVSB.BAS
PINPUT.BAS
ADJUST.BAS
GILES/Appendix 6: GILES Files
210
App.6.4) Samples for tutorial lesson on disk SAMPLE1-SAMPLE4
Note about file size:
Extension
Map file of one sheet:
in GILES
(with extension MAP)
as print file (transfer to Lotus)
as spreadsheet file (in Lotus)
as DIF file (transfer to Perspective)
as 3D file (in Perspective)
MAP
PRN
WK1
DIF
3DL
25
appr. 40
appr.136
appr.103
kB
kB
kB
kB
(appr.480 kB)
GILES/Appendix 7: Land Evaluation Models
211
Appendix 7
LAND EVALUATION MODELS
In this appendix, all models for the land evaluation procedures are explained in brief. Details are
given in FAO 1987 b, which forms part 1 of this manual.
Pa g e
Erosion hazard
Conservation based land use recommendation
Length of growing period
Climatic suitability assessment
Soil suitability assessment
Land suitability assessment
Precipitation station reference
Generation of precipitation data
211
215
216
223
226
232
236
237
App.7.1) EROSION HAZARD (module 'eros')
This model calculates the erosion hazard caused by sheet erosion by means of a model,
developed by Hurni (1985). This model is an adoption from the Universal Soil Loss Equation by
Wischmeier and Smith (1978):
A = R*K*L*S*C*P
where:
A = total soil loss (t/ha/year)
R = rainfall erosivtty factor
K = soil erodibiltty factor
L = slope length factor
S = slope gradient factor
C = land cover factor
P = management factor
The model takes rainfall erosivity, slope length and slope gradient as physical environmental conditions into consideration. For the soil erodibility factors, the values established for the FAO soil
degradation assessment methodology (FAO 1979) were applied. Constant values for the land
cover and the management factors (C,P) are applied as default, but can be modified through
menu.
GILES/Appendb< 7: Land Evaluation Models
212
R = 0.55 * annual precipitation (mm)
K=
Af
0.1
E
0.1
K
Ag
Ah
Ap
0.15
P1
0.15
0.1
0.15
0.15
F
0.1
0.1
0.15
0.15
0.1
0.1
0.15
0.2
0.1
0.1
0.1
0.15
0.15
0.2
La
Lc
0.2
0.15
Po
Pp
Bc
Bd
Be
Bf
Bg
Bh
Bk
By
Bx
C
D
Gc
Gd
Ge
Gh
Gm
Gp
Gx
H
0.15
0.15
0.1
0.15
0.1
0.15
0.2
0.2
0.1
0.2
I
Jc
Jd
Je
Jt
Lf
0.1
Lg
Lk
Lo
Lp
Lv
M
N
0
Pf
Pg
Ph
0.15
0.2
0.2
Q
0.1
0.15
0.15
0.15
Rc
Rd
0.2
0.2
0.15
0.1
0.1
0.2
0.2
0.15
Rx
0.1
0.15
0.15
0.2
0.2
0.15
0.2
0.1
0.1
0.15
0.15
Re
Sg
Sin
So
Th
Tm
To
Tv
U
0.1
0.2
0.2
0.2
0.15
0.15
0.2
0.2
0.2
0.2
0.15
0.1
0.15
0.2
V
Wd
We
Wh
Wm
Ws
Wx
X
Y
Zg
Zm
Zo
Zt
High surface stoniness can increases this factor by 0.05
The K factor (kc, erodibility) has to be entered for each individual soi type in the soil type characterization table (column 46), where kc 0.05=1, kc 0.10=2, kc 0.15=3 ... kc 0.30=6).
L = 0.3
1.2
2.5
3.8
for slope length in.a. ' (e.g.< 2% gradient) (code 9)
Il
ti
<
50 in
for
(code 1)
50 - 200 In
"
for
(code 2)
ti
> 200 in
(code 3)
for
"
ii
L can be entered for each individual soil type in the soil type characterization table (column 20),
where < 50 m=1, 50-200m =2, >200m = 3, n.a. = 9). If the value is omitted, the intermediate value of
2 will be assumed.
S = 0.1
0.2
0.35
0.6
1.0
2.0
3.2
4.2
for slope gradient (mean max. )
<
II
li
2
"
"
for
If
"
4 "
for "II
11
It
6"
for ol
It
I,
"
8for li
li
it
"
13
for n
Il
It
"
25
for
for
5.5 for
10.0 for
40 -
If
il
il
It
"
il
II
Il
II
2 %
4
6
8
13
25
40
55
%
%
%
%
%
%
%
55 - 100
%
100
%
>
(code
(code
(code
(code
(code
(code
(code
(code
(code
(code
1 or 2)
3)
4)
5)
6)
7)
8)
9)
10)
11)
S has to be entered for each individual soil type in the soil type characterization table (column 16),
where < 1% =1... > 100%=11).
GILES/Appendb( 7: Land Evaluation Models
213
The C land cover factor corresponds to the 'erosion resistance' characteristic of the crop requirements.
Perennial 0.01 - 0.05
Large grain 0.1
Small grain, pulses 0.15
The C and V factors are combined and set to 0.8 by default. It can be modified in the menu 'Which
kind of management Is to be applied ?' to a value between 0.1 (extremely intensive conservation
measures) through 0.5 (high stone cover) to 1.0 (ploughing up and down).
Additional option is given to apply slope leveling through construction of bunds and/or terraces.
The effect is to reduce higher slope gradients. Each individual slope class can be changed (see
above for slope codes).
The calculated soil losses are grouped into four classes:
Table A7.1
Sheet Erosion Hazard Classes
Sheet erosion hazard
low
medium
severe
very severe
Soil loss (t/ha/year)
< 10
30
30
75
10
> 75
Additional consideration can be taken of the existing (present) erosion status as observed in the
field. This allows the mapping and assessment of the erosion integrating the potential hazard with
the actual status.
A second version is assessing the slip and gully erosion:
It takes into consideration the existing gully erosion, soil type and slope class, which are combined
on a limiting factor laasis as explained below.
GILES/Appendix 7: Land Evaluation Models
214
Gully erosion hazard
Solodic Planosols
Vertisol, vertic Cambisol
all others
slope 13
55 %
slope > 55 %
slight present gully erosion
moderate
severe
badland
moderate
slight
nil
at least
at least
at least
at least
severe
severe
slight
moderate
slight
moderate
As this type of erosion is also strongly influenced by distance from an actively eroding front,
classes are downgraded if the area assessed is adjacent to an area of badland or an area with
severe gully erosion. If there is severe gully attack or badland observed in the surrounding (at
1:50000 scale: adjacent pixel = 250 m distance; at 1:250000 scale: same pixel = 625 m radius),
this area is considered as having severe gully erosion attack (e.g. from moderate to severe gully
erosion hazard).
This model is called by option 'Erosion hazard' in the Main Menu.
215
GILES/Appendbc 7: Land Evaluation Models
App.7.2) CONSERVATION BASED LAND USE RECOMMENDATIONS (module 'erorec')
This model gives the possibility to define broad land use recommendations for appropriate land
use under the soil conservation point of view.
lt gives the answer for the questions: What is best major kind of land use if the land degradation
has to be stopped?, and: What kind of soil conservation measures should be undertaken to stop
soil degradation?
The definition of recommendations are based on sheet erosion loss, soil depth, erosion status
(badland), (mean max.) slope, flooding, vertic properties, and gully occurrence. The quantitative
sheet erosion loss is calculated by means of a model, developed by Humi (1985) and explained in
App.7.1.
Table A7.2
Conservation Based Land Use Recommendations
Unit
Frequent BadFlooding land
Soil
Depth
Mean max.
Slope
(cm)
5
A
Ag
As
Asg
Ab
6
Abg
7
At
1
2
3
4
8
Atg
9
Ad
Adg
10
11
12
13
14
15
FP
Gw
X
A
Gr
No
No
No
No
No
No
No
No
No
No
No
No
No
No
No
Yes
No
No
No
No
No
No
No
No
No
No
No
No
No
No
No
No
No
No
No
No
No
No
Yes
No
No
No
No
No
25
25
25
25
25
25
25
25
25
25
25
25
25
>25
> 50
any
any
n. a .1
<50
>50
< 50
< 25
(%)
<
<
6
6
6- 8
6- 8
8-25
<
8
8-25
<
8
<25
8-25
< 25
8-25
< 25
< 25
25-55
any
any
n.a.
> 55
> 55
25-55
< 25
Montm. Annual Gully
Clay Soil Loss
(t/ha/yr)
No
No
No
No
No
No
No
No
No
No
No
No
Yes
Yes
any
any
any
any
any
any
any
any
<30
<30
< 30
< 30
< 30
30-75
< 30
30-75
>75
30-75
> 75
30-75
any
any
any
any
any
any
any
any
any
any
Waterbody
This module is called by option 'Conservation based land use recommendation' in the Main Menu.
No
Yes
No
Yes
No
No
Yes
Yes
No
No
Yes
Yes
No
Yes
any
any
any
any
any
any
any
any
GILES/Appendbc 7: Land Evaluation Models
216
App.7.3) LENGTH OF GROWING PERIOD (module 'LGP')
The assessment of the length of the growing period is based on a decadal soil moisture balance
model.
Even though precipitation (monthly or decadal) and potential evapotranspiration are the main input
parameters, it can not be seen as a straight comparison of P and PET (or 1/2 PET) only. In areas
with a wide range of moisture holding capacities of different soil types, as in the Ethiopian highlands, it is not realistic to assume an average moisture holding capacity. Opposite extreme of hold-
ing capacities can result in very different growing periods (in the rainy season in shallow soils,
after the rainy season in Vertisols).
The length of growing period assessment is done in four steps:
Step 1 calculates the moisture holding capacity of the soil
"
" actual (decadal) soil moisture of the soil
Step 2
Step 3 compares the (decadal) soil moisture with the moisture requirement(s)
Step 4 compiles the assessments for the number of years, data are available for (e.g. 20 years)
The entire assessment can be calculated
with consideration of site-specific soil moisture holding capacities for a specific crop
(for land suitability assessments), or:
with consideration of stte-specific soil moisture holding capacities for an average crop,
or:
for an 'average' soil (with 100 mm moisture holding capacity) for a specific crop, or:
for an 'average' soil (with 100 mm moisture holding capacity) for an average crop
(as climatic 'reference growing period')
Step 1:
If the moisture holding oaoacity is not measured, the available moisture holding capacity:
AWHC = f (texture, bulk density, fragments of top soil, fragments of sub soil, topsoil depth, soil
depth, organic matter content)
is calculated based on following general formula:
AWHC' = MHCtibd * (D - FRAGM )
where: MHCybd available moisture holding capacity,
as function of texture and bulk density
depth
D
FRAGM content of mineral fragments
GILES/Appendix 7: Land Evaluation Models
217
Consideration of topsoil and subsoil as well as of the organic matter contribution results in the
complete formula:
( Dt - FRAGMt ) / 10000
MHCtibd
+ MHCtibd * ( Ds - FRAGMs ) / 10000
AWHC =
+ MODom *
Dt
where: AWHC available water holding capacity (mm)
MHCtiod available moisture holding capacity,
as function of texture and bulk density
(mm/m)
(see Table A7.4, p220)
Dt
topsoil depth (20/8/18/30 cm)
(if not recorded, default: 20 cm)
Ds
depth (5/20/37/75/125/175 cm)
FRAGMt content of mineral fragments in topsoil (0/7/27/50 %)
(if not recorded, default: O %)
FRAGMs content of mineral fragments in subsoil (0/7/27/50 %)
(if not recorded, default: 0 %)
MODom moisture contribution of organic matter
(see Table A7.5, p.220)
(mm)
No higher moisture holding capacity figures than 200 mm are accepted, no lower figures than 50
MM.
If the moisture holding capacity of the soil is measured, this value is read from the soil type characterization table (column 47; file 'gSOIL.TCH').
The topsoil moisture holding capacity is defined as 20 mm.
For the non-site-specific LGP calculation (without consideration of occurring soils), this first step is
suppressed and an average moisture holding capacity of 100 mm is assumed.
Step 2:
For each decade the moisture input and moisture output is calculated, thus contributing or reducing moisture from the soil, giving the actual (decade') moisture content for the next decade:
S10 =
SO
M°Dprec * P10
+ GW
- MODpet * PET10
GILES/Appendix 7: Land Evaluation Models
218
where: S10
moisture content at end of the decade (mm)
So
moisture content at the beginning of the decade (mm)
MODprec conversion actual to effective rainfall,
as function of actual soil moisture and rainfall
(see Table A7.6, p.221)
P10
GW
actual decadal rainfall (mm) (measured, generated or interpolated)
groundwater contribution (mm)
(see Table A7.7, p.221)
MODpet conversion PET into effecOve evapotranspiration, as function of PE, actual top
s-oil moisture and crop
(see Table A7.8, p.222)
PET10
decadal potential evapotranspiration (mm) out of altitude - PET regression
Example of the soil moisture balance dynamic with the entire data for two years is shown in Table
3.10 (p.84).
Step 3:
The soil moisture (S10, in mm) is set in relation to the soil moisture holding capacity, giving the
relative soil moisture saturation (in %), which will be compared with the ability of the crop roots to
extract moisture of the soil (water requirements):
Table A7.3
Relative Soil Moisture Saturation
of av4lable waW holding capacity
Cereal -L
>
>
99%
30%
15-30%
< 15%
1
2
3
4
Pulses
> 99%
> 36%
18-36%
< 18%
Pulses3
> 99%
> 23%
12-23%
< 12%
Potato4
99%
> 50%
>
25-50%
< 25%
results
in:
---> WET
---> HUMID
---> MOIST
---> DRY
Sorghum, wheat, barley, teff; sesame; 'reference LGP'
Haricot beans, horsebeans
Chickpeas, lentils, vetch
and pepper, shallot
At the beginning of the rainy season (until the top soil is saturated with moisture by at least 75 %),
the relative top soil moisture is considered.
GILES/Appendá 7: Land Evaluation Models
219
Step 4:
The calculation of the decadel moisture support condition is done for a number of years (if
precipitation data were generated: 20 years; If actual data were used: 5-20 years). For each year
the longest growing period (i.e. without any dr)' decade) is considered as the main growing period
('Kremt.), the second longest before the main rainy season is the 'second' growing period ('Belg').
If the separate 'Belg' is less than 30 days, the part of the main rainy season before the 1.of July is
considered as 'BeIg' season.
For perennial crops all humid and moist decades are added.
The output shows for the requested reliabilfty (75,68 or 50 %):
What is the expected main growing period (calculated out of mean and standard deviation, and
put into classes of < 60 / 90 / 120 / 150 / 180 / 210 / 240 / >240 days) ?
In how many years does the first, small rainy season have < 60/ at least 60 / at least 90 days ?
When is the end of the main rainy season ?
Result 1 and 3 enable the calculation of the onset for a gfven reliability level.
Example of an outprint in Table 3.9 (p.78) shows the growing periods of 20 years.
*****
GILES/Appendix 7: Land Evaluation Models
220
Table A7.4
Available Moisture Holding Capacfty (pF 4.2-1.8)
as Function of Texture and Bulk Density
(mm moisture / m soil)
(for assessment of available moisture holding capacity)
Bulk density (g/cc)
Texture
Bulk density (g/cc)
<1.0 1.0-1.6 >1.6
(coarse)
60
100
160
110
130
150
220
220
220
240
280
210
190
(fine)
1S (coarse)
iS
1S (fine)
sL
scL
siL
Si
sicL
cL
60
90
120
90
100
110
170
160
170
190
250
170
150
Texture
60
90
<1.0 1.0-1.6 >1.6
sC
siC
120
C(montm)
80
90
100
140
120
140
160
190
200
200
200
150
160
150
150
120
120
110
110
220
190
210
220
190
210
190
190
170
150
170
160
150
170
150
150
140
120
140
130
110
140
120
110
n. a .
variabel
L+cL
L+siL+sicL+cL
sL+scL
cL+C
scL+L+siL+cL
cL
cL+C(montm)
230
120
120
If bulk density is not recorded, default. 1.0-1.6 g/cc
If texture is not recorded, default: IS
As bulk density figures are highly unreliable in the present study, AWHC will always be calculated
using the medium bulk densfty value.
Table A7.5
Moisture Contribution due to Organic Matter
(for assessment of available moisture holding capacfty)
(mm moisture / m soil)
Texture
Organic matter
content
S
1S
Si
very low
low
medium
high
< 1
1-3
3-5
>5
0
0
20
40
100
10
30
80
If organic mat-ter is not recorded, default: < 1%
sL
L
siL
scL,sicL,cL
and all combined classes
0
0
0
0
20
80
10
60
sC
siC
cL+C
0
C
cL+C
0
0
0
0
30
30
0
GILES/Appendb< 7: Land Evaluation Models
221
Table A7.6
Conversion Actual to Effective Rainfall
as Function of Soil Permeability, Actual Soil Moisture
and Topography
Relative actual
soil moisture
saturation
< 25
25-49
50-74
75-99
100
vertic
gleyic
others
.7
.7
.7
.7
.7
%
%
%
%
%
.8
.8
.8
.8
.8
If precipitation is greater than 100 mm/decade (high
rainfall intensity with high runoff):
decrease of rainfall by 10 % (*.9)
If precipitation is less than 15 mm/decade (low rainfall with
high evaporation):
decrease of rainfall by 10 % (*.9)
Table A7.7
Groundwater Contribution
(mm / decade)
GW level
(perennial)
150
150
150
150
cm
cm
cm
cm
Decadal rainfall
GW contrib.
(mm)
any
> 20
10 - 20
<10
0
10
5
2.5
GILES/Appendix 7: Land Evaluation Models
222
Table A7.8
Conversion PET to Effective Evapotranspiration
as Function of PE, Top Soil Moisture and Crop
Relative actual
soil moisture
saturation
< 25
25 49
50-100
Convers ion
%
0.6
0.8
%
1
%
This factor is multiplied with the crop specific transpiration intensity figure (kc):
Rice
e.g.
1.1
0.9
Oats; sugarcane; tobacco
0.85
Horsebean, fieldpea, haricotbean, cowpea; citrus; sweet potato; cotton
Sorghum, maize, wheat, barley, teff, millet; niger seed, sunflower, soybean; potato,
0.75
Coffee, tea, grape
0.7
Safflower
Pineapple; sisal
0.6
to give the conversion factor MODpet for:
actual ET = MODpet * PET
This module is called by option 'Length of growing period' in the Main Menu.
1
0.8
cassava, groundnut; shallot, tomato
Chickpea, lentil, vetch; sesame, flax; pepper, cabbage; ensete, banana
This value is used for 'reference LGP'
0.65
1
GILES/Appendix 7: Land Evaluation Models
223
App.7.4) CUMATIC SUITABIUTY ASSESSMENT (module 'clsutt')
This module matches three climatic parameters ('Iand qualtties) with the corresponding climatic
requirements of a specific crop:
Length of tho jrowing period: The growing period is assessed as explained in App.7.3
(above). The duration of the main growing period (with minimum and maximum to be expected at
a given reliability level) Is matched with the length of the growing period requirement (growth
cycle) of the crop (crop requirements: 'minimum length of growing period', 'maximum length of
growing period'). As at temperatures of < 20 C the growth cycles of many crop increase considerably, the required growing pericxis are increased at altitudes of > 1800 m by a number of
days per each 100 m altttude increase (crop requirements: regression of minimum LGP',
'regression of maximum LGP').
The crop requirements of length of growing periods are given at different suitability levels: If the
optimum growth cycle does not match the assessed growing period of the main growing period
both at the minimum and the maximum side, checking is done for the next suitability level growth
cycle etc. The result is the suitabiltty assessment of the moisture (growing period) for the particular
crop.
Similar to the LGP module, the suitability can be made purely climatic or the site-specific soil
parameters (moisture holding c.apacity) can be taken into consideration to assess the site-specific
moisture suitability.
If the option of land improvement: irrigation is chosen, no constraints due to moisture are considered at all in areas witth slope of < 4 %. Steeper areas are assessed as not suttable (suboption
'excluding rainfall') or with their precipitation pattern (suboption 'including rainfall').
Temperature: Based on an altitude-temperature regression, the temperature of the location is
calculated out of the altitude. The annual mean temperature is matched with both the minimum
temperature and the maximum temperature of the tolerance of the crop at different suitability levels
(crop requirements: 'minimum temperature', 'maximum temperature'). The suitability class of
which the minimum temperature is below the actual temperature and maximum temperature is
above the actual temperature gives the temperature suitability.
Frost hazard: Frost is assessed as a function of altitude and topographic situation (see Table
A7.9; the topographic situation is read of the soil type characterization table, column 17). The frost
hazard is compared with the ability of the crop to stand frost (crop requirement: 'frost sensitivity';
see Table A7.10).
Residual moisture crops are downgraded by one suitability class (except if there is no frost
hazard), as they are planted after the main rainy season during the coldest part of the year.
GILES/Appendix 7: Land Evaluation Models
224
Table A7.9
Frost Hazard
Altitude
< 1600
1600-2000
2000-2400
2400-2800
2800-3200
3200-3600
> 3600
Upper slope
Middle slope
or any other
m
m
m
m
m
m
m
Valley bottom Lower slope
Extensive plain
nil
nil
nil
nil
nil
nil
medium
severe
very severe
very severe
extreme
extreme
medium
medium
severe
extreme
medium
severe
very severe
extreme
extreme
Table A7.10
Frost Constraint
Frost sensitivity
of crop
tolerant
moderate tolerant
moderate sensitive
sensitive
nil
si
si
si
si
Frost hazard
medium severe
si
si
si
s3
si
si
s3
54
very
severe
s2
s3
n
n
extreme
s4
n
n
n
d) Combination:
The lowest of these three individual suitabilities gives the 'climatic
The individual suitability ratings for length of growing period, moisture and frost hazard can be
printed on request. Example of an outprint is given in Table 3.5 (p.66).
This program is called by option 'Climatic suitability' in the Main Menu.
GILES/Appendb< 7: Land Evaluation Models
225
App.7.5) SOIL SUITABILITY ASSESSMENT (module 'sosuit')
This module matches 5 soil parameters (land qualities') with the corresponding soil requirements
of a specific crop:
a) Oxygen availability: Drainage characteristic of the soil is matched with the drainage sensitivity
(see Table A7.11; below) of the crop, resulting in an oxygen availability suitability.
lf a crop is highly capable to extract residual moisture and thus planted on heavy soils after the
rainy season (e.g. chickpea, lentil, vetch) and following soil parameters are given:
- montmorillonitic clay
-> 100 cm rooting depth
- < 8 % slope gradient
oxygen availability (after the rainy season) for this crop is considered as s1.
Rice (or any other crop wlth '0' as drainage sensitivity class) is always assessed as si.
Under the land improvement of 'minor drainage measures' it is assumed that:
imperfect drainage --> moderately good 1, or
poor drainage
--> imperfect 1, or
very poor drainage --> poor 1.
Under the land improvement of 'major drainage measures' it is assumed that:
drainage worse than or equal to moderately good
--> good, if texture is finer than sand
drainage worse than or equal to imperfect
--> moderately good, if sandy texture
1
If soil is vertic (montmorillonitic clay)
GILES/Appendbc 7: Land Evaluation Models
226
Table A7.11
Drainage Suitability
Drainage
sensitivity
of crop
Drainage
very poor imper-moderat.good somewh. excess.
poor
fect good
excess.
tolerant
moderately tolerant
moderately sensitive
sensitive
si
s2
s4
n
n
s2
s3
s4
si
sl
si
s2
si
si
si
si
sl
si
si
si
si
si
si
si
b) Nutrient availability: For N and P and K the resources of the soil are calculated. Under high input level with fertilizer input, the nutrient retention (CEC) is calculated instead of the nutrient
availability (see p.229).
The N content of the soil is matched against the N requirement of the crop (see Table A7.12;
below), the same for P (see Table A7.13; below).
Table A7.12
N Suitability
N requirement
of crop
very low
low
medium
high
very high
Low input level
Nt
low medium high v.high
s2
s2
s3
s3
s3
si
si
s2
s3
s3
si
si
si
s2
s2
si
si
si
si
si
Medium input level
Nt
low medium high v.high
si
s2
s2
s3
s3
si
si
si
s2
53
si
si
si
si
s2
si
si
si
si
si
GILES/Appendix 7: Land Evaluation Models
227
bb) P:
Table A7.13
P Suitability
P requirement
of crop
very low
low
medium
high
very
high
Low input level
P avail.
low medium
s2
s2
s3
s3
s3
si
si
s2
s3
s3
high v.high
si
si
si
s2
$2
si
si
si
si
si
Medium input level
avaLL
igh v.high
low medium
si
s2
s2
s3
s3
si
si
si
s2
s3
si
si
si
si
s2
si
si
si
si
si
The lower suitability of the N and P is taken as the nutrient availability assessment.
At low input level, if subsoil or topsoil pH shows a pH value of < 5.2 or > 8.0, the suitability will be
decreased by one.
At medium input level, if the topsoil has a pH of < 4.5, the suitability will be decreased by two; if the
topsoil has a pH of 4.5-5.2 or higher than 8.0 or the CEC of subsoil is very low or the bulk density is
low, the suitability will be decreased by one class.
GILES/Appende< 7: Land Evaluation Models
228
bc) Retention (in case of high input):
The CEC of the topsoil (Table A7.14; below; column 38 of soil type characterization table), organic
matter content (Table A7.14; below), the topsoil and subsoil pH (Table A7.15; below) are matched
with the fertilizer response (crop requirement) to come up with the nutrient retention assessment.
Table A7.14
Fertilizer Response Suitability I
Fertilizer
response
of crop
Very low
Low
Medium
High
Very
high
Very
low
si
s2
s2
s3
s3
CEC of soil
Low Medium High
si
si
s2
s2
si
si
si
si
s3
s2
Very
low
si
si
si
si
Organic Matter
Low Medium High
si
si
si
si
si
si
si
si
si
si
si
si
si
si
si
si
Table A7.15
Fertilizer Response Suitability II
response
pH of topsoil/subsoil
<4.5 4.5- 5.3- 6.0-
of crop
Very low
Low
Medium
High
Very
high
si
s2
s2
s3
$3
5.2
5.9
6.6
si
si
si
si
si
sl
si
sl
si
si
si
6.7- 7.4- >8.0
si
si
si
si
7.3
si
si
si
si
si
7.9
si
si
s2
s2
s2
s2
s2
s3
s3
s3
If the bulk density is low, the assessment can not be better than s2.
The lowest of these individual suttabilities is taken as the fertilizer response assessment.
si
si
si
si
si
GILES/Appendbc 7: Land Evaluation Models
229
c) Rooting conditions: Depth of the soil (limited by solum or groundwater) is matched with the
rooting depth of the crop at different suitability levels (crop requirement: Rooting requirement).
If constraints due to mineral fragments in topsoil and/or subsoil, consistence and bulk density exist, the suitability wUl be downgraded:
If the mineral fragment content in topsoil and/or subsoil, and/or a clayey texture combined with a
high bulk density, and/or a very hard/sticky consistence occurs, the suitability will be downgraded
by one class.
If the mineral fragment content is above 75 %, the soil is not suitable.
*Or***
e) Flood hazard: Both the flash flooding situation is matched (see Table A7.16) with the sensitivity
of the crop for flash flooding (crop requirement: 'flash flooding requirement') as well as the ponding situation (see Table A7.17) with the sensitivity of the considered crop for ponding (crop require-
ment: 'ponding/ flooding sensitivity). The higher constraint of these two assessments is considered as the flood hazard suitability.
In montmorillonitic clay soils with a depth of more than 100 cm, slope of > 13 % gradient, flood
hazard constraints are not considered for crops growing on residual moisture.
Under the land improvement: 'flood protection' it is assumed that there are no flood hazard
problems. With the assumption of 'minor drainage measures', exceptional flash flooding can be
controlled and ponding problems do not occur, unless there is very severe ponding. With the assumption of 'major drainage problems', even these are eliminated.
Table A7.16
Flash Flooding Constraints
Sensitivity
of crop
none
low
medium
high
si
si
si
Flash flooding
except.
sl
s2
s3
common
s3
s4
n
GILES/Appende< 7: Land Evaluation Models
230
Table A7.17
Ponding Constraints
Sensitivity
of crop
low
medium
high
very high
Ponding
none-slight moderate severe
si
sl
si
si
si
si
s2
s3
very severe peiLianent
s2
s4
s3
n
s4
n
n
n
n
n
n
n
f) Sodicity / salinity hazard: Topsoil sodicity, subsoil sodicity and salinity are matched (see Table
A7.17 and A7.18; below) with the sensitivity of the crop for sodicity and salinity respective (crop requirement: 'sodicfty sensftivity', 'salinity sensitivity'). The lowest suitability of these is the
sodicity/salinfty suftability assessment.
Table A7.18
Sodicity Suitability
Sensitivity
of crop
low
<6%
low
medium
high
si
si
si
Topsoil Sodicity
Subsoil Sodicity
medium high v.high low medium high v.high
<6%
6-15% 15-30% >30%
6-15% 15-30% >30%
si
si
$2
s2
s3
s4
s4
n
n
si
si
si
si
si
s2
si
s2
s2
s3
s4
s3
GILES/Appendix 7: Land Evaluation Models
231
Table A7.19
Salinity Suitability
Sensitivity
of crop
tolerant
medium
mod.sensitive
sensitive
nil
slight
Salinity
mode- strong
rate
<2
2-4
4-8
8-12
si
sl
si
si
si
s2
s2
s3
s4
s4
n
n
very extremely
strong strong
12-16 >16 mmhos
sl
si
si
si
si
s2
In case of soil associations, assessment is made for each of the occurring soil types.
The individual soil suitability ratings can be printed. Example of an outprint is given in Table 3.6
(p.70).
The module is called by option 'Soil suitability in the Main Menu.
*****
GILES/Appendb< 7: Land Evaluation Models
232
App.7.6) LAND SUITABILITY ASSESSMENT (module 'Iandev')
In this module the climatic and soil suitabilities are combined by considering the higher constraint
of these two assessments (see Paras. 3 and 4 of this appendix; Liebigs 'Law of minimum').
Additionally, for the land suitability assessment following two parameters are taken into consideration:
a) Erosion hazard: The quantitative sheet erosion hazard is calculated based on
USLE/Wischmeier formula, mcxlified by Humi (1985), with consideration of the present, observed
erosion status, as explained in Para. 1 of this appendix: See Table A7.23!
With minor soil conservation measures (always under high input level) it is assumed, that:
mean maximum slope of 6-25 % are leveled to 4-6 % (with slope length of < 50 m),
moderate gully occurrence is decreased to slight, or
slight gully occurrence is decreased to nil.
With major soil conservation measures, it is assumed, that
at slopes <25 % , and
slopes 25-40 % with depth of > 50 cm, and
slopes > 40 % with depth of > 100 cm
erosion hazard can be stopped (except at badlands)
The quantftative soil loss is calculated, following the formula of App.7.1 (see p.211), but with consideration of crop specific erosion characteristics (crop requirement 'erosion resistance', C) and a
management factor (V = 0.8 at low and intermediate input level, 0.7 at high input level).
Table A7.20
Erosion Hazard Suitability
Soil
loss
< 10
10-30
30-75
> 75
Gully erosion status
noneslight moderate severe
sl
s2
s3
s4
s2
s3
s4
n
badland
$3
s4
s3
s4
n
n
n
n
For annual crops without major conservation measures at slopes of 25-55 % erosion hazard
suitability can not be better than s4, at slopes of > 55 % it is always n.
GILES/Appendix 7: Land Evaluation Models
233
b) Workability: The constraints due to slope, surface stoniness, surface rockiness, consistence,
topsoil structure (only if consistence is not loose/nonsticky), vertic properties and 'hard' clay are
rnatched (see Table A7.21; below) with the working requirement of the crop (crop requirement:
'workability requirement).
Under intermediate and high input and on special request at low input level, it is assumed that
stone clearance is made:
gravely or stony > non stony
> stony
very stony
GILES/Appendix 7: Land Evaluation Models
234
Table A7.21
Workability Constraints
Land
Characteristic
Slope
<4
4- 6
6- 8
8-13
13-25
25-40
40-55
55-100
> 100
Input level
low & intermediate
Crop requirement
low medium high
si
si
si
si
si
si
s2
s3
s3
si
si
si
si
si
s2
$3
s4
$4
si
si
si
si
s2
s3
si
si
si
s2
$3
s4
s1
s1
high
Crop requirement
low medium high
si
si
si
s2
s3
54
si
si
s2
s3
54
si
s2
s3
s3
54
s2
s2
s3
n
si
si
si
s2
s4
n
si
s2
s2
s3
si
s2
s2
s3
s4
s4
n
n
si
si
si
si
si
si
si
s2
s2
£3
$4
n
s2
s3
s3
s4
n
s2
s4
n
n
n
si
s2
s3
n
n
n
si
si
s2
si
si
si
si
si
$4
Surface stoniness
non stony
non st,grav
stony
very stony
exc.stony-1
exc.stony-2
si
si
s1
s1
s2
53
Surface rockiness
< 0.1 %
0.1- 2 %
2
-10 %
10 -25 %
25 -50 %
50
-90 %
> 90 %
si
si
si
s2
s2
$3
s4
n
52
s4
n
n
n
n
Consistence:
loose/non-st
hard/non-st
hard/sticky
v.hard/stick
si
si
si
$2
s3
s2
s3
s2
si
si
si
s2
si
si
s2
s3
Combination: Downgrading of the climatic + soil suitability is made based on the erosion and the
workability assessment whichever suitability is lower. Thus, the lower suitability of the following two
tables stands for the final suitability:
235
GILES/Appendix 7: Land Evaluation Models
Table A7.22
Land Evaluation Rating Due to Erosion
Erosion
assessment
si
52
53
s4
ri
Climatic + soil suitability
si
s2
s3
s4
Si
52
52
S3
S4
N
S3
S3
53
54
S4
54
S4
S4
N
S2
53
S4
N
N
N
N
N
N
N
Table A7.23
Land Evaluation Rating Due to Workability
Workability
assessment
Climatic + soil suitability
si
s2
s3
s4
s2
Si
Si
s3
s4
S2
S3
52
S2
52
53
S4
S4
54
S4
n
N
N
S3
S3
53
S3
N
si
N
N
N
N
N
N
The individual suitability ratings for erosion hazard and workability and their downgrading of the
land suitability can be printed out on request. Example of an outprint is given in Table 3.7 (p.74).
This module is called by option 'Land suitability' In the Main Menu.
GILES/Appendix 7: Land Evaluation Models
236
App.7.7) PRECIPITATION STATION REFERENCE (module 'adjust')
If the precipitation data base is poor, reference of poor rainfall stations to rainfall stations with a
better data base gives the chance to calculate characteristic values (mean, standard deviation
etc.).
For the interpolation, tt is necessary to give the relation between the stations. For this, data entry is
going through all stations to give one to three reference stations wtth their weighting (importance,
expressed in integer figures, e.g.station with weighting 3 will be weighted three times as high as
station with weighting 1).
When defining the reference stations and their weighting, attention has to be given, that:
- there is a clear hierarchy of reference relations
station(s) wtthout missing data are at the bottom
- poorest station(s) are at the top
- no counter, circular or upwards references occur
- not more than 3 reference steps from the top to the bottom station(s)
Basically, at each missing value it checks the mean, standard deviation and probability-of-no-rain
with and without the months without rainfall of the reference stations at the missing month. Then, it
calculates the below mentioned values out of the available input figures and out of the reference to
the other stations.
The outprint will show:
uncorrected monthly mean,
uncorrected monthly standard deviation,
number of monthly recorded years,
uncorrected monthly mean without months without rainfall,
uncorrected monthly standard deviation without months without rainfall,
number of monthly recorded years without months without rainfall,
corrected monthly mean,
corrected monthly standard deviation,
corrected monthly mean without months without rainfall,
corrected monthly standard deviation without months without rainfall,
monthly probability of no rainfall,
corrected coefficient of variance,
corrected coefficient of variance without months without rainfall.
An example is shown in Table 3.14 (p.91).
This module is called by option 'Database' in the Main Menu, then option 'Precipttation data' and
by 'fill missing data'.
GILES/Appendix 7: Land Evaluation Models
237
App.7.8) GENERATION OF PRECIPITATION DATA (module 'gamma')
This procedure generates rainfall figures out of the monthly mean (without the months without
rainfall), standard deviation (without the months without rainfall) and the probability-no-rain, which
can be calculated by module 'adjust' (App.7.7).
To calculate long term average rainfall data at different reliability levels, a large number of years
have to be generated (e.g. 200).
For generation of monthly rainfall data for further processing, e.g. in length of growing period assessments, a number of 20 is the minimum. A greater number of years will improve the quality of
the simulation models, but increases considerably the processing time.
If the input data (mean(0), standard deviation(0), probability-of-no-rain) are not in the system, entry
mode is given to enter these three values for each month for each station or mapping unit.
Display of all generated figures is given at the screen.
Example of an outprint is given in Table 3.13 (p.90).
This module is called by option 'Database' in the Main Menu, then option 'Precipitation data' and
'Calculate long term averages at different reliability levels' and 'produce randomly distributed rainfall figures' respectively (for further processing).
GILES/Appendix 7: Land Evaluation Models
238
Table A7.24
Maximum Obtainable Yield (0)
In the Highlands of Ethiopia
Crop
Banana
Barley
Cabbage
Cassava
Chickpea
Citrus
Coffee
Cotton (seed)
Field pea
Flax (linseed)
Grape
Groundnut
Haricot Bean
Horse Bean
Lentil
Maize
Millet
Nigerseed
Oats
Pepper (chilli)
Pineapple
Potato (Irish)
Rice (upland rice)
Safflower
Sesame
Shallot (onion)
Sisal
Sorghum
Soybean
Sugarcane
Sunflower
Sweet potato
Tea
Teff
Tobacco
Tomato
Vetch
Wheat
Input level
Low
160
Interm. High
220
320
High-mech.
-400
14
18
24
30
200
80
260
280
360
480
11
240
450
600
6
8
140
180
6
5
11
10
14
10
90
12
7
50
20
18
16
14
160
24
16
20
14
300
25
22
20
18
200
12
15
15
13
14
17
17
20
30
7
6
14
25
18
38
10
24
64
12
14
200
120
300
180
480
280
15
18
12
24
7
20
600
350
30
25
5
8
14
18
150
140
220
280
21
320
560
400
700
40
20
1500
30
300
7
14
8
20
48
28
11
400
13
32
16
600
1200
8
14
24
100
150
12
11
240
28
30
20
25
25
60
35
30
80
7
18
14
12
300
400
520
650
8
10
23
12
32
15
40
17
Yields are in 0 (100 kg); Source: FAO 1987 c
18
20
35
22
25
239
GILES/Appendbc 8: Structure of Programs
Appendix 8
STRUCTURE OF PROGRAMS
The retrieval procedure of all models is explained in Section 3.2 (p.105) for the user, their functions
In detail in App.7 (p.211) for evaluation experts.
In the following, the computer-internal program structure of the computer programs and modules
and their processing are presented in a rather detailed way to give system analysts an overview of
the programs. Therefore, this appendix is addressed only to computer programmers familiar with
Basic computer language and in particular with QuickBasic, version 4, of Microsoft. The source
codes (structured Basic) can be requested from FAO-Headquarter-AGL division.
App.8.1) SELE1
The main function of this program is the selection of the chained program (through variable SEP)
and the definition of the essential control variables passed over (through 'common' command).
Table A8.1
Definition of SEP
SEP
1
2
3
4
5
6
7
8
9
Program
creq
arsize
gridinf
gridmap
gridsup
gridcomp
eros
erorec
lgp
Explanation
page
243
243
244
244
245
245
246
247
247
SEP
10
11
12
13
14
15
16
17
18
Program
Explanation
page
clsuit
sosuit
249
249
landev
datach
digittab
seledos
selecont
digithlp
243
242
251
241
241
242
The program is called by entering 'GILES' at the DOS prompt C: or by pressing function key F10
within GILES.
The start handles inclusion of file 'decisin' and checking of installed graphic facilities.
GILES/Appendb< 8: Structure of Programs
240
If chaining of various functions is selected (through 'selecont'), the variable CONTNO is > 0 and
variables defining function, crop, input level, outprint, storage etc. are read from file
'C:\LANDEV\CONTFILE.DAT'.
Altemattvely to the selection of sheet/run/x/y coordinations, option is given to selection of one
location (pixel) by giving tts coordinates in the latttude/longitude system or in the UTM system.
Conversion rules:
from UTM to latitude/longitude:
360
Lat
= NUTM
Long = (EUTM
2 * 6334 * 3.14159 *
500)
LongCor
360
*
2 * 6378 *
cos(Lat)
*
3.14159
+
LongRef
from latitude/longitude to UTM:
NUTM = Lat * 2
* 6334 *
EUTM = (Long-LongRef) *
3.14159
cos (Long-LongRef)
*
360
2 * 6378 *
3.14159
cos(Lat)
*
= North coordinates in UTM system
(distance to equator in km)
= Longitudinal coordinates in UTM system
E UTM
(distance to central meridian - 500 in km)
= Latitude North in degrees, with decimals
Lat
= Longitude East in degrees, with decimals
Long
LongRef = 27, when longitude between 23°30' and 30°30'
33, when longitude between 29030' and 36°30'
39, when longitude between 35°30' and 42°30'
45, when longitude between 41030' and 48°30'
LongCor = Abs( cos(Long-LongRef)
Correction factor which can be applied if
Long is already calculated in approximation
where* N UTM
'
500
360
)
For base map retrieval ('gridmap', 'gridsup', 'gridinf), the variables THEM$ (for opening the particular files), SM and THEMPRINTS (for printing the title) will be defined to express the map theme:
241
GILES/Appendb< 8: Structure of Programs
Table A8.2
SM Values of Base Maps
THEM$
Predefined maps:
SOIL
(SOIL
ALT
Additional maps:
SM
1
2
3
PREC
VEG
4
ADM
6
7
8
AEZ
PLZ
,
reserved for soi1 types)
5
9-17
It is possible to read selected mapping units from a DIF file: The first 18 read values characterize
the DIF file. Consequently LOT$ (for the mapping unit) and LOTPREV$ (for the new aggregated
mapping unit) are read until 'EOD' is reached.
Any crop specific treatment (with AVSP =2) requires the name of the crop (LUT$) and the input
level (LTLT= number of crop, combined with input level).
App.8.2) SELE3
This is the continuation module for selection of the parameters.
In particular, the form of output will be defined: PRY stands for outprint of map (PRY =1 on
FX/LX/EX 9-pin matrix printer, 2 on LO 24-pin matrix printer; PRY = 100 on plotter; with the scale of
Sc * 1000), PRLEG (0 or 1) for the outprint of the legend, STOR (0 or 1) for storing the maps on
disk (with the number STORNUM, 1-9), GIL2LOT (0 or 1) for storing the output tables on Lotus
compatible file (with number TRANSFER =1-5).
At the end of this program chaining will be done into the individual executing modules.
App.8.3) SELEDOS
This program handles the DOS facilities of GILES, such as copying, typing, deleting files or showing directories (see Section 3.2.1.17; p.96) through 'shell' and exit to GILES.
The program is called by option 'File operation' in the Main Menu (SEP = 16).
App.8.4) SELECONT
Through this program it is possible to chain various GILES procedures and write chain parameters
into a queue in file 'CALANDEV\CONTFILE.DAT (see Section 3.2.1.15; p.95).
GILES/Appendb< 8: Structure of Programs
242
The program is called by SEP = 17 (option 'Chaining of various selections' in the Main Menu.
For each requested procedure, the variables SEP (program), LTLT (crop and input level), LIMPR
(land improvement), PRY (print of map), PRLEG (print of legend), STOR (storage), STORNUM
(storage number), number of stored map 1 and 2 for map overlay (STMAP1, STMAP2), total number of units of overlaid map (MAXNO), source files for copying (THEM$, PATHFL2$) are defined
and stored under the number of the process In file 'CONTFILE.DAT'.
The program is called by option 'Chaining of various procedures' in the Main Menu (SEP =17).
App.8.5) DIGITTAB
This module manages the digitized entry of maps either through digitizing tablet or numeric
keypad or combination of both, including the possibility of correcting the map input (see Section
3.2.1 n, p.87).
The 5 mm move will change the variable C (column) and/or R (row) by + 1. The x-y-coordinates of
all (max.600) points will be assigned to UN%(1..600,1) for x and to UN%(1..600,2) for y. Thus, in
this stage it is a vectorial system.
Next part runs the conversion from the vector reading into a grid cell system (raster system) by
checking the on and off mode of the mapping unit for each row, following the scan line approach.
There is a warning message if a particular pixel was assigned already beforehand.
The program is called by option 'Entry of base map' in the Main Menu (SEP =15). It has the submodule 'DIGTBSE3'.
App.8.6) DIGITHLP
This map entry utility program gives the possibility to check or to change entered digitized maps.
Two maps, with pixels row-wise assigned to D1%(1..28) and D2%(1..28), can be compared with
each other and, if they differ (i.e. one map shows outside, the other one inside the study area), a
print of 'Reduction necessary' or 'Enlargement necessary' with the particular location will appear
and eventually the corrected (if ONLYTOSM =2) array (MAP%(1..28,1..111)) will be stored in part 5.
Another part handles the replacement and checks, if a pixel is covered by one of the units to be
changed (OLDUN%(..)) and, if yes, the new unit NEWUN%(..) is assigned and continued with the
next pixel.
The program is called by option 'Systematic change of base map' in the Main Menu (SEP =18).
GILES/Appendb< 8: Structure of Programs
243
App.8.7) CREO
This database module is for entering, correcting and retrieving crop requirements essential for
crop suitability assessments.
The crop requirernents will be read from random access files "CRE01.DAT (for crop requirements
1-20) and "CRE02.DAr (21-40) into array CRO%(1..40). Writing of the newly defined crop requirements to these two data files is organized.
The program is called by option 'Database' in the Main Menu (SEP=14), then option 'Crop
requirements'.
App.8.8) DATACH
Except the maps (map files; see Paras. 4 and 5 of this appendix), all data in GILES can be entered
or modified through this module (1400 lines, 83 k).
The program is called by SEP = 14 (option 'Database' in the Main Menu.
A newly assigned variable SEP (defined in menu 14.1) selects the file to be modified (e.g. SEP = 2:
MUC file, SEP = 6: COR file) and thus the access to the referring block. Variable ACT gives the action number (1: declare a new data set - 2: change data - 3: change dimension - 4: display - 5: print
- 6: import from Lotus file). Each of the blocks has 4 subsections (controlled by ACT) for the
various modifications.
For manipulation of study area definitions, crop requirements and precipitation data, this program
serves as a transfer (to 'datasta', 'creq', 'pinput').
The program is called by option 'Database' in the Main Menu (SEP =14). It has the submodule
'DATACHSB'.
App.8.9) DATASTA
This submodule runs the definition of all map sheets.
The program is called by option 'Database' in the Main Menu (SEP = 14), then 'Study areas'.
App.8.10) ARSIZE
This program calculates the area sizes of all units of the base maps for the total area or per sheet
or run.
Area size files can be created by loading the run(s) into the array MAP%(1..28,1..111) and then increasing the ACOD$(...,3) array by one for each pixel per occurring mapping unit.
GILES/Appendix 8: Structure of Programs
244
The program is called by option 'Area sizes' in the Main Menu (SEP =2).
App.8.11) GRIDINF
AH available information retrievable from the base maps are displayed or printed for a particular
location through this program.
The main program contains several blocks, each with error trap routine (in case the requested
map, mapping unit code or translation table is not input yet, in order to bypass this block), call of
the data file, print of the parameter and print of the result.
The program is called by option 'Site specific information' in the Main Menu (SEP =3). It has the
submodule 'GRIDIFSB'.
App.8.12) GRIDMAP
It gives all computer retrieve facilities of the entered base maps: Display, print, plot or computer
storing of the entire area, of one sheet, one run or a window of all units or of specified units only.
All print subroutines are defined in one part, in particular those for printing the symbols on screen,
paper or file and for printing the title of the map, the coordinates and the legend.
The main program is split into 5 submodules:
Submodule 1 runs the retrieval of 'complete' base maps (SM <100 (exc.2) and ALSP =2). Processing from the top line of the map towards the bottom line: from N to S (YYY counter; default 111-1)
and, within, from left to right: from W to E (XXX counter; default 1-28 or, with smaller scales at
matrix printer, 1-56), it displays all units with their mapping unit codes as defined in program
'datach' (see Section 3.2.1 m, p.86). Special attention is made if the unit is not assigned (DDS =0)
or assigned with "OUT C.', then DDS =0).
Submodule 2 handles the output of 'selective' and/or 'aggregating' base maps (SM <100 (exc.2)
and ALSP=3). Proceeding in the same way as above, it checks, if the pixel is in the definition of
any newly defined mapping unit (content of array CHE%(1..400,1..70). It it does, the code of the
new mapping unit (CUNOMUSP) will be displayed. If not, it will show a blank area.
Submodule 3 shows the soil types interpreted out of the soil map (SM =2 and ALSP=3, with soil
mapping units) when asked for specific soil types ('selective' version). In principal, the same procedures are performed as in submodule 2, but interpretation is made through the soil mapping unit
composition table giving the soil types per soil mapping unit.
Submodule 4 retrieves 'parametric' maps in the 'complete' version (SM>100 and ALSP=2).
Processing as in the other modules from N to S and from W to E, it shows the required parameter
(characteristic, e.g. drainage: very poor) for each pixel. This is read out of the translation table(s)
(e.g. land characteristic which is read out of soil mapping unit composition which is read out of soil
GILES/Appendix 8: Structure of Programs
245
mapping unit; or: structural characteristic which is read out of the administrative unit). At queries to
be answered out of the altitude, calculations are made based on the found unit (altitude) and the
latitude-correlation file (e.g. temperature of January); similar with the precipitation data.
Submodule 5 acts in a similar way, but there the 'parametric' map (SM >100 and ALSP =3) is
shown in the 'selective/aggregating' version. The unit of the translation table(s) is checked, if request was made for It (content of array CHE%(1..400,1..70); see above) and, if yes, groups It into
the 'new' mapping unit (CUNOMUSP). If not, a blank area will be shown.
At the end of each run, check is made, if plotting, high resolution display or file saving is requested.
At the former two options the array MAPPL%(1..110,1..111) will be given after each map sheet to
the include file 'maplotin' (for plotting) or part 9 (for high resolution display).
For saving a composite file, all rows of cells C$" + SYMB$(..)) were assigned to DCBA$(..) for
column 1-28 or to HGFE$(..) for column 29-56 and will be written to file 'DGgCMPmn.MAP' in
CAINTERM\ with 'DGaCMP.NAM' in part 7 after each run. If writing to an ASCII ('print') file is requested (STORNUM = 10), the strings of the pixels values will be written, with "/" instead of "$" to
import them as text into Lotus, to file 'DGOCMP>a.PRN'.
The subroutine for plotting of maps is explained in App.8.25 (p.255).
The program is called by option 'Base maps' in the Main Menu (SEP =4). It has the submodule
'GRIDMPSB'.
App.8.13) GRIDSUP
This module displays all areas which fulfill all required parameters as defined.
The array SM(1..10,1..30) of 'selel' contains the mapping units giving the numbers of the overlaid
maps (first variable, SMCNT loop) and the accepted, requested mapping units within the overlay
map (second variable, CHECNT loop). For each pixel, checking is done if the found mapping units
of all overlaid maps can be found in the array SM. E.g. if 5 maps are overlaid, it checks if mapping
unit of map 1 is in column SM(1,...), if yes, Ft checks if mapping unit of map 2 can be found in
column SM(2,...), if yes, it looks in the same way for map 3,4 and 5. Only if all answers are positive,
tt is true that this location fulfills all requirements and a black (#") is printed ('yes').
The program is called by option 'Overlay of base maps' in the Main Menu (SEP =5). It has the submodule 'GRIDSPSB'.
App.8.14) GRIDCOMP
This program performs only processing of previously created ('configured', 'composite') maps,
stored under map file 'DGgCMPmn.MAP (with 'DGaCMP.NAM') in C:\INTERM\ (where g number
1-9, m sheet number, n run number). It can overlay, window, combine and plot them in almost any
way.
GILES/Appendix 8: Structure of Programs
246
The program is called by SEP = 6 (option 'Overlay/reprint of previously configured map(s)' in the
Main Menu.
In case of overlaying selected window/areas, it checks for each location (grid cell, running from N
to S and from W to E), first the selected area (variable SELSEL; for window: SELSEL= 1) and then
the occurring mapping unit (variable SYMBSYMB) and increases the variable In array
CNT(SYMBSYMB,SELSEL+1) by 1. ff less than 8 selected areas and less than 11 main mapping
units were defined, storage is possible through SYMBTM$ array. This file can be retrieved later
(e.g. for a second overlay).
If various suitability maps are overlaid (ONLYSUIT=1), the suitability assessments for all suitability
maps (number of suitability maps: 1,3,5,7,9; their total number: NUMMAP), coded by values of 1
(Si) - 5 (N) per soil type, then by values of 1 (all Si) - 15 (all N) per soil association, are retrieved,
decoded (through LEVSEP%(..)) and then assigned to LEVFSL (50 % of the unit) and LEVFSR (50
% of the unit). For each of these two half units, the lowest of the assessments of the suitability
maps is the final one; the combination of the two units is coded (though LEVAGGR%(..)) and then
assigned to LEV%.
In case of 'simple' retrieving of a previously configured map (NUMMAP =1), it differentiates if the
retrieved map is a suitability map (THEMEVAL=2; without "$") or any other thematic map
(THEMEVAL =1; with '$" in the 'DGxCMP)oc.MAP' file).
The program is called by option 'Overlay/reprint of previously configured maps' in the Main Menu
(SEP =6). It has the submodule 'GRIDCPSB'.
App.8.15) EROS
This program runs the quantitative assessment of annual sheet erosion (t soil loss/ha/yr) and the
hazard by gully erosion.
In the main program, checking is made first for the entire selected area, which soil and precipitation mapping unit combinations occur. These will be identified by a '1' in COMB$(..,..,1). The combinations are processed through the second part where access is given to part 6: Erosion estimate
model. The calculated erosion value will replace the '1' in COMB$(..,..,1).
After this checking, the program runs again through the entire area to allocate the calculated value
to each pixel (COMB$(..,..,1) assigned to SYMB$), prints SYMB$ on screen, paper and/or on
'DGaCMPxx.MAP' files (with 'DGACMP.NAM') and adds the area size of this unit (through
SYMB$(THTH)). In case of assessing the neighborhood of gullies (for slip and gully erosion assessment, SHORSG=2), it checks for each pixel the surrounding 8 pixels in the arrays DSU%,
DAU%, DSD%, DAD% for their erosion status (subroutine in part 7, mcxlifier SGEH).
In part 6 the quantitative sheet erosion hazard is defined (see App.7.1;
p.210). The annual
precipitation per precipitation mapping unit and the erosivity class per soil type are required for the
sheet erosion loss and have to be entered manually into the program.
Next part runs the handling of the slip and gully erosion hazard, considering the soil types (entered
manually), erosion status and slope and expressed through SGEH (1-4).
247
GILES/Appendix 8: Structure of Programs
The program is called by option 'Erosion hazard' in the Main Menu (SEP =7). It has the submodule
'EROSSB'.
App.8.16) EROREC
Interpretation of erosion haz_ard and erosion related parameters (e.g. slope) allow the definition of
potential major kinds of land uses and need for conservation measures through this program.
The main program is equal to the main program in 'eros' (see App.8.13): Checking for all soil and
precipitation mapping unit combinations, then their processing in part 6, then allocation of the calculated value to each pixel and print.
The model for the conservation measure recommendations is defined (see App.7.2; p.215 and
'eras' description above). First part, for the calculation of sheet erosion loss, is equal to 'eros';
second part checks for threshold values of soil depth, erosion status and slope and gives the REC
value. At the end, they are aggregated (with new REO values).
Next part runs the handling of the slip and gully erosion hazard, considering the soil types (entered
manually), erosion status and slope and expressed through SGEH (1-4).
The program is called by option 'Conservation based land use recommendation' in the Main Menu
(SEP =8). It has the submodule 'ERORECSB'.
App.8.17) LGP
The length of growing period calculation is based on a decadal soil moisture balance model (see
App.7.3; p.215) and executed.
The main program checks first the entire map for occurring combinations of precipttation, altitude
and soil mapping untts and writes a '1' in string COMB$(1.. no.of soil mapping units, 1..no.of
precipitation mapping untts) for the combination. If COMB$ is too large for the memory of the computer, COMBALT will be '1' and the file 'COMBALT' in drive D with the total number of soil mapping
units as the total number of records will be used.
Second, it calculates the LGP assessment in part 8 for all occurring combinations of these 3 overlays the LGP assessment in part 8, last, it runs again through the entire map and prints the calcu-
lated values on screen,
printer and/or on 'DGgCMPmn.MAP' file with 'DGaCMP.NAM' in
CAINTERMV
The LPG model is explained in App.7.3 (p.241). For an occurring precipitation - attitude - soil combination the available water holding capacity/capactties is/are calculated (if CLSLS=ar). Then, tt
reads monthly precipitation figures of 20 years (if they were generated, GENPREC=1, on a defined
random basis) and interpolates these or
it
uses the actual decadal precipitation figures
(MMMAX=36 from file RANDF1L$='xPREC.TWY) as well as the monthly PET figures (out of the
correlation with the altitude) to form decade! precipttation and PET figures.
GILES/Appendix 8: Structure of Programs
248
Two loop complexes are following: The year loop (YY=1-20) and, within, the decade! loop
(DECDEC=1-36). In the latter, the model with all quantitative moisture input and output is
processed, resulting in a string (LGP$) showing the LGP of one year. Outside the latter, but still
within the year loop the definition of the main and of the second rainy season is done. After
processing 20 years, the mean, the minimum (mean - a * standard deviation), maximum (mean +
a * standarddeviation, a =f(reliability level) ) is calculated.
for each pixel in DCBAS
In the next part the LGP units (with
resp. HGFE$) are stored In file(s) 'DGaCMPmn.MAP' with 'DGACMP.NAM' in CAINTERM\ (where a
= STORNUM, number of 1-9).
The program is called by option 'Length of growing period' in the Main Menu (SEP= 9). It has the
submodule 'LGPSB'.
GILES/AppendN 8: Structure of Programs
249
App.8.18) CLSUIT
Based on the LGP assessment, but with consideration of altitude/ temperature hazard and frost
hazard, the climatic suitability of a crop is calculated.
The main program in part 7 is equivalent to the main program of 'Igp' (se-e App.8.17, above).
The first block of the 'climatic suitability model' in part 8 (explained in App. 7.3; p.216) is identical to
the LGP model of
rt 8 of 'Igp' (see App.8.17, above). But it only uses the mean and standard
deviation of the longest rainy season (KREMPTMEAN, KREMPTSDEV) and matches these with the
crop requirement (LGPCONS).
The calculated temperature (TEMP) and the assessed frost haz_ard (out of ALTIT regression) are
matched with their corresponding crop requirements (TMAXSa, TMINSa, FRSENS).
The program is called by option 'Climatic suitability' in the Main Menu (SEP =10). It has the submodule 'CLSUITSB'.
App.8.19) SOSUIT
Seven land qualities are compared with the requirements of the crop to assess the suitability of the
soil for the crop through this program.
The main program checks first the entire map for all occurring soil types. Second, it c,alculates the
soil suitability for all occurring units, with access to part 7, and assigns the added value of the
suitability of the two half (1-25) to LEV, then converted into ASCII code (LEV$) which replaces the
'1' in COMB$(..).
At last, it runs again through the entire map and prints the calculated values for each pixel on
screen, paper and/or on file (1-25 code, without S").
Next part calculates the soil suitability assessment as explained in App.7.5 (p.226). Attention is paid
to eventual land improvements (UMPR) which can change land characteristic values. The land
qualities are treated in various blocks.
The program is called by option 'Soil suitability' in the Main Menu (SEP =11). It has the submodule
'SOSUITSB'.
App.8.20) LANDEV
The combination of climatic and soil suitability ('ecological suitability') with consideration of erosion hazard and workability constraints give the 'land suitability' for a given crop ', executed
through this program).
Subroutines open and read base map files and composite map files ('DG1CMPmn.MAP' and
'DG1CMP.NAM' with climatic suitability, 'DG2CMPmn' and 'DG2CMP.NAM' with soil suitability).
GILES/Appendix 8: Structure of Programs
250
The main program checks the entire map for all occurring soil and precipitation units and assigns a
'01 for each found combination into COMB$0. Second, tt runs the access to part 9 for all occur-
ring units, replacing '01' with LEV$. At last, it runs again through the entire map, selects of the
climatic suitability (Doi) and of the soil suitability (DD2, converted from 1-25 code into 11-55 code)
whichever is lower and gives this 'ecological suitability' to LEVI (50% of the unit) respectively LEV2
(other 50% of the unit). The downgrading due to erosion and workability constraints (COMB$0
gives LEVEROS and LEVWORK) is then expressed through FINLEVEROS% and FINLEVWORK%.
The land suitabilities LEV1 and LEV2 are converted back to 1-25-code for storing and to 1-15-code
for printing.
At last, it runs again through the entire map and prints the calculated values for each pixel on
screen, paper and/or on file.
The evaluation parts calculates the erosion hazard (similar to part 6 of program 'eros', but with
consideration of land improvements) and workability assessments (see App.7,6, p.233) and returns
the ultimate downgrading out of these two assessments for the two soil types with their ASCII
codes through variable LEV$.
The program is called by option 'Land suitability' in the Main Menu (SEP = 13). It has the submodule 'LANDEVSB'.
App.8.21) PINPUT
'pinput' runs the precipitation data entry and correction and the access to further processing of
precipitation data in the programs 'adjust' and 'gamma' (see App.8.22 and 8.23; below).
Begin contains selection of options with either reading or declaration of the number of stations
(AMSTAT), of the first and the last year of observation period (FIRSTY, LASTY) and if monthly or
decadal data are recorded (MMMAx: 12 or 36).
It reads and saves the data files under the name 'gPREC.DAT' (where g abbreviation of project
area, e.g. 'HOSPREC.DAT') with the preceeding variables of AMSTAT, FIRSTY, LASTY (see above).
If all data are available and therefore no generation (through 'adjust' and 'gamma') is necessary, it
is possible to convert the PREC%(..,..,..) data of file 'APREC.DAT' straight into a '4PREC.TWY' file,
which is necessary for the LGP and climatic suitability assessment. Record no. 1 in the random access file 'APREC.TWY' contains an indicator, ff data are generated (GENPREC = 1: yes -0: no), and
one for observation frequency (MMMAX=12: monthly - 36: decadal).
The program is called by option 'Database' in the Main Menu (SEP = 14), then option 'Precipitation
data'.
GILES/Appendix 8: Structure of Programs
251
App.8.22) ADJUST
The 'adjust' procedure is particularly designed for a very weak precipitation data base. Monthly
precipitation data gaps are set in relation to data of reference station(s) at the same year to calculate the (modified) ¡monthly mean, standard deviation and probability-of-no-rain, which enable the
generation of precipitation data through module 'gamma' (see App.8.23; below).
After reading the original precipitation data from file 'gPREC.DAT' (where g abbreviation of project
area), the program checks If the file 'ARELDAT' with the reference relations of the rainfall stations
already exists. If not, they have to be entered into RELA%(...,2..7), with storing. Rules of the
reference relations (see App.7.7; p.242) have to be carefully followed !
The main program runs through all 12 months, checking for all stations,
if
reference station is
given and, if yes, merges into subroutines of 1. and 2. level.
The file with the calculated can be be stored under the name 'gRES.DAT'.
The program is called by option 'Database' in the Main Menu (SEP =14), then option 'Precipitation
data', then option 'fill missing data (interpolation model)'
App.8.23) GAMMA
Mean, standard deviation and probability-of-no-rain (as calculated e.g. in module 'adjust', see
above) allow the generation of monthly precipitation data of any number of years in this program.
Mean (without the months without rainfall), standard deviation (without the months without rainfall)
and probability-of-no-rain are read out of file "gGAM.DAT (g abbreviation of project area). If there
are not input yet or not complete, they have to be entered.
The main program calculates alpha, beta, and n, part 6 gamma and c, part 7 the lower and upper
boundary and controls the access to the Simpson formula wbich is calculated in part 8.
The generated monthly rainfall figures are stored in random access file 'gPREC.TYVY' (in part 12),
the average data of a long term generation under various reliability level in the file 'gPREC.RLV' (in
part 13).
The program is called by option 'Database' in the Main Menu (SEP = 14), then option 'Precipitation
data', then option 'calculate long term averages' or 'generate randomly distributed rainfall figures'
Three 'include files' can be called by the main modules:
GILES/Appendb< 8: Structure of Programs
252
App.8.24) DECISIN
This submodule (100 lines, 6 k) displays the menus on screen and activates and reacts on all
potential command keys.
Menus are called by their menu record number.
When entering this submodule, arrow-yp, arrow-down and <Enter> keys are reactivated. Key trapping takes place as defined for function keys:
to access the on-line help menus which are stored in
the 'help.txt' and be called by the menu help number,
within this submodule,
F2
to go back to the previous menu (leaving this subroutine, with PREVMENU flag on),
F10 to go back to the start (leaving this submodule by
loading GILES again),
F1
arrow-up key to decrease the line number (CCSS) by 1,
arrow-down key to increase the line number (CCSS) by 1.
App.8.25) MAPLOTIN
This submodule acfivates the plotter driver and controls all commands for the plotter to draw the
requested map.
At the beginning, a plotter coordinate system is set to define the scale of the plotted map; optionally the frame can be drawn with tick marks and coordinates outside the frame lines.
a) To draw boundary lines:
Starting from the northwestern comer, the system checks for mapping units (YYYPPP loop from N
to S, and XXXPPP loop from W to E). When it finds an untreated unit, it will start to follow its bound-
ary and to draw this line on the plotter (executed in a subroutine). After the unit is closed, the
program assigns each pixel with a 'covered' value (+ 2000).
In a subroutine eight intemal modules with 24 submodules run the checkng of the continuation of
the boundary:
After each move (of one pixel length) XCUR and YCUR might be newly assigned and give the coordinates of the new pixel considered. Variable NEXTDRAW gives the location of the plotter pen in
relation to the considered pixel and runs therefore the access to the next module.
GILES/Appendix 8: Structure of Programs
253
Table A8.3
NEXTDRAW Value
1
2
3
4
5
6
7
8
right of the pixel,
left of the pixel,
below the pixel,
above the pixel,
left of the pixel,
right of the pixel,
above the pixel,
below the pixel,
moving
moving
moving
moving
moving
moving
moving
moving
down
down
to the
to the
up
up
to the
to the
left
left
right
right
Table A8.4
Plotter Movement Conditions
Coming
from :
up
2
3
4
5
up
right
right
down
Bordering the
pixel :
to the left
to the right
above
below
to the right
Which is di fferent
than the one :
to the right
to the left
below
above
to the left
6
down
to the left
to the right
7
left
below
above
8
left
above
below
Continuation to :
down
left
right
down
left
right
down
left
up
down
left
up
right
up
left
left
up
right
down
up
right
down
up
right
NEXTDRAW:
1
3
7
2
4
8
1
3
5
2
4
6
3
5
7
4
6
8
1
5
7
2
6
8
GILES/Appendix 8: Structure of Programs
254
Mapping unit boundaries at the margin of the sheet are not drawn.
If a label is to be given to this unit, the module checks for the center and draws the mapping unit
code. Additionally, at the end of each map any code (to be entered manually) can be drawn on any
place of the sheet.
b) To color units:
In case of filling the units with color, the program reads (from SW to NE) the mapping unit (=color)
and colors all units of no.1 with color 1, then all units of no.2 with color 2 etc. This reduces the
number of changing the color pens to a minimum.
App.8.26) COMMONIN:
This submodule consists of three lines with control variables of GILES which are global and therefore have to be passed over through 'common' when chaining from one program to another.
The include file will be included during compilation into all programs by call through lines 150, 160
and 170.
Following variables control the processing and retrieval procedures in programs explained in
Paras. 2-21 of this appendix. They are defined in 'sele1' and 'sele3'.
255
GILES/Appendb< 9:Recommended ASCII Codes
RECOMMENDED ASCII CODES
Following ASCII codes are used for definition of symbols both for outprint (fonts') and for computer storage.
ASCII Symbol
ASCII Symbol
ASCII Symbol
0-31 Control commands for printer: not recommended
32
33
34
35
36
37
38
39
40
41
42
43
44
45
46
47
48
49
50
51
52
53
54
55
56
57
58
59
60
61
62
63
Not recom!1
64
@
A
#
$
65
66
67
68
%
69
&
70
71
72
73
!
ii
1
(
)
Not recomil
*
+
f
Not recom!1
-
/
.
for 'OUT'
0
1
2
3
4
5
6
7
8
9
;
Not recom!1
<
=
>
?
Not recom!1
B
C
D
E
F
G
H
96
97
98
99
Not recomil
I
74
J
75
76
77
78
79
80
81
82
83
84
85
86
87
88
89
90
91
92
93
94
95
K
L
M
N
0
P
Q
Not recom!1
R
S
T
U
V
W
X
Y
Z
\
[
]
Not recom!
,
Not recom!-L
127 -159 Interpretation depends on printer and print setup:
not recommended
1
Dfficult to differentiate
100
101
102
103
104
105
106
107
108
109
110
111
112
113
114
115
116
117
118
119
120
121
122
123
124
125
126
a
b
c
d
Not reco
e
f
g
Not recomil
h
i
j
k
1
Not recom!
1
Not recom!
1
m
n
o
p
q
r
s
t
u
N.,
w
x
y
z
(
I
)
Not recom!1
GILES/Appendix 9:Recommended ASCII Codes
256
List of ASCII symbols which can improve the display:
168
169
170
171
172
173
174
175
176
177
178
179
180
181
182
183
184
185
186
187
188
189
190
191
192
193
194
195
196
197
198
228
229
230
231
232
233
234
235
236
237
238
239
240
241
242
243
244
245
246
247
248
249
250
251
252
253
254
255
3.99
200
201
202
203
204
205
206
207
208
209
210
211
212
213
1
214
7
215
216
217
218
219
220
221
222
223
224
225
226
227
E
a
r
(I)
e
11
(5
co
0
n
>
<
,/
ri
2
The interpretation of these symbols can depend on printer and printer setup. Therefore, they are
usually not used by GILES.
Indeed, for users familiar wkth the setup of printers, the 'World Trade characters' ('IBMcodes'):
32
58
176
177
178
219
light
(blank)
dark
(black)
can be used to present a very nice, gradual shading it they can be printed by the printer
(e.g.Epson EX series).
257
GILES/Appendix 10: Entered Maps
Appendix 11
MAPS ENTERED INTO GILES
In FAO-project 'Assistance to Land Use Planning' (ETH/82/010 and ETH/87/006) following base maps were
entered in GILES and can be retrieved, modified, overlaid or interpreted (July 1989):
Area
Ethiopia
Menagesha
Size (ha)
127,823,016
Scale of Entry
1:865,000 10 Soil
Altitude 1
Precipitation 3
Woredas (District)
Soil Management Units
LGP 4
New Administrative Regions
Awrajas
886,155
1:106,000 9
Soil 7
Altitude 2
Precipitation
Land use/land cover
Service Cooperatives
Agroecological zones
Planning zones
Linear Features
Fuelwood Project
1,177,336
1:106,000 9
Soil 7
Altitude 2
Precipitation
Land use/land cover
Service Cooperatives
Agroecological zones
Planning zones
Linear Features
(Shewa)
Haykoch &
Butaj ira
(Shewa)
Map
GILES/Appendix 10: Entered Maps
Yerer &
Kereju
258
1,182,308
1:106,000 9
Soil 7
Altitude 2
Precipitation
Land use/land cover
Service Cooperatives
Agroecological zones
Planning zones
Linear Features
305,250
1: 50,000 8
Soil 5
Altitude 2
Precipitation
Land use/land cover
Peasant Associations
Planning zones
Linear Features
365,513
1: 50,000 8
(Shewa)
Borkena
(N-Shewa/
S-Wello)
Bichena
(Gojam)
Hosaina
229,606
1: 50,000 8
(S-Shewa)
1
2
3
4
5
6
7
Soil
6
Altitude 2
Precipitation
Land use/land cover
Peasant Associations
Agroecological zones
Planning zones
Soil
Altitude 2
Precipitation
Land use/land cover
Peasant Associations
Agroecological zones
Planning zones
With contour intervals of 500 m
With contour intervals of 200 m
Only with differentiation of > 700 and < 700 mm p.a.
Length of growing period at 80 % reliability level
Soil associations of 1-3 soil types
Soil associations of 1-2 soil types
Soil associations of 1-4 soil types
.
The input raster size of 5 x 5 mm (0.25 cm2) is equal to:
Area on ground
Input scale
8
9
10
6.25 ha
250 * 250 m =
28.09 ha
530 * 530 m =
4325 * 4325 m = 1870.56 ha
at
at
at
1
:
1
:
J.
:
50,000
106,000
865,000
GILES/Apperdix 10: Entered Maps
259
Map Index:
For each entered area, the names of all sheets, their relattve location ('map index') and the
latitude/longitude coordinates of their frames are Wven. Coordinates can be converted into 1JTM
system using the formula of p.241.
ETHIOPIA
Eritrea
W-Gonder
Tana
Assab
Ilubabor
Shewa
Dire Derwa
E-Ogaden
1
2
3
4
5
6
7
8
9
Omo
Sidamo
Ogaden
SE-Ogaden
A
B
C
MENAGESHA
Muga
Inchini
Sululta
Sendafa
Belo
Akaki
Wedecha
1
2
3
4
5
6
7
HAYKOCH &
BUTAJ IRA
1
2
3
4
5
6
7
8
Chifra
Guye
Butajira
Meki
Dalocha
Ziway
Kulito
Negel
2
3
4
5
6
8
GILES/Appendix 10: Entered Maps
260
YERER &
KEREJU
Ankober
Hafele
Konisa
Kesem
Melka Werer
Debre Zeyt
Nazareth
Metehara
Awash
Ararto
1
2
3
4
5
6
7
8
9
10
11
Wonj
BORKENA
Degaga
Harbu
Rabel
Kemise
3
4
9
A
BICHENA
Gunde Weyn
Tenta
Rob Gebeya
Debu Work
Gedeb
Amber
Bichena
Borebor
Dejen
Dule
1
2
3
4
5
6
7
8
9
A
HOSAINA
1
2
3
4
5
6
7
8
9
A
B
C
Jembero
Geja
Dalocha
Tora
Hosaina
Wilbareg
Gimbicho
Angacha
Kulito
Areka
Shone
Ropi
3
4
9
A
GILES/Appendb< 10: Entered Maps
261
Recommendations for outprint of complete maps (high resolution
screen display) as text maps (not larger than DIN A 4) through
'Inset':
Distance
Extreme part of area - Frame
NSWE
Menagesha 1:1 Mio.
10
55
30
63
10
10
10
Haykoch &
Butajira 1:1 Mio.
small
Yerer &
Kereyu
1:1 Mio.
small
small
1:1 Mio.
Height
Ratio
9
10
10
10
15
10
55
10
18
5.4
6.6
3.3
3.5
110
110
115
115
10
10
10
10
10
10
110
10
7.3
3.6
110
108
10
10
10
10
7.3
110
GILES/References
262
REFERENCES
Ankum,
A.;
1988: Informatieveriles bij Gebruik Bodemkaart van Nederland in Rastervorm.
STIBOKA, Wageningen
Aronson, P. and Morehouse, S.; 1983: The ARC/INFO map library: the design for a digital data
base. Proc.of the 6th annual International Symposium on Automated Cartography 1: 327382; American Congress of Surveying and Mapping, Washington D.C.
Ashton-Tate (ed.); 1984: dBase III User Manual
Bannink,
Hendrickx, J.M. and Bles, B.J.; 1988: Quantitative Evaluation of Large Areas in
Respect of Vulnerability to Moisture Deficit. Soil Survey and Land Evaluation, 8(1): 47-63
Bellamy, J.A. (ed.); 1986: Papua New Guinea. Inventory of Natural Resources, Population Distribu-
tion and Land Use. Commonwealth Scientific and Industrial Research Organization,
Australia, Nat.Res.Series 6
Blakemore, Michael; 1984: Generalisation and Error in Spatial Data Bases. Cartographica, 21
Bridges, E.M.; 1982: Techniques of Modern Soil Survey; in: Bridges, E.M. and Davidson, D.A.(ed.):
Principles and Applications of Soil Geography. London, New York
Bronsveld, M.C.; 1986: Evaluation of the CRIES Geographic Information System for the AgroEcological Zone Study and the Population Supporting Capacity Assessment. FAO, Consultant paper. Rome
Burrough, P.A.; 1980: The Development of a Landscape Information System in The Netherlands,
Based on a Turn-Key Graphics System. Geo-Processing, 1: 257-274
Burrough, P.A. and Bie, S.W. (ed.); 1984: Soil Information Systems Technology. Proceedings of the
Sixth Meeting of the ISSS Working Groupon Soil Information Systems, Bolkesjo, Norway,
28/2-4/3/1983. Wageningen
Burrough, P.A.; 1986: Principles of Geographical Information Systems for Land Resources Assessment. Monographs on Soil and Resources Survey, 11. Oxford
CDC (Conservation for Development Centre; ed.); 1986: Sahelnet. A Proposal for the Development
of a Network of Natural Resources Databases in Sahelian Countries; Gland, Switzerland
Clark, K.C.; 1986: Recent Trends in Geographic Information System Research; Geo-Processing
3:1-15
GILES/References
263
Clerici, A.; 1980: A Method for Drawing Slope Maps from Contour Maps by Automatic Data Acquisition and Processing. Computer and Geosciences, 6: 289-297
Conservation for Development Centre/International Union for Conservation of Nature; 1986: Sahel-
net. A Proposal for the Development of a Network of Natural Resources Databases in
Sahelian Countries. Gland, Switzerland
Consoletti, William; 1988: GIS in Industrial Forest Management. Journal of Forestry, September
1988: 37-38
Coppock, Terry and Anderson, Eric; 1987: Editorial Review. Geographical Information Systems,
1(1): 3-11
Cunningham, R.L, Petersen, G.W., Sacksteder, C.J.; 1984: Microcomputer delivery of soil survey
information. Joumal of Soil and Water Conservation 1984(3): 241-243
de Meijere, Johan C. and van de Pate, Robert A.; 1987: The Role of Information Systems in
Natural Resource Management. ITC Journa1,2,1987: 129-133
Devine, Hugh A. and Field, Richard, C.; 1986: The Gist of GIS. Journal 1986 of Forestry, August
1986: 17-22
Drummond, Jane; 1987: A Framework for Handling Error in Geographic Data Manipulation. ITCJournal, 1987,1: 73-82
Dueker, Kenneth J.; 1979: Land Resource Information Systems: A Review of Fifteen Years Experience. Geo-Processing, 1: 105-128
Ellis, Martin C. and Galeano, Raphael; 1987: SISTERRA: The Spatial Information System for Terrain
Evaluation. Microcomputer Software for Geo Information Systems and Digital Image
Processing. ITC-Journal, 1987,2: 165-168
FAO; 1976: A Framework for Land Evaluation. FAO Soils Bulletin; no.32. Rome
FAO; 1979: A Provisional Methodology for Soil Degradation Assessment. FAO. Rome
FAO; 1983: Guidelines: Land Evaluation for Rainfed Agriculture. FAO Soils Bulletin no. 52. Rome
FAO; 1985 a: Soil Survey of the Borkena Area (Welo), by S. Paris; FAO-Project ETH/82/010, Field
Document 7. Addis Ababa
FAO; 1985 b: Vegetation and Land Use Survey of the Borkena Area (Welo), by E. Boerwinkel; FAOProject ETH/82/010, Field Document 8. Addis Ababa
FAO; 1986 a: Soils of Bichena Study Area (Gojam), by J.H.Venema and S.Paris; FAO-Project ETH/
82/010, Field Document 10. Addis Ababa
FAO; 1986 b: Users Guide and Installation Guide to the Agricultural Planning Toolkit, APT vers.1.0.
FAO, Land and Water Development Division. Rome
GILES/References
264
FAO; 1987 a: Soils of Hosaina Study Area (Shewa), by J.H.Venema and S.Paris; FAO-Project ETH/
82/010, Field Document 13. Addis Ababa
FAO; 1987 b: Manual on a Computerized Land Evaluation System, wtth Special Reference to the
Highlands of Ethiopia, vol.!: Land Evaluation Methodology, by C.Konstapel and G. Bechtold; FAO-Project ETH/82/010, Field Document 16. Addis Ababa
FAO; 1987 c: Manual on a Computerized Land Evaluation System, with Special Reference to the
Highlands of Ethiopia, vat!: The Influence of Environmental Conditions on Plant Growth
and Development, by D. Adjei-Tuum; FAO-Project ETH/82/010, Field Document 17. Addis
Ababa
FAO; 1987 d: Land Evaluation and Recommendations for Land Use Planning in the Borkena Study
Area (Welo/Shewa), by G.Bechtold, D.Radcilffe and Teshome Estlfanos; FAO-Project
ETH/ 82/010, Field Document 18. Addis Ababa
FAO; 198.8 a: Land Evaluation in Bichena Study Area (Gojam), by D.Radcliffe, G.Bechtold and
Teshome Estifanos; FAO-Project ETH/82/010, Field Document 19. Addis Ababa
FAO; 1988 b: Land Evaluation in Hosaina Study Area (Shewa), by D.Radcliffe, G.Bechtold and
Teshome Estifanos; FAO-Project ETH/82/010, Field Document 22. Addis Ababa
FAO; 1988 c: Land Evaluation of Menagesha Awraju (Shewa), by D.Radcliffe, G.Bechtold and
Teshome Estrfanos; FAO-Project ETH/87/006, Field Document 32. Addis Ababa
FAO; 1988 d: Land Evaluation of Haykoch & Butajira Awraja (Shewa), by D.Radcliffe, G.Bechtold
and Teshome Estifanos; FAO-Project ETH/87/006, Field Document 40. Addis Ababa
FAO; 1989 a: Land Evaluation of Yerer & Kereyu Awraja (Shewa), by D.Radcllffe and G.Bechtold;
FAO-Project ETH/87/006, Field Document 46. Addis Ababa
Fisher, P.F.,Wilkinson, G.G.and Robertson,L; 1988: The Use of Microcomputer in Soil Survey. Soil
Survey and Land Evaluation, 8(1): 31-45
Fleet, Harvey; 1988: Scanning to Digitize Mapped Data. Joumal of Forestry, September, 1986: 3839
Freeland, Nicholas; 1986: A Micro-Computer Geographic Information System. National Resources
Survey and Land Evaluation Project, Mozambique, FAO project MOZ/81/005
Giltrap, D.J.; 1983: Computer Production of Soil Maps, I: Production of Grid Maps by Interpretation; Geoderma 29(4):295-311
Hellden, Ulf; 1987: An Assessment of Woody Biomass, Communfty Forests, Land Use and Soil
Erosion in Ethiopia. Lund, Sweden
Henricksen, Barry J.; 1986: Determination of Agro-Ecological Zones in Africa: ILCA Activities and
Expectations. 'LOA Bulletin: 23. Addis Ababa
GILES/References
265
Hogg, James and Stuart, Neil; 1987: Resource Analysis using Remote Sensing and an ObjectOriented Geographical Information System. Proc.of 13th Annual Conf.of the Remote Sensing Soc.UK, Nottingham
Hopkins, Lewis; 1977: Methods for Generating Land Suitability Maps: A Comparative Evaluation.
J.of American Inst. of Planners: 386-400
Hurni, Hans; 1985: Erosion - Productivity - Conservation Systems in Ethiopia. Soil Conservation
Project/University of Beme, Switzerland
IBM; 1983: DOS 3.10. Reference
Jones, R.J.A. and Thomasson, A.J.;1988: Land Suitability Classification for Temperate Arable
Crops. Proc.of the intern, workshop on quantified land evaluation procedures, in
Washington, 1987; Wageningen
Kubo, Sachio;1987: The Development of Geographical Information Systems in Japan; Int.
J.
Geogr. Inf.Systems 1(3):243-252
Man, W.H. de (ed.); 1984: Conceptual Framework and Guidelines for Establishing Geographic Information Systems. General Information Programme and UNISIST, UNESCO, Paris
Nag.
Prithuigh; 1987: A Proposed Base for a Geographical Information System for India;
Int.J.Geogrinf.Systems 1 (2):181-187
Nystrom, DA.; 1986: Geopgraphic Information System Developments Within U.S.Geological Survey. Proc.AMeric.Cartog. 1986 (1)
Newcomer, Jeffrey A. and Szajgin, John; 1984: Accumulation of Thematic Map Errors in Digital
Overlay Analysis. The American Cartographer, 11(1): 58-62
PC World (J); 1984: Newcomers Start Here. PCW, 1984(4): 56-58
Purnell, M.F.; 1988: Methodology and Techniques for Land Use Planning in the Tropics. Soil Survey and Land Evaluation, 8 (1): 9-22
Sanchez, Pedro A., Couto, Walter and Buol, Stanley W.; 1982: The Fertility Capability Soil Classificiation System: Interpretation, Applicability and Modification. Geoderma, 27: 2E13-309
Schaller, J.; 1987: Anwendung flaechenbezogener Informationssysteme fuer aktuelle Fragen des
Bodenschutzes. Mitteilungen der Deutschen Bodenkundlichen Gesellschaft, 53: 61-67
Shupeng, Chen; 1987: Geographical Data Handling and GIS in China; Int.J.Geogrinf,Systems 1(3):
219-228
Snyder, P.; 1984: Map-Projection Graphics from a Personal Computer. The American Geographer,
11 (2):132-138
GILES/References
266
Stefanovic, Pavao; 1987: The Many Facets of Cartography. ITC Joumal, 1987(1): 93-97
Tomlinson, R.F., Calkins, H.W. and Marble, D.F.; 1976: Computer Handling of Geographical Data.
Natural Resources Research, XIII. Unesco. Paris
Tomlinson, R.F.; 1978: Difficulties Inherent in Organizing Earth Data in a Storage Form Suitable for
Query; Proc. AUTOCARTO, 3:181-201
Tomlinson, Roger F. and Boyle, A.Raymond; 1981: The State of Development of Systems for Handling Natural Resources Inventory Data. Cartographica, 18 (4): 65-95
Vink, P.A.; 1963: Planning of Soil Surveys in Land Development. Pub1.10, Interninstior Land
Reclamation and Improvement, Wageningen
Weber, Wigand; 1979: Computer Mapping and Geographic Information Systems in Germany. GeoProcessing, 1979 (1):85-99
Williams, G.D.V., McKenzie, J.S., Sheppard, MI; 1980: Mesoscale Agroclimatic Resource Mapping
by Computer, an Example for the Peace River Region of Canada. Agricultural Meteorology, 21: 93-109
Wischmeier, S.R. and Smith, D.D.; 1978: Predicting Rainfall Erosion Losses. A Guide to Conservation Planning; Agric. Handbook 537, U.S. Dept. Agric.. Washington
WMO; 1985: Guidelines for Computerized Data Processing in Operational Hydrology and Land and
Water Management; Joint FAO/WMO publication, 634. Geneva
Yoeli, Pinhas: 1984: Cartographc Contouring with Computer and Plotter. The American Cartographer, 11(2): 100 ff