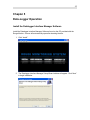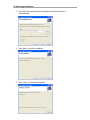
1
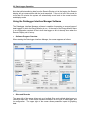
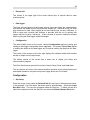
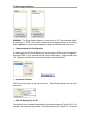
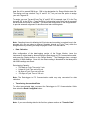
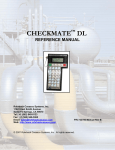
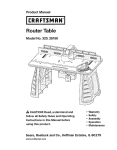
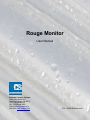
Rouge Monitor User Manual Rohback Cosasco Systems 11841 East Smith Ave. Santa Fe Springs, CA 90670 Tel: (1) 562-949-0123 Fax: (1) 562-949-3065 Email: [email protected] Web Site: www.cosasco.com P/N: 710690-MANUALrev-D Table of Contents Chapter 1 Introduction ....................................................................................... 1 General ............................................................................................................. 1 Equipment Configuration ................................................................................... 1 Operating Range ............................................................................................... 2 Chapter 2 Specification ...................................................................................... 5 Chapter 3 Installation ....................................................................................... 11 Mounting Cable and Probe to Transmitter ....................................................... 11 Transmitter to Display Unit Connection ........................................................... 11 Display Unit Analog Output Connections ........................................................ 12 Chapter 4 Operation ......................................................................................... 13 Checking Normal User Option Settings ........................................................... 14 Using Security Mode Selection Settings .......................................................... 15 Chapter 5 Data-Logger Operation ................................................................... 17 Install the Datalogger Interface Manager Software ......................................... 17 Connecting a Laptop ....................................................................................... 19 Using the Datalogger Interface Manager Software.......................................... 20 Configuration ................................................................................................... 21 Troubleshooting............................................................................................... 30 1 Chapter 1 Introduction General The Rouge Monitor is designed to improve facility operations in ultra-pure water systems, by enabling the user to directly monitor the rouging rate (or corrosion rate) and assist in determining when re-passivation is required to prevent unacceptable levels of contaminants in the water. These contaminants are mostly iron, chrome, and nickel compounds resulting from a small amount of corrosion of the stainless steel pipework and vessels. Corrosion of the stainless steel in these ultra-pure water systems is kept very low through a passivation process, which may need to be re-done at intervals to maintain the passivation. Once the passivation layer becomes depleted through continued operation of the system the corrosion rate will begin to increase as will the rate of contamination of the system by the corrosion products , producing “rouge” in the ultrapure water. The Rouge Monitor provides a low cost method of measuring the rouging rate through a very sensitive electrochemical measurement method based on a special version of the RCS Corrater range of instruments specifically designed for these very low conductivity waters. Equipment Configuration The Rouge Monitor comprises of three pieces; a probe that is inserted into the ultra-pure process stream, a local electrochemical transmitter, and a remote display, control and data-logging unit. The probe has two stainless steel electrodes glass sealed into a stainless steel probe body and welded to a sanitary flange to allow mounting into the ultra-pure water system. The local transmitter is either mounted directly to the probe with a connecting adapter or connected with a short cable to the probe and mounted separately from the probe. The remote display control and data-logging unit can be mounted up to 4000 feet from the local transmitter. The transmitter computes rouging rate over a 60 minute measurement cycle and updates the remote rouging rate display and output. The display control and data-logging module provides the following displays: 1. 2. An indication of rouging or corrosion rate in units of microns/month A cumulative rouge thickness in microns 2 Introduction 3. 4. A percentage of a settable rouge thickness. The time in months and tenths of months since the start of the current rouge accumulation measurement cycle. The unit also provides for set up and configuration of the unit as described later. Two 420 mA output signals are provided representing rouging rate and rouge thickness.. These outputs are typically connected to the plant process control system. A separate alarm changeover relay contact (Form C) may be set to provide a rouging rate alarm. The display and control module may also be set up separately to log the recorded data for later download to a laptop computer. This provides easy transfer of data for the use of the ultra-pure water service and maintenance provider. The local transmitter is housed in an explosion-proof housing (NEMA 7) and the remote display unit is in a NEMA 4X enclosure. Operating Range The Rouge Monitor is specifically designed for operation in high resistivity ultra-pure waters, where its patented Solution Resistance Compensation (SRC) is vital to the ability to measure rouging rates (or corrosion rates) in the high resistivity of ultra-pure water. Theoretically pure water has only two ionic species coming from the dissociation of water with H+ and OH- .These ions result in a conductivity at 25C of 0.055 μS/cm. Converted to a resistivity this is 18.2 megohm-cm at 25C. The resistivity is also a function of temperature, increasing as the temperature decreases. At 10 C the resistivity of pure water has increased to 40 megohm-cm. The typical range of resistivities in ultrapure water applications is 2 to 10 megohm-cm, or conductivities of 0.1 to 0.5 μS/cm. As other ionic species are added to pure water, the conductivity increases and the resistivity decreases. The following graph shows the range of operation of the rouge monitor. The lower left side of the graph is the recommended operating range. The upper right of the graph is the non-operating region. The operating limit shown on the graph is based on a nominal maximum error of 20% in the rouging rate or corrosion rate. The error reduced rapidly further to the lower left of the line, and increases rapidly above and to the right of the line. For example at 5 megohms and 0.05 microns/month, the typical measurement error is around 2%. 3 1000 Non-Operating Region Good Quality Distilled Water Rouging Rate of Stainless Steel (microns/month) 100 Typical Ultra-pure Water range 10 Theoretical Pure Water 25C 1 10C 0.1 0.01 0.001 0.001 Operating Range 0.01 0.1 1 10 100 Water Resitivity Megohm-cm The local transmitter is capable of measuring up to 330 microns/month for stainless steel, but the display on the local display is limited to 9.999 microns/month, and the output on the 4-20 mA signal is 0 to 2 microns/month. 4 Introduction 5 Chapter 2 Specification Operation Range: 1000 Non-Operating Region Good Quality Distilled Water Rouging Rate of Stainless Steel (microns/month) 100 Typical Ultra-pure Water range 10 Theoretical Pure Water 25C 1 10C 0.1 0.01 Operating Range 0.001 0.001 0.01 0.1 1 10 100 Water Resitivity Megohm-cm The limit of operation is based on a maximum of 20% error in the rouging rate Displays: Rouge Rate: Rouge Thickness: Alarm Set Point: % Thickness Limit: Run Time: 0 to 9.999 microns/month 0 to 9.9999 microns OFF, 0.02 to 2.0 microns/month 0 to 200% 0 to 50.0 months Transmitter Measurement Time: 20 Minutes, fixed. Data-Logging Interval: Default is 60 minutes, but can be adjusted from 3 to 120 minutes (logging less than 20 minutes is not necessary since the transmitter does not update any quicker). – Sets Rouge Thickness update and data-logging interval. 6 Specification Alloy Multiplier: Adjustable 0.20 to 3.00 – Default 0.9 for Stainless Steel. Accommodates monitoring of different alloys if required Analog Outputs: Loop 1 Loop 2 Rouging Rate Rouge Thickness 4 to 20 mA 4 to 20 mA The loops are self-powered with 24 VDC. External 24VDC supply must not be used. Analog outputs are isolated from the process, the probe and the transmitter. 4 to 20 mA loops are not isolated from each other. Analog Output Ranges: Rouge Rate Current loop ranges [nm/month]: 10, 20, 50, 100, 200, 500, 1000, and 2000 Rouge Thickness Current loop ranges [nm]: 100, 200, 500, 1000, 2000, and 5000 Data-Logging Capacity: Latest 2048 readings – non-volatile memory 4.25 days at Cycle Time set to 3 min 28 days at Cycle Time set to 20 min 84 days at Cycle Time set to 60 min 170 days at Cycle Time of 120 min Alarm Relay Output: Form C SPDT changeover contact 1Amp at 230 VAC resistive load. Alarm Set Point Range 0.02 to 2.00 microns/month. Power Supply: 115/230 VAC 50/60 Hz, 15 Watts Instrument Operating Temperature: 32F to 122F (0C to 50C) 7 Normal User Selection Options: Alloy Multiplier Cycle Time Rouging Rate Range Rouge Thickness Range Alarm Setting and Value Data-logger to PC Communication Security Mode Selection Options: Reset Rouge Thickness to Zero Reset Run Time to Zero Set Rouge Thickness Limit 8 Specification Dimensions: Display Unit. Standard Mounting with Probe to Transmitter Adapter. 4.50" 13.60" 7.20" Tri-Clover Flange 2.90" 1.38" 3.0" Typical Ultrapure Water 9 Remote Alternate Mounting for Transmitter. Mounting Clamp P/N 748213 (Customer supplied pipe) 1 ½" Pipe Vertical Pipe Tri-Clover Flange 2.90" 1.38" 3.0" Typical 1.25" Ultrapure Water Probe To Transmitter Cable: P/N 748224-LL (ATEX); PN 748223-LL (UL/CSA) (Maximum cable length is 36 feet (12 meters)). 10 Specification 11 Chapter 3 Installation Mounting Cable and Probe to Transmitter Mount the rouge monitor probe at the fitting flange. Note the probe length should be such that the probe electrodes are just into the flow in the pipe. Install connecting adapter to probe and tighten the nuts. Install Transmitter on top of probe adapter. Tighten the top nut of the adapter. Attach transmitter to display unit cable onto transmitter. If there is insufficient room for the transmitter, an alternate cable and transmitter mounting device in available. Transmitter to Display Unit Connection Attach the Transmitter to Display unit cable to the Converter Module located inside the base of the display module as shown below. Black wire --- 24VDC (--) Red wire --- 24VDC (+) Green wire --- Signal White wire --- Signal black red green white NOTE: For Explosion Proof cable (PN 748201), wiring color is black (thick), red, green, black (thin) 12 Installation Display Unit Analog Output Connections There are two analog 4-20 mA loop output signals from the Rouge Monitor as follows: Loop L1 = Rouge Rate Loop L2 = Rouge Thickness Connect the 4-20 mA loop cable for Rouging Rate to terminal L1+, and L1- located on the top right of the circuit board with the display unit module open door. Similarly connect the L2+ and L2- for the Rouge thickness Scaling of the 4-20 mA output The available ranges for the 4-20 mA outputs are as follows. Rouge Rate Current loop ranges [nm / month]: 10, 20, 50, 100, 200, 500, 1000, and 2000 Rouge Thickness Current loop ranges [nm]: 100, 200, 500, 1000, 2000, and 5000 The desired ranges may be set in the Normal User Option Settings described in Section 4.1. Warning: The output current loops are self-powered. Do not apply an external 24 VDC power supply as this will cause damage to the unit. 13 Chapter 4 Operation The probe, transmitter, and remote display unit are supplied already configured with settings that should suit monitoring of most stainless steel applications. It is advisable to check the configuration and make changes to suit your application if required. Having installed the system as described in the previous chapter, check for the correct voltage setting at the 115/230 VAC selector switch located inside the Rouge Display unit, on the main PCB, next to the transformer as shown. Then turn AC power with the AC power switch located next to the fuse. 115/230 VAC Selector AC PWR Switch 14 Operation Checking Normal User Option Settings The diagram below shows the front panel of the remote display unit. After power up, the initial display will show the name of the instrument and the revision level of its firmware, before changing into its normal display mode. To check the normal user settings, press the Configure button, successive use of the arrow keys will take you through the list of settable options as follows: Alloy Multiplier Data-Logging Interval Rouging Rate Alarm Loop 1 R.R 4-20 mA Range Loop 2 R.T. 4-20 mA Range The top line will show the option, and the second line will show the value, for example Alloy Multiplier > 0.9 < To change a selection press the Configure key and the value will flash. Use the up and down arrows to change as required, and press the Configure key again to set and store the value. Proceed down the list of settings and change as required. Alloy Multiplier 0.9 is the default value for 316 and 316L stainless steel. The value is different for different alloys. 1.0 is the value for carbon steel. This factor takes account of the corrosion chemistry, the valency of the reactions involved, and empirically determined constants. For more information refer to RCS Corrater Theory 15 Cycle Time (Sampling Interval) This sets the reading frequency for data-logging, and the frequency of reading the rouging rate which is integrated to provide the Rouge Thickness. The Rouging transmitter takes 60 minutes to compute a rouge rate reading, after which it will update the display. Cycle time is adjustable from 3 to 120 minutes. The default setting is 60 minutes. Alarm Setting & Value This allows an alarm to be set OFF on ON for the rouging rate, and also to set the value to be used for this alarm. When an alarm is initiated, the alarm setting on the display will flash and the internal alarm relay will operate. This relay is a changeover contact. Loop 1 R.R. 4-20 mA Range This sets the range of the 4-20 mA output for the Rouge Rate on loop 1. The 4 mA corresponds to zero on each range and the 20 mA maximum can be set to one of the following values. 10, 20, 50, 100, 200, 500, 1000, and 2000 nm/month Loop 2 R.T. 4-20 mA Range This sets the range of the 4-20 mA output for the accumulated Rouge Thickness on loop 2. The 4 mA corresponds to zero on each range and the 20 mA maximum can be set to one of the following values. 100, 200, 500, 1000, 2000, and 5000 nm Data-Logger to PC Communication This changes the serial port normally used to connect the remote display to the local transmitter over to the laptop connection for transfer of data logged information. This function is accessible with the Datalog button on the front panel under normal operation. When all of the selections have been made press the Display button to return to normal operation and display Using Security Mode Selection Settings These settings are not required for normal operator use. They are required to reset the Rouge Thickness measurement back to zero, and the Run Time back to zero. This would normally be done after cleaning and re-passivation of the system. To get into this security mode, cycle the power to the display unit with the internal switch, while at the same time holding down BOTH of the arrow keys on the front panel. This will bring up the following display. RESET ROUGE THICKNESS YES = UP NO = DOWN 16 Operation To reset the Rouge Thickness Accumulation back to zero use the UP arrow (▲) button. To leave the Rouge Thickness unchanged use the DOWN arrow (▼) button. Proceed in the same way through the other two selections. Reset Rouge Thickness This resets the computed Rouge Thickness back to zero. Rouge Thickness is the integration of the Rouge Rate, and will continue to increase from zero at the start of the period. After cleaning and passivation it will be required to reset the starting point for this value Reset Run Time At the same time that the Rouge Thickness is reset it will be required to reset the indicated time period since re-passivation. This control permits the run time to be set back to zero Set Rouge Thickness Limit This is a set point of the maximum rouge thickness limit that is to be allowed, from which the % of thickness limit is computed for the front panel display 17 Chapter 5 Data-Logger Operation Install the Datalogger Interface Manager Software Install the Datalogger Interface Manager Software found on the CD provided with the Rouge Monitor. A menu will automatically open after inserting the disc. 1. Click “Install”. 2. The Datalogger Interface Manager Setup Wizard window will appear. Click “Next” to begin installation. 18 Data-Logger Operation 3. Click “Next” after selecting the Install directory (Default directory is recommended). 4. Click “Next” to Confirm Installation. 5. Click “Close” to Complete Installation. 19 Connecting a Laptop Attach the DB9-Serial PC Communication cable to the Laptop. If the laptop does not have a DB9-Serial port, use the included USB to Serial adapter as shown below. A laptop with an included serial port normally uses COM 1. If the USB to Serial adapter is used, the COM port number allocated will need to be checked in Windows Device Manager. To access Windows Device Manager, right-click My Computer, select the Hardware tab and the Device Manager button. Go to Ports to view the COM port number. This COM Port # needs to match with the COM port # you select when using the Data-Logger Interface Manager software. Serial to USB Adapter PC Communication Cable The communication between the Data Display Unit and the Data-logger software now installed on the computer is initiated by depressing the “data log” button on the front of the Data Display Unit. Failure to depress the “data log” button on the front of the Data Display Unit will prevent communication with the computer and “Data-logger” software.” 20 Data-Logger Operation Note that while transferring data from the Remote Display unit to the Laptop, the Remote display will not communicate with the local transmitter. If the unit is left in this mode for more than 30 minutes the system will automatically revert back to the normal monitor and display mode. Using the Datalogger Interface Manager Software The Datalogger Interface Manager software is capable of operating on several types of data-loggers of which the Rouge Monitor is one. In the case of the Rouge Monitor there is no configuration required of the in-built data-logger as this is already done when the Remote Display unit is set up. Software Program Overview When starting the Data-logger Interface Manager, the screen appears as follows: Sites and Records The upper left of the screen allows set up of multiple Sites, and multiple data-loggers or records at each site. Each record includes information on the type of data-logger, and its configuration. The upper right of the screen allows parameter inputs for graphing data. 21 Record Info This section in the upper right of the screen allows input of specific data for each monitored point. Data-logger The lower left hand portion of the screen sets up, open and closes the communication port between the laptop and the Rouge Monitor Display unit. Note that an RS 232 serial port connection is used. Many laptops do not have serial ports, but only USB ports. A USB to serial port converter and software is provided with the unit to operate with laptops that do not have a serial port. If this converter is required, install this software before running the Data-logger Interface Manager. Configuration The lower middle portion of the screen, labeled Configuration applies to setting and reading a data-logger configuration where applicable. The portion labeled Data applies to reading the data from the data-logger and if required clearing the data from the datalogger. The portion of the screen to the lower right displays the software details and provides access to simple on-line help screens. The bottom section of the screen has a status bar to display port status and communication progress. The Quick Start buttons gives brief overview of how to Setup, Read, and Graph data. The very bottom left corner of the screen identifies operation of the communication port and related operations; the picture on previous page shows as “Port Closed”. Configuration Site Setup Place the mouse cursor inside the Selected Site box and type in the desired site name. In this example “Your Site Name” has been used for demonstration. Select the Create New Site button. The new site will appear inside the Sites box. To delete this site first select the created site inside the Sites box and select the Delete Selected Site button. 22 Data-Logger Operation WARNING: The Rouge Monitor display unit must be set to “PC Communication Mode” by pressing the “DATA LOG” button located below the display window on the Rouge Monitor before any communication between the laptop and Rouge Monitor can occur. Communication Port Configuration To collect data from the Rouge Monitor, connect the serial or USB port from the laptop to the data-logger port on the Rouge Monitor remote display unit as shown in Chapter 3. Assuming COM1 is your selected comport, select the On button. Status should show “On”. Status bar at bottom left of screen should show “Port Initialized OK”. Instrument Selection Click on the down-arrow in the Instrument box. Select Rouge Monitor from the drop down menu. Data File Naming Tag and ID The data file name is created automatically from allocated instrument Tag and ID #. For example if the instrument tag is called “A” and the instrument ID is called “01”, the stored 23 data file will be named RM1A.csv. RM is the designation for Rouge Monitor data file. The display unit has a default Tag “A” and ID “01”, but you have the option to assign your own Tag and ID. To assign your own Tag and ID say Tag “A” and ID “09” for example; type “A” in the Tag box and “09” in the ID box. Press the Write Configuration button then wait for progress bar at bottom-left corner to complete. This writes the configuration to the Rouge Monitor to provide automatic alignment of data files when later retrieving data. Note: Sampling Interval is defaulted at 60 minutes and no setting is required here in the program, but you can select a different Sampling Interval or (Cycle Time) within the Rouge Monitor by following the steps on pages 13 and 14 of this manual. Data Collection After configuration of the data-logging section of the Rouge Monitor, leave the instrument to collect data by disconnecting the Data-logger to PC Communication cable, and press the Display button on the Rouge Monitor. The Datalogger has a storage capacity of 2048 readings. Once full, the oldest reading is discarded so that always the last 2048 readings are stored. Data-logging Capacity: 4.25 days at Cycle Time set to 3 min 8 days at Cycle Time set to 20 min 84 days at Cycle Time set to 60 min 170 days at Cycle Time of 120 min Note: The Data-logger to PC Communication cable may stay connected for data collection. Transferring Accumulated Data To collect accumulated data, reconnect the Data-logger to PC Communication Cable then select the Read Config/Stat button. Note: If you are collecting data for the first time, please continue at “Transfer Data”. 24 Data-Logger Operation Collecting Accumulated Data When returning to collect accumulated data, plug in the laptop to the Com Port, Start the Datalogger Interface Manager, select Site from which date is to be collected. The data from the Rouge Monitor will automatically align with the data file name on the laptop. Select the Read/Config Stat button. The lower-right section of the display screen will show a STATUS summary with a Number of Samples; for example “24”. The Date and Time box displays current time inside the Data-Logger unit as shown on the next page. To read the data, press the Read Data button. A message prompts you to either Append the New Data or Delete the existing data. Select Yes for normal data accumulation or No to delete and overwrite existing data. Transfer Data To transfer the data across from the Rouge Monitor to the laptop, press the Read Data button shown below. 25 The communication status bar should show this brief progress. This data file gets automatically saved. This is not normally required as old data is automatically overwritten, so that up to 2048 most recent readings are stored. The Clear Data button is to erase data logged on the data-logger unit. Renaming Records As mentioned earlier, the data name inside the records box as “RM9A.csv” is created automatically. To rename, first select the site name inside the Sites box, and the Data file inside the Records box, then move the cursor inside the Selected Record box and type the new file name; for example “New Name”. Select the Rename button. 26 Data-Logger Operation To save the configuration, select the new file name inside the Record box and click Save button. To update the new file name into the Data-logger unit, select Write Configuration Note: After renaming the file, old file should be deleted from Records to prevent confusion. Archiving Data and Importing Data Your data file can be archived into a default folder by selecting the Archive button. To recall your archived file from “Your Site Name” folder or other location such as an external USB drive, simply select the Import button and navigate to C:\Program Files\RCS\Datalogger Interface Manager\data\Your Site Name\archives, or to the external USB drive to open your file. Displaying Collected Data To display graphs of the transferred data, select your data file inside the Records box. Param1 displays Rouge Thickness and Param2 displays Rouge Rate. Check the Graph box under either or both Param1 and Param2. Select from the drop-down menu inside the Format box then select a numbering scale, say “0000.000” then select the Show Graphs button to see graphed data as shown below. 27 The names for Param1 and Param2 are by default Rouge and Rouge Rate. These can be changed if required and saved using the Save button. Data is saved at “C:\Program Files\RCS\Datalogger Interface Manager\data\Your Site Name” in CSV format which may be viewed in MS Excel. The default unit of measurement for Rouging (Param1) is Microns. The default unit for Rouging Rate (Param2) is Microns per month (or um per month, 1 micron = 1 um). Different units may be used, but the scale factor in the Gain box will need to be changed accordingly. For example if Rouging is to be displayed in nanometers, the gain would need to be 1000 to convert microns (um) to nanometers (nm). Param1: Three main types of units readily available from the drop-down menu with corresponding Gains are Microns, Millimeters, and Nanometers. 28 Data-Logger Operation Param2: Four main types of units readily available from the drop-down menu with corresponding Gains are Micrometers/month, Millimeters/month, Nanometers/month, and Micrometers/day. Click on Apply and Save button to save all graph settings. Print Graph Place mouse over graph, right-click then select print. You may also copy, save image, page setup, zoom/un-zoom or set scale back to default as shown. You may also save/copy this graph to the clipboard to put in say a word document by simultaneously pressing the ALT and Print Screen keys on your laptop. 29 Zoom-in On Graph Section(s) of the graph may be zoomed in/out by dragging the mouse cursor across an area to be selected for zooming while holding down the left mouse button as shown. Selected Area to be Zoomed-in. Note: Zooming in the Rouge graph as shown above will automatically zoom in on the Rouge Rate graph as shown below. Zoomed-in Graph Section. 30 Data-Logger Operation Troubleshooting 1. Power applied but no display on Rouge Monitor. Possible cause: *Ac voltage 115/230 selector incorrect, loose/bad ac cord, bad ac fuse. (contact RCS repair department for parts and services at (562) 949-0123, ext. 257 or email at [email protected]). 2. Data Log button pressed but no PC to Data-logger communications. Possible cause: * Wrong COM Port selected. *PC to Data-logger serial cable disconnected. *Cable damaged. *Drivers for USB to DB9 adapter not installed correctly. 3. Set to log data but no data collected when select “Read Data” in Datalogger Interface Manager program. Possible cause: *COM Port setting in Windows Device Manager not matching with COM Port selected in Datalogger Interface Manager program (see page 17 for instruction). *Display unit to Transmitter cable disconnected. *Black and white wires disconnected at 24 VDC output terminals located at bottom of wiring diagram label, inside display unit. 4. Display unit shows “Comm Error” at display window. Possible cause: *Probe not installed/loose on transmitter. *Display unit to transmitter cable disconnected.