1
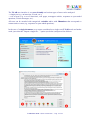
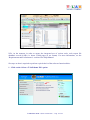
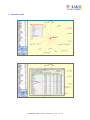
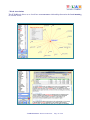
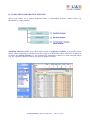
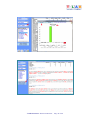
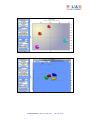
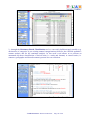
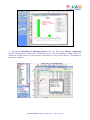
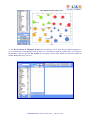
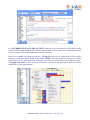
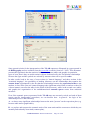
6 - Use the contextual help function to interpret the various graphs and tables
Let's consider how a typical work project which uses T-LAB can be managed.
Hypothetically, each project consists of a set of analytical activities (operations) which have the
same corpus as their subject and are organized according to the user's strategy and plan. It then
begins gathering the texts to be analysed, and concludes with a report.
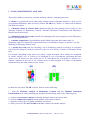
The succession of the various phases is illustrated in the following diagram:
T-LAB Plus 2019 - Quick Introduction - Pag. 8 of 29