1
Operating Manual and
Programming Reference
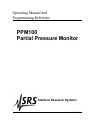
PPM100
Partial Pressure Monitor
Stanford Research Systems
Revision 2.2 (Nov 2003)
Certification
Stanford Research Systems certifies that this product met its published specifications at the time
of shipment. Stanford Research Systems further certifies that its calibration measurements are
traceable to the United States National Institute of Standards and Technology (NIST).
Warranty
This Stanford Research Systems product is warranted against defects in materials and
workmanship for a period of one (1) year from the date of shipment.
Service
For warranty service or repair, this product must be returned to a Stanford Research Systems
authorized service facility. Contact Stanford Research Systems or an authorized representative
before returning this product for repair.
Information in this document is subject to change without notice.
Copyright © Stanford Research Systems, Inc., 2003. All rights reserved.
Stanford Research Systems, Inc.
1290-C Reamwood Avenue
Sunnyvale, California 94089
www.thinksrs.com
Printed in U.S.A.
PPM100 Partial Pressure Monitor
Safety and Preparation For Use
i
Safety and Preparation For Use
CAREFULLY READ THE IMPORTANT SAFETY INSTRUCTIONS AND NOTES
INCLUDED IN THIS SECTION BEFORE USING THE PPM100 PARTIAL
PRESSURE MONITOR AND ITS ACCESSORIES. SAFETY PAYS!
Within this section, the word 'product' specifically refers to the PPM100 PARTIAL
PRESSURE MONITOR and any of its accessories.
Safety risks are associated with all research and production activities. Though long
experience has proven high vacuum instrumentation to be remarkably safe, hazards are
always associated with vacuum system operation. The most effective way to minimize
risk to yourself and others is to read, and strictly follow, all safety instructions and
warnings during the installation, operation and maintenance of the equipment connected
to your vacuum system.
The intent of this section is to collect, in a single place, the most common risks associated
to the installation, operation and maintenance of this product. The instructions are also
repeated, with additional information, at the appropriate points throughout this manual.
This product has been designed with user-safety as a priority and has been proven to
show reasonably safe operation provided it is installed, operated and serviced in strict
accordance with all the safety instructions included in its manual
Safety Instructions and Warnings
•
SAFETY PAYS! Safety instructions must be strictly followed during all stages of
installation, operation and service of this product. Failure to comply with these
precautions and warnings violates the safety standards expected of users of this
product.
•
Safety Instructions and Warnings, specific to the installation and operation of the
Residual Gas Analyzer (RGA) Head, are included in the RGA100/200/300 Operating
Manual and Programming Reference. Please read and strictly follow those detailed
instructions during installation and operation of the RGA Head.
•
If you have any doubts about how to use this product safely, contact Stanford
Research Systems at the address listed in this manual.
•
Retain these safety and operating instructions for future reference.
•
Identify and adhere to all warnings posted on the product.
•
Failure to comply with these instructions may result in serious personal injury,
including death, as well as significant property damage.
•
Due to the variety of vacuum system configurations and applications, it is impossible
to account for all safety concerns that may arise during the installation, operation and
maintenance of this product. Please contact the factory for any specific safety
concerns not addressed directly by this manual.
PPM100 Partial Pressure Monitor
ii
Safety and Preparation For Use
•
It is the installer's responsibility to ensure the safe operation of automated vacuum
systems. Carefully check manual operation of the system and the setpoint
programming instructions before switching to automatic operation.
•
Provide for fail-safe operation wherever an equipment malfunction could lead to a
hazardous situation.
Electrical Shock Risks
The most common risk associated with the operation of vacuum equipment
is electrical shock.
•
Dangerous voltages capable of causing injury and death are present during the
operation of this product. Do not remove the covers while the unit is
plugged into a live outlet.
•
Always operate the unit in its proper horizontal orientation. Do not operate
the unit on its side as foreign objects or liquids may enter through the ventilation
slots, creating an unsafe condition.
•
Do not use this product if it has unauthorized modifications. Unauthorized
modifications may result in fire, electric shock and other hazards.
•
Do not install substitute parts or perform any unauthorized modifications to this
instrument.
•
The line fuse is internal to the instrument and may not be serviced by
the user. If the red 'Line' LED does not turn on when line power is provided,
contact Stanford Research Systems.
•
The PPM100 has a detachable, three-wire power cord for connection to the power
source and to a protective ground. The exposed metal parts of the instrument are
connected to the outlet ground to protect against electrical shock. Always use an
outlet which has a properly connected protective ground. Consult with an
electrician if necessary. Be aware that grounding this product does not assure proper
grounding of the rest of the vacuum system.
•
The most important safety measure required to eliminate electric shock risks is to
provide an earth ground to all conductive parts of the vacuum chamber,
gauges and controllers.
•
GFCI (Ground Fault Circuit Interrupter) protected outlets are often available in
production and laboratory environments, particularly in proximity to water sources.
GFCI's are generally regarded as an important defense against electrocution.
However, the use of a GFCI in conjunction with PPM100's and vacuum
systems must not be regarded as a substitute for proper grounding and
careful system design. GFCI's must also be tested regularly to verify their
functionality. Always consult an electrician when in doubt.
•
Do not use accessories not recommended in this manual as they may be hazardous.
•
Always turn off the power to the instrument before connecting any
cable to the controller or to the RGA Head.
PPM100 Partial Pressure Monitor
Safety and Preparation For Use
iii
•
High-voltage ion-producing equipment such as a hot-cathode ionization gauge or an
RGA can, under certain circumstances, provide sufficient electrical conduction via a
plasma to couple a high voltage potential to the vacuum chamber walls. Any exposed
conductive parts of a gauge, RGA probe, or vacuum chamber may attain high voltage
potentials through this process if not properly grounded.
•
All conductors in, on, or around the vacuum system that are exposed to potential high
voltage electrical discharges must either be shielded at all times to protect personnel
or must be connected to the system earth-ground at all times.
•
All parts of a vacuum system utilized with this or any similar high voltage product
must be maintained at earth ground for safe operation. There should be an explicit
heavy duty earth-ground connected to the vacuum chamber. Check with
an electrician if necessary. All electronic instrumentation must be connected to
properly grounded electrical outlets and include a chassis grounding lug that must be
tied to the common earth-ground of the vacuum system. Beware! Failure to safely
ground your vacuum system can be fatal!
•
The electrical insulation in this product may become less effective at preventing
electrical shock after ten years of normal use (or even non-use). Products placed in
harsh environments might deteriorate even faster. Inspect all electrical insulation
periodically for signs of cracking and deterioration. Return the product to the factory
for service if the insulation has become unsafe.
•
To reduce the risk of fire and electrocution do not expose this product to rain or
moisture. Be careful not to spill liquid of any kind onto or into the product.
•
This product is intended for use only in a clean and dry laboratory environment.
Operation in other environments may cause damage to the product and reduce the
effectiveness of the safety features.
•
Keep in mind that O-ring seals without metal clamps or bolt connections
can isolate big portions of a vacuum system from its safety ground.
Verify that the vacuum port to which any new component is mounted is electrically
grounded. Use a ground lug on a flange bolt if necessary.
•
Keep all electrical wiring in your vacuum system neatly organized and in good
working conditions. Label and color-code all high voltage cables. Inspect all HV
wires periodically for problems as part of your safety checkups.
•
Use tie downs and cable channels to hold all electrical wiring in place (i.e. no
dangling cables).
•
Keep all electronic instrumentation neatly organized, and remove unconnected cables
and connectors from the vacuum setup.
•
If possible, rack mount your vacuum instrumentation.
•
Only use instrumentation with high quality cables and connectors that properly shield
all high voltage terminals. Eliminate homemade connections from your vacuum
setups.
•
High voltage cables from ion gauge controllers, ion guns, photomultiplier tubes, mass
spectrometer probes, power supplies, etc , can be inadvertently damaged if pinched
while tightening flange bolts. Keep all cables away from vacuum ports frequently
opened to air.
PPM100 Partial Pressure Monitor
iv
Safety and Preparation For Use
•
The voltages delivered by the RGA/PPM100 system can be lethal, particularly during
electron bombardment degas. Do not touch any of its connection pins even if the
gauge is off.
•
Do not push objects of any kind into this product through openings as they may come
in contact with dangerous voltage points or short out parts that could result in a fire
or electric shock.
•
Verify that the vacuum port to which the RGA Head is mounted is electrically
grounded. It is essential for personnel safety as well as proper operation that the
RGA Head mounting flange be properly connected to the facility
earth-ground. Use a ground-lug on a flange bolt if necessary.
•
Perform regular electrical ground checkups on your entire vacuum system,
particularly if it is shared by multiple users running unrelated experiments. During a
ground checkup carefully examine all vacuum system components: Are all exposed
connectors and conductors on the vacuum chamber grounded? Are all ground
connections properly connected to a solid earth (i.e. facility) ground? Some vacuum
systems rely on water piping for the earth-ground connection. Proper ground
connection can be easily lost by inadvertently inserting a plastic interconnect into the
water lines. Refer to the step-by-step vacuum system grounding test procedure in
Chapter 1 of this manual.
•
Operation of this product with line voltages other than those accepted by the power
supply can cause damage to the instrument and injury to personnel.
Burn Risks
Another common safety concern for vacuum system operators is burns.
•
Filament based devices, such as Bayard-Alpert ionization gauges and RGAs, radiate
heat to areas adjacent to the filament, sometimes making them too hot to touch.
•
Do not touch hot-cathode Ionization Gauges and RGA's during degassing operation.
Serious burns can occur.
•
Acetone, toluene and isopropyl alcohol are highly flammable and should not be used
near an open flame or energized electrical equipment.
Explosion Risks
Injury due to explosion is another important safety concern during the operation of a
vacuum system and gas manifold system.
Explosion is possible in systems that are routinely cycled from vacuum to pressures
above atmosphere and can be caused by many different reasons. Dangerous overpressure
conditions can be established if a pressure regulator is set to the wrong value, the wrong
gauge or gauge calibration is used for positive pressure measurements or even if a bad
setpoint value is programmed into an automated process control setup. Explosions can
also occur if flammable or explosive gases are exposed to hot elements such as the hot
filaments of an RGA or the sensor wire of a Pirani gauge.
PPM100 Partial Pressure Monitor
Safety and Preparation For Use
v
•
Check that the right cylinders, with the right gases, are connected to the gas handling
system before starting any process.
•
Check the pressure regulator settings before starting any process.
•
Confirm that the right units were used to program the setpoints of all
automated process control channels.
•
Install suitable devices that will limit the pressure to the level that the vacuum
system, and its gas manifold, can safely withstand.
•
Use pressure relief valves in the gas manifold and in the vacuum chamber, that will
release pressure at a level considerably below that pressure which the system can
withstand.
•
Do not use the product to measure the pressure of flammable,
explosive, combustible or corrosive gases or mixtures of gases. Turn off
hot filament gauges during the exposure to flammable or explosive gases. Do not use
this product to measure the pressure of unknown gases.
•
Avoid enhanced Pirani and thermocouple gauges for pressure measurements in
systems routinely pressurized above atmosphere (capacitance diaphragm gauges are
much safer and recommended instead).
•
If used improperly, Pirani gauges can supply incorrect pressure readings. For
example, using the N2 calibration of a convection-enhanced Pirani gauge (i.e. PG105
or PG105-UHV) to pressurize a vacuum system above 1 Torr with certain other gases
can cause dangerously high pressures and may lead to explosion.
•
Do not use compression fittings for positive pressure applications.
Pirani, thermocouple and even capacitance diaphragm gauges mounted in this fashion
can be forcefully ejected and injure anybody in their path.
Implosion Risks
The risk of implosion must also be considered in high vacuum systems using glass
windows, glass tubulation and glass-envelope ionization gauges. Dropping a tool on a
gauge under vacuum, or pulling on the cables can easily break the glass. The resulting
implosion may then throw glass fragments around the room injuring personnel.
•
Glass-tubulated ionization gauges should not be treated roughly or be bumped.
•
Install the ion gauge cable on glass tubulated gauges before the gauge reaches
vacuum pressures.
•
Stress relief all cables attached to glass tubulated ionization gauges.
•
Do not allow the gauge tube temperature to exceed 100° C in glass tubulated gauges.
Sustained high temperatures can damage the tube, causing air leakage into the
vacuum system and increasing the chances of dangerous implosion.
•
Make all glass windows as small and thick as possible.
•
Wherever feasible, replace glass-tubulated gauges with all-metal ones.
•
Protect all glass components with internal vacuum with tape or metal shields.
PPM100 Partial Pressure Monitor
vi
Safety and Preparation For Use
References
For additional information on vacuum technology safety recommendations consult:
1. Charles F. Morrison, "Safety Hazard From Gas Discharge Interactions with the
Bayard-Alpert Ionization Gauge", J. Vac. Sci. Technol. A 3 (5) (1985) 2032.
2. R. N. Peacock, "Safety and Health Considerations Related to Vacuum Gauging", J.
Vac. Sci. Technol. A 11(4) (1993) 1627.
3. John T. Yates, Jr., "Experimental Innovations in Surface Science. A Guide to
Practical Laboratory Methods and Instruments", Springer-Verlag, New York, Inc.,
1998: (1) Section 238, p. 832, titled: 'Electrical Shocks in the Laboratory'; and (2)
Section 239, p. 836, titled: 'Accidental Electrical Charging From Ionization Gauge'.
4. Gerardo Brucker, "Prevention is Key to Vacuum System Safety", R&D Magazine,
February 2001, p. 57.
5. Donald M. Mattox, "Safety Aspects of Vacuum Processing", Vacuum Technology
and Coating Magazine, March 2001, p. 22.
PPM100 Partial Pressure Monitor
vii
Contents
Safety and Preparation For Use i
Contents vii
Front Panel Overview x
Touchscreen Display Overview xi
Back Panel Overview xii
Connector Pinouts xiii
Specifications xvii
Command List xviii
Damage Requiring Service xxi
Declaration of Contamination of Vacuum Equipment xxiii
Chapter 1 Getting Started
Unpacking 1-3
Installing the PPM100 Controller 1-4
Installing and Connecting the RGA Head 1-6
Installing and Connecting Capacitance Manometers 1-8
PPM100 Quick Setup 1-12
Pressure Measurement 1-18
Pressure Display Screen 1-21
MassSpec Display 1-27
Leak Testing with the PPM100 1-29
Proper Grounding Test Procedure 1-31
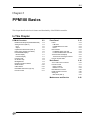
Chapter 2 PPM100 Basics
PPM100 Overview 2-3
Front Panel 2-13
Back Panel 2-16
Maintenance and Service 2-22
Chapter 3 Displays and Menus
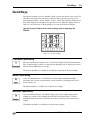
QuickKeys 3-5
Menu Buttons 3-8
Pressure Display 3-10
Monitor Display 3-15
Partial Pressure Setup Menu 3-16
Alarm Menu 3-19
PPM100 Partial Pressure Monitor
viii
Contents
Analog I/O Display 3-20
Analog I/O Setup Menu 3-23
Zero Manometer
3-26
MassSpec Display 3-27
Y Axis Menu 3-29
Logging Display 3-30
Logging Setup Menu 3-32
Chart Y Axis Menu 3-34
Chart X Axis Menu 3-35
Process Control Display 3-36
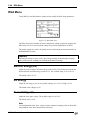
Edit Rules Menu 3-39
Edit Messages Menu 3-43
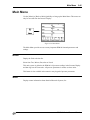
Main Menu 3-45
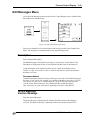
RGA Menu 3-46
Advanced Menu 3-48
Utilities Menu 3-50
Selftest
3-51
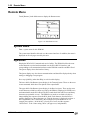
Remote Menu 3-52
RS-232 3-53
GPIB 3-54
Web 3-55
Web Control 3-57
USB 3-59
Screen Menu 3-60
Backlight Menu 3-62
Chapter 4 Analog I/O Ports
Analog I/O Ports (AN1-AN4) 4-3
Capacitance Manometers (CM1-CM4) 4-6
Compact Gauges 4-8
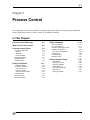
Chapter 5 Process Control
Process Control Warnings 5-3
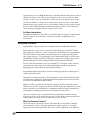
Why Use Process Control? 5-4
Process Control Basics 5-5
Relay Connections 5-11
Digital I/O Module 5-17
Remote Control Inputs 5-22
PPM100 Partial Pressure Monitor
Contents
ix
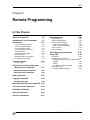
Chapter 6 Programming
Index of Commands 6-3
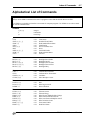
Alphabetical List of Commands 6-7
Introduction 6-11
Command Syntax 6-15
Partial Pressure / Analog Input Measurement Commands 6-17
PPM Monitor Setup 6-21
Analog I/O Setup 6-24
RGA Commands 6-25
Logging Commands 6-30
Charting 6-33
Mass Spectrum Display Commands 6-35
Process Control Commands 6-38
Backlight Commands 6-44
System Commands 6-45
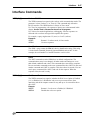
Interface Commands 6-47
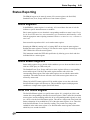
Status Reporting 6-49
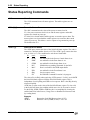
Status Reporting Commands 6-52
Using USB 6-58
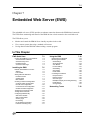
Chapter 7 Embedded Web Server
EWS Quick Start 7-3
Installing the EWS 7-5
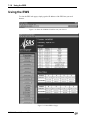
Using the EWS 7-18
Networking Terms 7-32
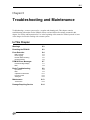
Chapter 8 Troubleshooting
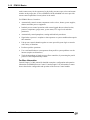
Warnings 8-3
Resetting the PPM100 8-3
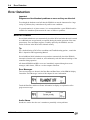
Error Detection 8-4
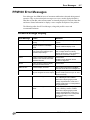
PPM100 Error Messages 8-7
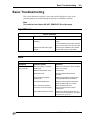
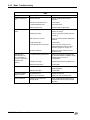
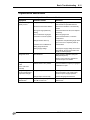
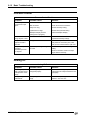
Basic Troubleshooting 8-9
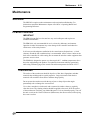
Maintenance 8-13
Damage Requiring Service 8-14
PPM100 Partial Pressure Monitor
x
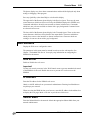
Overview
Front Panel Overview
1
5
2
3
4
6
6
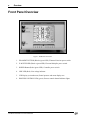
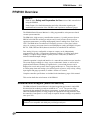
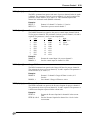
Figure i. PPM100 Front Panel.
1. FILAMENT BUTTON (Black w/green LED). Filament Emission power switch.
2. E. MULTIPLIER (Black w/green LED). Electron Multiplier power switch.
3. POWER Button (Red w/green LED). Controller power switch.
4. LINE LED (Red). Line voltage indicator.
5. LCD Display (w/touchscreen). Partial pressure and menu display area.
6. PROCESS CONTROL LEDs (green). Process control channel indicator lights.
PPM100 Partial Pressure Monitor
Overview
xi
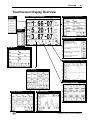
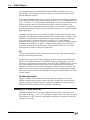
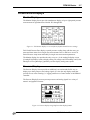
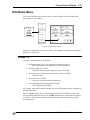
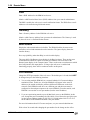
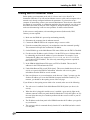
Touchscreen Display Overview
Main Pressure Display
Choose
format
Partial Pressure or Input Setup
Choose
source
Help About a Button
Main Menu
Data Log Display (Chart or Table)
Monitor Display
Process Control Display
Analog I/O Display
MassSpec Display
PPM100 Partial Pressure Monitor
xii
Overview
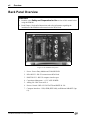
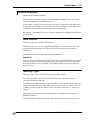
Back Panel Overview
WARNING!
•
Read the entire Safety and Preparation for Use section of this manual before
using the PPM100.
•
Read Chapter 1 for detailed instructions and safety information regarding the
installation of the PPM100 and connection to the RGA Head.
6
5
4
3
7
2
1
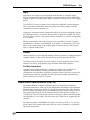
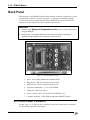
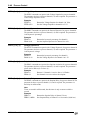
Figure ii. The PPM100 back panel.
1. Power - Power Entry Module and CHASSIS GND.
2. RGA RS-232 – RS-232 connection to RGA Head.
3. HOST RS-232 – RS-232 computer interface port.
4. Capacitance Manometer – ±15 V AUX POWER.
5. Analog I/O - BNC Ports AN1-4
6. Process Control - RELAY CONTACTS and DIGITAL I/O.
7. Computer Interfaces - USB, GPIB (IEEE-488), and Ethernet 10BASET (Opt
01).
PPM100 Partial Pressure Monitor
Overview
xiii
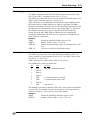
Connector Pinouts
WARNING!
•
Read the entire Safety and Preparation for Use section of this manual before
using the PPM100.
•
Read Chapter 1 for detailed instructions and safety information regarding the
installation of the PPM100 and connection to the RGA Head.
±15 V AUX Power Connector
Use this 3-pin, ±15 V (100 mA max), connector to provide electrical power to standard
(i.e. non-heated) capacitance manometers.
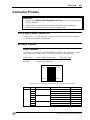
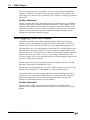
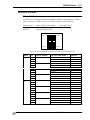
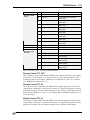
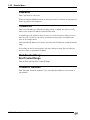
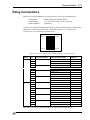
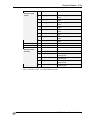
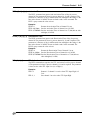
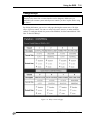
Process Control
Relay Contacts
Use these two 12-Position Terminal Block Plugs to connect to the eight process control
relays. All relays are SPDT, form C, 5A/250VAC/30VDC, resistive load only.
Process Action
INACTIVE
ACTIVE
Relay Common Connected to
Normally Closed pin (NC)
Normally Open pin (NO)
Block 1
Rear Panel Label
I
A
1
Block 2
13 CH5
CH4 12
24 CH8
CH1
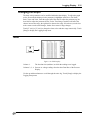
Figure iii. The 2 12-position terminal blocks for process relay connections.
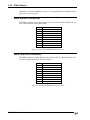
Block
Pin
Process Channel
Process Control Label
Relay Pin
1
1
2
3
4
5
6
7
8
9
1
Common ( C )
Inactive ( I )
Active ( A )
Common ( C )
Inactive ( I )
Active ( A )
Common ( C )
Inactive ( I )
Active ( A )
C
NC
NO
C
NC
NO
C
NC
NO
2
3
PPM100 Partial Pressure Monitor
xiv
Overview
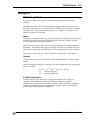
Block
Pin
Process Channel
Process Control Label
Relay Pin
1
10
11
12
4
Common ( C )
Inactive ( I )
Active ( A )
C
NC
NO
2
13
14
15
16
17
18
19
20
21
22
23
24
5
Common ( C )
Inactive ( I )
Active ( A )
Common ( C )
Inactive ( I )
Active ( A )
Common ( C )
Inactive ( I )
Active ( A )
Common ( C )
Inactive ( I )
Active ( A )
C
NC
NO
C
NC
NO
C
NC
NO
C
NC
NO
6
7
8
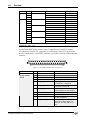
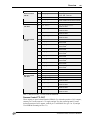
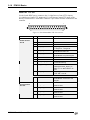
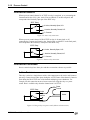
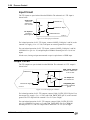
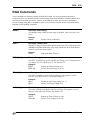
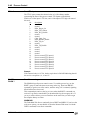
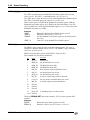
DIGITAL TTL I/O
Use the female DB37 port to connect to the (1) eight Process Control TTL Outputs,
(2) eight Process Control TTL inputs and (3) seven Remote Control TTL inputs of the
Process Control Board. A male DB37 connector is provided to facilitate connection to the
controller.
19
1
37
20
Figure iv. The PPM100 DB37 TTL I/O connector.
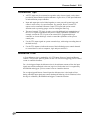
Module
Remote Control
TTL IN
PPM100 Partial Pressure Monitor
Pin
Name
Description
1
PPM100 Vcc
+5 V OUT
2
3
4
5
ANODE COM
Not Used
Not Used
RGA_Degas
External User +5 V IN
6
RGA_FIL_Lockout
7
RGA_Key_Disable
8
9
10
Not Used
Not Used
Clear_Data_Log
11
RGA_Remote_Enable
Edge trigger:
↓= Degas On, ↑=Degas Off
Level:
LOW=RGA emission Off
Level:
LOW=Disable front panel Keypad.
Edge trigger:
↓=clear the data log
Level:
HIGH=Ignore RGA_Degas_On,
RGA_FIL_On, RGA_EMULT_On
pins.
Overview
Module
Pin
Name
Description
Remote Control
TTL IN
12
RGA_FIL_On
Edge trigger:
↓=FIL ON, ↑=FIL Off
13
14
Not Used
RGA_FP_Disable
15
PPM100 Vcc
+5 V OUT
16
TTL_OUT_5
17
TTL_OUT_6
18
TTL_OUT_7
19
TTL_OUT_8
TTL OUT for Channel 5.
LOW=ACTIVE
TTL OUT for Channel 6.
LOW=ACTIVE
TTL OUT for Channel 7.
LOW=ACTIVE
TTL OUT for Channel 8.
LOW=ACTIVE
20
21
ANODE COM
TTL_IN_1
22
TTL_IN_2
23
TTL_IN_3
24
TTL_IN_4
25
TTL_IN_5
26
TTL_IN_6
27
TTL_IN_7
28
TTL_IN_8
29
30
31
unused
PPM100 Ground
PPM100 Ground
32
33
34
COM_EMTR_REF
COM_COLTR_PULLUP
TTL_OUT_1
35
TTL_OUT_2
36
TTL_OUT_3
37
TTL_OUT_4
Process Control
TTL OUT
Process Control
TTL IN
Process Control
TTL OUT
xv
Level:
LOW= Disable Front Panel Controls
External User +5 V IN
TTL Input Signal for Channel 1.
Active LOW
TTL Input Signal for Channel 2.
Active LOW
TTL Input Signal for Channel 3.
Active LOW
TTL Input Signal for Channel 4.
Active LOW
TTL Input Signal for Channel 5.
Active LOW
TTL Input Signal for Channel 6.
Active LOW
TTL Input Signal for Channel 7.
Active LOW
TTL Input Signal for Channel 8.
Active LOW
External User Ground
External User +5 V IN
TTL OUT for Channel 1.
LOW=ACTIVE
TTL OUT for Channel 2.
LOW=ACTIVE
TTL OUT for Channel 3.
LOW=ACTIVE
TTL OUT for Channel 4.
LOW=ACTIVE
Note: ↓=HIGH-to-LOW, ↑=LOW-to-HIGH transition.
Process Control TTL OUT
These outputs are opto-isolated from the PPM100. For isolated operation of ALL outputs,
connect pin 33 to the external +5 V supply and pin 32 to the external ground. For nonisolated operation of ALL outputs, connect pin 33 to PPM100 Vcc (pin 1 or 15) and pin
32 to PPM100 Ground (pin 30 or 31).
PPM100 Partial Pressure Monitor
xvi
Overview
Process Control TTL IN
These inputs are opto-isolated from the PPM100. For isolated operation of ALL Process
Control inputs, connect pins 2 and 20 to the external +5 V supply. Pull inputs to external
ground for low inputs. For non-isolated operation of ALL Process Control inputs, connect
pins 2 and 20 to PPM100 Vcc (pin 1 or 15) and pull inputs to PPM100 Ground (pin 30 or
31) for low inputs.
Remote Control TTL IN
These inputs are opto-isolated from the PPM100. For isolated operation of ALL Remote
Control inputs, connect pins 2 and 20 to the external +5 V supply. Pull inputs to external
ground for low inputs. For non-isolated operation of ALL Remote Control inputs,
connect pins 2 and 20 to PPM100 Vcc (pin 1 or 15) and pull inputs to PPM100 Ground
(pin 30 or 31) for low inputs.
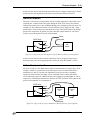
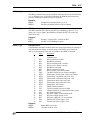
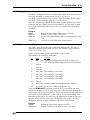
RGA RS-232 Connector
The PPM100 includes a male DB9 connector for serial communication (RS-232, DTE)
with the RGA Head.
Pin
Signal
1
2
3
4
5
6
7
8
9
unused
Receive data from RGA
Transmit data to RGA
unused
ground
unused
handshake from PPM
handshake from RGA
unused
Figure v. The PPM100 DB9 RGA RS-232 connector.
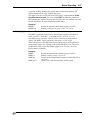
HOST RS-232 Connector
The PPM100 includes a female DB9 connector for serial communication (RS-232, DCE)
with a host PC computer.
Pin
Signal
1
2
3
4
5
6
7
8
9
unused
Transmit data to Host
Receive data from Host
unused
ground
unused
handshake from Host
handshake from PPM
unused
Figure vi. The PPM100 DB9 RGA RS-232 connector.
PPM100 Partial Pressure Monitor
Specifications
xvii
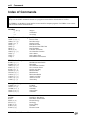
Specifications
Specifications apply after 1 hour of warm-up
General
Interfaces
Weight/Dimensions
Warranty
RS-232, USB, GPIB and Ethernet interface with embedded
web server
90 to 264 VAC, 47 to 63 Hz, 240 W
0°C to 40°C, non-condensing
Less than 90% humidity
15 lbs. / 8.5"x5.25"x16" (WHD)
One year parts and labor
Display
Type
Resolution
Modes
Units
Numeric resolution
Update rate
Back-lit, touchscreen LCD (4.7" diag)
320 x 240 pixels
Numeric, bargraph, P vs. T
Torr, mbar, bar, Pa and micron
3 digit mantissa plus exponent
2 samples per second
Power
Operating temperature
Electrical (20°C to 30°C)
Analog I/O
Ports
Range
Resolution
Update rate
Connector
4 configurable analog ports
±12 Vdc
14-bit (In), 12-bit (Out)
2 Hz
BNC
Gauges
Capacitance Manometer
Number of gauges
Simultaneous readout of up to four capacitance manometers
using the auxiliary inputs.
Auxiliary power output
±15 Vdc, 100 mA (for CM power)
Process Control
Number of channels
Input signals
Output signals
Relays
TTL outputs
Manual control
Remote TTL control
8 channels with programmable setpoint, polarity, hysteresis,
delay, audio signal and text messages.
Total pressure (CM gauge), partial pressure (RGA), voltage
(analog I/O ports), time (internal clock), TTL and gauge status.
Relay and TTL level
SPDT, form C, 5A/250VAC/30VDC, resistive load
Active low, opto-isolated
All channels can be operated from front panel.
8 opto-isolated TTL channels (Fil on/off, Degas on/off, Fil
lockout, Control keypad lockout, data logging time reset,
touchscreen enable/disable, remote enable/disable)
PPM100 Partial Pressure Monitor
xviii
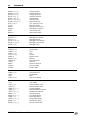
Commands
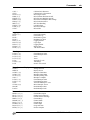
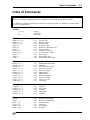
Index of Commands
Important
Always use the GPMU command at the start of a program to ensure that the desired units are in effect.
Use VERB 0 to set the RS-232 serial interface to terse mode for computer programs. Use VERB 1 to use verbose
mode for serial console communications.
Variables
i, j, d, n, p
x
s, t
integers
real number
text strings
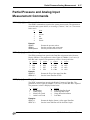
Partial Pressure and Analog Input Measurement
GPMU (?) {n} {s}
Pressure Units
GPBA (?) n {, p}
Data Bar Assign
GPDF (?) n {, i}
Display Format
GDAT ? p
Read Source Data
GDTX ? p
Read Source Data With Units
LRAT ? p
Read Leak Rate
LRCE (?) {n}
Leak Rate Coefficient
GDES (?) p {, s}
Gas Name/Port Location
GSTA ? p
Source Status
GSTT ? p
Source Status Time
OAQU ?
Read Monitor Alarm Status
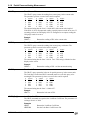
PPM Monitor Setup
PCME (?) p {, i}
MAME (?) p {, n}
GDES (?) p {, s}
SMCF (?) p {, x}
SVGL (?) p {, i}
NFTM (?) p {, n}
HVTM (?) p {, i}
OAEN (?) p {, i}
OALH (?) p {, x}
OALL (?) p {, x}
OABP (?) p {, i}
PPM Measurement Enable
PPM Mass
Gas Name/Port Location
Gas Correction Factor
Set Gas via Library
PPM Scan Rate
PPM Detector
PPM Alarm Enable
Alarm Level High
Alarm Level Low
Alarm Beep
Analog Port Setup
GADM (?) n {, i}
GDAS (?) n {, i}
GCMM (?) n {, i}
GDAV (?) n {, x}
CMPX (?) n {, x}
I/O Mode
DAC Source
CM Mode
Output Value
CM PMax
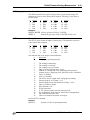
RGA
MAXM ?
RGAI ?
EEEV (?) {n}
IEEV (?) {i}
FOPV (?) {n}
SCRA (?) {n}
ECMA (?) {x}
Read RGA Mass Range
Read RGA Identification
Electron Energy
Ion Energy
Focus Voltage
Scan Rate
Electron Current
PPM100 Partial Pressure Monitor
Commands
CALL ?
CEIV ?
DGAS (?) {i}
EMIS (?) {i}
ENEM (?) {i}
EMBV (?) {n}
EREQ (?) {i}
IRFE (?) {i}
LRER (?) {0}
PASS (?) {i}
SYNC?
Calibrate RGA Detectors
Calibrate RGA Electrometer
RGA Degas On/Off
RGA Filament Emission On/Off
RGA Electron Multiplier On/Off
RGA Electron Multiplier Bias Voltage
RGA Ionization Source
RF7 Error Handling
Last RGA Error
RGA Pass Through
RGA SYNC
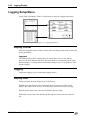
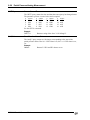
Logging
PLDS (?) {i}
PLCL
PLGF ?
PLGN ?
PLIN (?) {n}
PLWT (?) {n}
PLEN (?) {i}
PLDD (?) {i}
PLTR (?) {i}
Chart/Table Display
Clear Data Log
Read Data Log First
Read Data Log Next
Logging Interval
Log Length
Logging Enable
Display Date
TTL Reset Enable
Charting
LCPN (?) {x}
LCPX (?) {x}
LCVN (?) {x}
LCVX (?) {x}
LCSA
LCRG (?) {n}
LCSF
Chart/MassSpec Pmin
Chart/MassSpec Pmax
Vmin
Vmax
Autoscale Y-Axis
Time Range
Scale X-Axis to Full
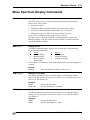
Mass Spectrum Display
SCOK ?
MENU d
SCMF (?) {n}
SCMI (?) {n}
SCAN (?) {i}
OSCC ?
LCPN (?) {x}
LCPX (?) {x}
SYSA
CTOM (?) {n}
MACB ?
PACB ?
Analog Scan OK
Display Screen
MassSpec Final Mass
MassSpec Initial Mass
Start/Stop Analog Scan
MassSpec Complete
Chart/MassSpec Pmin
Chart/MassSpec Pmax
Autoscale MassSpec Y-Axis
Move MassSpec Cursor
Read MassSpec Mass
Read MassSpec Peak
Process Control
RDES (?) d {, s}
RLCL (?) d {, s}
RLOP (?) d {, s}
RBEP (?) d {, i}
RMOD (?) d {, i}
RSTA (?) d {, i}
RAMS (?) d {, i}
RGOS (?) d {, i}
RTRP (?) d {, x}
Channel Description
Channel Active Message
Channel Inactive Message
Channel Beep
Channel Mode
Channel State
Channel Input
Gauge Off State
Pressure Setpoint
xix
PPM100 Partial Pressure Monitor
xx
Commands
RTRV (?) d {, x}
RPHY (?) d {, n}
RVHY (?) d {, x}
RPOL (?) d {, i}
RDEL (?) d {, n}
RTCL (?) d {,n} {,s}
RTOP (?) d {,n} {,s}
RTIL (?) d {, i}
TTLL ?
RHGF ?
RHGN ?
RHCL
RBAD ?
Voltage Setpoint
Percent Hysteresis
Voltage Hysteresis
Setpoint Activation
Setpoint Delay
Activation Time
Deactivation Time
TTL Activation Level
Read TTL Inputs
Read Process Log First
Read Process Log Next
Clear Process Log
Relay Failure Status
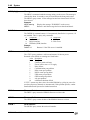
Backlight
BLEN (?) {i}
BLIT (?) {i}
BLOF (?) {n} {s}
BLON (?) {n} {s}
BLTD (?) {n}
Backlight Saver Enable
Backlight On/Off
Backlight Turn-Off Time
Backlight Turn-On Time
Backlight Delay
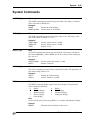
System
NAME (?) {s}
TIME (?) {s}
DATE (?) {s}
VOLC (?) {n}
MENU d
MESG (?) {s}
DHWR ? d
*TST ?
FREV ?
VRDT ?
SNUM?
System Name
Time
Date
Volume
Display Screen
Message
Detect Hardware
Self-Test
Firmware Revision
Firmware Build
Serial Number
Interface
VERB (?) {i}
*IDN ?
*RST
WSEN (?) {i}
Verbose RS-232
Identification
Reset
Web Server Enable
Status
*CLS
*PSC (?) {i}
*STB ? {i}
*SRE (?) {i} {, j}
*ESR ? {i}
*ESE (?) {i} {, j}
ERSW ? {i}
ERSE (?) {i} {, j}
GSSW ? {i}
GSSE (?) {i} {, j}
RSSW ? {i}
RSSE (?) {i} {, j}
Clear Status
Power-On Status Clear
Read Serial Poll Status
Serial Poll Enable
Read Standard Event Status
Standard Event Enable
Read Error Status
Error Status Enable
Read Gauge Status
Gauge Status Enable
Read Process Status
Process Status Enable
PPM100 Partial Pressure Monitor
Damage Requiring Service
xxi
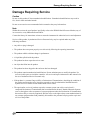
Damage Requiring Service
Caution
Do not use this product if it has unauthorized modifications. Unauthorized modifications may result in
fire, electric shock and other hazards.
Do not use accessories not recommended in this manual as they may be hazardous.
Note
Within this section, the word 'product' specifically refers to the PPM100 Partial Pressure Monitor, any of
its accessories, or any SRS manufactured RGA.
Contact the factory for instructions on how to return the instrument for authorized service and adjustment.
Service of this product, by Authorized Service Personnel only, may be required under any of the
following conditions:
• Any cable or plug is damaged.
• The product does not operate properly even after strictly following the operating instructions.
• The product exhibits a distinct change in performance.
• A liquid has spilled inside the product.
• The product has been exposed to rain or water.
• An object has fallen into the product.
• The product has been dropped or the enclosure has been damaged.
• The product contains unauthorized modifications. Do not substitute parts or modify the product. No
user-serviceable parts are inside the controller. All service and repair information in this manual is for
the use of Authorized Service Personnel only.
• If the product is a vacuum Gauge or RGA, a Declaration of Contamination, describing the condition of
the product and listing the gases it has been exposed to, must be submitted to Stanford Research
Systems for review before a return authorization can be issued.
• The repair and/or service of products exposed to vacuum systems can only be carried out if a
completed Declaration of Contamination has been submitted in advance. Stanford Research Systems
reserves the right to refuse acceptance of vacuum equipment where the Declaration of Contamination
has not been fully or correctly completed. SRS also reserves the right to deny return authorizations for
any vacuum equipment that could potentially be harmful to the personnel carrying out the repair and
service of the product.
PPM100 Partial Pressure Monitor
xxii
Damage Requiring Service
PPM100 Partial Pressure Monitor
Damage Requiring Service
xxiii
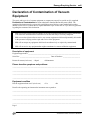
Declaration of Contamination of Vacuum
Equipment
The repair and/or service of vacuum equipment or components can only be carried out if a completed
Declaration of Contamination has been submitted to Stanford Research Systems (SRS). The
completed declaration must be reviewed by qualified personnel before a return authorization number
(RMA#) can be issued. Contact SRS to request additional copies of this form or if you have any questions
regarding the contents of this declaration.
•
SRS reserves the right to refuse acceptance of vacuum equipment submitted for repair or maintenance
work where the declaration has been omitted or has not been fully or correctly completed.
•
SRS reserves the right to refuse to service any vacuum equipment which could potentially be harmful
to the personnel carrying out the repair and service of the equipment.
•
SRS will not accept any equipment which has been radioactively or explosively contaminated.
•
SRS will not service any equipment that might contaminate its vacuum calibration equipment.
Description of equipment
Equipment type/model: ________________________________________________________________
Serial No.: _____________________________________ Date of Purchase: _____________________
Reason for return (circle one): • Repair
• Maintenance
Please describe symptoms and problems:
_____________________________________________________________________________________
_____________________________________________________________________________________
_____________________________________________________________________________________
_____________________________________________________________________________________
Equipment condition
Has the equipment been used ? (circle one)
• Yes
• No
Describe the operating environment the instrument was exposed to:
_____________________________________________________________________________________
_____________________________________________________________________________________
_____________________________________________________________________________________
_____________________________________________________________________________________
Page 1
PPM100 Partial Pressure Monitor
xxiv
Damage Requiring Service
Declaration of Contamination of Vacuum Equipment (cont.)
Was any of the equipment exposed to potentially harmful substances? (circle one)
• No
• Yes.
Please attach list of all known harmful substances including chemical name and symbol,
precautions associated with the substance and first aid measures in the event of accident.
Were any of the harmful substances:
•
Radioactive?
• Yes
• No
•
Toxic?
• Yes
• No
•
Corrosive?
• Yes
• No
•
Explosive?
• Yes
• No
Was the equipment decontaminated/cleaned before being shipped to SRS?
• Yes
• No
• Not Applicable
Legally Binding Declaration
I hereby declare that the information supplied on this form is complete and accurate. The dispatch of
equipment will be in accordance with the appropriate regulations covering Packaging, Transportation and
Labeling of Dangerous Substances.
Name (print): _______________________________________________________________________
Job Title: __________________________________________________________________________
Organization: _______________________________________________________________________
Address: ___________________________________________________________________________
Telephone: ___________________________________ Fax: _________________________________
Email: _________________@____________________
Legally binding signature: _________________________________________ Date: _______________
SRS Use Only.
RMA#:___________________________
Form reviewed by:
Signature_________________________
Page 2
Name/Initials______________________
Date:_____________________________
PPM100 Partial Pressure Monitor
1-1
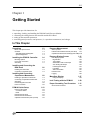
Chapter 1
Getting Started
This chapter provides instructions for
•
•
•
•
unpacking, checking and installing the PPM100 Partial Pressure Monitor
connecting the cabling between the controller and the RGA Head
setting up the controller parameters
measuring partial pressures, total pressures (i.e. capacitance manometers) and voltages
In This Chapter
Unpacking
Before You Open the Box
Checklist
Standard Equipment/Supplies
Optional Equipment
Installing the PPM100 Controller
Mounting Options
Line Power Connection
Grounding
Installing and Connecting the
RGA Head
1-3
1-3
1-3
1-3
1-3
1-4
1-4
1-4
1-5
1-6
Installing the RGA Head
Connecting to the RGA Head
1-6
1-6
Installing and Connecting
Capacitance Manometers
1-8
Installing a capacitance manometer
Connecting a Capacitance Manometer
Grounding
Pressure Signal Connection
Power Connection
PPM100 Quick Setup
Power-On Procedure
Connection Status
Reset
Partial Pressure Setup
Partial Pressure Parameters
Capacitance Manometer (CM1-4) Setup
1-8
1-9
1-9
1-10
1-10
Pressure Measurement
1-18
Warm-up times
1-18
Partial Pressure Measurements (PP1-PP8) 1-18
Capacitance Manometer Readings (CM1-CM4)1-20
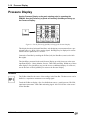
Pressure Display Screen
Data Display Options
Big Numbers
Trend Graph
Silent/Audio Leak Trend Graph
Auto Scaling Bar Graph
Full Range Bar Graph
Leak Rate
Status Information
Pressure Units
Logging
MassSpec Display
Using the Display
1-21
1-22
1-22
1-23
1-23
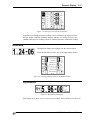
1-24
1-24
1-24
1-25
1-25
1-26
1-27
1-28
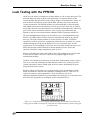
Leak Testing with the PPM100
1-29
Proper Grounding Test Procedure
1-31
Ground Test Procedure:
1-32
1-12
1-12
1-13
1-13
1-14
1-15
1-16
PPM100 Partial Pressure Monitor
1-2
Getting Started
PPM100 Partial Pressure Monitor
Installing the PPM100
1-3
Unpacking
Before You Open the Box
Read the entire Safety and Preparation for Use section of this manual before
starting any installation procedure.
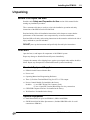
Take a moment at this time to read (or review) the installation, operation and safety
instructions of the SRS RGA100/200/300 Head.
Read and strictly follow all installation instructions in this chapter to ensure that the
performance of this instrument is not compromised by an incorrect installation.
Read and follow all safety and warning instructions in this manual to minimize the risk of
injury and death to yourself and others.
DO NOT power up the instrument until specifically directed by the instructions.
Checklist
Open the box(es) and inspect all components of the PPM100 system.
Report any damage to Stanford Research Systems immediately.
Compare the contents of the shipping boxes against your original order and the checklist
below. Report any discrepancies to Stanford Research Systems immediately.
Standard Equipment/Supplies
q
PPM100 Partial Pressure Monitor Box.
q
Power cord.
q
Operating Manual and Programming Reference.
q
Three (3) Position Terminal Block Plug for AUX ±15 Vdc output.
q
Process Control Module. Preinstalled at the factory.
Includes: (1) one DB37 Digital I/O Connector (male)
(2) two 12-position Terminal Block Plugs for relay connections.
q
GPIB/USB Computer Interface. Preinstalled at the factory.
q
Web Interface. Preinstalled at the factory.
Optional Equipment
q
Rack Mount Shelf, for up to two PPM100’s (SRS# O100IGRM).
q
SRS RGA100/200/300 Mass Spectrometer. (Includes DB9-DB9 cable for serial
connection to PPM100.)
PPM100 Partial Pressure Monitor
1-4
Installing the PPM100
Installing the PPM100 Controller
Read the entire Safety and Preparation for Use section of this manual before
starting any installation procedure.
Mounting Options
The PPM100 offers a variety of mounting options to fit your needs: (1) bench-top,
(2) half-rack and (3) two units, side-by-side, in full-rack width.
Place the controller in a secure place on your bench-top or mount it into an equipment
rack tray (SRS# O100IGRM, compatible w/standard 19 inch rack). In all cases, provide
adequate ventilation for the control unit to dissipate heat - ≈1 inch clearance around the
side ventilation slots is recommended. Allow at least 6 inches at the back of the controller
for cable routing. Do not mount the unit above other equipment that generates excessive
heat. The PPM100 is designed to operate over the range 0-40°C. Ambient temperatures
above that value may damage the instrument.
Line Power Connection
Line Voltage Selection
The PPM100 operates from a 100 V, 120 V, 220 V, or 240 V nominal AC power source
having a line frequency of 50 or 60 Hz.
Use the power entry module on the back panel of the PPM100 to power the unit from a
wall outlet. Make sure that suitable power is available for the controller: 100-240 Vac,
50-60 Hz, 500 W. Use the three-wire power cord, provided by Stanford Research
Systems, to connect the PPM100 to a properly grounded wall outlet. Contact
Stanford Research Systems if a power cord compatible with your outlets was not
included with your unit.
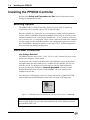
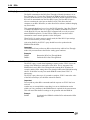
The connection of LINE power to the box is clearly indicated by a lighted LINE LED
(red) located below the POWER button at the lower left corner of the front panel.
Figure 1-1. LINE LED below the POWER button indicates that Line Power is connected.
WARNING!
Do not switch on the power yet! Wait until instructed to do so later. Make sure that the
green POWER LED is off.
PPM100 Partial Pressure Monitor
Installing the PPM100
1-5
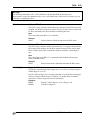
Grounding
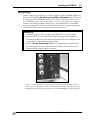
Connect a heavy duty ground wire, #12 AWG or larger, from the CHASSIS GND lug on
the back of the PPM100 directly to your facility earth ground. This will provide
an earth ground for the PPM100 in case the power cable is not in place. Do not connect
the CHASSIS GND lug to the vacuum system or other electrical component. Connect it
directly to the facility grounding system such as a grounded outlet box or a grounded
copper water supply line. Do not rely on small metal water lines to ground a component.
Get professional help from an experienced electrician if necessary.
WARNINGS!
•
Connecting the power cord to a properly grounded outlet is necessary, but not
sufficient with this (or any similar) high voltage producing vacuum equipment.
•
Grounding the PPM100 does not and cannot guarantee that other components of the
vacuum system are all maintained at earth ground.
•
Perform a Proper Grounding Test on your vacuum system (described at the
end of this chapter) if uncertain about the electrical safety of your vacuum setup.
Consult an experienced electrician if necessary.
1
2
Figure 1-2. Power and chassis-ground connection on the back of the PPM100 controller.
1. Power entry module with power cord (connected to grounded wall outlet on the other end),
2. CHASSIS GND lug with heavy gauge ground wire connected directly to facility earth ground.
PPM100 Partial Pressure Monitor
1-6
Installing the RGA Head
Installing and Connecting the RGA Head
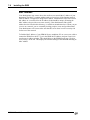
When properly connected to an SRS RGA Head, the PPM100 controller can monitor and
display partial pressure measurements for up to 8 independent component gases. A Scan
Display mode is also available to graph RGA Mass Spectra directly on the front panel of
the instrument.
All communications between the PPM100 and the SRS RGA Head take place over an
RS-232 serial interface connection. No power is delivered to the RGA Head from the
PPM100 controller.
Installing the RGA Head
WARNINGS!
•
Read the entire Safety and Preparation for Use section of the RGA Manual
before starting the SRS RGA Head installation procedure.
•
Read and strictly follow all RGA installation instructions in the RGA Manual to
ensure that the performance of the instrument is not compromised by an incorrect
installation.
•
PPM100 is not compatible with any third-party residual gas analyzers.
An RGA100/200/300 Head must be mounted on the vacuum system, and properly
pumped down (P < 10-4 Torr), before connection to the PPM100 box can be completed
and partial pressure readings can be displayed.
If not already in place, unpack and mount the SRS RGA Head on your vacuum system at
this time and pump the vacuum chamber down to a compatible base pressure (i.e. below
10-4 Torr.)
If possible, confirm proper operation of the SRS RGA Head before connecting to the
PPM100 - use the RGA Windows program (included) and a host computer connected
directly to the RGA’s serial communication port to test the mass spectrometer by itself.
Connecting to the RGA Head
WARNINGS!
•
Connect the interface cable to the PPM100 controller first, before establishing a
connection to the RGA Head.
•
DO NOT switch the controller power on until instructed to do so.
•
The RGA Head chassis must be properly grounded during operation to assure
operator safety.
•
Cables, once installed, must be secured to provide strain relief for the gauge pins.
PPM100 Partial Pressure Monitor
Installing the RGA Head
1-7
This section describes the electrical connection between the RGA Head and the PPM100
controller. A one-cable serial communication connection between the two devices is all
that is required to complete this connection. No power is delivered to the SRS RGA Head
from the PPM100 box.
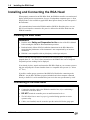
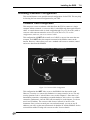
Locate the DB9-DB9 Serial Communication Cable included in the RGA package.
Connect the female cable connector to the RGA RS-232 DB9 Connector on the back
plane of the PPM100 controller. Connect the other end of the cable to the female DB9
connector, labeled RS-232/DCE/28.8k, on the back panel of the RGA’s electronic control
unit (ECU).
Figure 1-3. RGA-RS-232 Connector on the back of the PPM100.
PPM100 Partial Pressure Monitor
1-8
Connecting a Capacitance Manometer
Installing and Connecting Capacitance
Manometers
Capacitance manometers are also called Capacitance Diaphragm Gauges.
The PPM100 can display pressure as measured from standard capacitance manometers
(CMs). Up to four independent CM readings can be monitored simultaneously using the
four ANALOG I/O ports located on the back panel of the controller. The PPM100 also
supplies auxiliary power (±15 Vdc, 100 mA) sufficient to operate a pair of standard (i.e.
non-heated) capacitance manometers. The PPM100 precisely measures the 0 to 10 Vdc
linear output signal from the CM to determine pressure. Full-scale ranges up to 1000 Torr
are supported by the controller.
CMs may be ordered from several commercial sources. The specifications of CMs should
always be compared with the PPM100 specifications before a connection is established.
Stanford Research Systems is not responsible for changes in design or specifications of
third-party products that might render them incompatible with the PPM100 controller.
Installing a capacitance manometer
WARNINGS!
•
Read the entire Safety and Preparation for Use section of this manual before
starting any installation procedure.
•
Consult your gauge manufacturer for specific gauge installation requirements and
Stanford Research Systems if uncertain about the compatibility of PPM100 with your
third-party capacitance manometer
It is generally recommended CMs be mounted with the inlet port pointing vertically
downward. Although the gauge can be mounted in any orientation, mounting it as
suggested allows any foreign matter entering the pressure port to fall away from the
diaphragm. Isolate the unit from vibration as much as possible. While not susceptible to
gas damping, the diaphragm may become susceptible to resonance. The low range
transducers (≤1 Torr) are particularly sensitive and should be carefully isolated from any
vibrations. Isolate the vibration through the cable as well as through the port.
WARNING!
Do not connect a capacitance manometer gauge to the PPM100 until instructed to do so
later in this chapter.
PPM100 Partial Pressure Monitor
Connecting a Capacitance Manometer
1-9
Connecting a Capacitance Manometer
WARNINGS!
•
Connect all gauge signal cables to the PPM100 controller first, before establishing a
connection to the gauge heads.
•
DO NOT switch the controller power on until instructed to do so.
•
The gauge chassis must be properly grounded during operation to assure operator
safety.
•
Cables, once installed, must be secured to provide strain relief for the gauge pins.
This section describes the electrical connection of Capacitance Manometers (CM) to the
PPM100 controller. Capacitance Manometers are also known as Capacitance Diaphragm
Gauges. Up to four independent CM readings can be monitored, logged and displayed,
simultaneously. Full-scale ranges up to 1000 Torr are supported by the controller
software.
Unfortunately, there are a variety of conventions for connecting CMs. Consult your
installation and operation manuals for gauge-specific information including connector
type, pin assignments, electrical specifications, cable requirements and grounding
recommendations.
In many cases, pin assignments are conveniently silk-screened on the gauge casing close
to the electrical connector. Be prepared to manufacture your own custom cables to
interface CMs to the PPM100 controller.
IMPORTANT!
General guidelines for the manufacturing of generic interface cables are often listed in the
CM manual, or can be obtained directly from the gauge manufacturer.
Standard CMs require three basic connection steps:
• Grounding
• Pressure Signal Connection
• Power Connection
Grounding
The gauge chassis must be properly grounded during operation to assure operator safety.
Most CMs feature a chassis grounding lug that must be directly connected to the facility
ground by a #12 AWG copper wire. If necessary, use a ground lug on a flange bolt, or a
metal hose clamp on the sensor port, to establish a dedicated connection to the facility
ground.
IMPORTANT!
Consult the CM’s manual for gauge specific grounding requirements.
PPM100 Partial Pressure Monitor
1-10 Connecting a Capacitance Manometer
Pressure Signal Connection
To read CM pressures, the Pressure Output Signal must be connected to one of the four
ANALOG I/O ports - BNC connectors labeled '1' through '4' on the back panel. Identify
the two pins assigned to the pressure output signal on the gauge’s interface connector
(typically labeled signal out (+) and signal common (-)). Construct a cable from these
pins to a BNC connector, center pin connected to signal out (+) and outer shield
connected to signal common (-). Other names for the signal pins are: PRESS
OUT/OUTPUT RTN, Pressure Signal Output/Pressure Signal Output Return, SIGN
OUT/SIGN COM, etc.
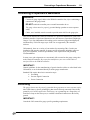
Power Connection
For added convenience, the PPM100 also includes an auxiliary ±15 Vdc (100 mA) CM
Power connector (3-position terminal block) on its back panel. This output is usually
sufficient for the simultaneous operation of a pair of standard gauges (i.e. non-heated,
±15 Vdc, 35 mA typ.). Additional gauges or heated gauges will generally require help
from an external source of power.
IMPORTANT!
Consult your CM manual or contact its manufacturer directly if you are uncertain about
the power requirements of your gauges. Consult Stanford Research systems if uncertain
about the compatibility of your CM(s) with the PPM100 controller.
Identify the three pins assigned to the ±15 Vdc power connection (typically labeled
-15 VDC, +15 VDC, and Power Return) and use three wires to connect the gauge to the
auxiliary ±15 VDC, 3-position, terminal block located on the back of the controller.
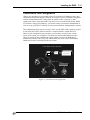
2
1
Figure 1-4. Capacitance Manometer Connection Ports.
1. Signal - Four ANALOG I/O BNC Ports. 2. Power - 3-position, terminal block.
PPM100 Partial Pressure Monitor
Connecting a Capacitance Manometer 1-11
Recommendation
Heated CMs often include additional pin connections assigned to heater status signals
such as: 1. At Temperature Status/At Temperature Status Return pair and, 2. Heater
Failure Status/ Heater Failure Status Return pair. In many cases these pin pairs act as
semiconductor switches and their contact signals can be interfaced to the Process Control
ports and used to trigger events in response to heater failure. This can be used to assure
the reliability of your CM gauges at all times, and to protect delicate and expensive
components sensitive to inaccurate pressure readings. Consult your gauge manual for
availability of these options in your gauge heads.
PPM100 Partial Pressure Monitor
1-12 PPM100 Quick Setup
PPM100 Quick Setup
This section describes the setup steps required to prepare the PPM100 for accurate partial
and total pressure measurements with a Residual Gas Analyzer and (up to four)
capacitance manometer gauges.
The steps in this section assume:
q
The PPM100 box has been properly installed and grounded.
q
Line power is connected to the controller (LINE LED on).
q
The controller is turned off (POWER LED off)
q
An SRS RGA Head and a capacitance manometer (ANALOG I/O 1 = CM1 port) are
connected to the controller.
q
Power is being delivered to the capacitance manometer.
q
The RGA Head is turned off (POWER LED Off)
q
All gauges are (1) mounted on the vacuum system, (2) properly grounded, (3) known
to be compatible with the controller, and (4) safely connected to your PPM100 using
Stanford Research System’s cables (except for CMs).
q
The RGA probe is exposed to a high vacuum environment with a known pressure <
10-4 Torr, and the gas composition is either: air, nitrogen or residual gas (i.e. typical
base pressure composition of a clean high vacuum system).
q
You are reasonably familiar with the general theory of operation of mass
spectrometers and capacitance manometers
q
The Relay and Logic Process Control ports (if available) are not physically connected
to any devices or in a safe MANUAL mode status.
q
The Remote Control TTL inputs are not connected or disabled.
q
Manual RGA operation - i.e. the controller is not under the control of an external
computer via one of its interfaces (RS-232, GPIB, USB or web).
Power-On Procedure
Power-up the RGA Head. Flip the power switch located on the back plane of the RGA’s
ECU. The Green POWER LED turns on, and a brief Power-on Self-Test procedure is
executed.
Power-up the PPM100 controller. Press the red POWER button located at the lower left
corner of the front panel. The green POWER LED turns on, a brief Power-On Self-Test
procedure is executed, and the Pressure Display Screen is displayed on the touch-screen
LCD.
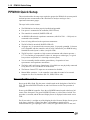
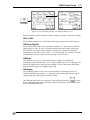
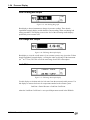
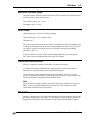
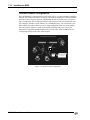
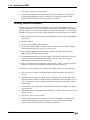
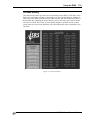
For all new units (i.e. straight out of the shipping box) the Pressure Display Screen, preset
at the factory, includes: (1) three Data Bars, corresponding to partial pressure
measurements PP1 (gas: Hydrogen, mass: 2 amu), PP2 (gas: Helium, mass: 4 amu) and
PPM100 Partial Pressure Monitor
PPM100 Quick Setup 1-13
PP3 (gas: Water, mass: 18 amu) [top to bottom], plus (2) [Menu], [Monitor], [Process],
[Chart], and [Help] QuickKeys lined up along the bottom of the screen (left to right.)
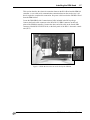
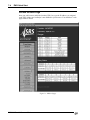
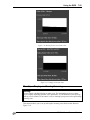
Figure 1-5. PPM100 Pressure Display Screen with factory default PP1, PP2 and PP3 Data Bars.
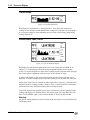
Connection Status
The status of the RS-232 connection between the PPM100 Controller and the RGA Head
is indicated with an icon located near the upper right corner of the PPM100 screen.
indicates that a fully functional RS-232 link is present
A CONNECTED icon
between the RGA Head and the PPM100 Controller.
An UNCONNECTED icon
indicates that the PPM100 has failed to detect a
connection to the RGA Head. Consult Chapter 8 Troubleshooting, if this icon is present.
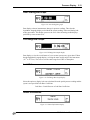
Reset
If your Pressure Display Screen does not appear like the one in Figure 1-5 at this point, it
is possible to force the PPM100 to revert to its factory-preset settings by holding down
the E. MULTIPLIER button during the Power-On procedure. However, keep in mind that
this will also revert many other important settings of the instrument to factory default
values (you might lose some important setup information). Holding down the E.
MULTIPLIER Button should not be required for new instruments being powered right
out of the shipping box.
The PP1, PP2 and PP3 Data Bars of your PPM100 should display a "FILAMENT OFF"
message at this time - the RGA Filament is not yet activated.
If "NO RGA" is displayed, consult Chapter 8 Troubleshooting for diagnostic procedures
related to the RS-232 connection between the RGA Head and the PPM100 Controller.
PPM100 Partial Pressure Monitor
1-14 PPM100 Quick Setup
Partial Pressure Setup
PPM100 can monitor and display partial pressures of up to eight independent single gases
in a mixture. Each individual gas component is differentiated from all others based on its
unique contribution to the mixture’s total mass spectrum- i.e. a single mass is selected to
track each individual component’s partial pressure. For this reason, partial pressure
measurements are also often called “single mass” measurements in this manual.
All partial pressure readings are performed within the RGA Head and transmitted back to
the PPM100 for storage, display, process control and alarm activation. The PPM100
simply queries the RGA for the specified single mass measurements and displays the data
on its front panel.
For detailed information on how gas specific partial pressure measurements are
performed by the RGA Head, consult the SRS RGA Operating Manual at this time.
PPM100 has a menu-driven user interface. All operating parameters are grouped into
menus. Consult Chapter 3 of this manual for detailed menu information.
Help
Help for any menu button is available on screen by touching the [Help] QuickKey and
then the menu button.
PPM100 is preconfigured at the factory with partial pressure setup parameters for eight
(8) very common residual gas components: hydrogen, helium, water, nitrogen, oxygen,
argon, pump oil and carbon dioxide (PP1 through PP8, respectively). In order to enter
new Partial Pressure setup parameters for component gases not included in the factorydefault list, the user must follow the simple Partial Pressure setup procedure described
below. This procedure must be repeated for every new partial pressure measurement
programmed into the controller.
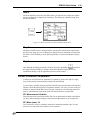
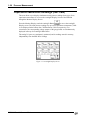
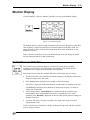
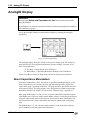
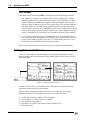
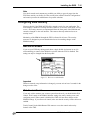
Step 1
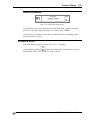
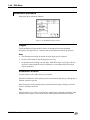
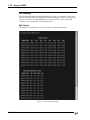
Starting from the Pressure Display Screen, touch the [Monitor] QuickKey to access the
Monitor Display.
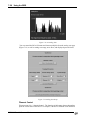
Figure 1-6. Monitor Display.
PPM100 Partial Pressure Monitor
PPM100 Quick Setup 1-15
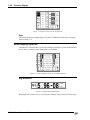
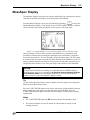
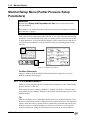
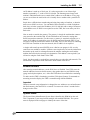
Step 2
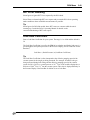
Select the Partial Pressure Box (PP1-PP8) where you want the new single-mass partial
pressure readings to be displayed by touching it. This brings up a Monitor/Setup menu
for the selected box.
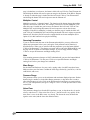
Figure 1-7. PP1 Partial Pressure Box and Monitor Setup menu
Step 3
Modify the Partial Pressure setup parameters, based on the measurement requirements
specific to the single gas to be monitored (see Partial Pressure Parameters section below
for details). Once finished, press the [Back] QuickKey to return to the Monitor Display
Screen.
Step 4
Once finished modifying parameters, touch the [Pressure] QuickKey
to return to
the original Pressure Display or simply remain in the Monitor Display Screen for
simultaneous display of up to eight partial pressure measurements
Partial Pressure Parameters
A unique set of Partial Pressure parameters is required for each of the eight (8) single
mass partial pressure measurements performed by the PPM100.
As an example, consider setting up the PP1 Partial Pressure measurement of the Monitor
Display to track the partial pressure of methane (formula: CH4, mass: 16 amu) in the gas
mixture in contact with the RGA Head. For this common gas, the following parameters
must be entered into the setup menu of the PP1 Partial Pressure measurement:
PP1 Measurement: Enabled
Each partial pressure measurement (PP1-PP8) can be individually enabled or disabled at
any time, and according to changes in measurement requirements or gas composition.
PP1 Mass (amu): 16
The 16 amu mass value is commonly selected for monitoring methane, since it is the
location of its main peak in the mixture’s mass spectrum.
PPM100 Partial Pressure Monitor
1-16 PPM100 Quick Setup
PP1 Name: Methane
A name entry is recommended to identify the PP1 Partial Pressure Measurement as the
one tracking methane gas at the single mass: 16 amu.
PP1 Scan rate: 1 - 8
The Scan Rate determines the averaging performed by the RGA head during the PP1
partial pressure measurements. Averaging increases, and detection limit decreases, as the
scan rate setting is reduced. The scan rate setting is interpreted as the Noise Floor setting
(NF) for the single mass measurement by the SRS RGA Head. Consult the SRS RGA
manual for details on this important measurement setting.
PP1 Detector: Faraday Cup or E. Multiplier
Select Faraday Cup or Electron Multiplier detector for all PP1 partial pressure
measurements. Consult the SRS RGA Operating Manual for details on detector options.
PP1 Correction factor: 0.01 - 100
All partial pressure readings are calculated by the PPM100 from the ion current readings
obtained from the RGA based on a sensitivity factor stored in the RGA Head and factorycalibrated against Nitrogen (@28 amu.) In order to correct the partial pressure readings
for methane, and according to the specific ionization efficiency and mass specific
throughput of its 16 amu mass peak, a correction factor needs to be calculated and
applied. Note: This number usually requires special calibration.
Alarm: High and Low levels. Enable or Disable.
High and low alarm levels can be set for each individual partial pressure measured, to
indicate system status directly in the Partial Pressure Boxes of the Monitor Display. The
alarm levels are independent from, and must not be confused with, the partial pressure
levels used by the process control channel rules.
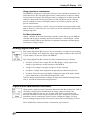
Capacitance Manometer (CM1-4) Setup
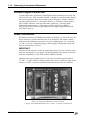
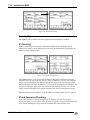
Configure an Analog Port
All four Analog I/O ports are configured as inputs as a factory default.
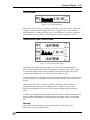
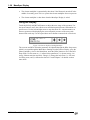
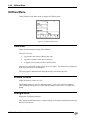
To configure an analog port to read capacitance manometer pressures start by touching
the [AnalogIO] Quickey in the Monitor Display Screen. This brings up the AnalogIO
Display Screen with: (1) four data boxes for analog voltages (top row, AN1-AN4) and (2)
four data boxes for CM readings (bottom row, CM1-CM4). Select the CM port
corresponding to your capacitance manometer by simply touching its box- for example
touch CM3 for a capacitance manometer connected to the AN3 port. This brings up the
Monitor/AnalogIO/Setup menu for the selected CM box.
PPM100 Partial Pressure Monitor
PPM100 Quick Setup 1-17
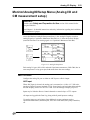
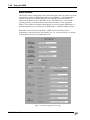
Figure 1-8. The [AnalogIO] QuickKey and AnalogIO Display screen
Several parameters must be adjusted in order to display capacitance manometer readings:
ADC or DAC
The I/O Mode should be set to ADC Input so that input voltages are read from the port.
CM Pmax (P@10V)
Pmax is the full scale range of the capacitance manometer (i.e. the pressure at which its
output signal =10 Vdc). Its value is usually indicated on the outer casing of the gauge
head. The full scale ranges most commonly encountered in commercial capacitance
manometers are: 50 and 100 mTorr, and 1, 2, 10, 100 and 1000 Torr. Consult your gauge
manufacturer(s) directly if unsure about your gauge’s full-scale range.
CM Name
The CM Name entry is very convenient and its use is highly recommended in
multi-gauge setups. PPM100 allows you to assign a unique name to each CM gauge. CM
Names are displayed next to their pressure readings. Use the CM Name to differentiate
between identical gauges in a multiple gauge setup.
CM display
The CM display must be set to Linear so that capacitance manometer pressures are
calculated and displayed properly - i.e. following a linear relationship between output
voltage and pressure and using the CM Pmax setting.
to return
Once finished entering the new parameters, touch the [Back] QuickKey
to the AnalogIO Display Screen, CM gauge voltages and pressures are now displayed in
their corresponding data boxes.
PPM100 Partial Pressure Monitor
1-18 Pressure Measurement
Pressure Measurement
This section describes the steps required to measure and display partial and total
pressures from an SRS RGA and (up to four) capacitance manometer gauges connected
to the PPM100. This is the final step of the installation procedure.
It is assumed that one SRS RGA and (at least) one capacitance manometer (CM1
connected to AN1) - are connected to the back ports, and that the controller has been
completely configured, using the instructions of the previous section. For simplicity, the
front panel is assumed to be in Monitor Display with factory default gas settings. Only
manual operation of the gauges is discussed.
Pressure readings may be displayed in various formats, in several different units and are
continuously updated. When logging is enabled, data from the SRS RGA, CM gauges
and analog inputs are stored in an internal data log at a user-programmable rate. The data
log can be displayed in either table or chart (P vs. time) formats.
Warm-up times
To minimize temperature-induced drift in partial pressure readings, warm-up times must
include operation of the SRS RGA at the selected emission current for at least thirty
minutes. PPM100 warm-up times of at least twenty (20) minutes are recommended for
stable analog voltage readings.
Partial Pressure Measurements (PP1-PP8)
WARNING!
•
Do not operate the SRS RGA in the presence of explosive, flammable or combustible
gases.
•
Do not operate the SRS RGA at pressures >10-4 Torr since that will significantly
affect the filament’s lifetime and will deliver useless results.
In order to perform partial pressure measurements with a residual gas analyzer, its
filament must first be turned on. For manual operation, press the FILAMENT power
button located on the PPM100 front panel. The green FILAMENT LED to the right of the
FILAMENT button lights up to indicate the presence of electron emission. The filament
current ramps up over a few seconds minimizing pressure bursts in the vacuum system
and emission current overshoot in the RGA head.
As soon as full emission current is established, partial pressures from the RGA Head start
to be displayed on all "enabled" PP1-PP8 Partial Pressure Boxes of the Monitor and
Pressure Display Screens, and all related process control and alarm activation is enabled.
PPM100 Partial Pressure Monitor
Pressure Measurement
1-19
Figure 1-9. Front panel controls - FILAMENT power button/LED and E. MULTIPLIER power
button/LED.
A “WAIT” message is displayed in the Partial Pressure Data Box while electron emission
current is being established, and all pressure readings are ignored until full (and stable)
emission current is detected in the SRS RGA Head. No process control or alarm actions
are performed based on ionization gauge readings during the time the emission current is
being set.
Partial Pressure readings in the PP1-PP8 data boxes are continuously updated in a
sequential and circular fashion and at an update rate determined by the collective Scan
Rate settings of all the single mass measurements enabled.
Figure 1-10. Monitor Display Screen for the PPM100 with the eight Partial Pressure Boxes
enabled.
Press the FILAMENT power button again to turn the emission off – "FILAMENT OFF"
is displayed in all partial Pressure boxes.
As a general rule, if the RGA electron emission is on, the PPM100 is
either collecting (single mass) partial pressure measurements or
performing analog scans. The only way to interrupt data collection
from the RGA Head is by turning off the filament emission.
PPM100 Partial Pressure Monitor
1-20 Pressure Measurement
Capacitance Manometer Readings (CM1-CM4)
The most direct way to display simultaneous total pressure readings from (up to four)
capacitance manometers is to access the AnalogIO Display Screen of the PPM100
through the Monitor Display Screen.
to access the AnalogIO
From the Monitor Display, touch the AnalogIO Button
Display screen. The total pressure readings for up to four capacitance manometers (CM14) are displayed in the bottom four CM Data Boxes (CM1-4 respectively). For
convenience, the corresponding voltage outputs of the gauge heads are simultaneously
displayed in the top four AnalogIO Data Boxes.
The analog I/O ports are continuously monitored, and its readings stored in memory,
independently from the SRS RGA readings.
Figure 1-11. AnalogIO Display Screen
PPM100 Partial Pressure Monitor
Pressure DIsplay 1-21
Pressure Display Screen
The Pressure Display Screen provides an additional, convenient and flexible way to
display up to three pressures and voltage signals. It is also the only display mode that
provides access to the Logging (i.e. Table/Chart) and Process Control modes of the
PPM100 controller.
Figure 1-12. Pressure Display Screen with three data bars.
Use the [Pressure] QuickKey
time.
to bring up the PPM100 Pressure Display at any
The Pressure Display Screen consists of three Data Bars, each displaying a pressure (total
or partial) or analog signal. Readings may be displayed in various formats and are
updated twice a second.
Figure 1-13. Data Bar consisting of three adjacent boxes: ID (left), Data (center) and Info (right).
Each Data Bar consists of three adjacent boxes: ID (left), Data (center) and Info (right).
Customize a Data Bar by touching the ID or the Data boxes.
The ID box shows the source of the readings displayed by the data bar: PP1-PP8,
CM1-CM4 or AN1-AN4. For example, the PP1 Data Bar above displays partial pressure
readings from the RGA, in Torr, corresponding to the single-mass peak at 2 amu and
assumed to be originating from the single gas hydrogen.
Touch the ID box to select a different data source (i.e. another partial pressure
measurement, a CM pressure or an analog signal) for that Data Bar. To display
capacitance manometer readings, identify the Analog I/O port (1-4) connection and
choose the appropriate CM port (CM1-4) (For example, choose CM1 for a capacitance
manometer connected to the Analog I/O 1 port.)
PPM100 Partial Pressure Monitor
1-22 Pressure Display
Figure 1-14. Select a source for the top data bar.
Note
The analog and pressure output display will show 'OVERLOAD' if the Pressure Output
signal exceeds 12 V.
Data Display Options
The Data area of the Data Bar is where the readings are displayed. Touch inside the Data
box to choose a display format. Eight options are available.
Figure 1-15. Select a display option for the middle data bar.
Big Numbers
Figure 1-16. Big Numbers data display.
Best display for accurate, easy to view, pressure readings. Easily visible across the room.
PPM100 Partial Pressure Monitor
Pressure DIsplay 1-23
Trend Graph
Figure 1-17. Trend Graph display.
Best display for trend analysis. A stamp-sized 'Signal vs. time' plot of the 10 most recent
readings, sampled at the data logging interval (see 'Logging' below). It also includes a
small instantaneous reading next to the plot. Use trend graphs to see pressure changes in
time-dependent processes such as leak testing, pump downs, venting, bakeout, etc.
Silent/Audio Leak Trend Graph
Figure 1-18. Leak Trend Graph display.
Best display for leak detection applications (see “Leak Testing with the PPM100”
below). Use this display while leak testing components attached to the vacuum system.
Use leak trend graphs to detect leaks as partial pressure transients while spraying the
vacuum system components with a tracer gas such as helium or argon.
A stamp-sized 'Signal vs. time' plot of the 10 most recent partial pressures for the selected
mass is displayed. A small instantaneous partial pressure reading is also included next to
the plot.
When 'Audio Leak Trend' is selected, a repetitive audio signal whose frequency is
proportional to the partial pressure readings provides a means to “hear” pressure
transients, eliminating the need to look at the front panel display while searching for
leaks.
In order to provide optimum data acquisition rates at the mass of interest, all other partial
pressure readings and displays are disabled while in this display mode. The other Data
Bars will show "LEAKTREND" until a non-LeakTrend display is chosen for this Data
Bar.
Warning!
All process control channels must be in manual mode to be able to access the
Silent/Audio Leak Trend Display mode.
PPM100 Partial Pressure Monitor
1-24 Pressure Display
Auto Scaling Bar Graph
Figure 1-19. Auto Scaling Bar graph.
Best display to detect instantaneous changes in pressure readings. Three decade
logarithmic bargraph display scaled about the current reading. Often used during leak
testing procedures. This display preserves the 'feel' of the old analog needle displays
preferred by some vacuum users.
Full Range Bar Graph
Figure 1-20. Full Range Bar Graph display.
Best display to view the overall status of your vacuum system at any given time. Fifteen
decade logarithmic bargraph display, covering the entire useful range of the instrument
(10-15 to 103 Torr). The scale covers the entire range from UHV to atmosphere.
Leak Rate
Figure 1-21. Full Range Bar Graph display.
Use this display to calculate and view leak rates from the measured partial pressure. Use
this display to measure leak rates for components attached to the vacuum system.
Leak Rate = Partial Pressure x Leak Rate Coefficient
where the Leak Rate Coefficient is a user specified parameter stored in the PPM100.
PPM100 Partial Pressure Monitor
Pressure DIsplay 1-25
Status Information
Figure 1-22. Status Information display.
Use this display to learn more about the state of the RGA Head, a gauge or an analog
port. This is especially useful if the gauge is in a fault or error condition.
The lowest line in this display shows who last modified the status of the gauge (front
panel user, remote user, etc.).
Pressure Units
The factory default for pressure units is Torr (1 Torr = 1 mm Hg).
Use the [Menu] QuickKey
to display the Main menu. Touch [Units] to choose a
different units system: Torr, micron, bar, mbar, or Pascal.
PPM100 Partial Pressure Monitor
1-26 Pressure Display
Logging
When Logging is enabled (factory default), data from all partial and total pressures and
analog signals are stored in a circular data buffer at a rate specified by a user adjustable
Logging Interval. The logged data for the three sources selected in the Pressure Display
screen can be viewed at any time in the Data Log Display in either table or chart format.
This allows users to switch readily between instantaneous and logged readings for the
measurements of interest.
In order to access the Data Log display, follow these simple steps:
Step 1
Bring up the Pressure Display by touching the [Pressure] QuickKey
.
Step 2
Touch the [Chart] or [Table] QuickKey to display the log in Chart/Table format.
Figure 1-23. Press [Chart] to display the chart of the data log.
Step 3
Touch the [Setup] button to access the Logging Setup menu.
Figure 1-24. Logging Setup menu. Choose between Chart and Table display formats or adjust
Logging Parameters.
Step 4
Select Table or Chart display format. Activate Logging or change the Logging Interval as
required using the menu.
PPM100 Partial Pressure Monitor
MassSpec DIsplay 1-27
MassSpec Display
The MassSpec Display Screen provides a direct and flexible way to display mass spectra
collected by the RGA head directly on the front panel of the PPM100.
From the Monitor Display screen, press the [MassSpec] QuickKey
to access the
Monitor/MassSpec Display. If not already on, press the FILAMENT button to establish
electron emission and activate the display of mass spectra on the front panel.
Figure 1-25. Analog MassSpec screen with factory-default 1 thru 50 amu mass range.
Analog scanning is the most basic operation of the SRS RGA as a quadrupole mass
spectrometer. During analog scanning the quadrupole mass spectrometer is stepped at
fixed mass increments (i.e. 0.1 amu) through a prespecified mass range. The ion current
is measured after each mass-increment step and transmitted to the PPM100 over RS-232.
Analog scanning simplifies the detection of mass peaks for individual component gases,
and provides the most direct view of the peak shapes and resolution of the instrument.
Warning!
All single mass Partial Pressure readings are suspended while the PPM100 displays
MassSpec analog scans. As a consequence, all process control channels must be
set to 'Manual' mode before this display mode may be accessed. Partial pressure
readings resume as soon as the MassSpec display is exited.
Tip
Use the Analog MassSpec Display mode to identify and select single masses during the
Partial Pressure Measurement setup.
Press the E. MULTIPLIER button at any time to activate the electron multiplier detector
during analog scans, and enhance the detection limit of the SRS RGA. Press the
E. MULTIPLIER button again to turn the electron multiplier off and return to Faraday
Cup detection.
Notes
•
The E. MULTIPLIER button has NO function outside of the MassSpec mode.
•
The electron multiplier can only be turned on if the filament is already on and
emitting electrons.
PPM100 Partial Pressure Monitor
1-28 MassSpec Display
•
The electron multiplier is automatically shut down if the filament is turned off in the
middle of an analog scan. This is to protect the electron multiplier from overpressure.
•
The electron multiplier is shut down when the MassSpec Display is exited.
Using the Display
Touch the [M Init] and [M Final] buttons to adjust the mass range of the spectrum. Use
the cursor button to move the vertical cursor and obtain partial pressure information at a
specific mass. Use the left and right arrows to step the cursor in 1 amu increments over
the mass spectrum while displaying the mass and partial pressures of the mass peaks
detected after each step. Use the up and down arrow button to autoscale the vertical axis.
Figure 1-26. Cursor display of Analog MassSpec.
The scan rate and RGA ionization parameters are adjusted through the RGA Setup menu,
which is accessed through the Main Menu. Starting from the Pressure Display, press the
[Menu] QuickKey. Once in the Main Menu, touch the [RGA] button to access the RGA
Setup menu. Use this menu to : (1) adjust ionizer parameters (i.e. electron energy, ion
energy, filament emission and focus voltage), (2) change the noise floor (i.e. scan rate)
for analog scans, and (3) calibrate the detector. Consult Chapter 3 for details on these
menu items.
PPM100 Partial Pressure Monitor
MassSpec DIsplay 1-29
Leak Testing with the PPM100
An RGA can be used as a leak detector to detect helium as well as many other gases. The
preferred method for using an RGA in this application is to mount it directly on the
vacuum chamber and spray helium on the suspect flanges, welds and bellows. If there is a
leak, the helium will enter the system and the RGA will detect its presence inside the
vacuum environment. The PPM100 includes two leak trend displays (silent and audio)
with audible alarms and real-time displays of tracer gas pressure versus time to simplify
leak testing. Since the mass spectrometer is not restricted to helium detection, other tracer
gases can be used as alternatives to helium - neon, oxygen, argon, fluoroform and
krypton are the five most common helium substitutes used in conjunction with RGAs.
The most distinguishing advantage of an in-situ RGA over a conventional helium leak
detector is its ability to detect leaks in real time, and without the need for any specific
tracer gas. The most common problem in vacuum systems is air leaks. A PPM100
connected to an RGA can be set to continuously monitor the mass spectrum of a vacuum
chamber looking specifically for the distinctive 4:1 ratio of nitrogen (mass 28) and
oxygen (mass 32) corresponding to an air leak. An in-situ RGA provides the only way to
detect leaks that only manifest themselves during dynamic processes such as the
actuation of defective sample manipulators, gates or valves.
Because of its ability not only to detect and alert of a leak problem but also to help with
its correction, the RGA is the tool of choice in many high throughput vacuummanufacturing facilities.
The RGA is invaluable for the detection of virtual leaks. Small trapped volumes of gases
such as air, water and machining oils within the inner surfaces of a vacuum system are
virtually impossible to detect without using an RGA to detect AND identify the gases
being released into the vacuum.
RGAs have been used for many years as the preferred sensors for ultrahigh sensitivity
helium leak detectors with leak-rate capabilities extending into the 10-18 std cc/sec (as
required for extreme vacuum applications.) These leak detectors rely on an
adsorption/desorption method to first preconcentrate the leaking gas on a cold surface and
then release the gas quickly by allowing the surface temperature to rise.
Figure 1-27. A common Pressure Display while leak testing. The top data bar provides a leak
trend graph, the middle bar displays the actual leak rate and the bottom bar provides a bargraph
to visualize leaks.
PPM100 Partial Pressure Monitor
1-30 MassSpec Display
PPM100 Partial Pressure Monitor
Proper Grounding 1-31
Proper Grounding Test Procedure
Read the entire Safety and Preparation for Use section of this manual before
starting any installation procedure.
WARNING!
•
Safe operation of any high-voltage, ion-producing vacuum equipment, including the
SRS RGA/PPM100, requires proper grounding of all electronics control units and
vacuum chamber. LETHAL VOLTAGES may be established under certain
operating conditions if proper grounding is not assured.
•
This risk is not specific to the PPM100!
As a rule-of-thumb, all parts of a vacuum system utilized with the SRS RGA/PPM100, or
any similar high voltage product, must be maintained at earth-ground for safe operation.
•
The vacuum chamber should be directly, and explicitly,
connected to a heavy-duty earth-ground (minimum 12 AWG ground lead
wire).
•
All electronic instrumentation must be connected to properly grounded 3-prong
electrical outlets. A chassis grounding lug must also be directly tied
to an earth-ground electrode (minimum 12 AWG wire). Do not connect the
controller’s ground lug to the vacuum system or another component. Connecting the
power cord to a properly grounded outlet is a necessary, but not sufficient grounding
condition with this (or any similar) high voltage producing vacuum equipment.
•
All conductors in, on, or around the vacuum system that are exposed to potential
high voltage electrical discharges must either be shielded at all times to
protect personnel or be permanently connected to the facility’s
earth-ground. Consult an experienced electrician if necessary!!!
•
High-voltage ion-producing equipment such as a hot-cathode ionization gauge or
residual gas analyzer can, under certain circumstances, provide sufficient electrical
conduction via a plasma to couple a high-voltage potential to the vacuum chamber
walls. Any exposed conductive parts of a gauge or vacuum chamber may attain high
voltage potentials through this process if not properly grounded. Grounding the
PPM100 does not and cannot guarantee that other components of the vacuum system
are all maintained at earth ground.
Perform regular electrical ground-tests on your entire vacuum system, particularly if it is
shared by multiple users who often perform custom modifications on the chamber’s
configuration.
PPM100 Partial Pressure Monitor
1-32 Proper Grounding
Ground Test Procedure:
Step 1
Carefully examine your vacuum system:
q
Are all exposed connectors and conductors on the vacuum chamber grounded?
q
Are all ground connections properly connected to a solid earth or facility ground?
q
Beware! Some vacuum systems rely on water piping for the earth-ground connection.
Proper ground connection can be easily lost by inadvertently inserting a plastic
interconnect into the water line.
q
Keep in mind that the use of O-ring seals without metal clamps or bolt connection
can isolate big portions of a vacuum system from its safety ground. Add metal
clamps if necessary.
q
Verify that the vacuum port to which any new component is about to be mounted is
electrically grounded. Use a ground lug on a flange bolt if necessary.
Step 2
With the SRS RGA and PPM100 controllers turned off (but still plugged into an outlet):
q
Test for both AC and DC voltages between the metal parts of the vacuum system and
the controller’s chassis. No voltage differences should be detected.
q
If no voltages are detected, measure resistance between all parts of the vacuum
system, and between the vacuum system and the controller: <2 Ohms assures a
commonality of grounds between the different parts of the vacuum setup and
prevents the development of high voltages between different sections of the vacuum
setup in the presence of a high voltage plasma discharge.
q
If AC or DC voltages exist or more than 2 ohms is detected, professional help is
recommended.
PPM100 Partial Pressure Monitor
2-1
Chapter 2
PPM100 Basics
This chapter describes the basic features and functionality of the PPM100 controller.
In This Chapter
PPM100 Overview
Residual Gas Analysis (RGA100/200/300)
Analog I/O Ports (AN1-4)
Input
Output
Capacitance Manometers (CM1-4)
Data Logging (Charts and Tables)
Pressure Data Displays
Monitor Display
Pressure Display
Pressure Units
On-Screen Help
Backlight Saver
RS-232 Computer Interface
GPIB Interface
USB Interface
Embedded Web Server (Opt. 01)
Process Control
2-3
2-3
2-4
2-5
2-5
2-5
2-6
2-7
2-7
2-7
2-8
2-9
2-9
2-9
2-10
2-10
2-10
2-11
Front Panel
Power
LINE LED
POWER Button and LED
Reset
RGA Controls
FILAMENT Button and LED
E. MULTIPLIER Button and LED
Touchscreen/LCD Display
Touchscreen Cleaning Procedure
Process Control LEDs
Back Panel
2-13
2-13
2-13
2-13
2-14
2-14
2-14
2-14
2-14
2-15
2-15
2-16
±15 V AUX Power Connector
Process Control
Relay Contacts
DIGITAL TTL I/O
RGA RS-232 Connector
HOST RS-232 Connector
Analog I/O
BNC Ports (AN1-4)
2-16
2-17
2-17
2-18
2-20
2-20
2-21
2-21
Maintenance and Service
2-22
PPM100 Partial Pressure Monitor
2-2
PPM100 Basics
PPM100 Partial Pressure Monitor
PPM100 Basics
2-3
PPM100 Overview
WARNING!
•
Read the entire Safety and Preparation for Use section of this manual before
using the PPM100.
•
Read Chapter 1 for detailed instructions and safety information regarding the
installation and connection of the SRS RGA and capacitance manometer gauges.
The PPM100 Partial Pressure Monitor is a fully programmable, microprocessor-based
vacuum system controller.
The PPM100 is a high accuracy controller that measures: (1) partial pressures from an
SRS RGA100/200/300 residual gas analyzer and (2) total pressures from up to four
capacitance manometers, providing uninterrupted pressure readings from 1000 Torr to
UHV. The PPM100 has a touchscreen LCD display, pressure vs. time plots, built-in
relays for vacuum system control and several multipurpose (analog and digital) I/O ports.
RS-232, USB, GPIB and Web (ethernet) interfaces are standard in all controllers.
Four Analog I/O ports, configurable as inputs or outputs, can be independently
programmed to provide: (1) capacitance manometer readings, (2) analog input signal
readings, (3) output voltages linked to partial pressure values, and (4) manual or
software-controlled output voltages.
Controller operation is simple and intuitive via a menu-driven touchscreen user interface.
The screen displays readings in a large, easy-to-read numeric format, as well as in bar
graph and trend formats. Readings are updated twice a second and pressures can be
displayed in several units systems. Data Logging and Pressure vs. Time plots allow you
to follow pump down and venting cycles and keep track of process relay activity, analog
input signals and gauge operations, to within a fraction of a second.
Complete controller specifications are included in the introductory pages of this manual.
This section details the main features of the PPM100.
Residual Gas Analysis (RGA100/200/300)
The PPM100 Partial Pressure Monitor is designed to monitor and control a single SRS
RGA100/200/300 residual gas analyzer within the 10-14 to 10-4 Torr pressure range
supported by the quadrupole-based mass spectrometer. A menu-driven user-interface
allows the PPM100 operator to easily program all required RGA Setup parameters from
the controller’s front panel- i.e. no PC setup is required. Pressure readings are updated at
rates up to 2 Hz.
Warning!
PPM100 is not compatible with third-party residual gas analyzers.
PPM100 Partial Pressure Monitor
2-4
PPM100 Basics
All communications between the PPM100 and the SRS RGA Head take place over a
standard RS-232 serial interface connection. No power is delivered to the RGA Head
from the PPM100 controller.
Up to eight independent partial pressures, can be monitored and simultaneously displayed
on the front panel. Each partial pressure reading can have its own (i.e. individualized) (1)
mass , (2) detector , (3) scan rate and (4) alarm settings. This mode of operation is used to
generate single gas data for leak testing measurements, and to track changes in the
concentrations of up to eight independent components of a gas mixture as a function of
time. The partial pressure signals can also be linked to alarms, process control relays and
digital output ports.
A MassSpec Display mode is also available to graph RGA Mass Spectra directly on the
front panel of the instrument. Analog scanning is the most basic mode of operation of the
SRS RGA as a quadrupole mass spectrometer. During analog scanning the quadrupole
mass spectrometer is stepped at fixed mass increments (i.e. 0.1 amu) through a
prespecified mass range. The ion current is measured after each mass-increment step and
transmitted to the PPM100 over RS-232. Analog scanning simplifies the detection of
mass peaks for individual component gases, and provides the most direct view of the
peak shapes and resolution of the mass spectrometer.
Tip
Use the Analog MassSpec Display mode to identify and select single masses during the
Partial Pressure Measurement setup.
Partial pressure measurement with a residual gas analyzer requires that the filament be
turned on. The PPM100 includes a FILAMENT button on its front panel for manual
activation of partial pressure measurements. Press the E. MULTIPLIER button to activate
the electron multiplier detector during analog scans. Filament emission and electron
multiplier can also be activated remotely through (1) software control, (2) Remote TTL
control, and (3) web-interface (requires Web Interface, Opt. 01). Degassing of the SRS
RGA ionizer can be activated from the PPM100 front panel. Consult Chapter 3 for details
on menu options.
For More Information
Chapter 1 includes all the installation and setup information required to set up your
PPM100 controller and its gauges. Chapter 3 describes, in detail, the menu-based user
interface, including all menus required to configure the PPM100 for operation with an
SRS RGA100/200/300 and (up to four) capacitance manometers.
Analog I/O Ports (AN1-4)
All PPM100 controllers have four analog input/output ports (BNC connectors) on the
back panel. Their range is ±12 V with 14-bit input resolution and 12-bit output resolution.
The update rate is 2 Hz. Each port is individually configured as an input or an output for
complete I/O flexibility.
PPM100 Partial Pressure Monitor
PPM100 Basics
2-5
Input
Input signals (dc voltages) may be displayed on the Pressure or AnalogIO Display
Screens, and monitored remotely through the computer and web interfaces. When Data
Logging is enabled, all analog input voltages are stored in memory as part of the logging
data set.
Use ANALOG I/O ports as inputs to read voltages from additional vacuum equipment
such as capacitance manometers, third-party gauges with analog outputs, mass flow
controllers, turbo pump controllers, etc.
Capacitance manometers must be connected to ANALOG I/O ports configured as inputs,
and CM Display must be set to linear. Direct pressure readings are available only if their
full scale pressure (Pmax) is programmed into the controller (i.e. pressure corresponding
to 10 V output).
Direct pressure display from compact gauges are also possible if (1) Pmax is properly
programmed (i.e. pressure corresponding to 10 V output), (2) CM Display is set to Log
and (3) if the voltage output of the compact gauge is related to the log of the pressurewith a 1V/decade scaling factor.
Output
Analog output levels can be adjusted manually from the front panel, remotely through the
computer interface, or they can be linked to the log of partial pressures PP1-PP8.
Use analog I/O ports as outputs to control auxiliary vacuum equipment such as heaters,
actuators, ion sources, programmable logic controllers and throttle controllers.
For More Information
Consult Chapter 4 of this manual for a complete description of the ANALOG I/O
capabilities of the PPM100, including specifications, connections, possible
configurations, and capacitance manometer operation. Chapter 3 describes, in detail, the
menu-based user interface, including all menus required to configure the PPM100 for
proper operation of its ANALOG I/O ports.
Capacitance Manometers (CM1-4)
The standard PPM100 controller can display pressure as measured from standard
capacitance manometers (CMs). Up to four independent CM readings can be monitored
simultaneously using the four ANALOG I/O ports located on the back of the controller.
Pressure readings are updated at 2 Hz. The PPM100 precisely measures the 0 to 10 Vdc
linear output signal from the CM to determine pressure. Direct pressure readings are
available only if the full scale pressure (Pmax) of the gauge is entered into the controller,
and CM Display is set to Linear. Full-scale ranges up to 1000 Torr are supported by the
controller.
For added convenience, the PPM100 also supplies an auxiliary (AUX) ±15 V, 100 mA
power output. This is usually sufficient to power up a pair of standard (i.e. non-heated)
capacitance manometers.
PPM100 Partial Pressure Monitor
2-6
PPM100 Basics
For critical applications where repeatability, precision, and composition independent
readings are required, a capacitance manometer gauge should be used to monitor and
control the process pressure! This is particularly true if complex or changing gas mixtures
are involved.
For More Information
Chapter 1 includes all the basic information required to install and set up your PPM100
controller and its gauges, including capacitance manometers. Consult Chapter 4 of this
manual for further details on the operation of capacitance manometers and their proper
connection to ANALOG I/O ports. Chapter 3 describes, in detail, the menu-based user
interface, including all menus required to configure the PPM100 to display pressure
readings from capacitance manometer gauges.
Data Logging (Charts and Tables)
All PPM100 controllers include Data Logging capabilities. When Data Logging is
enabled, data from all monitored partial pressures and all analog inputs are stored in a
circular memory buffer at the rate specified by a user-programmable logging interval.
The logged data can be accessed through the touchscreen LCD - the logged data for the
three Data Bars in the Pressure Display screen are presented in a single window. Both
table and chart (P vs. Time) displays are available. The chart display includes convenient
graphical tools such as (1) cursor, (2) zoom, (3) x,y scaling (manual and auto), and
(4) cursor readings. Users can switch rapidly between current and logged readings for the
pressures or analog signals of interest.
The data log can also be accessed remotely through the computer interface, or through
the Internet when using the embedded web server.
The data log can be cleared manually, at any time, from the front panel (use Clear Log),
remotely via the Remote TTL Control Module or via the computer interface.
Typical applications of the Data Logging capabilities include capturing pump-down or
venting curves for vacuum system characterization, monitoring mass flow controller
signals during deposition processes, and monitoring temperatures and other time
dependent variables during bakeouts or heat treatments.
For More Information
Consult Chapter 3 of this manual for detailed information on the Data Logging
capabilities of the PPM100 and Chapter 5 for information on the Remote TTL Control
Module.
PPM100 Partial Pressure Monitor
PPM100 Basics
2-7
Pressure Data Displays
Monitor Display
The Monitor Display Screen provides simultaneous display of up to eight partial pressure
measurements in eight data boxes labeled: PP1 through PP8.
Figure 2-1. The Monitor Display screen with factory default Partial Pressure settings.
Each Partial Pressure Box displays a partial pressure reading along with the mass, gas
name and alarm status for its single mass measurement. Press a data box to access its
Partial Pressure setup menu and modify its single mass measurement parameters.
The Monitor display also provides the only access to: (1) the AnalogIO display screen
([AnalogIO] QuickKey) used to display analog I/O voltages and CM readings, and (2) the
MassSpec screen ([MassSpec] QuickKey) used to display analog mass spectra.
Pressure Display
The Pressure Display Screen provides an additional, convenient and flexible way to
display up to three pressures and voltage signals. It is also the only display mode that
provides access to the Charting (i.e. logging) and Process Control modes of the PPM100
controller.
The Pressure Display Screen can present pressures and analog signals in a variety of
numeric and graphical formats:
Figure 2-2. Pressure display using 3 different data display formats.
PPM100 Partial Pressure Monitor
2-8
PPM100 Basics
Big Numbers
Best for pressure readings. Easily visible across the room.
Trend Graph
A stamp-sized 'P vs. Time' plot of the most recent points. It also includes a small,
instantaneous pressure display next to the plot. Best for trend analysis.
Silent/Audio Leak Trend
A stamp-sized “P vs Time” plot of the most recent points. It also includes a small,
instantaneous pressure display next to the plot. When 'Audio Leak Trend' is selected, an
audio signal whose frequency is proportional to the pressure provides a means to “hear”
pressure transients, eliminating the need to look at the front panel while detecting leaks.
To provide optimum data acquisition rates at the selected mass, all other partial pressure
reading boxes are disabled by this display mode.
Auto Scaling Bar Graph
Three decade logarithmic bargraph display scaled about the current readings.
Full Range Bar Graph
Fifteen decade logarithmic bargraph display, covering the entire useful range of the
instrument (10-15 to 103 Torr). The scale covers the entire range from UHV to atmosphere.
Leak Rate
Calculate and display the Leak Rate based on the partial pressure. Use this for leak
testing.
Status Information
Display additional information about the gauge status. Use this to troubleshoot fault
conditions.
The Pressure Display is also the only screen that provides access to the process control
and chart/logging modes of the PPM100.
For More Information
Consult Chapter 3 for a complete listing of menu items related to data display formats.
Chapter 1 discusses examples of common applications of the different display formats in
its Pressure Measurement section.
Pressure Units
The factory default for pressure units is Torr (1 Torr = 1 mm Hg). Users may choose a
different units system (micron, mbar, bar, and Pascal) in the Main Menu.
For More Information
Consult Chapter 3 for a guide to the menus required to change pressure units.
PPM100 Partial Pressure Monitor
PPM100 Basics
2-9
On-Screen Help
On-screen help is available in all PPM100 controllers. Extensive Help information is
readily available for menus, buttons, displays and even hardware. From any screen where
it is displayed, touch the [Help] button and then any button for which help is required.
For More Information
Touch [Help], then [Help] again, for a complete description of the PPM100 help system.
Backlight Saver
The PPM100 touchscreen LCD is illuminated by a fluorescent lightbulb (physically
located to the side of the screen). Use the Backlight Saver to extend the life of the bulb.
All PPM100 features remain functional while the backlight is off.
When the Backlight saver is enabled, the light turns off when the touchscreen is inactive
for period longer than a user-specified period. Turn-off and turn-on times can also be
programmed into the controller to keep the backlight off overnight.
For More Information
Consult Chapter 3 for menu options related to the Backlight saver capabilities.
RS-232 Computer Interface
The PPM100 controller comes standard with an RS-232 communications port (HOST
RS-232 connector on the back panel). A host computer connected to the instrument can
easily configure, diagnose and operate the PPM100 controller using simple ASCII
commands. An intuitive and complete Remote Command Set facilitates integration of all
controller functions into any processing or diagnostic software.
As an added feature, the RS-232 interface includes a pass-through mode which passes
RGA commands through the PPM100 directly into the SRS RGA head and transmits the
RGA responses back out using communication parameters identical to the RGA head.
Tip
Use the RS-232 pass-through mode to communicate directly with the RGA head through
the PPM100 with a host computer running RGA Windows. Since the PPM100 RS-232
port will be configured identically to the one in the RGA head, RGA Windows operates
as if the host computer were connected directly to the RGA head.
The RS-232 interface is easily configured through the front panel user interface. A
variety of baud rates, byte framing and handshaking options are available. The PPM100
buffers the most recent characters received and transmitted over the communication
interface (RS-232, GPIB, USB and Web). The Queue can be displayed on the front panel
at any time (Queue display mode) simplifying testing and debugging of communication
programs.
Note that the PPM100 is a stand-alone instrument - there is no need to connect the
controller to an external computer to access its full performance and functionality. All
PPM100 Partial Pressure Monitor
2-10 PPM100 Basics
instrument functions and parameters are manually accessible and easily modified through
the front panel.
Computer interfacing is only required for: (1) Computer monitor/control of the PPM100
and vacuum system, (2) Remote access to data-logs and history lists, (3) calibration data
uploads, and (4) firmware upgrades (for controller and web-server).
For More Information
Consult Chapter 6 of this manual for more detailed information on the available computer
interfaces (RS-232, USB and GPIB), programming options and complete command set.
Consult Chapter 3 for information on menu items related to configuration of the RS-232
interface. A complete Command Set is also listed at the beginning of this manual.
GPIB Interface
A GPIB (IEEE-488) interface is standard in the PPM100. The GPIB interface uses the
industry standard 24-pin connector.
The same command set is shared between the RS-232, USB and GPIB interfaces.
For More Information
Consult Chapter 6 of this manual for detailed information on computer interfaces
(RS-232, USB and GPIB), programming options, command set, and firmware upgrade
procedures (controller and web-server). Consult Chapter 3 for information on front panel
configuration of the GPIB interface.
USB Interface
A USB (Universal Serial Bus) interface is standard in the PPM100. The USB port,
located on the back plane of the PPM100, uses the industry standard 4-pin connector.
For More Information
Consult Chapter 6 of this manual for detailed information on computer interfaces
(RS-232, USB and GPIB), programming options, command set, and firmware upgrade
procedures (controller and web-server). Consult Chapter 3 for information on front panel
configuration of the USB interface.
Embedded Web Server
The Embedded Web Server (EWS) connects the PPM100 to the Internet.
The EWS is a TCP/IP compatible web server that resides inside the PPM100 box,
continuously gathering data from the instrument. When connected to an ethernet network
with an internet gateway, the EWS can deliver PPM100 data to a user anywhere on the
world wide web using a standard browser. Users can monitor your vacuum system from
anywhere in the world. E-mail notification can notify a client list of potential or actual
system problems.
The EWS provides the most
PPM100 Partial Pressure Monitor
PPM100 Basics 2-11
convenient way to access PPM100 data from a computer without writing custom serial or
GPIB based software. The EWS can be configured to allow access to process control
functions, so that a user can control their vacuum process from anywhere in the world.
Use the web-interface to monitor your vacuum system from your office or from home
without having to pay periodic visits to your lab while waiting for your system to pump
down. Use the control capabilities to turn heating jackets on/off or activate/deactivate
valves or pumps and gauges from the comfort of your office.
For More Information
The individual functions of the EWS are described in detail in Chapter 7 of this manual.
Consult Chapter 3 for information on menu items related to configuration of the
web-interface.
Process Control
Eight channels of process control are a standard feature in the PPM100 controller.
Each channel has a relay closure output and corresponding opto-isolated TTL output
signal and may be linked to a variety of input sources with intuitive user-programmable
rules. Each channel can be linked to any partial pressure or analog input, the system
clock, gauge status or a TTL input trigger signal. Channel Rules apply in AUTO mode,
and include all variables required for full process automation, including setpoint (level,
polarity and hysteresis), delay settings and audio and front panel notification.
Process Control also includes several opto-isolated TTL level inputs, used to remotely
control filament on/off, degas on/off, Electron Multiplier On/Off, keypad lockout,
datalogging reset and touchscreen enable/disable functions.
Programmable audio alarms and on-screen text messaging alert the user when process
control activity takes place.
During process control, the status of all eight channels can be monitored directly and in
real time on the LCD display. Eight dedicated LEDs located below the screen provide
across-the-room indication of channel status.
Manual override is available for all channels, making it possible to manually control
channel relays and TTL output levels directly from the front panel. Manual relay control
makes it possible to use the PPM100 as a standalone controller capable of manually or
automatically controlling the operation of any standard vacuum system.
All process control events are automatically time stamped and recorded in memory
(Event Log) so they can be reviewed at any time. Use the History button on the Process
Control panel to access the Process Control Event Log at any time.
Why Use Process Control?
One of the best ways to improve process yield and reduce system failure is through
system automation. This is especially important in complex systems or in systems
operated by inexperienced personnel. The process control capabilities of the PPM100
PPM100 Partial Pressure Monitor
2-12 PPM100 Basics
make it unnecessary for the operator to be physically present to open valves and actuate
switches at the proper time. In fact, a PPM100 with an embedded web server provides
remote control capabilities from anywhere in the world.
Use PPM100 Process Control to...
•
Automatically control vacuum components such as valves, heaters, power supplies,
shutters and other process equipment.
•
Interlock process control operations with external signals that are related to time,
pressure, temperature, gauge status, system status, TTL logic levels and other
parameters.
•
Automatically control pumpdown, venting and load-lock procedures.
•
Signal when a process is complete or alert operators to system conditions that require
their attention.
•
Link process control channels together to create powerful system logic to control a
wide variety of functions.
•
Perform repetitive operations.
•
Use e-mail notification to warn operators about possible system problems over the
internet (requires web-interface).
•
Track the throughput of single-gas mass flow controllers, by measuring the partial
pressure of the components they control.
For More Information
Consult Chapter 5 of this manual for detailed connection, configuration and operation
information for PPM100 Process Control. Consult Chapter 3 for information on menu
items related to the configuration and operation of the Process Control module.
PPM100 Partial Pressure Monitor
PPM100 Basics 2-13
Front Panel
All PPM100 functions can be manually configured and controlled through the instrument’s intuitive front
panel graphical interface.
3
2
1
4
Figure 2-3. The PPM100 front panel.
Front panel components can be divided into five categories (see Figure 2-2) which are
described individually in the following sections.
1. Power - LINE LED and POWER button with LED
2. RGA Controls – FILAMENT and E. MULTIPLIER buttons with LEDs
3. Touchscreen/LCD Display
4. Process Control LEDs
Power
LINE LED
The LINE LED (red) lights up to indicate that the PPM100 is connected to, and getting
line power from, an AC outlet.
POWER Button and LED
Press the red POWER button to turn the PPM100 ON or OFF.
The green LED, located next to the POWER button, lights up to indicate that the
PPM100 is fully powered and completely operational.
PPM100 Partial Pressure Monitor
2-14 PPM100 Basics
Reset
To reset the instrument to its default settings, turn the unit on (using the red POWER key)
while holding down the E. MULTIPLIER key. This will erase all user entered
parameters!
RGA Controls
FILAMENT Button and LED
Press the black FILAMENT button to turn the RGA filament emission on or off.
The green LED, located next to the button, lights up while the RGA filament is emitting
electrons and the unit is reading partial pressures or collecting mass spectra from the
RGA Head.
•
Filament emission must be turned on in order to acquire partial pressure readings or
mass spectra with an RGA.
•
The FILAMENT button provides the only means to manually control the emission
status of the RGA.
•
As a general rule, if the RGA electron emission is on, the PPM100 is either collecting
(single mass) partial pressure measurements or performing analog scans. The only
way to interrupt data collection from the RGA Head is by turning off the filament
emission.
Tip
Press the FILAMENT button to interrupt analog scanning at any time and freeze the
MassSpec display. This is convenient for analyzing the spectrum. Press the FILAMENT
button again to resume MassSpec analog scanning.
E. MULTIPLIER Button and LED
Press the black E. MULTIPLIER button to turn the RGA’s electron multiplier on or off
during analog MassSpec scans.
The green LED, located next to the button, lights up while the E. Multiplier is active.
•
The E. MULTIPLIER button is only active during analog scans. Each Partial
Pressure (i.e. single mass) reading has its own individual detector setting.
Touchscreen/LCD Display
The PPM100 has a large backlit, touchscreen /LCD display. The resolution of the display
is 320 x 240 pixels. Screen size is 4.7 in. (diagonal)
The LCD displays an intuitive menu-driven interface for instrument setup and operation.
The pressure display shows large, easy to read, numeric readings from each gauge as well
as bar graphs and trends. Full screen 'Pressure vs. Time' plots are available for all gauges
and analog inputs.
PPM100 Partial Pressure Monitor
PPM100 Basics 2-15
Screen contrast is user adjustable and a screen saver is available to extend the life of the
fluorescent backlight. A touchscreen calibration is available to align the touchscreen with
the LCD display.
Use the Clean Screen menu to desensitize the touchscreen for 20 seconds while cleaning
the touchscreen display.
Touchscreen Cleaning Procedure
For best results, use a clean, non-abrasive cloth towel and a commercial window cleaner
to regularly clean the screen. The cleaning solution should be applied to the towel, not the
surface of the touchscreen. Fluid may seep behind the panel if it is not cleaned properly.
Perform the above procedure while the unit is off, or use the Clean Touchscreen menu,
described in Chapter 3, to temporarily desensitize the touchscreen of a working
instrument.
Process Control LEDs
The green Process Control LEDs are linked to the eight (8) process control channels.
Each LED is associated with a single process control channel and turns on to indicate
when its channel output is ACTIVE. The LEDs are broken into two groups of four to
facilitate visualization and channel identification from across the room.
Process Control channel status information can be quickly accessed on the LCD display
by touching the [Process] QuickKey at any time. However, LEDs make it possible to
view channel activities that might otherwise go undetected and have serious
consequences on the vacuum system.
PPM100 Partial Pressure Monitor
2-16 PPM100 Basics
Back Panel
The back panel of the PPM100 includes all the electrical connectors required to (1) power
and ground the controller, (2) power its gauges, (3) read pressure and analog signals,
(4) connect the process control channels (relays and DIGITAL I/O) and remote TTL
control pins and (5) interface to a host computer and/or the web.
WARNING!
•
Read the entire Safety and Preparation for Use section of this manual before
using the PPM100.
•
Read Chapter 1 for detailed instructions and safety information regarding the
installation of the PPM100 and connection to the RGA Head.
7
6
4
5
3
2
Figure 2-4. The PPM100 back panel.
1
1
1. Power - Power Entry Module and CHASSIS GND.
2. RGA RS-232 - RS-232 connection to RGA Head.
3. HOST RS-232 - RS-232 computer interface port.
4. Capacitance Manometer - ±15 V AUX POWER.
5. Analog I/O - BNC Ports AN1-4
6. Process Control - RELAY CONTACTS and DIGITAL I/O.
7. Computer Interfaces - USB, GPIB, and ethernet 10BASET (Opt 01).
±15 V AUX Power Connector
Use this 3-pin, ±15 V (100 mA max), connector to provide electrical power to standard
(i.e. non-heated) capacitance manometers.
PPM100 Partial Pressure Monitor
PPM100 Basics 2-17
Process Control
Relay Contacts
Use these two 12-Position Terminal Block Plugs to connect to the eight process control
relays. All relays are SPDT, form C, 5A/250VAC/30VDC, resistive load only.
Process Action
INACTIVE
ACTIVE
Relay Common Connected to
Normally Closed pin (NC)
Normally Open pin (NO)
Block 1
Rear Panel Label
I
A
1
Block 2
13 CH5
CH4 12
24 CH8
CH1
Figure 2-5. The 2 12-position terminal blocks for process relay connections.
Block
Pin
Process Channel
Process Control Label
Relay Pin
1
1
2
3
4
5
6
7
8
9
10
11
12
1
Common ( C )
Inactive ( I )
Active ( A )
Common ( C )
Inactive ( I )
Active ( A )
Common ( C )
Inactive ( I )
Active ( A )
Common ( C )
Inactive ( I )
Active ( A )
C
NC
NO
C
NC
NO
C
NC
NO
C
NC
NO
13
14
15
16
17
18
19
20
21
22
23
24
5
Common ( C )
Inactive ( I )
Active ( A )
Common ( C )
Inactive ( I )
Active ( A )
Common ( C )
Inactive ( I )
Active ( A )
Common ( C )
Inactive ( I )
Active ( A )
C
NC
NO
C
NC
NO
C
NC
NO
C
NC
NO
2
2
3
4
6
7
8
PPM100 Partial Pressure Monitor
2-18 PPM100 Basics
DIGITAL TTL I/O
Use the female DB37 port to connect to the (1) eight Process Control TTL Outputs,
(2) eight Process Control TTL inputs and (3) seven Remote Control TTL inputs of the
Process Control Board. A male DB37 connector is provided to facilitate connection to the
controller.
19
1
37
20
Figure 2-6. The PPM100 DB37 TTL I/O connector.
Module
Remote Control
TTL IN
Process Control
TTL OUT
PPM100 Partial Pressure Monitor
Pin
Name
Description
1
PPM100 Vcc
+5 V OUT
2
3
4
5
ANODE COM
Not Used
Not Used
RGA_Degas
External User +5 V IN
6
RGA_FIL_Lockout
7
RGA_Key_Disable
Level:
LOW=RGA emission Off
Level:
LOW=Disable front panel Keypad.
8
9
10
Not Used
Not Used
Clear_Data_Log
11
RGA_Remote_Enable
12
RGA_FIL_On
13
14
Not Used
RGA_FP_Disable
15
PPM100 Vcc
+5 V OUT
16
TTL_OUT_5
17
TTL_OUT_6
18
TTL_OUT_7
19
TTL_OUT_8
TTL OUT for Channel 5.
LOW=ACTIVE
TTL OUT for Channel 6.
LOW=ACTIVE
TTL OUT for Channel 7.
LOW=ACTIVE
TTL OUT for Channel 8.
LOW=ACTIVE
Edge trigger:
↓= Degas On, ↑=Degas Off
Edge trigger:
↓=clear the data log
Level:
HIGH=Ignore RGA_Degas_On,
RGA_FIL_On, RGA_EMULT_On
pins.
Edge trigger:
↓=FIL ON, ↑=FIL Off
Level:
LOW=Disable Touchscreen and
Keypad
PPM100 Basics 2-19
Module
Pin
Name
Description
Process Control
TTL IN
20
21
ANODE COM
TTL_IN_1
22
TTL_IN_2
23
TTL_IN_3
24
TTL_IN_4
25
TTL_IN_5
26
TTL_IN_6
27
TTL_IN_7
28
TTL_IN_8
External User +5 V IN
TTL Input Signal for Channel 1.
Active LOW
TTL Input Signal for Channel 2.
Active LOW
TTL Input Signal for Channel 3.
Active LOW
TTL Input Signal for Channel 4.
Active LOW
TTL Input Signal for Channel 5.
Active LOW
TTL Input Signal for Channel 6.
Active LOW
TTL Input Signal for Channel 7.
Active LOW
TTL Input Signal for Channel 8.
Active LOW
29
30
31
unused
PPM100 Ground
PPM100 Ground
32
33
34
COM_EMTR_REF
COM_COLTR_PULLUP
TTL_OUT_1
35
TTL_OUT_2
36
TTL_OUT_3
37
TTL_OUT_4
Process Control
TTL OUT
External User Ground
External User +5 V IN
TTL OUT for Channel 1.
LOW=ACTIVE
TTL OUT for Channel 2.
LOW=ACTIVE
TTL OUT for Channel 3.
LOW=ACTIVE
TTL OUT for Channel 4.
LOW=ACTIVE
Note: ↓=HIGH-to-LOW, ↑=LOW-to-HIGH transition.
Process Control TTL OUT
These outputs are opto-isolated from the PPM100. For isolated operation of ALL outputs,
connect pin 33 to the external +5 V supply and pin 32 to the external ground. For nonisolated operation of ALL outputs, connect pin 33 to PPM100 Vcc (pin 1 or 15) and pin
32 to PPM100 Ground (pin 30 or 31).
Process Control TTL IN
These inputs are opto-isolated from the PPM100. For isolated operation of ALL Process
Control inputs, connect pins 2 and 20 to the external +5 V supply. Pull inputs to external
ground for low inputs. For non-isolated operation of ALL Process Control inputs, connect
pins 2 and 20 to PPM100 Vcc (pin 1 or 15) and pull inputs to PPM100 Ground (pin 30 or
31) for low inputs.
Remote Control TTL IN
These inputs are opto-isolated from the PPM100. For isolated operation of ALL Remote
Control inputs, connect pins 2 and 20 to the external +5 V supply. Pull inputs to external
ground for low inputs. For non-isolated operation of ALL Remote Control inputs,
PPM100 Partial Pressure Monitor
2-20 PPM100 Basics
connect pins 2 and 20 to PPM100 Vcc (pin 1 or 15) and pull inputs to PPM100 Ground
(pin 30 or 31) for low inputs.
RGA RS-232 Connector
The PPM100 includes a male DB9 connector (RS-232, DTE), labeled RGA RS-232, for
serial communication with the RGA Head.
Pin
Signal
1
2
3
4
5
6
7
8
9
unused
Receive data from RGA
Transmit data to RGA
unused
ground
unused
handshake from PPM
handshake from RGA
unused
Figure 2-7. The PPM100 DB9 RGA RS-232 connector.
HOST RS-232 Connector
The PPM100 includes a female DB9 connector (RS-232, DCE), labeled HOST RS-232,
for serial communication with a host PC computer.
Pin
Signal
1
2
3
4
5
6
7
8
9
unused
Transmit data to Host
Receive data from Host
unused
ground
unused
handshake from Host
handshake from PPM
unused
Figure 2-8. The PPM100 DB9 RGA RS-232 connector.
PPM100 Partial Pressure Monitor
PPM100 Basics 2-21
Analog I/O
BNC Ports (AN1-4)
Use these four BNC ports to input (or output) analog signals into (or out of) the
controller.
All PPM100 controllers have four analog input/output ports (BNC connectors) on the
back panel. The range is ±12 V with 14-bit input resolution and 12-bit output resolution.
The update rate is 2 Hz. Each individual port may be configured as an input or as an
output for complete I/O flexibility.
Inputs
All inputs are logged in the Data Log, along with all pressure readings. These inputs may
be displayed on the Pressure and AnalogIO Displays and are also available in either
Table or Chart mode in the Data Log Display.
When used as inputs, these ports can read the output signals from standard capacitance
manometers. The PPM100 will display the readings as pressures provided the full scale
range (Pmax) of the gauge and CM Display: Linear are programmed into the controller.
Inputs may be linked to Process Control channels to control relays or TTL outputs.
Outputs
All output voltages may be set manually or linked logarithmically to a partial pressure
reading.
When an output port is linked to a partial pressure (PP1 through PP8), the analog output
behaves as follows:
P (Torr) = 10V-14 for 10-13 Torr ≤ P ≤ 10-4 Torr
0V
indicates gauge off
12 V indicates gauge fault
For More Information
Consult Chapter 4 of this manual for a complete description of the Analog I/O
capabilities of the PPM100, including specifications, connections, possible
configurations, and capacitance manometer operation. Chapter 3 all menus required to
configure the PPM100 for proper operation of its Analog I/O ports, including direct
pressure display from capacitance manometers.
PPM100 Partial Pressure Monitor
2-22 PPM100 Basics
Maintenance and Service
1. The PPM100 does not have any user-serviceable parts and requires minimum routine maintenance.
2. Do not perform any unauthorized service, adjustment or modification of the controller.
3. Do not install any substitute parts.
4. Consult the 'Damage Requiring Service' section of this manual for instructions on how to return the
instrument for authorized service and adjustment.
PPM100 Partial Pressure Monitor
3-1
Chapter 3
Displays and Menus
The PPM100 has a menu driven, touchscreen user interface. To activate an on-screen button, simply
touch the LCD display over the button area.
There are 7 main display screens – Pressure, Monitor, AnalogIO, MassSpec, Logging, Process Control
and Menus. These displays are the primary interface to your vacuum system. The Pressure Display
presents three pressures (partial or total) or analog input readings in a large, easy to read format. The
Monitor Display shows up to eight partial pressure readings on a single display panel (including alarm
information). It also provides access to the AnalogIO and MassSpec displays. The AnalogIO display
shows the voltage levels at the analog I/O ports and also up to four capacitance manometer readings. The
MassSpec display is used to graph mass spectra directly on the front panel of the controller. The Logging
Display shows the stored Data Log in Table or Chart format. The Process Control Display shows the state
of the 8 process control channels and relays. The Menu is used to setup various operating parameters of
the PPM100 such as remote interfaces, screen, and time/date settings.
Displays are accessed via the QuickKeys displayed at the bottom of most displays. This allows fast access
to the most critical information in the vacuum system. Within each display, the individual Data Boxes
where the data is presented are also buttons. For example, touch a box in the Monitor Display to
reconfigure a partial pressure data box.
Help for any button or box is available on screen by touching the [Help] QuickKey, then touch any button
or box for help about its function. Touch [done] to exit help.
In This Chapter
QuickKeys
Pressure QuickKey
Menu QuickKey
Monitor QuickKey
AnalogIO QuickKey
MassSpec QuickKey
Process QuickKey
Table/Chart QuickKey
Auto Scale QuickKey
History QuickKey
Overview QuickKey
Back to Previous QuickKey
Help QuickKey
Menu Buttons
Submenu
Choose (multiple choices)
Choose (two choices)
3-5
3-5
3-5
3-5
3-6
3-6
3-6
3-6
3-6
3-7
3-7
3-7
3-7
3-8
3-8
3-8
3-8
Numeric Entry
Text Entry
Action
Time/Date
Text Display
Pressure Display
ID Box
Data Box
Big Numbers
Trend Graph
Silent/Audio Leak Trend
Auto Scaling Bar Graph
Full Range Bar Graph
Leak Rate
Status Information
Info Box
Pressure Units
3-8
3-8
3-8
3-9
3-9
3-10
3-10
3-11
3-11
3-12
3-12
3-13
3-13
3-13
3-13
3-14
3-14
PPM100 Partial Pressure Monitor
3-2
Displays and Menus
Monitor Display
Partial Pressure Data Box
3-15
Time Length of Log
3-33
3-15
Chart Y Axis Menu
3-34
Monitor/Setup Menu
(Partial Pressure Setup Parameters) 3-16
PP1 - PP8 Measurement
PP1 - PP8 Mass (amu)
PP1 - PP8 Correction Factor
PP1 - PP8 Name
Set via library
PP1 - PP8 Scan Rate
PP1 - PP8 Detector
Alarm
3-16
3-17
3-17
3-17
3-17
3-18
3-18
3-18
Alarm Submenu
3-19
PP1 - PP8 Alarm Status
PP1 - PP8 Alarm Level High
PP1 - PP8 Alarm Level Low
Pressure
Alarm Beep
AnalogIO Display
About Capacitance Manometers
Analog Signal Data Box
Capacitance Manometer Data Box
3-19
3-19
3-19
3-19
3-19
3-20
3-20
3-21
3-21
Monitor/AnalogIO/Setup Menu (Analog I/O
and CM measurement setup)
3-23
ADC or DAC
CM Pmax (P@10V)
AN1-4 (CM1-4) Name
DAC Source
Volts When Source=Manual
CM Display
3-23
3-24
3-24
3-25
3-25
3-25
Zero CM Submenu
3-26
MassSpec Display
3-27
Cursor
Moving the Cursor
M Init
M Final
Y Axis
3-28
3-28
3-29
3-29
3-29
Y Axis Submenu
3-29
Pmax
Pmin
3-29
3-29
Logging Display
3-30
Chart
Moving the Cursor
Changing the Graph
Table
3-30
3-30
3-31
3-31
Logging Setup Menu
3-32
Display Format
Logging
Display Date
Logging Interval
TTL Reset Enable
PPM100 Partial Pressure Monitor
3-32
3-32
3-32
3-33
3-33
Pmax Pmin
Vmax Vmin
Autoscale
3-34
3-34
3-34
Chart X Axis Menu
3-35
Chart Time Range
Zoom to Cursor
Scale to Full
3-35
3-35
3-35
Process Control Display
About Process Control
Active vs Inactive
Process Control History
Process Control Overview
Channel Data Box
Auto/Manual Channel Control
Edit Rules Menu
Linked To
Pressure Setpoint
Voltage Setpoint
Setpoint Activation
Percent Hysteresis
Voltage Hysteresis
Delay
Gauge Off/DAC State
Activation Time Deactivation Time
Activate When TTL
Edit Messages Menu
Description
Active Message Inactive Message
Beep
Main Menu
Units
SRS
RGA Menu
3-36
3-36
3-37
3-37
3-37
3-38
3-38
3-39
3-39
3-40
3-40
3-40
3-40
3-41
3-41
3-41
3-41
3-42
3-43
3-43
3-43
3-44
3-45
3-45
3-45
3-46
Electron Energy (eV)
Ion Energy
Focus Voltage (V)
Electron Current (mA)
Scan Rate
Calibrate Electrometer
RGA Info
3-46
3-46
3-46
3-47
3-47
3-47
3-47
Advanced Submenu
3-48
Degas
Ionization Source
RF7 Error Handling
Leak Rate Coefficient
3-48
3-48
3-49
3-49
Utilities Menu
Time/Date
Volume Control
Configuration
3-50
3-50
3-50
3-50
Displays and Menus
Selftest Submenu
3-51
System Selftest
Button & LED Test
Xmit via RS-232
3-51
3-51
3-51
Remote Menu
3-52
System Name
RgaQueue
3-52
3-52
RS-232 Submenu
3-53
Baud Rate
Word Length
Parity
Flow Control
RGA Pass Through
RS-232 Queue
GPIB Submenu
3-53
3-53
3-53
3-53
3-53
3-54
3-54
Address
GPIB Queue
3-54
3-54
Web Submenu
3-55
Web Server
IP-Address
Subnet Mask
DNS
Gateway
Web Queue
Port Number
3-55
3-55
3-55
3-56
3-56
3-56
3-56
Control Submenu
Web Control
Security Type
Password
Trusted IPs
Start Trusted Range End Trusted Range
Trusted IP Address
USB Submenu
3-3
3-57
3-57
3-57
3-58
3-58
3-58
3-58
3-59
USB Queue
3-59
Screen Menu
3-60
Contrast Up Contrast Down
3-60
Clean Touch Screen
3-60
Calibrate Touch Screen
3-61
Test Touch ScreenError! Bookmark not defined.
Backlight Menu
Backlight Saver
Backlight Delay
TurnOff Time Turnon Time
3-62
3-62
3-62
3-63
PPM100 Partial Pressure Monitor
3-4
Displays and Menus
PPM100 Partial Pressure Monitor
QuickKeys
3-5
QuickKeys
Each display includes up to five QuickKeys lined up across the bottom of the screen. The
QuickKeys presented in the main Pressure Display (below) provide fast access to the
most important displays – Menu, Monitor, Process, Table/Chart and Help. Within any of
these other displays, the QuickKeys may provide access to additional display modes. In
each case, use the Pressure or Back QuickKeys to return to the Pressure Display.
Use the Pressure Display as the main starting point in operating the
PPM100.
Figure 3-1. Pressure Display.
Pressure QuickKey
Show the main Pressure Display screen. The Pressure Display has three Horizontal Data
Bars, each displaying a pressure (or analog input). Readings may be displayed in various
formats and are updated twice a second.
The Pressure QuickKey is available in most displays other than the Pressure Display.
Menu QuickKey
Access the PPM100 Menu. Use the Menu to modify important PPM100 and RGA
parameters such as units, communications, clock, touchscreen, backlight, audio, RGA
ionizer settings, etc.
The Menu QuickKey is available only in the Pressure Display.
Monitor QuickKey
Access the Monitor Display. The Monitor Display shows up to eight partial pressure
readings on a single screen including alarm and RGA status information. Touch an
individual Partial Pressure Box (PP1-PP8) to modify its partial pressure measurement
settings.
The Monitor QuickKey is available only in the Pressure display.
PPM100 Partial Pressure Monitor
3-6
QuickKeys
AnalogIO QuickKey
Show the AnalogIO Display. The AN Display consists of: (1) four data boxes for analog
signals (top row, AN1-AN4) and (2) four data boxes for CM readings (bottom row, CM1CM4). Touch an individual data box to modify its measurement parameters and/or the
I/O properties of its port.
The AnalogIO QuickKey is available only in the Monitor display.
MassSpec QuickKey
Access the Analog MassSpec Screen. The Analog Scan Screen provides the only way to
display mass spectra generated by the SRS RGA Head directly on the front panel of the
PPM100.
The MassSpec QuickKey is available only in the Monitor display and only displays
spectra if all process control channels are in a manual state.
Process QuickKey
Show the Process Control Display. The Process Control Display shows the current state
of the eight (8) process control channels. Touch an individual Channel Data Box to
control a channel or modify its configuration.
The Process QuickKey is available only in the Pressure display.
Important
Process Control is performed through an 8-channel Process Control board standard in all
PPM100 controllers. Each channel includes a relay closure output, with corresponding
opto-isolated TTL output. While in AUTO mode, each channel can be linked to any
partial or total pressure reading, any analog input, the system clock, RGA status or a TTL
input trigger signal through user-programmable Rules. The Process Control Display
allows editing of channel Rules and Labels, as well as manual control of all channels.
Table/Chart QuickKey
Display the Data Log in either Table or Chart format. Use the [Setup] button to choose
the Default Display format, Table or Chart, and other data logging parameters.
The Table/Chart QuickKey is available only in the Pressure Display.
All PPM100 controllers include Data Logging. When Data Logging is enabled, data from
the RGA, capacitance manometers and analog inputs are stored in a circular memory
buffer at the rate specified by the programmed logging interval.
Auto Scale QuickKey
Autoscale the Y axis of the graph based on the data currently displayed.
PPM100 Partial Pressure Monitor
QuickKeys
3-7
History QuickKey
Display the Process Control History log.
This key is available only in the Process Control display.
The PPM100 logs all important controller, RGA and process control related events
(manual/auto, de/activation) in a memory buffer. Use the information stored in the log to
track and diagnose system problems.
Important
The History log is preserved if the PPM100 is turned off using the front panel power
button. However, all records are lost if power is removed by unplugging the unit from the
wall .
Overview QuickKey
Display a complete Process Control Overview. Use the Overview to quickly review the
state and rules for all process control channels in a single display screen.
The Overview QuickKey is only displayed in the Process Control display.
Back to Previous QuickKey
Return to the previous menu screen indicated in the button.
Help QuickKey
On-screen Help provides information on the operation of the PPM100. Help information
is available for menus, buttons, displays and hardware.
To display help on an item...
first... touch the Help QuickKey at the bottom-right corner of the screen. The button
becomes highlighted.
next... touch the button or box you wish to learn about. The screen changes to the Help
Display Window and help text is displayed.
then... use the [up] and [down] buttons to scroll through the text. Touch [done] to return
to normal operation.
or...
touch [More] for a list of related topics. Choose a topic in the list to display its
help.
then... use [back] to display previous topics and [forward] to return to later topics.
PPM100 Partial Pressure Monitor
3-8
Menu Buttons
Menu Buttons
The PPM100 uses various types of menu buttons identified by the icon in the upper right
corner.
Submenu
Display a submenu.
Use the submenu to access setup parameters that do not fit (or belong) on
the top menu.
Choose (multiple choices)
Display a multiple choice selection list.
Touch an item from the list to choose it.
Choose (two choices)
Display a two choice selection list.
Touch one of the two items on the list to choose it.
Numeric Entry
Display the numeric entry keypad.
Enter a parameter value using the touchscreen keypad, then touch [accept]
to store it. The parameter valid range and current units are shown in the
numeric entry box. Touch [cancel] to quit entry with no change.
Text Entry
Display the text entry keypad.
Enter a text string using the touchscreen keypad, and touch [ok] to store it.
Touch [abort] to quit entry with no change.
Action
Perform the indicated action.
Touch the button to perform the action indicated. Further instructions may
be presented on the screen.
PPM100 Partial Pressure Monitor
Menu Buttons
3-9
Time/Date
Display the Time/Date entry keypad.
Enter the new time and date and touch [accept] to store the new settings.
Touch [cancel] to quit entry with no change.
The clock is used ...
•
to log pressure readings (data log)
•
to log process control events (process history)
•
to log gauge activity (gauge history)
•
to trigger process control events at specific times.
The clock requires adjustment after daylight savings corrections take place.
Text Display
Display text data.
Touch the button to display text data on the screen. The text display includes
scroll up/down and page up/down buttons.
This button is used to display large amounts of text information, such as
annotated Data Log event entries (Table display format) and PPM100
configuration information (Utilities submenu).
PPM100 Partial Pressure Monitor
3-10 Pressure Display
Pressure Display
Use the Pressure Display as the main starting point in operating the
PPM100. Use the [Pressure] or [Back to Pressure] QuickKeys to bring up
the Pressure Display.
Figure 3-2. Use the [Pressure] QuickKey to bring up the Pressure Display.
This display has three horizontal Data Bars, each displaying a measurement from a preselected source (i.e. RGA, CM or analog signal). Readings may be displayed in various
formats and are updated twice a second.
Customize a Data Bar by touching the ID Box (left), the Data Box (center) or the Info
Box (right).
The QuickKeys presented in the main Pressure Display provide fast access to the most
important displays – Menu, Monitor, Process, Table/Chart and Help. Within any of these
other displays, new QuickKeys may provide access to additional displays. In each case,
use the Pressure or Back QuickKeys to return to the Pressure Display.
ID Box
The ID Box identifies the source of the readings in the Data Bar. The data source can be
the RGA, a capacitance manometer or an analog signal.
Touch the ID Box to display a list of available data sources - partial pressure: PP1-PP8,
capacitance manometer: CM1-CM4 and analog signal: AN1-AN4. Select a data source
for the Data Bar.
PPM100 Partial Pressure Monitor
Pressure Display 3-11
Figure 3-3. Choosing a source for the top data bar.
Important! Even though only three readings can be simultaneously displayed on the
Pressure display, PPM100 constantly monitors and logs ALL analog I/O ports, ALL
enabled partial pressure readings, and ALL enabled capacitance manometer readings..
Data Box
The Data Box displays the readings from the selected source.
Touch the Data Box to choose one of the eight display formats.
Figure 3-4. Choosing a display format for the middle data bar.
Big Numbers
Figure 3-5. Big Numbers data display.
Best display for accurate, easy to view, pressure readings. Easily visible across the room.
PPM100 Partial Pressure Monitor
3-12 Pressure Display
Trend Graph
Figure 3-6. Trend Graph display.
Best display for trend analysis. A stamp-sized 'P vs. Time' plot of the most recent
readings. It also includes a small instantaneous reading next to the plot. Use trend graphs
to see pressure changes in time-dependent processes such as leak testing, pump downs,
venting, bakeout, etc.
Silent/Audio Leak Trend
Figure 3-7. Leak Trend Graph display.
Best display for leak detection applications (see “Leak Testing with the PPM100” in
Chapter 1). Use this display while leak testing components attached to the vacuum
system. Use leak trend graphs to detect leaks as partial pressure transients while spraying
the vacuum system components with a tracer gas such as helium or argon.
A stamp-sized 'Signal vs. time' plot of recent partial pressures for the selected mass is
displayed. A small instantaneous partial pressure reading is also included next to the plot.
When 'Audio Leak Trend' is selected, an audio signal whose frequency is proportional to
the partial pressure readings provides a means to “hear” pressure transients, eliminating
the need to look at the front panel display while searching for leaks.
To provide optimum data acquisition rates at the selected mass, all other partial pressure
readings and displays are disabled while in this display mode. The other Data Bars will
show "LEAKTREND" until a non-LeakTrend display is chosen for this Data Bar.
Warning!
All process control channels must be in manual mode to be able to access the Silent Leak
Test Display mode.
PPM100 Partial Pressure Monitor
Pressure Display 3-13
Auto Scaling Bar Graph
Figure 3-8. Auto Scaling Bar graph.
Best display to detect instantaneous changes in pressure readings. Three decade
logarithmic bargraph display scaled about the current reading. Often used during leak
testing procedures. This display preserves the 'feel' of the old analog needle displays
preferred by some vacuum users.
Full Range Bar Graph
Figure 3-9. Full Range Bar Graph display.
Best display to view the overall status of your vacuum system at any given time. Fifteen
decade logarithmic bargraph display, covering the entire useful range of the instrument
(10-12 to 103 Torr). The scale covers the entire range from UHV to atmosphere.
Leak Rate
Figure 3-10. Full Range Bar Graph display.
Select this option to display leak rates calculated from the partial pressure reading and the
system's user-specified Leak Rate Coefficient.
Leak Rate = Partial Pressure x Leak Rate Coefficient
Status Information
Figure 3-11. Status Information display.
PPM100 Partial Pressure Monitor
3-14 Pressure Display
Use this display to learn more about the state of a data source. This is especially useful if
the gauge is in a fault or error condition.
Info Box
The Info Box shows additional information related to the measurement.
Touch the Info Box to access the Measurement Setup Parameters for the displayed data.
This allows easy access to all setup parameters for the displayed measurement. For
example, touch the Info Box of a PP1 Data Bar to access its partial pressure measurement
setup parameters (i.e. PP1 monitor/setup screen).
The Info Box includes ...
•
•
•
•
•
gas mass (in amu)
gas, gauge or port name
units (pressure or voltage)
CM Display
Analog I/O mode
Pressure Units
The factory default for pressure units is Torr (1 Torr = 1 mm Hg). To change the units of
the Pressure Display, use the Menu QuickKey, then touch [Units] in the menu. Choose a
units system – Torr, micron, bar, mbar, or Pascal. All three Data Bars use the same units
system.
PPM100 Partial Pressure Monitor
Monitor Display 3-15
Monitor Display
Use the [Monitor] or [Back to Monitor] QuickKey to bring up the Monitor Display.
Figure 3-12. Monitor Display.
The Monitor display consists of eight rectangular Partial Pressure Data Boxes (PP1-PP8),
each displaying a single mass partial pressure measurement from the RGA Head. Gas
name, gas mass (in amu), alarm status and important RGA status information are also
included in each box.
Touch a Partial Pressure Box to access its Monitor/Setup menu, and display the Partial
Pressure Setup parameters for that measurement.
Partial Pressure Data Box
Each Partial Pressure Data Box displays a single-mass partial pressure reading
originating from the RGA head (and usually corresponding to the partial pressure
contribution from a single gas to the mixture’s total pressure.)
Each Partial Pressure Data Box contains four lines of information (top to bottom):
•
ID Label: PP1-PP8 source identification labels (shared by both Monitor and Pressure
Displays) and gas mass (amu units).
•
RGA Reading/Status: Partial pressure reading or RGA Head status.
NO DATA is displayed when partial pressure measurements are disabled for the box.
LEAKTREND is displayed if any Data Bar in the Pressure Display is in Silent or
Audio Leak Trend mode.
•
Alarm/ Display Status: Alarm High/Low is displayed (and the controller beeps
intermittently) when measurements and alarms are enabled and a level alarm
condition is met. Disabled is displayed on this line when partial pressure readings are
disabled for this box.
•
Gas name: The name of the gas associated to the single mass being measured is
displayed on this line.
Touch a Partial Pressure Data Box to display its Monitor/Setup menu, and edit its partial
pressure setup parameters.
PPM100 Partial Pressure Monitor
3-16 Monitor Display
Monitor/Setup Menu (Partial Pressure Setup
Parameters)
WARNING!
Read the entire Safety and Preparation for Use section of this manual before
using the PPM100.
Read Chapter 1 for detailed instructions and safety information regarding the installation
and connection of gauges.
Each partial pressure measurement (PP1-PP8) has its own setup menu and measurement
parameters. Access the Monitor/Setup menu of a partial pressure measurement to modify
its Setup Parameters: (1) from the Monitor Display, touch a Partial Pressure Data Box or
(2) from the Pressure Display, touch the Info Box of the corresponding partial pressure
Data Bar.
Figure 3-13. Monitor Setup Menu.
For More Information
Chapter 1 includes all the installation and setup information required to set up your
PPM100 controller and its gauges.
PP1 - PP8 Measurement
Enable or Disable the partial pressure measurement (and display) for the selected partial
pressure data box (or data bar.)
When a partial pressure reading is disabled (i.e. skipped) 'NO DATA' is shown in place
of the partial pressure readings. 'Disabled' is also shown in the partial pressure box in the
Monitor Display.
Tip
PPM100 can display up to 8 independent partial pressures in its Monitor Display screen.
However, not all partial pressure readings need to be enabled at all times. It is sometimes
useful to limit the number of partial pressures continuously monitored and stored by the
PPM100 to increase sampling frequency for the species of interest or to store partial
pressure measurement settings for common gases not present in the current mixture.
PPM100 Partial Pressure Monitor
Monitor Display 3-17
PP1 - PP8 Mass (amu)
Enter the mass, in amu, for the selected partial pressure measurement. The minimum
mass is 1 and the maximum is the mass range of the RGA head (100, 200 or 300).
The SRS RGA head can measure individual peak heights on the mixture’s mass spectrum
at any integer mass within its mass range. Peak height readings (i.e. ion currents) are
transmitted back to the PPM100 and converted into partial pressure readings for the
specified single mass.
Warning
Partial pressure measurements for the channel are disabled if the specified mass exceeds
the mass range of the RGA head.
PP1 - PP8 Correction Factor
Enter a Gas Correction Factor value (0.01 to 100) for the selected partial pressure
measurement.
The SRS RGA head can measure individual peak heights on the mixture’s mass spectrum
at any integer mass within its mass range. Peak height readings (i.e. ion currents) are
transmitted back to the PPM100 and converted into partial pressure readings for the
specified single mass. A single sensitivity factor (calibrated for Nitrogen gas @28 amu)
is used to convert all ion current readings into partial pressures. Use correction factors to
display partial pressure readings for other gases- i.e. the Gas Correction Factor is used to
convert nitrogen-equivalent pressure readings into direct readings for other gases. The
nitrogen-equivalent pressure reading is multiplied by the gas correction factor and
displayed as the partial pressure. Use a value of 1.0 when detecting nitrogen.
PP1 - PP8 Name
Enter the gas name for the selected partial pressure measurement. This name is displayed
in the partial pressure data boxes.
The SRS RGA head can measure individual peak heights on the mixture’s mass spectrum
at any integer mass within its mass range. Peak height readings (i.e. ion currents) are
transmitted back to the PPM100 and converted into partial pressure readings for the
specified single mass. Most often the single mass peak being monitored is associated to a
single-gas, and the partial pressure readings track its contribution to the total pressure of
the mixture.
Set via library
Select a gas name from the list [Hydrogen, Helium, Water, Nitrogen, Oxygen, Argon,
Pump Oil, CO2, Methane, Neon, Krypton].
Pre-loaded [gas name, mass] pairs are available for the most common residual gas
components present in vacuum applications. Select a gas from the list to configure the
partial pressure Name and Mass.
PPM100 Partial Pressure Monitor
3-18 Monitor Display
PP1 - PP8 Scan Rate
Choose a Scan Rate for the selected partial pressure measurement.
The Scan Rate sets the measurement time for the selected partial pressure measurement.
As a rule-of-thumb, a decrease in the Scan Rate setting results in (1) lower baseline noise,
(2) better detection limits but (3) increased measurement time.
The Scan Rate setting is transmitted to the RGA Head prior to each partial pressure
measurement.
Consult the SRS RGA Manual for complete details on the noise floor (NF) setting of the
RGA Head (Scan rate = NF + 1).
PP1 - PP8 Detector
Choose Faraday cup or Electron Multiplier detector for the selected partial pressure
measurement.
Use the Electron Multiplier to increase the RGA’s sensitivity, improve its detection limit
or simply provide faster readings. Limitations associated to the Electron Multiplier are:
limited dynamic range, mass discrimination effects, gain instabilities and finite lifetime
of the device.
Consult the SRS RGA Manual for full details on detector selection criteria.
Alarm
Level alarm warnings can be programmed for each individual partial pressure
measurement.
Alarm control and level settings are modified through the Alarm submenu.
When a Level Alarm is enabled, the PPM100 sounds an audible alarm, and displays an
Alarm prompt in the appropriate partial pressure box, every time: (1) the pressure drops
below the “Alarm level low” or (2) the pressure rises above the “Alarm level high”.
Important!
The alarm levels are independent from, and must not be confused with, the partial
pressure limits used by process control rules. However, process control channels can also
be programmed to activate every time an alarm is tripped for any of the partial pressure
measurements.
Recommendation
Use the Level Alarms to call attention to over/under-pressure conditions while you are
not close to the controller.
PPM100 Partial Pressure Monitor
Monitor Display 3-19
Alarm Submenu
Display the Level Alarm Setup submenu for the selected partial pressure measurement.
PP1 - PP8 Alarm Status
Select level alarms enabled or disabled for the selected partial pressure measurement.
Choose Disabled to interrupt alarm notification and beeping.
Important
Partial Pressure measurement level alarms are independent from, and must not be
confused with, the partial pressure levels that can be associated to process control
channels.
PP1 - PP8 Alarm Level High
Enter a value (1e-14 to 1e+5) for the alarm level high.
When a Level Alarm is enabled, the PPM100 sounds an audible alarm, and displays an
Alarm prompt in the appropriate partial pressure box, every time: (1) the pressure drops
below the “Alarm level low” or (2) the pressure rises above the “Alarm level high”.
PP1 - PP8 Alarm Level Low
Enter a value (1e-14 to 1e+5) for the alarm level low.
When a Level Alarm is enabled, the PPM100 sounds an audible alarm, and displays an
Alarm prompt in the appropriate partial pressure box, every time: (1) the pressure drops
below the “Alarm level low” or (2) the pressure rises above the “Alarm level high”.
Pressure
The current partial pressure reading is displayed for convenience while setting the alarm
levels.
Alarm Beep
Enable or disable the alarm beep. When the alarm is on, a beep is sounded as long as the
alarm condition is satisfied.
PPM100 Partial Pressure Monitor
3-20 Analog I/O Display
AnalogIO Display
WARNING!
Read the entire Safety and Preparation for Use section of this manual before
using the PPM100.
Read Chapter 1 for detailed instructions and safety information regarding the installation
and connection of gauges.
Access the AnalogIO Display from the Monitor Display by touching the AnalogIO
[QuickKey].
Figure 3-14. AnalogIO Display.
The AnalogIO display shows the voltage levels (input or output) at the four analog I/O
ports and also up to four capacitance manometer pressure readings. It consists of two
rows of four data boxes:
(1) Top Row - Analog Signals: AN1-AN4 Boxes
(2) Bottom Row - Capacitance Manometer Readings: CM1-CM4 Boxes
Touch a Data Box to display its Setup menu, and edit its measurement parameters.
About Capacitance Manometers
Capacitance Manometers (CMs), also known as capacitance diaphragm gauges, are the
most accurate devices for measuring absolute and differential pressures of gases and
vapors at the gauge’s operating temperature. CM gauge heads are specified by their full
scale pressure (Pmax). The gauge output is a dc voltage linearly related to the pressure.
By industry standard , the output is 10 Vdc at Pmax. Dynamic range is typically 104.
Most gauge heads require ±15 Vdc (35 mA) to operate. Heated head assemblies require
much higher power, and some models require higher voltages. Consult the gauge manual
for power requirements and maximum pressure specifications. Most manufacturers list
the maximum pressure, power requirements and connector pinouts right on the gauge
body.
The PPM100 has a ±15 Vdc (100 mA) output connector on the back panel to directly
power standard (non-heated) capacitance manometers.
PPM100 Partial Pressure Monitor
Analog I/O Display 3-21
Using capacitance manometers
The PPM100 is designed to read pressures from up to four capacitance manometers. To
read CM pressures, the CM output signal must be connected to one of the four Analog
I/O ports on the back panel. The analog port must be configured as an ADC input in the
Analog I/O Setup menu. The full scale pressure of the CM (Pmax) must be set before
pressure readings are correct. CM Display must be set to Linear to properly scale the
pressure measurements.
CMs need to be periodically re-zeroed. A trim pot is built into most gauge heads for that
purpose. However, if the trim pot is out of reach, use the Zero Manometer function in the
Analog Setup menu.
For More Information
Chapter 1 includes all the basic information required to install and set up your PPM100
controller and its gauges, including capacitance manometers. Consult Chapter 4 of this
manual for further details on the operation of capacitance manometers and their proper
connection to Analog I/O ports.
Analog Signal Data Box
Each Analog Signal Data Box (top row, AN1-AN4) displays a voltage level at an analog
I/O port. For example, AN1 displays the voltage signal (input or output) at the ANALOG
I/O port labeled 1 on the back panel of the PPM100
Each Analog Signal Data Box contains four lines of information (top to bottom):
•
ID Label: AN1-AN4. For example, the AN1 Box displays voltage signals at the
analog I/O port labeled 1 on the back plane of the PPM100.
•
Voltage level: Voltage level (input or output, in Volts) at the port.
•
Port Name: A unique name assigned to the physical port connection by the user.
•
I/O Mode: Each port can be individually configured as input (ADC Input), manual
output (Manual out) or PP1-PP8 linked output (PP1-8 out).
Touch an Analog Signal Data Box to display its Setup menu (Monitor/AnalogIO/Setup,
AN1-4), and edit its measurement setup parameters.
Capacitance Manometer Data Box
When properly configured, each Capacitance Manometer Data Box (bottom row, CM1-4)
can display a total pressure calculated from the analog voltage measured at the
corresponding ANALOG I/O port. For example, CM1 can be used to display CM
Pressures calculated from the voltages measured at the AN1 Analog Port. Capacitance
manometers must be connected to Analog I/O ports configured as inputs. For direct
pressure readings program the full scale pressure (Pmax) and set CM Display to Linear.
Each CM Data Box contains four lines of information (top to bottom):
PPM100 Partial Pressure Monitor
3-22 Analog I/O Display
•
ID Label: CM1-CM4. For example, the CM1 Data Box can display pressures
calculated from the input voltage levels measured at the ANALOG I/O port labeled 1
on the back plane of the PPM100.
•
Pressure reading/DISPLAY OFF/DAC OUTPUT: CM pressures are displayed if the
analog port is set to ADC input, Pmax is properly programmed and CM Display is set
to Linear or Log. DISPLAY OFF replaces the pressure readings if CM Display is set
to OFF. DAC OUTPUT is displayed if the port I/O mode is set to DAC output.
•
Gauge Name: A unique name can be assigned to each CM gauge by the user.
•
CM Display: Linear, Log or Off. Linear is required to assure proper pressure
calculations for Capacitance Manometers. Off indicates that no pressure calculations
are performed from the analog voltages at that ANALOG I/O port. Log indicates that
a logarithmic relationship between voltage and pressure is assumed for the
calculation of pressures for the gauge connected to the port (this extends the use of
the CM Data Boxes to display pressures from compact gauges with logarithmic
pressure outputs).
Touch a Capacitance Manometer Data Box to display its Setup menu
(Monitor/AnalogIO/Setup, AN1-4) and edit its measurement setup parameters.
PPM100 Partial Pressure Monitor
Analog I/O Display 3-23
Monitor/AnalogIO/Setup Menu (Analog I/O and
CM measurement setup)
WARNING!
Read the entire Safety and Preparation for Use section of this manual before
using the PPM100.
Read Chapter 1 for detailed instructions and safety information regarding the installation
and connection of gauges.
Access the Monitor/AnalogIO/Setup menu from (1) the AnalogIO Display (touch an
Analog Signal or Capacitance Manometer Data Box) or (2) from the Pressure Display
(touch the Info Box of an Analog signal or a Capacitance Manometer Data Bar).
Figure 3-15. AnalogIO Setup Menu.
Each analog I/O port (AN1-AN4) and each Capacitance manometer (CM1-CM4) has its
own setup menu. For any given port, both menus share the same settings.
ADC or DAC
Configure the analog I/O port as either an ADC Input or a DAC Output.
ADC Input
When ADC Input is selected, the analog port is connected to a 14 bit, ±12 V full-scale,
Analog-to-Digital Converter updated at 2 Hz. Input signals can be monitored through the
Pressure Display (choose ID: AN1-4 or CM1-4) or the AnalogIO Display (top row).
Inputs may be linked to Process Control channels to control relays or TTL outputs.
All inputs are logged in the Data Log, along with all partial pressure readings.
Use analog inputs to read voltages from additional vacuum equipment such as
capacitance manometers, thermocouples, mass flow controllers, turbo pump controllers,
etc.
PPM100 Partial Pressure Monitor
3-24 Analog I/O Display
Capacitance manometers must be connected to Analog I/O ports configured as inputs.
For direct pressure readings program the full scale pressure (Pmax) to match your gauge
and set CM Display to Linear.
DAC Output
When DAC Output is selected, the analog port is connected to a 12 bit , ±12 V full-scale,
Digital-to-Analog Converter updated at 2 Hz.
Each DAC port may be programmed manually or linked to the log partial pressure
readings, PP1-PP8 (DAC Source). This provides logarithmic analog outputs compatible
with programmable logic controllers and data loggers.
Use analog outputs to control auxiliary vacuum equipment such as heaters, actuators, ion
sources and throttle controllers.
CM Pmax (P@10V)
Enter the full scale range of the capacitance manometer (0-1000 Torr) connected to the
port.
Note
The full scale ranges most commonly encountered in commercial CM gauges are 50 and
100 mTorr, and 1, 2, 10, 100 and 1000 Torr.
Important
Analog I/O ports connected to capacitance manometer signals must be configured as
inputs (ADC Input) for pressure measurement to be possible. Direct pressure readings are
possible only if PMax is programmed into the controller, and CM Display is set to
Linear.
AN1-4 (CM1-4) Name
Enter a unique name for the analog I/O port and the CM Gauge.
The PPM100 assigns a unique name (text string) for each signal port. Location names are
displayed in the ID Box of the Pressure Display and also in the Data Boxes of the
AnalogIO Display. The same name is shared by both the AN and CM Data boxes linked
to a common port.
The default location is the name of the port ("AN1" or “CM1”).
Note
Use the Location name to differentiate between identical gauges in multiple gauge setups.
For example, consider a vacuum system with two identical CM gauges- one connected to
the High Vacuum Chamber (and the AN1 port) and the other one connected to the Rough
Line ( and the AN2 port). In this case, give the gauge connected to AN1 (CM1) the name
"HiVac" and the CM2 gauge the name "Rough". This labels the two readings with
meaningful names.
PPM100 Partial Pressure Monitor
Analog I/O Display 3-25
DAC Source
Link the DAC output to one of the partial pressure readings (PP1-PP8) or choose Manual
for front panel output level control.
The analog outputs may be linked to the log of the partial pressure readings. These
signals are often connected to devices such as programmable logic controllers, throttle
valve controllers, and other common feedback controlled instruments.
When PP1-PP8 is the DAC source, the analog output follows these parameters.
P (Torr) = 10V-14 for 10-14 Torr ≤ P ≤ 10-4 Torr
0V
indicates gauge off
12 V indicates gauge fault
When Manual is the DAC source, the analog output is set with the [Volts when
source=Manual] menu button.
Volts When Source=Manual
Enter the voltage setting for the DAC Output when Source=Manual. The valid range is
±12 V.
Tip
The actual output voltage is measured and displayed in the Analog Signal Data Box
(AnalogIO Display).
CM Display
Select a pressure calculation method for CM pressure readings. The options are: Linear,
Log or Off.
Linear assumes a linear relationship between the pressure and the voltage output of the
gauge. Pmax (P@10V) is the pressure corresponding to 10 Vdc output signal, and is used
to scale all pressure readings for the gauge. This mode must be selected for standard
capacitance manometers with linear outputs.
Log assumes a logarithmic relationship between the pressure and voltage output of the
gauge. Pmax is the pressure corresponding to 10 V output, and a 1V/decade logarithmic
relationship between voltage signal and pressure is assumed over the entire range of the
gauge. This mode is compatible with many standard compact gauges with logarithmic
voltage outputs and 1V/decade scaling.
Off turns pressure calculation off for that port. No CM pressure is displayed in the CM
Data Box. This condition indicated in the fourth line of the CM Data box.
Tip
Use the Log mode to display pressures from compact gauges providing a logarithmic
voltage output signal.
PPM100 Partial Pressure Monitor
3-26 Analog I/O Display
Zero CM Submenu
Adjust the Capacitance Manometer (CM) Zero indication.
Follow the on screen directions to adjust the zero of the capacitance manometer gauge.
Periodic Zero readjustments of the capacitance manometer readings, to compensate
against background drift, are required for operation close to base pressures.
Important
Before making this adjustment, the CM must be connected to a vacuum system with a
pressure lower than 0.01% of full scale (0.0001 x PMax).
Trim Pot Zero Adjustment
All capacitance manometers include a trim pot adjustment, used to adjust the output of
the CM to zero at base pressure. Use the trim pot adjustment regularly to adjust the
internal zero of the capacitance manometer head. The standard trim pot adjustment
procedure is simple:
1. Connect the CM to a vacuum chamber with a pressure <0.01% of PMax
2. Switch the PPM100 to the AnalogIO Display.
3. If necessary, configure the analog port connected to the CM as an ADC input, set its
CM Display to linear and program its Pmax setting to match that of the gauge.
4. Turn the trim pot until the voltage displayed in its Analog Signal Box is zero.
5. Perform a Zero CM operation to adjust the PPM100 zero.
6.
The AnalogIO and CM readings should be zero at the base pressure conditions.
PPM100 Partial Pressure Monitor
MassSpec Display 3-27
MassSpec Display
WARNING!
Read the entire Safety and Preparation for Use section of this manual before
using the PPM100.
Read Chapter 1 for detailed instructions and safety information regarding the installation
and connection of gauges.
Access the MassSpec Display from the Monitor Display by touching the MassSpec
[QuickKey].
Figure 3-16. RGA MassSpec Display.
The MassSpec Display provides the only way to graph mass spectra, generated by the
SRS RGA head, directly on the front panel of the PPM100.
Analog scanning is the most basic operation of the SRS RGA as a quadrupole mass
spectrometer. During analog scanning the quadrupole mass spectrometer is stepped at
fixed mass increments (0.1 amu) through a prespecified mass range. The ion current is
measured after each mass-increment step and transmitted to the PPM100 over RS-232.
Analog scanning simplifies the detection of mass peaks for individual component gases,
and provides a direct view of the peak shapes and resolution of the instrument.
WARNING!
No single mass partial pressure readings take place while the PPM100 is in the MassSpec
Display. As a result, all process control channels must be switched to a safe manual state
before the MassSpec Display can be accessed. Partial pressure readings resume when the
MassSpec Display is exited.
The MassSpec Display Screen consists of four main areas:
1. QuickKeys: Five QuickKeys located on the left side of the MassSpec Display
provide fast access to important analog scan settings– Y Axis scaling, Cursor
Position, Initial Scan Mass , Final Scan Mass, and Back button. Use the Back button
to exit this display.
PPM100 Partial Pressure Monitor
3-28 MassSpec Display
2. Info Box: A small rectangular box located above the mass spectrum graph area,
displays [mass, partial pressure] reading pairs for mass peaks at the current cursor
position and also provides relevant RGA status information.
3. Cursor and AutoScale Buttons: Press
to autoscale the Y axis based on the
currently displayed data. Press
to move the mass spectrum cursor to the left
or right (in 1 amu increments) and find the exact mass position and height of peaks
throughout the spectrum.
4. Mass Spectrum Graph Area: This is the actual area where the mass spectrum is
displayed. The mass range extends from Initial Mass to Final Mass. Logarithmic YAxis scaling takes full advantage of the large dynamic range of the RGA. Pmin and
Pmax are displayed below and above the graph, respectively.
If not already on, press the FILAMENT button to establish electron emission and activate
the acquisition and display of mass spectra.
Press the FILAMENT button again to turn off the filament and stop analog scanning. The
most recent full mass spectrum is preserved on the screen for analysis.
Electron Multiplier
•
Wait for electron emission to be established in the RGA head before pressing the
E. MULTIPLIER button.
•
Press the E. MULTIPLIER button to activate the electron multiplier detector during
analog scans, and improve the detection limit of the SRS RGA.
•
The electron multiplier can only be turned on if the filament is already on and
emitting electrons.
•
The electron multiplier is shut down if the filament is turned off during a scan.
•
The electron multiplier is shutdown when the MassSpec Display is exited.
Tip
Use the Analog MassSpec Display mode to identify and select single masses during the
Partial Pressure Measurement setup.
Cursor
Enter a new destination mass (in amu) for the cursor or track the location of the cursor
while using the left and right cursor arrows.
Moving the Cursor
There are 3 ways to move the cursor:
1. Enter a destination mass with the Cursor button.
2. Move the cursor in 1 amu increments using the left and right cursor arrows.
PPM100 Partial Pressure Monitor
MassSpec Display 3-29
3. Touch and select the Info Box above the graph and then touch the right half of the
spectrum to move the cursor to the right, the left half to move it to the left. Touch
close to the center to move slowly, at the edges to move quickly. Touch and hold to
move continuously.
Every time the cursor is moved to a new position (+/- 1 amu increments), the exact mass
and pressure of maximum amplitude at that position is displayed in the info box. Use this
feature to identify gas species and test the mass axis calibration of the RGA.
M Init
Specify the initial mass value (in amu) for the analog scan.
The lower mass limit for this number is 1 amu. The upper mass limit depends on the SRS
RGA model number: 100 for RGA100, 200 for RGA200 and 300 for RGA300.
M Final
Specify the final mass value (in amu) for the analog scan.
The lower mass limit for this number is 1 amu. The upper mass limit depends on the SRS
RGA model number: 100 for RGA100, 200 for RGA200 and 300 for RGA300.
Y Axis
Logarithmic scaling of the mass spectra Y Axis in the MassSpec Display takes full
advantage of the RGAs dynamic range.
Touch the Y Axis [QuickKey] in the MassSpec Display to access the Y Axis SubMenu.
Note
A new analog scan is triggered when exiting the Y Axis SubMenu.
Y Axis Submenu
Display the Y Axis submenu for the MassSpec Display.
Pmax
Set the pressure corresponding to the top of the mass spectrum.
Pmax is displayed above the mass spectrum graph area
Pmin
Set the pressure corresponding to the bottom of the mass spectrum.
Pmin is displayed below the mass spectrum graph area
PPM100 Partial Pressure Monitor
3-30 Logging Display
Logging Display
Use the [Table] or [Chart] QuickKey to bring up the Logging Display. The data log is
presented in either Table or Chart display formats. Select the format in the Logging Setup
menu. This also changes the QuickKey between [Table] and [Chart].
The logged data for the three data bars in the Pressure Display are displayed in a single
screen. All inputs are logged – to display different data, choose new sources in the
Pressure Display (ID Boxes).
Chart
Figure 3-17. Chart Display.
Display the data log in graphical (P or V vs. Time) format.
The small table above the chart displays the most recent entry and the readings at the
cursor position.
Pmax and Vmax are displayed above the graph, Pmin and Vmin below the graph.
The right edge is the most recent data point and the left edge is a Time Range ago. This
resembles a chart recorder with new data appearing at the right edge. The X axis scale,
span and logging interval are shown at the very bottom of the screen.
Touch [Setup] to display the Logging Setup menu. Touch [Y Axis] or [X Axis] to change
the chart scales and time scale.
Moving the Cursor
To move the cursor, first touch the cursor readout above the graph (it highlights with a
box). Touch the right half of the chart to move the cursor to the right, the left half to
move it to the left. Touch close to the center to move slowly, farther from center to move
quickly. Touch and hold to move continuously.
PPM100 Partial Pressure Monitor
Logging Display 3-31
Changing the Graph
The chart scale parameters can be modified within the chart display. To adjust the graph
scales, first touch the displayed scale parameter (it highlights with a box). For Pmax,
Pmin, Vmax and Vmin, touch the upper half of the chart to adjust the parameter up, the
lower half to adjust the parameter down. For the Time Range, touch the left half of the
chart to increase the range, the right half to decrease the range. In both cases, touch close
to the center to make small changes, farther from center for large changes.
Touch [Y Axis] or [X Axis] to change the chart scales and time range numerically. Touch
[Setup] to display the Logging Setup menu.
Table
Figure 3-18. Table Display.
Column 1:
The absolute time (and date) at which the readings were logged.
Columns 2, 3, 4: Pressure or voltage readings from the three Data Bars of the Pressure
Display.
Use the up and down buttons to scroll through the entire log. Touch [Setup] to display the
Logging Setup menu.
PPM100 Partial Pressure Monitor
3-32 Logging Display
Logging Setup Menu
Touch [Setup] in either the Table or Chart Display to show the Logging Setup menu.
Figure 3-19. Logging Setup Menu.
Display Format
Select the log display format (Table or Chart). This also changes between the [Table] and
[Chart] QuickKeys.
Important
The PPM100 always stores readings from all enabled data sources in the data log.
However, the chart and table only show data from the three measurements shown in the
Pressure Display. To display other measurements, change sources in the ID Boxes of the
Pressure Display.
Logging
Enable data logging (Log) or disable data logging (Pause).
Display Date
Enable or Disable the Date Display in the Table format.
Enabled means that the date will be included in the time stamp in the Table format
display. This requires more lines per entry and fewer entries will be shown per page.
Disabled means that the date will not be included in the time stamp.
Enable this to keep track of the date through data logs that extend over more than one
day.
PPM100 Partial Pressure Monitor
Logging Display 3-33
Logging Interval
Enter the Logging Interval.
The Logging Interval is the time between data log entries. For example, a 5 minute
setting indicates that a complete set of pressure and analog input readings are added to
the data log every 5 minutes.
The Logging Interval affects the time length of the log. The data log stores a fixed
number of entries, thus the Time Length of the data log and the Logging Interval are
directly related. Use a small Logging Interval to record closely timed data points over a
short period of time. Use a large Logging Interval to record data over a long period of
time.
TTL Reset Enable
Enable or Disable data logging TTL Time Reset.
Enabled allows the Data Logging Time Reset input of the remote TTL control module to
reset the data log.
Enable this to synchronize the start of the data log with an external event, such as the
closing of a gate, the opening of a valve or the achievement of full speed in a turbo pump.
Disabled means that the Data Logging Reset input of the TTL control module does not
have any effect on the data log.
Time Length of Log
This box displays the Time Length of the data log. This parameter can not be entered
directly. The data log stores a fixed number of entries, thus the Time Length is
determined by the Logging Interval.
The Time Length is the length of time covered by the data log. After this amount of time,
the earliest data in the log will be overwritten by the newest data.
PPM100 Partial Pressure Monitor
3-34 Logging Display
Chart Y Axis Menu
This button is only available from the Chart display.
Pmax
Pmin
Set the pressure corresponding to the top and bottom of the chart.
Note
All pressure readings are displayed with the same chart scale. The grid lines correspond
to the values of Pmax and Pmin.
Vmax
Vmin
Set the voltage corresponding to the top and bottom of the chart.
Note
Voltage data from the analog I/O inputs is graphed according to Vmax and Vmin.
However, the grid lines correspond to the values of Pmax and Pmin.
Autoscale
Autoscale the graph based on the data displayed in the graph.
This changes the values of Pmax, Pmin (and Vmax, Vmin) to use the entire vertical space
of the chart display.
PPM100 Partial Pressure Monitor
Logging Display 3-35
Chart X Axis Menu
This button is only available from the Chart display.
Chart Time Range
Set the time span of the chart.
The right edge of the chart is the most recent point, the left edge is a Time Range ago.
The data moves across the chart as newer points are recorded, resembling a chart
recorder.
Zoom to Cursor
Set the left edge of the chart to the cursor position. The right edge remains the most
recent point.
Scale to Full
Set the Time Range to display all data points.
PPM100 Partial Pressure Monitor
3-36 Process Control Display
Process Control Display
Use the [Process] or [Back to Process] QuickKey to bring up the Process Control
Display.
Figure 3-20. Process Display.
This display consists of eight rectangular Channel Data Boxes, each displaying state and
mode information for a single process control channel. This display allows fast access to
the state and configuration of all process control channels.
Touch a Channel Data Box to choose a channel state (Active, Inactive or Auto) or edit
the channel rules and messages.
The 8 dedicated LEDs below the touchscreen provide across-the-room indication of
channel output status (On = Active).
WARNING!
Using process control channels in your vacuum system requires careful programming and
thorough testing. Double check all logic and wiring and use manual activation to test the
action of each and every channel. Test all scenarios in a safe manner before relying on
automatic, unattended operation.
About Process Control
The Process Control module provides eight channels of process control. Each channel has
a relay closure output, with corresponding opto-isolated TTL signal, that may be linked
to a variety of input sources with intuitive user-programmable rules. Channel rules
include all variables required for full process automation, including input source
selection, activation threshold (level, polarity and hysteresis), delay settings and audio
and text notification. The available input sources include any partial pressure or analog
input, the system clock, RGA status or a TTL input trigger signal.
This option also includes 7 opto-isolated TTL level inputs for triggering
RGA_Remote_Enable, RGA_Filament on/off, RGA_Degas on/off, RGA_Fil_lockout,
RGA_Keypad_Lockout, datalog reset and touchscreen enable/disable.
PPM100 Partial Pressure Monitor
Process Control Display 3-37
During process control, the output status of all eight channels can be monitored directly
from the Process Control Display or remotely via the computer or web interfaces. In
addition, the 8 dedicated LEDs below the touchscreen provide across-the-room indication
of channel status.
Manual override is available for all channels, making it possible to control channel relays
and TTL output levels directly from the front panel.
With its Process control module, the PPM100 can operate as a stand alone controller,
capable of manual or automatic operation of any standard vacuum system.
All process control events are time stamped and recorded to be reviewed at any time. The
process control log is also accessible remotely through the computer or web interfaces.
Active vs Inactive
When a process control channel is ACTIVE, the corresponding relay is powered,
connecting the Common and Active (N.O.) relay pins, and the TTL output pin is logic
low. INACTIVE means that the relay is unpowered, connecting the Common and
Inactive (N.C.) relay pins, and the TTL output pin is logic high.
When a process control channel is in Auto mode, it becomes Active when the conditions
specified by its rule’s parameters are met. Rule parameters include setpoint, hysteresis,
polarity (above or below), and delay.
Manual control of the channel output is also possible.
Process Control History
All process control events (channels active/inactive/auto) and some RGA related events
are time stamped and logged in the Process/History log. Touch the [History] QuickKey to
display the contents of the process control event log.
Each line of the log is a change in either State or Mode of a process channel. For state
changes (Active/Inactive), the bitfield shows the state of all channels (1=Active,
0=Inactive) starting with channel 1. For mode changes (Auto/Manual), the bitfield shows
the mode of all channels (1=Auto, 0=Manual) starting with channel 1.
Important
History event logs are preserved if the unit is turned off using the front panel power
switch. However, all records are lost if power is removed by unplugging the unit from the
wall.
Process Control Overview
Touch the [Overview] QuickKey to obtain a complete summary report of status and
configuration information (including Rules) for all channels in a single screen.
PPM100 Partial Pressure Monitor
3-38 Process Control Display
Channel Data Box
A Process Control Data Box displays the state (Active/Inactive), mode (Auto/Manual)
and message for a single process control channel. Touch the Data Box to access the
channel’s rules and messages or to manually control its output.
Each Data Box contains four lines of information (top to bottom):
•
Channel Number and Description.
•
Channel Active/Inactive Message.
•
Output status (Active or Inactive).
•
Mode (Manual override or Auto).
Touch a Channel Data Box and choose an option to:
•
Switch to Auto mode (channel controlled by its Rules).
•
Deactivate the channel (manual override).
•
•
Activate the channel (manual override).
Edit the channel's Rules (for Auto mode).
•
Edit the channel's Messages.
Auto/Manual Channel Control
To control a channel state manually, touch a Channel Data Box and choose 'Active' or
'Inactive'.
To switch a channel to Auto mode (controlled by its Rules), touch a Channel Data Box
and choose 'Auto'.
Figure 3-21. Manual Channel control.
Tip
All process channels must be set to a safe manual state, either Active or Inactive, prior to:
•
accessing the MassSpec Display
•
•
•
calibrating the RGA electrometer
degassing the RGA
changing the Silent/Audio Leak Trend mode in the Monitor Display
PPM100 Partial Pressure Monitor
Process Control Display 3-39
Edit Rules Menu
Access the Edit Rules menu from the Process Control Display (touch a Channel Data
Box) and choose 'Edit Rules'.
Figure 3-22. Edit Rules Menu.
Each process channel has its own rules. These rules determine the channel state when the
channel is in Auto mode.
Linked To
A process control channel can be linked to
•
any partial pressure (PP1-8) or capacitance manometer (CM1-4)
- specify the pressure setpoint, hysteresis, delay and polarity
•
any analog input port (AN1-4)
– specify the voltage setpoint, hysteresis, delay and polarity
•
the partial pressure monitor alarm notification system (ALARM)
– specify the delay
•
the system clock (CLOCK)
– specify the activation and deactivation times
•
its corresponding TTL channel input (TTL PIN)
– specify the polarity and delay
For example, select PP1 to link the channel state to the PP1 partial pressure readings from
the SRS RGA Head.
Select ALARM to link a process control channel to the alarm notification system. This
process control channel becomes active if ANY partial pressure monitor alarm is tripped.
Use this as a fail safe rule, to activate the channel if any partial pressure goes beyond
acceptable limits.
PPM100 Partial Pressure Monitor
3-40 Process Control Display
Pressure Setpoint
Enter the channel Pressure Setpoint (Torr) when the Channel Source is an RGA partial
pressure measurement or capacitance manometer gauge (PP1-8 or CM1-4).
The Pressure Setpoint is the pressure threshold at which the channel becomes Active or
Inactive. Set the Setpoint Activation to choose Active above or below this threshold. The
Setpoint determines the exact level at which channel switching occurs. Use the channel
Delay to ignore acceptable pressure transients.
Voltage Setpoint
Enter the channel Voltage Setpoint (Volts) when the Channel Source is an analog input
(AD1-4).
The Voltage Setpoint is the voltage threshold at which the channel becomes Active or
Inactive. Set the Setpoint Activation to choose Active above or below this threshold. The
Setpoint determines the exact levels at which channel switching occurs. Use the Setpoint
Delay to ignore transient voltages.
Setpoint Activation
Select the Setpoint Activation for the channel (Above or Below).
Above
The channel becomes ACTIVE when the pressure, or voltage, goes ABOVE the Setpoint.
The channel becomes INACTIVE when
the pressure goes BELOW {Setpoint / (1+Hysteresis_%/100)}
or
the input voltage goes BELOW {Setpoint – Hysteresis_V}.
Below
The channel becomes ACTIVE when the pressure, or voltage, goes BELOW the
Setpoint.
The channel becomes INACTIVE when
the pressure goes ABOVE {Setpoint x (1+Hysteresis_%/100)}
or
the input voltage goes ABOVE {Setpoint + Hysteresis_V}.
Percent Hysteresis
Enter the Percent Hysteresis for the channel (0 to 999 %). Percent Hysteresis applies
when the channel is linked to a pressure reading (PP1-8 or CM1-4). See 'Setpoint
Activation' above for more information.
PPM100 Partial Pressure Monitor
Process Control Display 3-41
Hysteresis allows the process control channel to ignore normal, slow variations or drift in
the readings. Use the Delay setting to ignore transient events.
Voltage Hysteresis
Enter the Voltage Hysteresis for the channel (0-12V). Voltage Hysteresis applies when
the channel is linked to an analog input (AN1-4). See 'Setpoint Activation' above for
more information.
Hysteresis allows the process control channel to ignore normal, slow variations or drift in
the readings. Use the Delay setting to ignore transient events.
Delay
Enter the Setpoint Delay time.
The Setpoint Delay is the amount of time that a channel switching condition must be
present before channel switching actually takes place.
Use the Setpoint Delay in systems known to experience brief pressure or voltage
transients during normal operation. The addition of the delay eliminates unnecessary
channel switching.
Gauge Off/DAC State
Specify the channel state (Active or Inactive) when the pressure gauge is turned off,
disconnected or in a fault condition (RGA) or when the analog input port is overloaded or
(accidentally) switched into DAC Output mode (while linked to CM or AnalogIO).
For Channel Sources PP1-8, specify the desired channel state when the filament emission
is turned off or a fault exists (no pressure readings available) or the measurement is
disabled.
For Channel Sources CM1-4, specify the desired channel state when its Analog I/O port
is switched to DAC Output mode or the input is overloaded (no pressure readings
available), or the CM Display is set to Off.
For Channel Sources AN1-4, specify the desired channel state when port is switched to
DAC Output mode or the input is overloaded (no voltage readings available).
Activation Time
Deactivation Time
Enter the Channel Activation/Deactivation Time when the Channel Source is Clock.
The Activation Time is the exact time at which the channel switches to ACTIVE.
The Deactivation Time is the exact time at which the channel switches to INACTIVE.
PPM100 Partial Pressure Monitor
3-42 Process Control Display
All times are represented in 24hr format (18:30 is 6:30pm). The current time is displayed
at the top of the screen in most displays.
Use the clock to control scheduled operations such as overnight system bakeouts. The
channel Activation Time can start unattended system bakeout an hour after everybody
leaves. Use the channel Deactivation Time to stop the bakeout, and allow the system to
cool down, three hours before arriving in the morning.
Activate When TTL
Select the TTL Activation mode (High or Low).
Each channel has a dedicated TTL input pin (see Chapter 5). When the Channel Source is
TTL, the level of this input controls the channel.
Activate When High means the channel is ACTIVE when the TTL input level is HIGH
(and INACTIVE when LOW).
Activate When Low means the channel is ACTIVE when the TTL input level is LOW
(and INACTIVE when HIGH).
PPM100 Partial Pressure Monitor
Process Control Display 3-43
Edit Messages Menu
Access the Edit Messages menu from the Process Control Display (touch a Channel Data
Box) and choose 'Edit Messages'.
Figure 3-23. Edit Channel Messages Menu.
Each process channel has its own description and messages shown in the Channel Data
Boxes. The messages are updated whenever the channel changes state.
Description
Enter a Channel Description.
The PPM100 assigns a Description (text string) to each process control channel. The
Description is displayed at the top of each Channel Data Box (next to the channel #).
Assign Description to all channels used for process control. Descriptions such as
"heater", or "gate valve" make it easier to visualize and control a system and minimize
the chances of errors.
Recommendations
Combine Descriptions and Active/Inactive Messages to provide useful information about
the status of your system. For example, for a channel controlling a gate valve (ACTIVE =
valve open), use "gate valve" as the Description, "open" for the Active Message and
"closed" for the Inactive Message. The Channel Data Box would then display
"gate valve/open" or "gate valve/closed" depending on the state of the channel.
Active Message
Inactive Message
Enter the channel Messages.
The Active Message is displayed in the Channel Data Box whenever the channel is
ACTIVE. The Inactive Message is displayed whenever the channel is INACTIVE.
PPM100 Partial Pressure Monitor
3-44 Process Control Display
Recommendations
Combine Descriptions and Active/Inactive Messages to provide useful information about
the status of your system. For example, for a channel controlling a gate valve (ACTIVE =
valve open), use "gate valve" as the Description, "open" for the Active Message and
"closed" for the Inactive Message. The Channel Data Box would then read "gate valve /
open" or "gate valve / closed" depending on the state of the channel.
Beep
Enable the Channel Beep (On or Off).
On means that a beep is sounded every time the channel changes states.
Off means that no beep is sounded.
PPM100 Partial Pressure Monitor
Main Menu 3-45
Main Menu
Use the [Menu] or [Back to Main] QuickKey to bring up the Main Menu. This menu can
only be accessed from the Pressure Display.
Figure 3-24. Main Menu.
The Main Menu provides access to many important PPM100 internal parameters and
settings.
Units
Display the Units selection list.
Select from Torr, Micron, Bar, mbar or Pascal.
This units system is global to the PPM100. All pressure readings in the Pressure Display
and data logs use the same units. All pressure parameters in menus use these units.
This button is also available in the numeric entry keypad of pressure parameters.
SRS
Display contact information about Stanford Research Systems, Inc.
PPM100 Partial Pressure Monitor
3-46 RGA Menu
RGA Menu
Touch [RGA] in the Main Menu to display and/or modify the RGA Setup parameters.
Figure 3-25. Main/RGA menu.
The RGA Setup menu includes all ionizer and detector settings required to configure the
RGA head, as well as some advanced settings for specialized applications of RGAs.
The ionizer settings are used by all partial pressure and scanning measurement modes of
the PPM100/RGA system.
Important
The detector settings are only used by the Analog Scanning mode (MassSpec Display)
since partial pressure readings have individualized detector settings.
Electron Energy (eV)
Adjust the electron impact ionization energy of the ionizer. The parameter represents the
desired electron ionization energy in units of eV. The available range is 25 to 105 eV.
The default value is 70 eV.
Ion Energy
Adjust the ion energy to one of two possible settings: Low (8 eV) or High (12 eV).
The default value is High (12 eV).
Focus Voltage (V)
Adjust the focus plate voltage. The available range is 0 to 150 V.
The default value is 90 V.
Note
Careful adjustment of the focus voltage results in optimum coupling of the ion beam into
the quadrupole mass filter and maximum sensitivity.
PPM100 Partial Pressure Monitor
RGA Menu 3-47
Electron Current (mA)
Adjust the electron emission current in the ionizer. This parameter represents the desired
electron emission current in units of mA.
The available range is 0 to 3.5 mA.
The default value is 1.0 mA.
Scan Rate
Adjust the detector’s scan rate for analog scanning.
The available range is 1 to 8 (integers only).
The default is 3.
The scan rate parameter represents the desired averaging for the detection and defines the
scanning rate and detection limit for mass measurements during analog scans. The scan
rate setting is used to set the noise floor (NF) of the RGA during analog scanning
(Scan Rate = NF + 1).
In general, smaller scan rates result in reduced background noise, increased signal to
noise ratios, improved detection limits and slower scan updates.
Calibrate Electrometer
Perform a complete recalibration of the RGA's electrometer response.
A complete electrometer calibration takes approximately one minute and cannot be
interrupted. A count-down timer shows the calibration progress.
The electrometer is designed for maximum long-term stability, however, it is good
practice to recalibrate it periodically, particularly in the presence of a large change in the
operating temperature or humidity around the RGA Head.
Note
No partial pressure readings can take place while electrometer calibration is in progress.
Hence, all process control channels must be switched to a safe manual state before
electrometer calibration may be performed.
RGA Info
Display a complete report of all important calibration and timing parameters stored in the
RGA head, including error byte values. Use this display to query the RGA head during
diagnostic procedures. Have this information handy when contacting SRS for support.
PPM100 Partial Pressure Monitor
3-48 RGA Menu
Advanced Submenu
Display the RGA/Advanced submenu.
Figure 3-26. Main/RGA/Advanced menu.
Degas
Touch this button to Degas the RGA ionizer by heating and electron stimulated
desorption. The Degas time is 3 minutes and a count-down timer shows the progress.
Note
•
The filament must already be turned on before degas may be initiated.
•
Press the abort button to stop the degas process early.
•
No partial pressure readings can take place while RGA degas is in progress. Hence,
all process control channels must be switched to a safe manual state before degas
may be performed.
Ionization Source
Use this button to select where the ions are formed.
Select RGA Filament to allow partial pressure measurements and analog scanning only if
filament emission is present.
Select External to allow partial pressure measurement and analog scanning even in the
absence of filament emission.
Tip
Select External if you wish to use the RGA to monitor ions originating somewhere other
than the ionizer region, or from an ionization method different from electron impact.
PPM100 Partial Pressure Monitor
RGA Menu 3-49
RF7 Error Handling
Select Ignore to ignore RF7 Errors reported by the RGA head.
Select Warn to acknowledge RF7 error reports and prevent the RGA from operating
under conditions where unreliable measurements are possible.
Tip
Select Ignore for RGA300 models where RF7 errors are common while the unit is
warming up. Consult the RGA’s Operating Manual for details on the
causes/troubleshooting of RF7 error reports.
Leak Rate Coefficient
Enter a Leak Rate Coefficient for your system. The range is 1 to 3000 and the default is
50.
The Leak Rate Coefficient is used by the PPM100 to calculate and display leak rates (i.e.
gas throughput) from partial pressures in the Pressure Display (choose Leak Rate for the
data bars).
Leak Rate = (Partial Pressure) x (Leak Rate Coefficient)
Tip
The Leak Rate Coefficient is often interpreted as the effective pumping speed of the
vacuum system for the single gas being measured. For example: If helium is the gas
being measured during leak testing and the effective pumping speed of the vacuum
system for He is 50 L/sec, a partial pressure of 10-10 Torr of He would be displayed as a
leak rate of 5x10⁻⁹ Torr·L·s-1 into the vacuum system. This value is displayed directly in
the Pressure Display if the Data Bar for helium is set to Leak Rate.
PPM100 Partial Pressure Monitor
3-50 Utilities Menu
Utilities Menu
Touch [Utilities] in the Main menu to display the Utilities menu.
Figure 3-27. Main/Utilities menu.
Time/Date
Adjust the time and date settings of the PPM100.
The clock is used to ...
•
log pressure and voltage readings (data log).
•
log process control events (process history).
•
to trigger process control events at specific times.
All times are represented in 24hr format (18:30 is 6:30pm). The current time is displayed
at the top of the screen in most displays.
The clock requires adjustment after daylight savings corrections take place.
Volume Control
Adjust the speaker volume (0 to 10).
The PPM100 speaker is used for different purposes, such as user interface feedback,
alarm sounding (during process control and over/under pressure events), or audio leak
testing.
Configuration
Display the Configuration Report.
The Configuration Report shows a complete listing of all internal modules detected when
the unit was turned on.
PPM100 Partial Pressure Monitor
Utilities Menu 3-51
Selftest Submenu
Display the Selftest menu.
System Selftest
Touch this button to perform the power-on test again. This also displays the firmware
version and date.
Button & LED Test
Touch this button to test the BLACK hardware keys, the 8 process LEDS and the 2 RGA
LEDS.
Xmit via RS-232
Transmit the string "SRS PPM100" over the RS-232 interface.
Tip
Use this button to test your RS-232 connection and settings.
PPM100 Partial Pressure Monitor
3-52 Remote Menu
Remote Menu
Touch [Remote] in the Main menu to display the Remote menu.
Figure 3-28. Main/Remote menu.
System Name
Enter a system name for this PPM100.
The system name identifies this unit over the remote interfaces. In addition, the name is
displayed on all web pages served by this unit.
RgaQueue
Display the RGA RS-232 transmit and receive buffers. The PPM100 buffers the most
recent characters received and transmitted over the RGA RS-232 interface, and
corresponding to all communications between the PPM100 controller and RGA Head.
The Queue display shows the interface history.
The Queue display may slow down communications and should be displayed only when
testing or debugging a host program.
Press any QuickKey (other than Help) to exit from this display.
The lower half of the Remote Queue display is the Transmit Queue. These are the most
recent commands which have been placed in the output buffer.
The upper half of the Remote Queue display is the Receive Queue. These are the most
recent characters which have been received by the PPM100 (displayed in UPPER case)
and transmitted from the RGA Head. The RGA sends back both ASCII text and binary
characters (not printable as text) . The PPM100 user needs to see both to be able to
interpret/debug the responses from the RGA head. Each character from the RGA is
actually displayed as a three characters set: First the character is displayed (we show a
dot if unprintable), this is followed by the two-digit hex representation for it. For
example, the sequence “.00.00.00.00” is four bytes of zeros, and the sequence
“R52G47A41” is the 3-letter string "RGA" (all upper case, and printable).
PPM100 Partial Pressure Monitor
Remote Menu 3-53
RS-232 Submenu
Display the RS-232 configuration menu for the HOST RS-232 interface port..
Baud Rate
Select the RS-232 (Serial) interface Baud Rate [300 – 115.2k].
The available baudrates are: 300, 1200, 2400, 9600, 19200, 28800, 38400, 57600 and
115200.
Word Length
Select the RS-232 (Serial) interface Word Length [7 bits, 8 bits]. 8 bits is standard.
Parity
Select the RS-232 (Serial) interface Parity [None, Even, Odd]. None is standard.
Flow Control
Select the RS-232 (Serial) interface Flow Control [None, Xon/Xoff, Hardware].
None is standard. At high baud rates (>19200), flow control may be necessary to prevent
data loss. Check the host serial interface for the type of flow control in use.
RGA Pass Through
Select Pass Through RGA to activate the RS-232 Pass Through Mode of the PPM100.
Select Normal Operation (default) to exit the Pass Through Mode and resume normal
PPM100 operation.
While in Pass Through Mode, the PPM100 RS-232 interface passes all data from the host
computer directly to the RGA head and all data from the RGA head is passed directly
back to the host computer. The PPM100 RS-232 port uses serial communication
parameters identical to the RGA head, not the parameters previously set in this menu.
WARNINGS!
•
All PPM100 Partial Pressure and analog MassSpec measurements are suspended
while in the Pass Through Mode.
•
All RS-232 communication parameters must be manually restored when the PPM100
is switched back to Normal Operation.
•
No partial pressure readings are performed by the PPM100 while in Pass Through
Mode. All process control channels must be set to a safe manual state before Pass
Through mode is chosen.
PPM100 Partial Pressure Monitor
3-54 Remote Menu
Tips
•
Pass Through Mode is indicated by the 'P/T' RGA connection icon in the upper right
portion of the screen.
•
Use the Pass Through Mode to communicate with directly with the RGA head,
through the PPM100, with a host computer running RGA Windows. In this case,
RGA Windows operates as if the host were connected directly to the RGA head.
RS-232 Queue
Display the transmit and receive buffers for the PPM100 HOST RS-232 port. The
PPM100 buffers the most recent characters received and transmitted over the interface.
The Queue display shows the interface history.
The Queue display may slow down communications and should be displayed only when
testing or debugging a host program.
Press a QuickKey to exit from this display.
The upper half of the Remote Queue display is the Receive Queue. These are the most
recent characters which have been received by the PPM100 (displayed in UPPER case).
Commands which have already been executed are shown in normal text. Commands
which have not yet been executed are shown with a gray background. Command errors
are shown in inverse text.
The lower half of the Remote Queue display is the Transmit Queue. These are the most
recent characters which have been placed in the output buffer. Characters which have
already been sent over the interface are shown in normal text. Characters which are
waiting to be sent are shown with a gray background.
GPIB Submenu
Display the GPIB (IEEE-488) configuration menu.
This menu also includes a Rx/Tx display button which shows receive/transmit activity on
the GPIB port.
Address
Set the PPM100 Device Address.
Before attempting to communicate with the PPM100 over the GPIB interface, the
PPM100’s device address must be set.
GPIB Queue
Display the GPIB transmit and receive buffers. The PPM100 buffers the most recent
characters received and transmitted over the interface. The Queue display shows the
interface history.
PPM100 Partial Pressure Monitor
Remote Menu 3-55
The Queue display may slow down communications and should be displayed only when
testing or debugging a host program.
Press any QuickKey (other than Help) to exit from this display.
The upper half of the Remote Queue display is the Receive Queue. These are the most
recent characters which have been received by the PPM100 (displayed in UPPER case).
Commands which have already been executed are shown in normal text. Commands
which have not yet been executed are shown with a gray background. Command errors
are shown in inverse text.
The lower half of the Remote Queue display is the Transmit Queue. These are the most
recent characters which have been placed in the output buffer. Characters which have
already been sent over the interface are shown in normal text. Characters which are
waiting to be sent are shown with a gray background.
Web Submenu
Display the Web server configuration menu.
The parameters in this menu must be entered in order to use the web interface. See
Chapter 7 'Embedded Web Server' for step-by-step information on configuring the
PPM100 for the internet.
Web Server
Enable or Disable the web server.
Important!
Use the web security measures in the Web/Control menu to prevent unauthorized control
of the PPM100 via the web. Disable the server to prevent ALL web access to the
PPM100.
IP-Address
Enter the IP Address for the PPM100 web server.
Obtain a valid IP Address from your network administrator. Entering invalid addresses
may disrupt your network.
When accessing the PPM100 from your browser, enter this IP address in the address box
to display the web pages. Make a 'favorite' to provide one click access.
Subnet Mask
Enter the Subnet Mask for the network. Obtain the appropriate Subnet Mask from your
network administrator.
PPM100 Partial Pressure Monitor
3-56 Remote Menu
DNS
Enter a DNS Address for the PPM100 web server.
Obtain a valid Domain Name Server (DNS) Address from your network administrator.
The DNS is used by the web server's e-mail notification feature. The DNS allows e-mail
addresses to be entered using full domain names.
Gateway
Enter a Gateway Address for the PPM100 web server.
Obtain a valid Gateway Address from your network administrator. The Gateway is used
by the web server's e-mail notification feature.
Web Queue
Display the web transmit and receive buffers. The PPM100 buffers the most recent
characters received and transmitted over the interface. The Queue display shows the
interface history.
Press any QuickKey (other than Help) to exit from this display.
The upper half of the Remote Queue display is the Receive Queue. These are the most
recent characters which have been received by the PPM100. The lower half of the
Remote Queue display is the Transmit Queue. These are the most recent characters which
have been placed in the output buffer. As long as the web server is enabled and
functioning properly, there will be continuous traffic on this queue.
Port Number
Change the HTTP port number of the web server. The default port is 80 and should NOT
be changed except in the following situations.
1. You are using multiple PPM100's in a network behind a NAT (network address
translation) router. In this case, all of the PPM100's will appear at the same IP
address to the outside world (they will have different IP addresses on the local
network). Each PPM100 needs to be on a different port and the router must be
configured to forward port requests to the correct PPM100. From the outside, each
PPM100 is accessed at its own port number (but the same IP address).
2. If you are experiencing attacks on port 80 that block access to the PPM100. In this
case, change the port to something else (like 8080). You will need to specify this port
in your browser address window as 208.123.123.32:8080 where 208.123.123.32 is
the IP address of the PPM100 and 8080 is the port number.
For more information about NAT routers and ports, see your network administrator.
Wait at least 30 seconds after changing the port number for the change to take effect.
PPM100 Partial Pressure Monitor
Remote Menu 3-57
Control Submenu
Display the Web/Control submenu.
The web server can disallow any user from controlling the PPM100 via the web. In this
case, only monitoring is allowed from the web.
If web control is required, there are two types of security. Password security requires the
user to enter the password from their browser and Trusted IP allows control only to those
IP addresses entered in this menu. Both types can be used together.
See Chapter 7 'Embedded Web Server' for more information on configuring the PPM100
for the internet.
Web Control
Enable or Disable web control of the PPM100.
Disabled prevents any user from controlling the PPM100 via the web. In this case, only
monitoring is allowed on the web. This provides the most security but only allows
monitoring.
Enabled allows both monitoring and control of the PPM100.
Important
There are two types of security. Password security requires the user to enter the password
from their browser and IP Checking allows access only to those IP addresses entered in
this menu. Both types can used together. The PPM100 requires the use of at least one
type of security.
Security Type
Choose the type of web security (Password, IP Checking or Both)
Password requires the entry of the Web Password from the user's browser before
accessing any PPM100 web pages.
IP Checking only allows computers with trusted IP's to access the web server. Only users
with static IP addresses can use this feature. Do not use this if you use a dial-up account
or DHCP account to access the internet. These accounts have dynamic (i.e. temporary)
addresses.
Both requires the password AND a trusted IP address checking before web access to
PPM100 is allowed.
The default is Both. Change this setting to Password when using a dial-up connection.
PPM100 Partial Pressure Monitor
3-58 Remote Menu
Password
Enter a password for web access.
When accessing the PPM100 web server from your browser, it will ask for this password
before any pages will be displayed.
Trusted IPs
Enter trusted IP addresses. When IP Checking security is enabled, the web server only
allows access to those IP addresses entered in this menu.
A trusted range of IP addresses allows all users on a local network (or subnet) to access
the web server. Use this in a laboratory environment where groups of computers and
users are on a single subnet.
Enter individual IP addresses for remote users with static IP addresses outside the trusted
range.
IP Checking can not be used with users who have dial-up accounts. These accounts do
not have a static, or permanent, IP address.
Start Trusted Range
End Trusted Range
Enter the Start and End of the Trusted IP Range.
Trusted IP Address
Enter individual Trusted IP addresses. Up to four individual addresses can be stored in
the controller.
PPM100 Partial Pressure Monitor
Remote Menu 3-59
USB Submenu
Display the USB (Universal Serial Bus) submenu.
Queue
Display the USB transmit and receive buffers. The PPM100 buffers the most recent
characters received and transmitted over the interface. The Queue display shows the
interface history.
The Queue display may slow down communications and should be displayed only when
testing or debugging a host program.
Press a QuickKey to exit from this display.
The upper half of the Remote Queue display is the Receive Queue. These are the most
recent characters which have been received by the PPM100 (displayed in UPPER case).
Commands which have already been executed are shown in normal text. Commands
which have not yet been executed are shown with a gray background. Command errors
are shown in inverse text.
The lower half of the Remote Queue display is the Transmit Queue. These are the most
recent characters which have been placed in the output buffer. Characters which have
already been sent over the interface are shown in normal text. Characters which are
waiting to be sent are shown with a gray background.
PPM100 Partial Pressure Monitor
3-60 Screen Menu
Screen Menu
Touch [Screen] in the Main menu to display the Screen menu.
Figure 3-29. Main/Screen menu.
Contrast Up
Contrast Down
Adjust the screen contrast according to your viewing needs.
Clean Touch Screen
Display the Touchscreen Cleaning display with countdown timer. This allows the user to
clean the screen without turning the power off.
The cleaning display has no touch sensitive areas and can be wiped clean without
changing any instrument settings. The touchscreen should be cleaned according to the
procedure below and only while the Touchscreen Cleaning display is on (or the unit is
off). The timer indicates the time remaining before returning to the menu.
Cleaning procedure
For best results, use a clean, non-abrasive cloth towel and a commercial window cleaner
to regularly clean the screen. The cleaning solution should be applied to the towel, NOT
the surface of the touchscreen. Fluid may seep behind the panel if it is not cleaned
properly.
WARNINGS
Do not operate the touchscreen with the tips of pens or sharp objects that might
permanently stain or damage the screen surface.
The surface of the touchscreen should be kept free of dirt, dust, fingerprints and other
materials that could degrade its optical properties. Long term contact with abrasive
materials will scratch the front surface and harm image quality.
PPM100 Partial Pressure Monitor
Screen Menu 3-61
Calibrate Touch Screen
Display the Touchscreen Calibration window.
If there is consistent misalignment between the LCD buttons and their touchsensitive
areas, follow this calibration procedure to realign the LCD and touchscreen.
Tip
Use the eraser on the end of a pencil to touch the screen. This ensures the best alignment
of the LCD and the touchscreen.
PPM100 Partial Pressure Monitor
3-62 Backlight Menu
Backlight Menu
Display the Backlight saver submenu.
Figure 3-30. Main/Backlight menu.
The PPM100 has a back-lit LCD display. Backlighting is supplied by a fluorescent tube.
Use the Backlight Saver feature to extend its useful lifetime by automatically turning it
off after hours. Using the Backlight Saver can double the lifetime of the fluorescent tube.
All PPM100 controller functions remain functional while the backlight is off.
Backlight Saver
Select the Backlight Saver mode (Enabled or Disabled).
Disabled means that the backlight will never be turned off.
Enabled means that, between the Turnoff and Turnon times, the display backlight will
turn off if the touchscreen is inactive for a period longer than the Backlight Delay. All
PPM100 controller functions remain functional while the backlight is off.
Important
Touch the LCD screen to restart the backlight.
Recommendation
Use the Backlight Saver to extend the life of the screen’s backlight. Enable the backlight
saver mode and program the on/off/delay times to shut off the light overnight.
Backlight Delay
Enter the Backlight Delay time.
If the Backlight Saver is enabled and the time of day is between the Turnoff and Turnon
times, then the display backlight turns off if the touchscreen is inactive for the Backlight
Delay time.
PPM100 Partial Pressure Monitor
Backlight Menu 3-63
TurnOff Time
Turnon Time
Enter the backlight Turnoff/Turnon Time.
If the Backlight Saver is enabled and the time of day is between the Turnoff and Turnon
times, then the display backlight turns off if the touchscreen is inactive for the Backlight
Delay time.
Recommendation
Set the Turnoff time to the time at which you leave the lab at night. Set the Turnon time
to just before you return in the morning. There is no need to keep the light on when
nobody is looking at the screen.
PPM100 Partial Pressure Monitor
3-64 Backlight Menu
PPM100 Partial Pressure Monitor
4-1
Chapter 4
Analog Input/Output Ports
This chapter includes a complete description of the Analog I/O capabilities of the PPM100, including
specifications, connections, possible configurations, and capacitance manometer operation.
In This Chapter
Analog I/O Ports (AN1-AN4)
Connection
Configuration
Analog Inputs
Analog Outputs
4-3
4-3
4-4
4-5
4-5
Capacitance Manometers (CM1-CM4) 4-6
Basics
CM Connection
Tips For Using CMs
4-6
4-7
4-7
Compact Gauges
4-8
PPM100 Partial Pressure Monitor
4-2
Analog I/O Ports
PPM100 Partial Pressure Monitor
Analog I/O Ports
4-3
Analog I/O Ports (AN1-AN4)
All PPM100 controllers have four analog input/output ports (BNC connectors) on the
back panel. Each port can be individually configured as an input or an output from the
front panel or through the computer interface.
The specifications are identical for the four ports
Range
Input resolution
Input Impedance
Output resolution
Output impedance
Update Rate
±12 V
14 bits
1.2 MΩ
12 bits
100 Ω
2 Hz
Connection
The four Analog I/O ports are located on the back panel of the PPM100 and are easily
identified as the vertical row of four BNC connectors, labeled ANALOG I/O 1 through 4.
Figure 4-1. Rear panel Analog I/O ports.
The BNC connectors are wired in the standard fashion, with the center pin connected to
the signal (input or output) and outer shield connected to the signal return (ground).
PPM100 Partial Pressure Monitor
4-4
Analog I/O Ports
Configuration
Each individual Analog I/O port may be programmed to perform one of many possible
functions. To configure a port, touch the [Monitor] QuickKey to bring up the Monitor
Display. Once in the Monitor Display, touch the [AnalogIO] QuickKey to access the
AnalogIO Display. Touch an analog port Data Box (AN1-AN4) to display the Analog
Port’s Setup menu.
Figure 4-2. Analog I/O Port Setup.
The first, and most important, configuration option is selection of I/O mode, ADC Input
(Analog to Digital Converter) or DAC Output (Digital to Analog Converter).
For each analog port connected to a capacitance manometer, CM Pmax must be
programmed to the full scale range of the gauge and CM Display must be set to Linear,
for CM pressure readings to be properly calculated and displayed in the bottom row of
the AnalogIO Display.
For compact gauges, with DC voltage outputs related to the log of the pressure, Pmax
must be programmed to the pressure corresponding to 10V output, and CM Display must
be set to Log. A 1V/decade relationship between voltage and pressure is assumed over
the entire useful pressure range of the gauge.
The level of a DAC output can be set manually (Volts When Source=Manual) or
remotely (through the computer interface), or may be linked to the log partial pressure
PP1-PP8 (DAC Source).
The PPM100 allows you to assign a descriptive Location name (text string) to each
analog port and each capacitance manometer reading. Locations are displayed in the Info
Box of the Pressure Display screen, and in the AnalogIO and CM Data Boxes of the
AnalogIO Display. This makes it easy to identify the signal source.
For More Information
The menus used for Analog I/O port configuration are described in detail in the Gauges
Display section of Chapter 3.
PPM100 Partial Pressure Monitor
Analog I/O Ports
4-5
Analog Inputs
When an analog port is configured as an ADC Input, its signal levels (dc voltage or CM
pressure) can be displayed on the front panel (Pressure and AnalogIO Display Screens)
and/or monitored remotely through the computer and/or web interfaces.
When Data Logging is enabled, all analog input voltages are stored in memory as part of
the data log.
Voltage levels beyond the ±12V range display the message 'OVERLOAD'.
Process Control Channels can be linked to ADC Input ports. Channel activation takes
place above or below a user specified input signal level. For example, use the amplified
voltage readings from a thermocouple gauge to prevent overheating of your sample
during inductive heating.
Recommendation
Use Analog I/O ports as inputs to read voltages from additional vacuum equipment such
as capacitance manometers, thermocouples, mass flow controllers, turbo pump
controllers, throttle valve controllers, etc.
For More Information
Consult the Process Control Display section in Chapter 3 of this manual for information
on how to link process control channels to analog input ports.
Analog Outputs
The level of a DAC output can be set manually (Volts When Source=Manual) or
remotely (through the computer interface), or may be linked to the log partial pressure
PP1-PP8 (DAC Source).
When PP1-PP8 is the DAC source, the analog output follows these parameters.
P (Torr) = 10V-14 for 10-13 Torr ≤ P ≤ 10-4 Torr
0V
indicates gauge off
12 V indicates gauge fault
Recommendation
Use analog outputs to control auxiliary vacuum equipment such as heaters, actuators, ion
sources and throttle controllers. Connect analog output signals to Programmable Logic
Controllers to perform sophisticated process control.
PPM100 Partial Pressure Monitor
4-6
Analog I/O Ports
Capacitance Manometers (CM1-CM4)
Basics
Capacitance manometers (CMs) are very accurate devices for measuring both absolute
and differential pressures. They measure all gases and materials that are vapors at the
gauge's operating temperature. Gauge heads are specified by their full scale range, Pmax
(10,000 Torr - 0.1 Torr), and have a dynamic range of approximately 4 decades. The
standard output is a dc analog voltage, independent of the gas, linear with pressure, and
equal to 10 V at Pmax. Gauge volume is small, and response is fast. Capacitance
manometers commonly offer accuracies of 0.25%, while high-accuracy products can
offer 0.08%. Capacitance manometers are so accurate that gauge-head temperature
variation is a critical source of error. The long-term accuracy of capacitance manometers
(better than 1%) justifies their use as secondary standards and transfer gauges.
For critical applications where repeatability, precision, and composition independent
readings are required, a capacitance manometer gauge should be used to monitor and
control the process pressure! This is particularly true if complex or changing gas mixtures
are involved.
Note
Capacitance manometers may be ordered from several commercial sources. Gauge heads
can be purchased with two ports for differential measurements, or with an evacuated
reference side for absolute pressure measurements.
Heated capacitance manometers, maintained at temperatures above ambient, are used
extensively in chemical processes, gas handling systems, and semiconductor processing
systems operating under two sets of conditions:
1. ambient temperature undergoes large fluctuations
2. system contains vapors that would otherwise condense on the sensor
Heated CMs are used in measuring pressures found in (1) chemical processes containing
water vapor and organic materials that boil at modest temperatures, and
(2) semiconductor manufacturing processes, particularly aluminum etching where AlCl3
vapor exists.
When heated sensor heads are used, the temperature of the sensor usually is greater than
that of the chamber whose pressure is to be measured. The pressure reading will be a few
percent high under some conditions due to an effect known as thermal transpiration.
For More Information
For additional information on CMs and the thermal transpiration effect consult :
1. "Foundations of Vacuum Science and Technology", Ed. J. M. Lafferty, John Wiley
and Sons, NY, 1998, p. 384.
2. R. W. Hyland and R. L. Shaffer, "Recommended Practices for the Calibration and
Use of Capacitance Diaphragm gauges as transfer standards", J. Vac. Sci. Technol. A
9 (1991) 2843.
PPM100 Partial Pressure Monitor
Analog I/O Ports
4-7
CM Connection
The standard PPM100 controller can display pressures measured from standard
capacitance manometers (CMs). Up to four independent CM readings can be monitored
simultaneously using the four Analog I/O ports. Pressure readings are updated at 2 Hz.
The PPM100 precisely measures the 0 to 10 Vdc linear output signal from the CM to
determine pressure. Direct pressure readings are accurate only if the full scale range
(PMax) of the gauge is programmed, and CM Display is set to Linear in the controller.
Full-scale ranges up to 1000 Torr are supported by the controller. Simultaneous display
of voltage and pressure levels in the AnalogIO display provides a convenient way to
check proper configuration of the CM measurements.
An 'OVERLOAD' message is displayed when the output signal from the CM exceeds
12 V.
For added convenience, the PPM100 also supplies an auxiliary ±15 Vdc/100 mA power
output. This power is usually sufficient to operate a pair of standard (i.e. non-heated)
capacitance manometers.
For More Information
Chapter 1 includes all the basic information required to install and set up your PPM100
controller and its gauges, including capacitance manometers. Chapter 3 describes, in
detail, all menus required to configure the IPPM100 to display pressure readings from
capacitance manometer gauges.
Tips For Using CMs
1. Avoid overpressurizing the gauge head. Use pressure relief and isolation valves
whenever required. Alway vent pressure safely. If working with toxic gases, vent to a
hood or approved outlet. Never vent toxic gas to the room air.
2. Maintain a stable temperature around non-heated gauges.
3. Allow long warm up times for heated gauge heads. Consult manufacturer’s
recommendations.
4. Avoid contamination and particulate buildup inside the gauge since that could affect
diaphragm motion. Some gauge designs offer special features to avoid such buildup.
5. Avoid mechanical vibrations.
6. Eliminate any chances of mechanical stress to the gauges. Use bellows if necessary.
7. Recalibrate frequently. Rezero often.
PPM100 Partial Pressure Monitor
4-8
Analog I/O Ports
Compact Gauges
Compact Gauges are becoming increasingly popular in vacuum applications and share some standard
characteristics: (1) the measurement and control electronics are integrated into a small package (mounted
directly on the gauge head), (2) a modest DC power supply is required to operate the gauge and its
electronics, and (3) pressure data is directly read via an output voltage proportional to the pressure. In its
most popular implementation, the voltage output is related to the log of the pressure and the typical
scaling factor is 1V/decade of pressure (Torr).
Most compact gauges can be connected directly to the ANALOG I/O ports of the PPM100. The controller
includes a logarithmic scaling mode for the CM pressure calculations which makes it possible to display
compact gauge pressures directly on its front panel. A 1V/decade relationship between voltage output and
pressure is the only requirement for compatibility. To implement this pressure display mode: (1) program
Pmax to the pressure corresponding to a 10V gauge output signal, (2) set CM display=Log. The pressure
readings are displayed in the CM Data box (or Data Bar) associated to the analog port connected to the
gauge.
It is also common for Compact Gauges to bracket their useful pressure related output between 2 and
10Vdc. Voltages below 1V indicate a Gauge Off Condition and voltages greater than 10V indicate a Fault
condition. These conditions are detected (by Default) by the PPM 100 when CM Display=Log is selected.
Consult the manufacturer’s power requirements for the compact gauge. It is often possible to use the +/15Vdc auxiliary output provided by the PPM100 to power compact gauges as well as capacitance
manometers.
PPM100 Partial Pressure Monitor
5-1
Chapter 5
Process Control
This chapter provides the basic guidelines required to successfully interface and program the automation
features built into the Process Control module of the PPM100 controller.
In This Chapter
Process Control Warnings
5-3
Why Use Process Control?
5-4
Process Control Basics
5-5
ACTIVE vs INACTIVE
ACTIVE
INACTIVE
Power-On State
Programming Rules
Manual Override
Fail-Safe Logic
Relay Connections
Connection Basics
Connection Schemes
Active-Common
Inactive-Common
Active-Common-Inactive
Connection Tips
Channel Linking
Remote Operation
5-6
5-6
5-6
5-6
5-6
5-7
5-8
5-11
5-12
5-12
5-12
5-13
5-13
5-14
5-15
5-16
Digital I/O Module
TTL Input (8 pins)
TTL Output (8 pins)
Remote Control Input (7 pins)
Digital I/O Connections
TTL I/O Pin Assignments
Output Circuit
Connection Tips
Debounce Time
Remote Control Inputs
RGA_Degas
RGA_FIL_Lockout
RGA_Key_Disable
Clear_Data_Log
RGA_Remote_Enable
RGA_Fil_On
RGA_FP_Disable
5-17
5-17
5-17
5-17
5-18
5-18
5-20
5-21
5-21
5-22
5-22
5-22
5-23
5-23
5-24
5-24
5-24
PPM100 Partial Pressure Monitor
5-2
Process Control
PPM100 Partial Pressure Monitor
Process Control
5-3
Process Control Warnings
•
It is the user’s responsibility to ensure that the automatic control signals provided by
the process control module of the PPM100 are always used in a safe manner.
•
Carefully check the programming of the system, and test every individual channel
connection under MANUAL control, before switching to AUTO Mode operation.
•
When an equipment failure or power shutdown condition could cause a hazardous
situation, always provide fail-safe precautions. As an example, a pressure relief check
valve should be used in conjunction with an automated backfill valve when the risk
of dangerous overpressure is possible.
•
Even if the control logic seems simple and obvious, we recommend that you always
develop a logic diagram (flowchart) of the process control function you wish to
implement.
•
To minimize programming and connection errors, prepare a Specification Table
which lists the rule parameters, measurement sources, and connection scheme for
each channel.
•
Keep a copy of the circuit schematic, which illustrates how each piece of equipment
is connected to the process control module, in this manual.
•
Carefully consider the response of your process control setup during and after power
losses. A properly wired setup should protect the system and operators from
hazardous conditions whenever power is lost, and should remain in a safe state after
power is reestablished.
•
Keep in mind that all process control channels are set to Manual Mode, INACTIVE,
every time the PPM100 controller is powered up (this should be considered a
Fail-safe state). You must switch the appropriate channels to Auto Mode to restart
automated operation after every power up.
•
No process control actions take place based on RGA readings while the spectrometer
is establishing emission current, while the ionizer is degassing or while in the
MassSpec Display (performing analog scans).
•
To prevent relay arcing, use transient absorbers when connecting inductive loads,
such as motors or solenoids, to the process relays. It may be necessary in some cases
to use an external power relay driven by a process relay to switch a device on and off.
•
No single-mass partial pressure readings are performed while the MassSpec display
is active. As a consequence, all partial pressure related process control events are
frozen while mass spectra are being displayed. Partial pressure readings and related
process control resume when the MassSpec display is exited.
•
All process channels must be set to a safe manual state, either Active or Inactive,
prior to:
• accessing the MassSpec Display
• calibrating the RGA electrometer
• degassing the RGA
• changing the Silent/Audio Leak Trend mode in the Monitor Display
PPM100 Partial Pressure Monitor
5-4
Process Control
Why Use Process Control?
Fully automatic vacuum system operation is universally recognized as the most effective
way to provide:
•
Reproducible process conditions
→ increased productivity
•
Fault protection
→ decreased down-time
•
Unattended operation
→ more efficient use of operators’ time
•
Safe operation in the hands of
inexperienced users
→ reduced chances of errors and accidents
•
System automation for repetitive
processes
→ automate repetitive events such as
sample loadings and pump downs
One of the best ways to improve process yield and reduce system failure is through
automation. Process automation is most important in complex systems or in systems
operated by inexperienced personnel. The process control capabilities of the PPM100
make it unnecessary for the operator to be physically present to operate valves and/or
actuate switches at the right time. In fact, a PPM100 with its embedded web server
provides remote control capabilities from anywhere in the world.
The PPM100 Process Control Module is commonly used to,
•
Automatically control vacuum components such as valves, heaters, power supplies,
shutters and other process equipment.
•
Interlock process control operations with external signals that are related to time,
pressure, temperature, gauge status, system status, TTL logic levels and other
parameters.
•
Automatically control pumpdown, venting and load-lock procedures.
•
Signal when a process is complete or alert operators to system conditions that require
their attention.
•
Link process control channels together to create powerful system logic to control a
wide variety of functions.
•
Automate repetitive operations.
•
Use e-mail notification to warn operators about possible system problems over the
internet.
•
Control a system remotely through the computer or web interfaces.
PPM100 Partial Pressure Monitor
Process Control
5-5
Process Control Basics
A PPM100 box fitted with a Process Control Module, is a powerful and versatile vacuum
system controller. The process control module provides eight independent channels for
system automation. Each channel has a relay closure output, and associated opto-isolated
TTL output logic signal, that may be linked to a variety of input sources through
user-programmable rules.
When in AUTO mode, the state of a channel is linked to the readings from an input
source. This input source can be:
•
any partial/total pressure measurement or analog input
•
the system clock
•
a dedicated TTL input pin
Channel Rules define the exact conditions under which channels change state during
automated operation. The parameters required to fully specify a rule include:
•
•
•
input source
setpoint (level, polarity and hysteresis)
setpoint delay
•
•
channel description and labels
audio alerts
Process control programming is fast, straight-forward and designed for nonprogrammers. A complete listing of the Rule editing menus can be found in Chapter 3 of
this manual, and will not be reproduced in this chapter.
During automated operation, the output status of all eight channels can be monitored in
real time from the front panel (see Process Control Display in Chapter 3). Also, eight
dedicated Process Control LEDs (located below the screen) and programmable audio
alarms are available to announce process control events.
Manual Override is available for all channels. This allows channel relays and their TTL
outputs to be operated directly from the front panel.
All process control events are automatically time stamped and recorded in the Process
Control Log. Use the [History] QuickKey in the Process Control Display to review the
log. Note that the log is erased when the power is turned off.
The Process Control module also includes 7 opto-isolated TTL inputs. These inputs can
be used to remotely control various controller functions including:
•
•
remote enable
filament on/off
•
•
•
degas on/off
RGA Filament lockout
RGA Keypad disable
•
•
Data Log reset
touchscreen disable
PPM100 Partial Pressure Monitor
5-6
Process Control
ACTIVE vs INACTIVE
The state of a process control channel is either ACTIVE or INACTIVE.
ACTIVE
When a process control channel is ACTIVE,
•
its TTL output is logic low
•
its relay is energized or on - the Common and Active (normally open, N.O.)
pins are connected together
•
its channel LED on the front panel is ON
INACTIVE
When a process control channel is INACTIVE,
• its TTL output is logic high
• its relay is de-energized or off - the Common and Inactive (normally closed,
N.C.) pins are connected together
•
its channel LED on the front panel is OFF
When a process control channel is in Auto mode, it becomes ACTIVE when the
conditions specified by its rule’s parameters are met.
Manual operation of the channel output is possible using Manual Override from the front
panel or over a computer interface.
Power-On State
All process control channels are set to Manual Mode and INACTIVE, when the PPM100
is powered up. The user must switch the required channels back to Auto Mode to restart
automated operation every time the unit is powered up.
Programming Rules
The process control board provides eight independent channels for system automation.
Each channel has a relay closure output and associated opto-isolated TTL output signal.
The channel state may be controlled (1) manually (Manual Override below) or
(2) automatically, by linking its state to an input source through user-programmable rules.
While in AUTO mode, the state of a channel can be linked to the readings from (1) any
partial or total pressure measurement or analog input, (2) the system clock, (3) a
dedicated TTL input pin or (4) an alarm notification.
Channel Rules define the exact conditions under which channel state activation or
deactivation takes place during automated operation. The parameters required to fully
specify a rule include (1) input signal (source), (2) activation setpoint (level, polarity and
hysteresis), (3) delay and (4) audio alerts. For channels linked to partial/total pressure
PPM100 Partial Pressure Monitor
Process Control
5-7
measurements, the user must also specify a channel state for when the RGA/gauge is off
or in a fault condition.
Process control programming is fast, straight-forward and designed for
non-programmers. Rule editing menus do not require any prior programming experience,
and present choices in a simple format.
The variety of signal sources available to every channel provides process control
versatility that extends beyond what has been traditionally expected from vacuum gauge
controllers. For example, one channel could open the main gate valve every time the PP1
readings from the main chamber drop below a user-specified level, while the next
channel controls overnight bakeouts, by using the clock to power a heating envelope
during off-hours.
For More Information
Consult Chapter 3 of this manual for a complete description of the Process Control
menus, parameters and displays used to program, monitor and control the process control
module. See Chapter 7 for information about controlling the process channels over a
remote computer interface.
Manual Override
Manual Override is available for all channels, making it possible to manually operate
channel relays and TTL outputs directly from the front panel.
Manual control of the channels is performed from the Process Control Display.
Use the [Process] or [Back to Process] QuickKey to bring up the Process Control Display
screen. This display consists of eight Channel Data Boxes, each displaying state and
configuration information for a process control channel.
Figure 5-1. Process Control Display.
Touch a Channel Data Box to choose a channel state (Active, Inactive or Auto) or edit
the channel rules and labels.
PPM100 Partial Pressure Monitor
5-8
Process Control
Figure 5-2. Channel Options.
Choose...
'Inactive' to manually DEACTIVATE the channel
'Active' to manually ACTIVATE the channel
'Auto' to switch the channel to Auto mode - its state is now controlled by the
channel rules
'Edit Rules' to edit the channel rules
'Edit Labels' to edit the text and audio options for the channel
Recommendations
Always use Manual Operation to test your process control connections before switching
to (and relying on) Automatic mode for channel operation.
Use Manual Override to quickly switch an automated procedure to manual control in an
emergency.
Use Channel Labels to display real system names and states for each channel. This
eliminates confusion over which channel is connected to which device.
All process control channels default to Manual Mode, INACTIVE, when the PPM100
controller is first turned on. This must be regarded as the Fail Safe state of the system.
For More Information
Consult the Process Control sections of Chapter 3, including descriptions of the Process
Control Display, Channel Data Boxes and Rules Editing menus.
Fail-Safe Logic
WARNING!
When equipment malfunction or power loss could cause a hazardous situation, always
provide fail-safe operation.
Fail-Safe logic must be very carefully planned, designed and tested before reliance on
process automation is allowed.
PPM100 Partial Pressure Monitor
Process Control
5-9
PPM100 users must carefully consider the behavior of their process control setup during,
and after,
•
system failures
•
equipment malfunctions
•
operator errors
•
power losses
Typical "unsafe" situations that must be anticipated and accounted for in logic designs,
include,
•
Gauges and RGAs, used as input sources for process control channels, can
turn off in the middle of a process due to overpressure, electronics failure or
operator error.
•
Input Analog I/O ports, used as channel sources, can overload or be
mistakenly switched into outputs in the middle of a process.
•
Complete power loss can result in total system shutdown.
A properly designed process control setup must respond to all of the above conditions by
immediately shifting the system into a fail-safe state.
A carefully wired and programmed fail-safe state should be available to protect the
equipment and operators from danger under any one of the potentially dangerous events
described above.
Fail-Safe logic must be very carefully planned, designed and tested before reliance on
process automation is allowed.
The following guidelines MUST be considered during fail-safe logic design,
•
Channels linked to gauge readings include the "Gauge-Off/DAC State" rule.
This must be specified to provide the proper fail-safe response in case the
RGA or gauge shuts down and no pressure readings are available to the
channel.
•
Channels linked to analog input readings (AN1-4 and CM1-4) also include
the "Gauge Off/DAC State" rule. This must be specified to provide the proper
fail-safe response in case the analog port is mistakenly switched into an
output and no voltage or capacitance manometer readings are available to
that channel. This rule also applies when the analog input is in overload.
•
During a power shutdown all relays are de-energized and in the INACTIVE
state - Common and Inactive pins connected. This must be carefully
considered during the design and implementation of your process control
setup, to assure proper fail-safe operation during power loss and after power
recovery.
•
The PPM100 controller does not automatically turn back on once power is
re-established after power loss. Instead, the user must turn the unit back on
manually. During this time, all relays are de-energized and in the INACTIVE
state (fail-safe state).
•
When the PPM100 is turned on, all channels are set to Manual Mode and
INACTIVE. This is considered the fail-safe operating mode. The user must
PPM100 Partial Pressure Monitor
5-10 Process Control
set the required process control channels back to Auto to restart automated
process control every time the PPM100 controller is turned on.
PPM100 Partial Pressure Monitor
Process Control 5-11
Relay Connections
Each process control channel has an associated relay. The relay specifications are:
Configuration
SPDT (Single Pole, Double Throw)
Contact Rating
Contact Material
5 A, 250 VAC/30 VDC, resistive load only
AgSnOInO
Use the two 12-Position Terminal Block Plugs located on the back panel to connect to the
eight process control relays. Relay pins are labeled I (Inactive), C (Common) and
A (Active) for easy association to channel states.
1
Block 1
Block 2
13 CH5
CH4 12
24 CH8
CH1
Figure 5-3. The 2 12-position terminal blocks for process relay connections.
Block
Pin
Process Channel
Process Control Label
Relay Pin
1
1
2
3
4
5
6
7
8
9
10
11
12
1
Common ( C )
Inactive ( I )
Active ( A )
Common ( C )
Inactive ( I )
Active ( A )
Common ( C )
Inactive ( I )
Active ( A )
Common ( C )
Inactive ( I )
Active ( A )
C
N.C.
N.O.
C
N.C.
N.O.
C
N.C.
N.O.
C
N.C.
N.O.
13
14
15
16
17
18
19
20
21
22
23
24
5
Common ( C )
Inactive ( I )
Active ( A )
Common ( C )
Inactive ( I )
Active ( A )
Common ( C )
Inactive ( I )
Active ( A )
Common ( C )
Inactive ( I )
Active ( A )
C
N.C.
N.O.
C
N.C.
N.O.
C
N.C.
N.O.
C
N.C.
N.O.
2
2
3
4
6
7
8
Note: Block #2 must be removed in order to be able to access its side screws.
PPM100 Partial Pressure Monitor
5-12 Process Control
Connection Basics
When a process control channel is ACTIVE its relay is energized, or on, connecting the
Common and Active (N.O.) pins. Active Pins are labeled 'A' on the back panel, and
correspond to the Normally Open pin of the SPDT relay.
SPDT Relay
A, Active, Normally Open, N.O.
I, Inactive, Normally Closed, N.C.
C, Common
Figure 5-4. Active relay connection.
When a process control channel is INACTIVE its relay is de-energized, or off,
connecting the Common and Inactive pins. Inactive Pins are labeled 'I' on the back panel,
and correspond to the Normally Closed pin of the SPDT relay.
SPDT Relay
A, Active, Normally Open, N.O.
I, Inactive, Normally Closed, N.C.
C, Common
Figure 5-5. Inactive relay connection.
Connection Schemes
Process control relays have three pins and three connection schemes are possible.
Active-Common
The relay is wired as a single throw switch, with connections to the Active and Common
pins only. Contact closure takes place during the ACTIVE state of the channel. Contact is
open during the INACTIVE state of the channel and during power shutdowns. For
example, use this connection to turn a heater on and off, using the relay as a power
switch. Heat is available only when the channel state is ACTIVE.
Power
Ground
SPDT Relay
Active
Inactive
Heater
Common
Figure 5-6. Using a relay as a power switch. (Shown in Inactive state.)
PPM100 Partial Pressure Monitor
Process Control 5-13
In this case, the Active and Common connections may be swapped. Connecting as shown
prevents power from appearing on the Inactive pin when the channel is Inactive.
Inactive-Common
The relay is also wired as a single throw switch, but with connections to the Inactive and
Common pins. Contact closure takes place during the INACTIVE state of the channel.
Contact between the pins is also established during power shutdowns (fail-safe state). For
example, use this connection scheme to turn an auxiliary power supply on after a main
power failure. As the main power shuts down, the relay is deactivated, delivering backup
power to the experiment. In general, use this connection scheme whenever you need a
contact to open during the active state of the channel.
Power
Ground
SPDT Relay
Active
Aux
Power
Inactive
Common
Figure 5-7. Using a relay as a back-up power switch. (Shown in Inactive, power-off state.)
In this case, the Inactive and Common connections may be swapped. Connecting as
shown prevents power from appearing on the Active pin when the channel is Active.
Active-Common-Inactive
The relay is used as a true double throw switch, with connections to its three pins. As an
example, consider a system where an electrical power source is shared between two
instruments (#1 and #2), but only one instrument is powered at a time (sequential
operation). In this scheme, the supply wire is connected to the Common pin and the
Active and Inactive pins are connected to the power input pins of instruments #1 and #2,
respectively. Switching the channel state between ACTIVE and INACTIVE redirects the
power from instrument #1 to instrument #2.
SPDT Relay
Active
Inactive
Device
#2
Common
Device
#1
Ground
Power
Supply
Figure 5-8. Using a relay as a power multiplexer. (Shown in Inactive, power-off state.)
PPM100 Partial Pressure Monitor
5-14 Process Control
A similar scheme could be used to monitor (sequentially) two separate sensors from a
single-input reader (signal multiplexing). In this case, the reader’s input is connected to
Common, and sensors 1 and 2 connect to pins A and I of the relay, respectively. Activate
the channel to monitor sensor 1, or deactivate the channel to switch to sensor 2.
SPDT Relay
Active
Inactive
Common
Sensor
#2
Sensor
#1
Ground
Analog
Input
Figure 5-9. Using a relay as a signal multiplexer. (Shown in Inactive, power-off state.)
Connection Tips
•
Both Terminal Block Plugs can be disconnected from the back panel, making
it possible to transfer the controller to a different location without having to
undo the relay connections. Spare Terminal Blocks are also available from
Stanford Research Systems for lab environments where more than one wire
connection scheme is required.
•
Make sure all wire ends are securely fastened to the Terminal Block Plugs,
always tighten the wire-lock screws.
•
Block #2 (Relays 5-8) must be disconnected from the process control board
in order to be able to access its side wire-lock screws. Gently pry the block
out with a small screwdriver using the access slots in the panel above and
below the connector.
•
Relays are used in vacuum systems for many different purposes:
•
•
•
•
Power distribution/switching to system components such as gate valve
actuators, heating jackets, etc.
Interlocking. Many pump controllers include relay closure detection
ports designed for interlocking purposes.
•
Signal multiplexing. For example, it is not unusual to multiplex a single
input temperature reader between two temperature sensors.
Sound alarms on/off.
•
Start/stop processes
In order to prevent costly mistakes, label every cable connected to the
process control relays with an unambiguous name. Include the pin#, pin
label, and channel# in case the cable comes loose and needs to be reattached
to the controller.
PPM100 Partial Pressure Monitor
Process Control 5-15
•
Do not exceed the relay ratings: 5 A/250 VAC/30 VDC, resistive load,
during operation.
•
Use transient absorbers when connecting inductive loads, such as motors or
solenoids, to the process relays. It may be necessary in some cases to use an
external power relay driven by a process relay to switch a device on and off.
•
Ensure that all process control channels are under manual control, and in the
desired state, prior to connecting a wired terminal block plug into the process
control board’s receptacle.
•
During a power shutdown, all relays are de-energized and switch to their
INACTIVE state - i.e. Common and Inactive pins connected. This must be
carefully considered during the design of your process control setup, to
assure proper fail-safe operation during and after power losses.
Channel Linking
Process control relays can be linked together to create powerful system logic and control
complicated functions. As an example, consider the implementation of an overnight
bakeout system with over-temperature protection. Since heating jackets have been known
to runaway and cause serious system damage, it is always a good precaution to add a
safeguard system that will shut down the heating power if the temperature generated by
the heater exceeds the maximum allowed threshold. This is easily implemented with the
PPM100 if a thermocouple is attached to the vacuum system and its amplified voltage
signal is monitored through one of the Analog I/O ports of the controller. A
straightforward implementation of this function might be: (1) link channel 1 to the clock
and program its activation period throughout the middle of the night, (2) link channel 2 to
the AN1 thermocouple readings and program it to activate at voltage readings below the
maximum allowed temperature value, (3) connect the channel 1 and channel 2 relays in
series, using the Active-Common connection described above, and use the dual-switch
combination as a power switch for the heater’s power cord. Under this configuration,
heating is only possible if channel 1 AND Channel 2 are both simultaneously Active. If
the temperature exceeds the maximum specified value (channel 2 deactivated), or the
bakeout time expires (channel 1 deactivated), no electrical power can flow into the
heating jacket and the bakeout is interrupted.
Power
SPDT Relay
SPDT Relay
Active
Active
Inactive
Inactive
Heater
Common
Ground
Figure 5-10. Using two relays in series to provide an interlock function.
(Both relays shown in Active state.)
PPM100 Partial Pressure Monitor
5-16 Process Control
Remote Operation
Channel relays can be operated remotely through the computer (RS-232, GPIB or USB)
and web interfaces. Use this convenient feature to control experiments or processes from
anywhere in the world. For example, turn off your bakeout jackets from home before
leaving for work, so that the system can cool down during your commute and is ready to
start an experiment as you get into the lab.
Figure 5-11. PPM100 web page showing relay status and control via the internet.
PPM100 Partial Pressure Monitor
Process Control 5-17
Digital I/O Module
The DIGITAL I/O module included with the Process Control board supports three types
of logic signals. The TTL signals are opto-isolated from the PPM100 chassis. The inputs
may be electrically floated as a group. The outputs may be electrically floated as a group,
separate from the inputs.
TTL Input (8 pins)
Each process control channel has a dedicated TTL input pin. While in AUTO mode,
channel control can be linked to this TTL input. The logic level (TTL HIGH or LOW)
responsible for channel activation must be specified by the user (factory default setting is
active low, meaning that the channel is ACTIVE when the logic level on the pin is
LOW.)
TTL Output (8 pins)
Each process control channel has a dedicated TTL output signal. Following common
industry standards, all process control TTL output signals are Active Low - when a
process control channel is ACTIVE, the corresponding TTL output is logic LOW.
INACTIVE means the channel’s TTL output pin is logic high.
Remote Control Input (7 pins)
The Process Control module also includes 7 TTL logic inputs for remote logic control of
various controller functions.
•
•
•
RGA remote enable
RGA Filament On/Off
Degas On/Off
•
•
RGA Filament lockout
RGA keypad disable
•
•
Data log clear/reset
Front Panel disable
Recommendation
Use the Remote Control TTL inputs to control important PPM100 functions remotely,
without the need for a computer interface. A common application is clearing the data
logging buffer to synchronize the start of the data log with a particular event, such as
(1) the opening of a gate valve or (2) the achievement of full speed by a turbo pump. Gate
valve and turbo pump controllers often provide logic outputs compatible with the remote
control module. Remote control inputs can also be interfaced with Programmable Logic
Controllers’ signals.
PPM100 Partial Pressure Monitor
5-18 Process Control
Digital I/O Connections
Use the female DB37 port located on the back panel of the PPM100 controller (labeled
DIGITAL I/O) to connect to the (1) eight PC TTL Output, (2) eight PC TTL input, and
(3) 7 Remote Control TTL input pins of the Process Control Board.
Note
A Male DB37 connector is included with every PPM100 controller shipped directly from
Stanford Research Systems to facilitate interfacing of the TTL I/O port to your system.
19
1
37
20
Figure 5-12. DB37 TTL I/O connector.
TTL I/O Pin Assignments
Unconnected inputs are HIGH.
Module
Remote Control
TTL IN
Process Control
TTL OUT
PPM100 Partial Pressure Monitor
Pin
Name
Description
1
PPM100 Vcc
+5 V OUT
2
3
4
5
ANODE COM
Not Used
Not Used
RGA_Degas
External User +5 V IN
6
RGA_FIL_Lockout
7
RGA_Key_Disable
Level:
LOW=RGA emission Off
Level:
LOW=Disable front panel Keypad.
8
9
10
Not Used
Not Used
Clear_Data_Log
11
RGA_Remote_Enable
12
RGA_FIL_On
13
14
Not Used
RGA_FP_Disable
15
PPM100 Vcc
+5 V OUT
16
TTL_OUT_5
17
TTL_OUT_6
18
TTL_OUT_7
19
TTL_OUT_8
TTL OUT for Channel 5.
LOW=ACTIVE
TTL OUT for Channel 6.
LOW=ACTIVE
TTL OUT for Channel 7.
LOW=ACTIVE
TTL OUT for Channel 8.
LOW=ACTIVE
Edge trigger:
↓= Degas On, ↑=Degas Off
Edge trigger:
↓=clear the data log
Level:
HIGH=Ignore RGA_Degas_On,
RGA_FIL_On, RGA_EMULT_On pins.
Edge trigger:
↓=FIL ON, ↑=FIL Off
Level:
LOW=Disable Touchscreen and
Keypad
Process Control 5-19
Module
Pin
Name
Description
Process Control
TTL IN
20
21
ANODE COM
TTL_IN_1
22
TTL_IN_2
23
TTL_IN_3
24
TTL_IN_4
25
TTL_IN_5
26
TTL_IN_6
27
TTL_IN_7
28
TTL_IN_8
External User +5 V IN
TTL Input Signal for Channel 1. Active
LOW
TTL Input Signal for Channel 2. Active
LOW
TTL Input Signal for Channel 3. Active
LOW
TTL Input Signal for Channel 4. Active
LOW
TTL Input Signal for Channel 5. Active
LOW
TTL Input Signal for Channel 6. Active
LOW
TTL Input Signal for Channel 7. Active
LOW
TTL Input Signal for Channel 8. Active
LOW
29
30
31
unused
PPM100 Ground
PPM100 Ground
32
33
34
COM_EMTR_REF
COM_COLTR_PULLUP
TTL_OUT_1
35
TTL_OUT_2
36
TTL_OUT_3
37
TTL_OUT_4
Process Control
TTL OUT
External User Ground
External User +5 V IN
TTL OUT for Channel 1.
LOW=ACTIVE
TTL OUT for Channel 2.
LOW=ACTIVE
TTL OUT for Channel 3.
LOW=ACTIVE
TTL OUT for Channel 4.
LOW=ACTIVE
Note: ↓=HIGH-to-LOW, ↑=LOW-to-HIGH transition.
PPM100 Partial Pressure Monitor
5-20 Process Control
Input Circuit
The TTL inputs are opto-isolated from the PPM100. The schematic of a TTL input is
shown below.
Anode COM
Connect to
external Vcc
+5 to +15 Vdc
PPM100 Vcc
3.3k
Internal TTL Signal
TTL Input Pin
Pull low to
external ground
PPM100 Ground
PPM100
Figure 5-13. TTL input pin schematic.
For isolated operation of ALL TTL inputs, connect ANODE_COM (pins 2 and 20) to the
external Vcc supply (+5 to +15 Vdc). Pull inputs to external ground for low inputs.
For non-isolated operation of ALL TTL inputs, connect ANODE_COM (pins 2 and 20)
to PPM100 Vcc (pin 1 or 15) and pull inputs to PPM100 Ground (pin 30 or 31) for low
inputs.
In both cases, leaving an input unconnected or open is equivalent to a HIGH input.
Output Circuit
The TTL outputs are opto-isolated from the PPM100. The schematic of a TTL output is
shown below.
COM_COLTR_PULLUP
Connect to external Vcc
+5 to +15 Vdc
PPM100 Vcc
10k
74C244
Internal TTL Signal
TTL Output Pin
0 to external Vcc
COM_EMTR_REF
Connect to external
ground
PPM100
Figure 5-14. TTL output pin schematic.
For isolated operation of ALL TTL outputs, connect COM_COLTR_PULLUP (pin 33) to
the external Vcc supply (+5 to +15 Vdc) and COM_EMTR_REF (pin 32) to the external
ground. The TTL output will be external 0 V or Vcc (low or high).
For non-isolated operation of ALL TTL outputs, connect COM_COLTR_PULLUP
(pin 33) to PPM100 Vcc (pin 1 or 15) and COM_EMTR_REF (pin 32) to PPM100
Ground (pin 30 or 31). The TTL output will be external 0 V or 5 V (low or high).
PPM100 Partial Pressure Monitor
Process Control 5-21
Connection Tips
•
All TTL inputs may be connected to respond to relay closure signals, such as those
provided by the mechanical position indicators of gate valves, or full speed indicators
of turbomolecular pump controllers.
•
Input and output pins can be linked together to create powerful system logic and
control a wide variety of system functions. For example, Process Control TTL
outputs can be connected to Remote Control TTL inputs and used to control
functions such as powering gauges on/off or clearing the Data Log.
•
The use of external TTL logic circuitry to provide additional logic manipulation of
the TTL I/O signals complements the process control capabilities of PPM100. For
example, connect the TTL I/O pins to an external PLC (programmable logic
controller) or a home-built logic circuit to extend the capabilities of the process
control ports.
•
Use the TTL output signals to operate external relays, with ratings exceeding those of
the built-in relays.
•
Use the TTL outputs to indicate the status of the individual process control channels
to external devices such as computers, logic analyzers and PLCs.
Debounce Time
A 50 ms debounce time is standard for ALL TTL inputs (Process Control and Remote
Control). This prevents spurious glitches on the TTL lines from triggering process control
events or controller functions.
For a level-triggered input, the debounce time is the minimum amount of time the input
signal must remain unchanged, at the new logic level, before that level is recognized by
the PPM100 and triggers a process control event or controller function.
For an edge-triggered Remote Control input, the debounce time is the length of time
during which the input signal must remain unchanged following a level transition, before
the edge is validated by the PPM100 and triggers a controller function.
PPM100 Partial Pressure Monitor
5-22 Process Control
Remote Control Inputs
RGA_Degas
Pin:
Trigger mode:
Debounce time:
5
Edge, ↓= ON, ↑=OFF
50 ms
Prerequisites:
• RGA filament is turned on
• RGA_Remote_Enable is logic LOW
• RGA_Fil_Lockout is logic HIGH
Pulling the RGA_Degas control line LOW, after it has been high for at least 50 ms, and
holding the line LOW for at least 50 ms, starts the degassing process on the RGA’s
ionizer. The input must remain LOW for the duration of the degas process. Degassing
takes place for a period of 3 minutes (default degas time).
Degas can be terminated before the Degas Time has elapsed through the remote input by
• Switching the RGA_Degas input HIGH after it has been LOW for at least
50 ms
• Turning the RGA filament off
• Pulling the RGA_FIL_Lockout pin LOW.
RGA_FIL_Lockout
Pin:
6
Trigger mode:
Level. LOW = RGA Filament locked off, HIGH = Normal RGA
filament operation.
Debounce time: 50 ms
Prerequisites:
• RGA_Remote_Enable is logic LOW
HIGH allows normal RGA operation (unconnected default).
LOW forces the RGA Filament to turn off, and stay off - any request to turn the RGA
Filament on is denied as long as the RGA_FIL_Lockout line remains LOW. This applies
to requests from the front panel keys, the computer interfaces and the web server.
Recommendation
RGA_FIL_Lockout is one of the most useful remote control lines and is often used to
interlock RGA Filament emission. For example, the RGA_FIL_Lockout line is often
connected to the logic output of the mechanical position indicator of a load lock’s vent
valve. If the vent valve is opened (indicating that high pressure is present in the load lock
chamber), the RGA Filament shuts down, and any attempt to turn it back on is denied,
effectively protecting its filament.
PPM100 Partial Pressure Monitor
Process Control Worksheet 5-23
RGA_Key_Disable
Pin:
Trigger mode:
Debounce time:
7
Level, LOW = Disable front panel RGA Keypad (i.e. black buttons).
50 ms
Prerequisites:
• None
HIGH allows full manual control of the RGA from the front panel RGA Keypad
(FILAMENT and EMULT black buttons).
If unconnected, this pin will be HIGH and the RGA Keypad is fully operational (default).
LOW locks out some of the RGA Keypad functionality: the FILAMENT and
E. MULTIPLIER keys cannot be used to turn the filament or electron multiplier on as
long as this line remains LOW. Turning off is unaffected.
The Power (red) button is unaffected by this pin.
Recommendation
Use this pin to protect the filament or electron multiplier during a process.
Clear_Data_Log
Pin:
Trigger mode:
Debounce time:
10
Edge, ↓= Clear the data log.
50 ms.
Pulling the Clear_Data_Log control line LOW after it has been high for at least 50 ms,
and holding the line LOW for at least 50 ms, clears and resets the data log.
Recommendation
Use this input to synchronize the start of data logging with an important event such as a
gate valve closing, a turbo pump achieving full rotational speed or a heating cycle getting
started. For example, connect the Clear_Data_Log line to the logic output of your gate
valve’s mechanical position indicator to restart the data log buffer every time the gate
valve is opened. This is useful for the collection of pump down curves. Connect the
Clear_Data_Log line to a logic signal from your temperature controller indicating the
start of a heating ramp, to monitor the entire temperature profile of a TPD experiment.
PPM100 Partial Pressure Monitor
5-24 Process Control
RGA_Remote_Enable
Pin:
Trigger mode:
Debounce time:
11
Level. HIGH = ignore RGA_Degas, RGA_FIL_On, and
RGA_FIL_Lockout pins.
50 ms
Prerequisites:
• None
The RGA_Remote_Enable line must be LOW for the PPM100 Remote Control Module
to acknowledge the edge triggers from the RGA_Degas and RGA_FIL_On and the level
of the RGA_FIL_Lockout pins.
If unconnected, this pin will be HIGH and remote control is disabled (default).
Recommendation
This pin is often used to enable/disable Remote Control of RGA functions. For example,
it might be useful to lock the remote control signals during an electrically noisy process
to prevent logic glitches from accidentally affecting RGA operation.
RGA_Fil_On
Pins:
Trigger mode:
Debounce time:
12
Edge, ↓= ON, ↑=OFF
50 ms
Prerequisites:
• RGA_Remote_Enable is logic LOW
•
RGA_FIL_Lockout is logic HIGH
Pulling the RGA_Fil_On control line LOW after it has been high for at least 50 ms, and
holding the line LOW for at least 50 ms, activates filament emission in the RGA Ionizer.
The input must remain LOW until it is required to turn the filament off.
RGA_FP_Disable
Pins:
Trigger mode:
Debounce time:
14
Level, LOW = Disable front panel touch screen LCD and keys.
50 ms
HIGH allows normal operation of the front panel touch screen display and keys
(unconnected default).
LOW locks the front panel touch screen LCD and keys. The front panel (including the
Power Button) does not respond to touches.
Recommendation
The RGA_FP_Disable signal is often used to lock the front panel and block unauthorized
changes to the controller during a process or experiment
PPM100 Partial Pressure Monitor
6-1
Chapter 6
Remote Programming
In This Chapter
Index of Commands
Alphabetical List of Commands
Introduction
Communicating With RS-232
Communicating With GPIB
Communicating with USB
Screen Indicators And Queues
Command Format
Command Synchronization
RGA Commands
PPM100 to RGA Communication
RGA Pass Through Mode
Command Syntax
Pressure Units
Partial Pressure and Analog Input
Measurement Commands
6-3
6-7
6-11
6-11
6-11
6-11
6-12
6-12
6-13
6-14
6-14
6-14
6-15
6-15
6-17
PPM Monitor Setup Commands
6-21
Analog I/O Setup Commands
6-24
RGA Commands
6-25
Logging Commands
6-30
Charting Commands
6-33
Status Reporting
6-49
Status Registers
Status Enable Registers
Serial Poll Status Register
*STB? to Read the Status
Serial Poll to Read the Status
Service Request
Power-On Status
6-49
6-49
6-49
6-50
6-50
6-50
6-51
Status Reporting Commands
6-52
Using USB
6-58
Introduction
6-58
Windows 2000, XP, and 98
6-58
Installing VCP (Virtual Com Port [without PNP
support])
6-58
Testing
6-59
VCP Options : COM port number
6-59
Mac OS8 and OS9
6-60
Installing USBSerial extension
6-60
Mass Spectrum Display Commands 6-35
Process Control Commands
6-38
Backlight Commands
6-44
System Commands
6-45
Interface Commands
6-47
PPM100 Partial Pressure Monitor
6-2
Remote Programming
PPM100 Partial Pressure Monitor
Index of Commands
6-3
Index of Commands
Important
Always use the GPMU command at the start of a program to ensure that the desired units are in effect.
Use VERB 0 to set the RS-232 interface to terse mode for computer programs. Use VERB 1 to use verbose mode
for console communications.
Variables
i, j, d, n, p
x
s, t
integers
real number
text strings
Partial Pressure and Analog Input Measurement
GPMU (?) {n} {s}
6-17
Pressure Units
GPBA (?) n {, p}
6-17
Data Bar Assign
GPDF (?) n {, i}
6-17
Display Format
GDAT ? p
6-18
Read Source Data
GDTX ? p
6-18
Read Source Data With Units
LRAT ? p
6-18
Read Leak Rate
LRCE (?) {n}
6-18
Leak Rate Coefficient
GDES (?) p {, s}
6-18
Gas Name/Port Location
GSTA ? p
6-19
Source Status
GSTT ? p
6-20
Source Status Time
OAQU ?
6-20
Read Monitor Alarm Status
PPM Monitor Setup
PCME (?) p {, i}
MAME (?) p {, n}
GDES (?) p {, s}
SMCF (?) p {, x}
SVGL (?) p {, i}
NFTM (?) p {, n}
HVTM (?) p {, i}
OAEN (?) p {, i}
OALH (?) p {, x}
OALL (?) p {, x}
OABP (?) p {, i}
6-21
6-21
6-21
6-21
6-22
6-22
6-22
6-22
6-22
6-23
6-23
PPM Measurement Enable
PPM Mass
Gas Name/Port Location
Gas Correction Factor
Set Gas via Library
PPM Scan Rate
PPM Detector
PPM Alarm Enable
Alarm Level High
Alarm Level Low
Alarm Beep
Analog Port Setup
GADM (?) n {, i}
GDAS (?) n {, i}
GCMM (?) n {, i}
GDAV (?) n {, x}
CMPX (?) n {, x}
6-24
6-24
6-24
6-24
6-24
I/O Mode
DAC Source
CM Mode
Output Value
CM PMax
RGA
MAXM ?
RGAI ?
EEEV (?) {n}
IEEV (?) {i}
FOPV (?) {n}
SCRA (?) {n}
6-25
6-25
6-25
6-25
6-25
6-26
Read RGA Mass Range
Read RGA Identification
Electron Energy
Ion Energy
Focus Voltage
Scan Rate
PPM100 Partial Pressure Monitor
6-4
Index of Commands
ECMA (?) {x}
CALL ?
CEIV ?
DGAS (?) {i}
EMIS (?) {i}
ENEM (?) {i}
EMBV (?) {n}
EREQ (?) {i}
IRFE (?) {i}
LRER (?) {0}
PASS (?) {i}
SYNC?
6-26
6-29
6-29
6-25
6-26
6-26
6-26
6-26
6-27
6-27
6-28
6-28
Electron Current
Calibrate RGA Detectors
Calibrate RGA Electrometer
RGA Degas On/Off
RGA Filament Emission On/Off
RGA Scan Electron Multiplier On/Off
RGA Electron Multiplier Bias Voltage
RGA Ionization Source
RF7 Error Handling
Last RGA Error
RGA Pass Through
RGA SYNC
Logging
PLDS (?) {i}
PLCL
PLGF ?
PLGN ?
PLIN (?) {n}
PLWT (?) {n}
PLEN (?) {i}
PLDD (?) {i}
PLTR (?) {i}
6-30
6-30
6-30
6-30
6-31
6-32
6-32
6-32
6-32
Chart/Table Display
Clear Data Log
Read Data Log First
Read Data Log Next
Logging Interval
Log Length
Logging Enable
Display Date
TTL Reset Enable
Charting
LCPN (?) {x}
LCPX (?) {x}
LCVN (?) {x}
LCVX (?) {x}
LCSA
LCRG (?) {n}
LCSF
6-33
6-33
6-33
6-33
6-33
6-33
6-34
Chart/MassSpec Pmin
Chart/MassSpec Pmax
Vmin
Vmax
Autoscale Y-Axis
Time Range
Scale X-Axis to Full
Mass Spectrum Display
SCOK ?
MENU d
SCMF (?) {n}
SCMI (?) {n}
SCAN (?) {i}
OSCC ?
LCPN (?) {x}
LCPX (?) {x}
SYSA
CTOM (?) {n}
MACB ?
PACB ?
6-35
6-35
6-35
6-35
6-36
6-36
6-36
6-36
6-36
6-36
6-37
6-37
Analog Scan OK
Display Screen
MassSpec Final Mass
MassSpec Initial Mass
Start/Stop Analog Scan
MassSpec Complete
Chart/MassSpec Pmin
Chart/MassSpec Pmax
Autoscale MassSpec Y-Axis
Move MassSpec Cursor
Read MassSpec Mass
Read MassSpec Peak
Process Control
RDES (?) d {, s}
RLCL (?) d {, s}
RLOP (?) d {, s}
RBEP (?) d {, i}
RMOD (?) d {, i}
RSTA (?) d {, i}
RAMS (?) d {, i}
6-38
6-38
6-38
6-38
6-38
6-39
6-39
Channel Description
Channel Active Message
Channel Inactive Message
Channel Beep
Channel Mode
Channel State
Channel Input
PPM100 Partial Pressure Monitor
Index of Commands
RGOS (?) d {, i}
RTRP (?) d {, x}
RTRV (?) d {, x}
RPHY (?) d {, n}
RVHY (?) d {, x}
RPOL (?) d {, i}
RDEL (?) d {, n}
RTCL (?) d {,n} {,s}
RTOP (?) d {,n} {,s}
RTIL (?) d {, i}
TTLL ?
RHGF ?
RHGN ?
RHCL
RBAD ?
6-39
6-39
6-40
6-40
6-40
6-40
6-40
6-41
6-41
6-41
6-42
6-42
6-42
6-43
6-43
Gauge Off State
Pressure Setpoint
Voltage Setpoint
Percent Hysteresis
Voltage Hysteresis
Setpoint Activation
Setpoint Delay
Activation Time
Deactivation Time
TTL Activation Level
Read TTL Inputs
Read Process Log First
Read Process Log Next
Clear Process Log
Relay Failure Status
Backlight
BLEN (?) {i}
BLIT (?) {i}
BLOF (?) {n} {s}
BLON (?) {n} {s}
BLTD (?) {n}
6-44
6-44
6-44
6-44
6-44
Backlight Saver Enable
Backlight On/Off
Backlight Turn-Off Time
Backlight Turn-On Time
Backlight Delay
System
NAME (?) {s}
TIME (?) {s}
DATE (?) {s}
VOLC (?) {n}
MENU d
MESG (?) {s}
DHWR ? d
*TST ?
FREV ?
VRDT ?
SNUM?
6-45
6-45
6-45
6-45
6-45
6-45
6-46
6-46
6-46
6-46
6-46
System Name
Time
Date
Volume
Display Screen
Message
Detect Hardware
Self-Test
Firmware Revision
Firmware Build
Serial Number
Interface
VERB (?) {i}
*IDN ?
*RST
WSEN (?) {i}
6-47
6-47
6-47
6-47
Verbose RS-232
Identification
Reset
Web Server Enable
Status
*CLS
*PSC (?) {i}
*STB ? {i}
*SRE (?) {i} {, j}
*ESR ? {i}
*ESE (?) {i} {, j}
ERSW ? {i}
ERSE (?) {i} {, j}
GSSW ? {i}
GSSE (?) {i} {, j}
RSSW ? {i}
RSSE (?) {i} {, j}
6-52
6-52
6-52
6-53
6-53
6-54
6-54
6-55
6-55
6-56
6-56
6-57
Clear Status
Power-On Status Clear
Read Serial Poll Status
Serial Poll Enable
Read Standard Event Status
Standard Event Enable
Read Error Status
Error Status Enable
Read Gauge Status
Gauge Status Enable
Read Process Status
Process Status Enable
6-5
PPM100 Partial Pressure Monitor
Index of Commands
6-7
Alphabetical List of Commands
Important
Always use the GPMU command at the start of a program to ensure that the desired units are in effect.
Use VERB 0 to set the RS-232 interface to terse mode for computer programs. Use VERB 1 to use verbose mode
for console communications.
Variables
i, j, d, n, p
x
s, t
integers
real number
text strings
*
*CLS
*ESE (?) {i} {, j}
*ESR ? {i}
*IDN ?
*PSC (?) {i}
*RST
*SRE (?) {i} {, j}
*STB ? {i}
*TST ?
6-52
6-54
6-53
6-47
6-52
6-47
6-53
6-52
6-46
Clear Status
Standard Event Enable
Read Standard Event Status
Identification
Power-On Status Clear
Reset
Serial Poll Enable
Read Serial Poll Status
Self-Test
B
BLEN (?) {i}
BLIT (?) {i}
BLOF (?) {n} {s}
BLON (?) {n} {s}
BLTD (?) {n}
6-44
6-44
6-44
6-44
6-44
Backlight Saver Enable
Backlight On/Off
Backlight Turn-Off Time
Backlight Turn-On Time
Backlight Delay
C
CALL ?
CEIV ?
CMPX (?) n {, x}
CTOM (?) {n}
6-29
6-29
6-24
6-36
Calibrate RGA Detectors
Calibrate RGA Electrometer
CM PMax
Move MassSpec Cursor
D
DATE (?) {s}
DGAS (?) {i}
DHWR ? d
6-45
6-25
6-46
Date
RGA Degas On/Off
Detect Hardware
E
ECMA (?) {x}
EEEV (?) {n}
EMBV (?) {n}
EMIS (?) {i}
ENEM (?) {i}
EREQ (?) {i}
ERSE (?) {i} {, j}
ERSW ? {i}
6-26
6-25
6-26
6-26
6-26
6-26
6-55
6-54
Electron Current
Electron Energy
RGA Electron Multiplier Bias Voltage
RGA Filament Emission On/Off
RGA Scan Electron Multiplier On/Off
RGA Ionization Source
Error Status Enable
Read Error Status
PPM100 Partial Pressure Monitor
6-8
Index of Commands
F
FOPV (?) {n}
FREV ?
6-25
6-46
Focus Voltage
Firmware Revision
G
GADM (?) n {, i}
GCMM (?) n {, i}
GDAS (?) n {, i}
GDAT ? p
GDAV (?) n {, x}
GDES (?) p {, s}
GDES (?) p {, s}
GDTX ? p
GPBA (?) n {, p}
GPDF (?) n {, i}
GPMU (?) {n} {s}
GSSE (?) {i} {, j}
GSSW ? {i}
GSTA ? p
GSTT ? p
6-24
6-24
6-24
6-18
6-24
6-18
6-21
6-18
6-17
6-17
6-17
6-56
6-55
6-19
6-20
I/O Mode
CM Mode
DAC Source
Read Source Data
Output Value
Gas Name/Port Location
Gas Name/Port Location
Read Source Data With Units
Data Bar Assign
Display Format
Pressure Units
Gauge Status Enable
Read Gauge Status
Source Status
Source Status Time
H
HVTM (?) p {, i}
6-22
PPM Detector
I
IEEV (?) {i}
IRFE (?) {i}
6-25
6-27
Ion Energy
RF7 Error Handling
L
LCPN (?) {x}
LCPX (?) {x}
LCRG (?) {n}
LCSA
LCSF
LCVN (?) {x}
LCVX (?) {x}
LRAT ? p
LRCE (?) {n}
LRER (?) {0}
6-33
6-33
6-33
6-33
6-34
6-33
6-33
6-18
6-18
6-27
Chart/MassSpec Pmin
Chart/MassSpec Pmax
Time Range
Autoscale Y-Axis
Scale X-Axis to Full
Vmin
Vmax
Read Leak Rate
Leak Rate Coefficient
Last RGA Error
M
MACB ?
MAME (?) p {, n}
MAXM ?
MENU d
MENU d
MESG (?) {s}
6-37
6-21
6-25
6-35
6-45
6-45
Read MassSpec Mass
PPM Mass
Read RGA Mass Range
Display Screen
Display Screen
Message
N
NAME (?) {s}
NFTM (?) p {, n}
6-45
6-22
System Name
PPM Scan Rate
PPM100 Partial Pressure Monitor
Index of Commands
O
OABP (?) p {, i}
OAEN (?) p {, i}
OALH (?) p {, x}
OALL (?) p {, x}
OAQU ?
OSCC ?
6-23
6-22
6-22
6-23
6-20
6-36
Alarm Beep
PPM Alarm Enable
Alarm Level High
Alarm Level Low
Read Monitor Alarm Status
MassSpec Complete
P
PACB ?
PASS (?) {i}
PCME (?) p {, i}
PLCL
PLDD (?) {i}
PLDS (?) {i}
PLEN (?) {i}
PLGF ?
PLGN ?
PLIN (?) {n}
PLTR (?) {i}
PLWT (?) {n}
6-37
6-28
6-21
6-30
6-32
6-30
6-32
6-30
6-30
6-31
6-32
6-32
Read MassSpec Peak
RGA Pass Through
PPM Measurement Enable
Clear Data Log
Display Date
Chart/Table Display
Logging Enable
Read Data Log First
Read Data Log Next
Logging Interval
TTL Reset Enable
Log Length
R
RAMS (?) d {, i}
RBAD ?
RBEP (?) d {, i}
RDEL (?) d {, n}
RDES (?) d {, s}
RGAI ?
RGOS (?) d {, i}
RHCL
RHGF ?
RHGN ?
RLCL (?) d {, s}
RLOP (?) d {, s}
RMOD (?) d {, i}
RPHY (?) d {, n}
RPOL (?) d {, i}
RSSE (?) {i} {, j}
RSSW ? {i}
RSTA (?) d {, i}
RTCL (?) d {,n} {,s}
RTIL (?) d {, i}
RTOP (?) d {,n} {,s}
RTRP (?) d {, x}
RTRV (?) d {, x}
RVHY (?) d {, x}
6-39
6-43
6-38
6-40
6-38
6-25
6-39
6-43
6-42
6-42
6-38
6-38
6-38
6-40
6-40
6-57
6-56
6-39
6-41
6-41
6-41
6-39
6-40
6-40
Channel Input
Relay Failure Status
Channel Beep
Setpoint Delay
Channel Description
Read RGA Identification
Gauge Off State
Clear Process Log
Read Process Log First
Read Process Log Next
Channel Active Message
Channel Inactive Message
Channel Mode
Percent Hysteresis
Setpoint Activation
Process Status Enable
Read Process Status
Channel State
Activation Time
TTL Activation Level
Deactivation Time
Pressure Setpoint
Voltage Setpoint
Voltage Hysteresis
S
SCAN (?) {i}
SCMF (?) {n}
SCMI (?) {n}
SCOK ?
SCRA (?) {n}
SMCF (?) p {, x}
6-36
6-35
6-35
6-35
6-26
6-21
Start/Stop Analog Scan
MassSpec Final Mass
MassSpec Initial Mass
Analog Scan OK
Scan Rate
Gas Correction Factor
6-9
PPM100 Partial Pressure Monitor
6-10 Index of Commands
SNUM?
SVGL (?) p {, i}
SYNC?
SYSA
6-46
6-22
6-28
6-36
Serial Number
Set Gas via Library
RGA SYNC
Autoscale MassSpec Y-Axis
T
TIME (?) {s}
TTLL ?
6-45
6-42
Time
Read TTL Inputs
V
VERB (?) {i}
VOLC (?) {n}
VRDT ?
6-47
6-45
6-46
Verbose RS-232
Volume
Firmware Build
W
WSEN (?) {i}
6-47
Web Server Enable
PPM100 Partial Pressure Monitor
Remote Programming 6-11
Introduction
The PPM100 Partial Pressure Monitor may be remotely programmed via its standard
(1) RS-232 serial (HOST RS-232), (2) GPIB (IEEE-488) or (3) USB (Universal Serial
Bus) interfaces. Any computer supporting one of these three interfaces may be used to
program the PPM100. All installed interfaces are active at all times.
WARNING!
The SYNC? query is used when beginning a remote session. SYNC? forces the settings
of the PPM100 to match those of the RGA. This is important if the RGA settings have
been changed without the PPM100 knowing about it. If the RGA has only been under
PPM100 control, then SYNC? is unnecessary. The SYNC? query takes up to 30 seconds
to complete. SYNC? returns the value of the RGA status byte (see the RGA manual for
details).
Communicating With RS-232
The PPM100 uses a female DB9 connector (labeled HOST RS-232) for RS-232 serial
communications. The female DB9 connector is configured as a DCE (transmit on pin 2,
receive on pin 3) device and supports CTS/DTR hardware handshaking. The CTS signal
(pins 1, 6 and 8) is an output indicating that the PPM100 is ready, while the DTR signal
(pin 7) is an input that is used to control the PPM100's data transmission. Ground is pin 5.
If desired, the handshake pins may be ignored and a simple 3 wire interface (pins 2, 3 and
5) may be used. The RS-232 interface Baud Rate, Word Length, Parity and Flow Control
must be set in the Main/Remote/RS-232 menu.
WARNING!
The VERB command sets the instrument’s RS-232 verbosity. When controlling the
PPM100 from a computer program, set VERB to 0 for terse return values and error
messages. When using a terminal program, set VERB to 1 for descriptive return values
and error messages. Set VERB0 first when connecting via an RS-232 program.
Communicating With GPIB
PPM100 supports the IEEE-488.1 (1978) interface standard. It also supports the required
common commands of the IEEE-488.2 (1987) standard. Before attempting to
communicate with the PPM100 over the GPIB interface, the PPM100's Device Address
must be set in the Main/Remote/GPIB menu.
Communicating with USB
PPM100 supports USB (Universal Serial Bus) communication with PCs. The USB
interface makes setup and communication very simple. Simply connect the USB cable
between the PPM100 and USB port on the computer, download the required drivers into
your computer, power up the PPM100, and hardware setup is finished.
Consult the USB Setup section at the end of this chapter for details.
PPM100 Partial Pressure Monitor
6-12 Remote Programming
Screen Indicators And Queues
To assist in programming, the PPM100 has an interface activity indicator displayed in the
upper right corner of the screen (next to the time). The arrow symbol flashes whenever
there is interface activity (transmit or receive). The X symbol indicates a computer
interface error has occurred, such as an illegal command or out of range parameter is
received. The SRQ indicator is on when the PPM100 generates a GPIB service request.
SRQ stays on until a GPIB serial poll is completed.
To help find program errors, the PPM100 can display the interface buffers on the screen.
This screen is accessed by touching [Queue] in the Main/Remote/RS-232, GPIB or USB
menus. The Queue display may slow down communications and should be displayed
only when testing or debugging a host program. Press a QuickKey to exit from this
display.
The upper half of the Queue display is the Receive Queue. These are the most recent
characters which have been received by the PPM100 (displayed in all UPPER case).
Commands which have already been executed are shown in normal text. Commands
which have not yet been executed are shown with a gray background. Command errors
are shown in inverse text.
The lower half of the Queue display is the Transmit Queue. These are the most recent
characters which have been placed in the output buffer. Characters which have already
been sent over the interface are shown in normal text. Characters which are waiting to be
sent are shown with a gray background.
Command Format
Communications with the PPM100 uses ASCII characters. Commands may be in either
UPPER or lower case. A command to the PPM100 consists of a four character command
mnemonic with optional ?, arguments if necessary, and a command terminator. The
command, arguments and terminator may be separated by spaces. The terminator must be
a linefeed <lf> or carriage return <cr> on RS-232 and USB, or a linefeed <lf> or EOI on
GPIB. No command processing occurs until a terminator is received. Commands function
identically on all interfaces whenever possible. Command mnemonics beginning with an
asterisk '*' are IEEE-488.2 (1987) defined common commands. These commands also
function identically on RS-232 and USB whenever possible. Commands may require one
or more parameters. Multiple parameters are separated by commas (,).
Multiple commands may be sent on one command line by separating them with
semicolons (;). In this case, no commands are executed until a terminator is received.
There is no need to wait between commands. The PPM100 has a 256 character input
buffer and processes commands in the order received. If the buffer fills up, the PPM100
will hold off handshaking on the GPIB and attempt to hold off handshaking on RS-232.
Similarly, the PPM100 has a 256 character output buffer to store output until the host
computer is ready to receive it. If either buffer overflows, both buffers are cleared and an
error reported.
PPM100 Partial Pressure Monitor
Remote Programming 6-13
The present value of a particular parameter may be determined by querying the PPM100
for its value. A query is formed by appending a question mark '?' to the command
mnemonic and omitting the desired parameter from the command. Values returned by the
PPM100 are sent as a string of ASCII characters terminated by a carriage return <cr> on
RS-232 and USB and by a line-feed <lf> on GPIB. If multiple query commands are sent
on one command line (separated by semicolons, of course), the answers will be returned
individually, each with a terminator.
Examples of Commands
GADM 4, 1 <lf>
GADM? 4 <lf>
GDAT? 1 <lf>
*IDN ? <lf>
Set Analog Port 4 to DAC output mode
Query the mode of Analog Port 4
Query the reading of PP1
Query the Device Identification String
Command Synchronization
IFC (Interface Ready, bit 7) in the Serial Poll status signals that the PPM100 is ready to
receive and execute a command. When a command is received, this bit is cleared,
indicating that command execution is in progress. No other commands will be processed
until this command is completed. Commands received during this time are stored in the
buffer to be processed later. Only GPIB serial polling will generate a response while a
command is in progress. When all pending commands have executed, the IFC bit is set
again. By checking IFC with serial polls, a host computer can ensure that all previously
sent commands have finished before sending a new command.
Since most commands execute very quickly, the host computer does not need to
continually check the IFC bit. Commands may be sent one after another and they will be
processed immediately.
However, some commands may require a long time to execute. In addition, the host
program may need to check that these operations executed without error. In these cases,
after the command is sent, the status should be queried.
When using the GPIB interface, serial polling may be used to check the IFC bit in the
Serial Poll status while an operation is in progress. After the IFC bit becomes set,
signaling the completion of the command, then the ESB (Event Status) bit may be
checked to verify successful completion of the command.
If the RS-232 or USB interface is used, or serial polling is not available, then the *STB?
query command may be used to read the Serial Poll status word. However, *STB NEVER
returns the IFC bit set (since *STB is itself a command).
Since the PPM100 processes one command at a time, status queries will not be processed
until the previous operation is finished. Thus a response to a status query in itself signals
that the previous command is finished. The query response may then be checked for
various errors.
PPM100 Partial Pressure Monitor
6-14 Remote Programming
RGA Commands
The PPM100 is capable of detecting and handling all native RGA commands. For more
information on RGA commands, see the SRS RGA Operation and Progamming Manual.
Once a valid RGA command is received by the PPM100 (over any interface), it is
immediately transmitted to the RGA (through the RGA RS-232 port) without any
changes. The responses from the RGA are also detected by the PPM100 and sent back to
the host computer over the same computer interface.
PPM100 to RGA Communication
Pending Commands
Many PPM100 commands cause the PPM100 to send commands to the RGA head (via
the RGA RS-232 port). Since the PPM100 can receive commands from the host computer
via an interface which is faster than the RGA RS-232 connection, it is possible that the
PPM100 will start to accumulate a backlog of commands for the RGA.
The RCC bit (bit 3) in the Serial Poll Status register is cleared when the PPM100 has
pending commands for the RGA. A safe way of using GPIB commands is to serial poll
until RCC becomes set between PPM100 commands to make sure that the RGA is
keeping up.
No Communication with RGA
The RGA_Com bit (bit 0) of the Gauge Status word is set whenever the PPM100 detects
a problem with the communication link to the RGA head. This includes the RGA head
power being turned off or the cable to the RGA being disconnected.
RGA Pass Through Mode
When RGA Pass Through is enabled, the PPM100 will pass ALL commands received via
the Host RS-232 port directly to the RGA and all responses from the RGA will be
transmitted from the Host RS-232 port. The Host RS-232 port is also set to emulate the
serial port on the RGA itself. This allows the host computer to run RGA Windows (or
other direct RGA software) without changing any serial cables.
Once Pass Through is enabled, the PPM100 will not recognize any PPM100 commands
it receives via the Host RS-232 port. Only native RGA commands should be sent!
After using Pass Through mode, the SYNC command should be used to synchronize the
PPM100 with the RGA.
Important
The PPM100 will not perform any RGA-related activity while in Pass Through mode.
Only measurements related to the Analog ports continue.
PPM100 Partial Pressure Monitor
Remote Programming 6-15
Command Syntax
The four letter mnemonic (shown in CAPS) in each command sequence specifies the
command. The rest of the sequence consists of parameters. Parameters shown in { } are
not always required. Generally, parameters in { } are required to set a value in the
PPM100. Multiple parameters are separated by commas. Multiple commands may be sent
on one command line by separating them with semicolons (;).
The present value of a parameter may be determined by sending a query command.
•
Commands that MAY be queried show a question mark in parentheses (?) after the
mnemonic.
•
Commands that are ONLY queries have a '?' after the mnemonic, with no
parentheses.
•
Commands that MAY NOT be queried have no '?'.
A query is formed by including the question mark ? after the command mnemonic and
omitting the queried parameter from the command. The query parameters shown in { }
are NOT sent with a query. The query returns the value of these parameters. Values are
returned as a string of ASCII characters (unless otherwise noted).
Do NOT send ( ) or { } as part of the command.
For example, the command sequence GADM (?) i {, j} is used as follows.
GADM 1, 0
GADM ? 1
Set the Analog Port 1 to ADC Input mode.
Query the mode of Analog Port 1.
Variables are defined as follows.
i, j, d, n, p
x
s, t
integers
real number
text strings
Commands to set values which may be different for each port require the p parameter.
These values must be queried separately for each port.
All numeric variables may be expressed in integer, floating point or exponential formats
(i.e. the number five can be either 5, 5.0, or 0.5E1). Strings are sent as a sequence of
ASCII characters.
Pressure Units
The entire PPM100 operates with a SINGLE units system. All commands that query or
set pressure parameters use the global units system of the PPM100. The units may be
changed in the Main Menu or with the GPMU command.
For example, if the PPM100 units are Torr, all commands that query pressures will return
values in Torr. All commands that set pressures must send values in Torr.
PPM100 Partial Pressure Monitor
6-16 Remote Programming
All pressure parameters have minimum and maximum allowed values. These values are
converted to the current units and may not be exceeded in a command. These limits are
displayed in the entry screen when entering new values from the front panel.
WARNING!
Always use the GPMU command at the start of a program to ensure that the desired units
are in effect.
PPM100 Partial Pressure Monitor
Partial Pressure/Analog Measurement
6-17
Partial Pressure and Analog Input
Measurement Commands
GPMU (?) {n} {s}
Pressure Units
The GPMU command sets (queries) the system pressure units. The parameter n
selects the units system below, or use string s ("micron", "bar", etc.). Do not use
both n and s.
n
units
0
Torr
1
micron
2
bar
3
mbar
4
Pascal
Example
GPMU?
GPMU 1
GPMU pascal
GPBA (?) n {, p}
Data Bar Assign
The GPBA command sets (queries) the Data Bar assignments in the Pressure
Display (ID Box). The parameter n selects Upper (0), Middle (1) or Lower (2)
Data Bar and is required. The parameter p selects a source/port below.
p source
p source
p source
p source
1 PP1
5 PP5
9 CM1
13 AN1
2 PP2
6 PP6
10 CM2
14 AN2
3 PP3
7 PP7
11 CM3
15 AN3
4 PP4
8 PP8
12 CM4
16 AN4
Example
GPBA? 0
GPBA 2, 3
GPDF (?) n {, i}
Returns the pressure units n.
Sets the pressure units to microns.
Sets the pressure units to Pascal.
Returns the ID p of the upper Data Bar.
Sets the lower Data Bar to PP3.
Display Format
The GPDF command sets (queries) the Display Format of a Data Bar. The
parameter n selects Upper (0), Middle (1) or Lower (2) Data Bar and is required.
The parameter i selects a Display Format below.
i
format
i
format
0
Big Numbers
4
Auto Scaling Bar Graph
1
Trend Graph
5
Full Range Bar Graph
2
Silent Leak Trend
6
Gauge Status Information
3
Audio Leak Trend
7
Leak Rate
Examples
GPDF? 0
GPDF 2, 3
Returns the display format i of the upper Data Bar.
Sets the lower Data Bar to Full Scale Bar Graph.
PPM100 Partial Pressure Monitor
6-18 Partial Pressure/Analog Measurement
GDAT ? p
Read Source Data
The GDAT? query returns the reading from source/port p in the current units.
The parameter p selects a source below and is required.
p source
p source
p source
p source
1 PP1
5 PP5
9 CM1
13 AN1
2 PP2
6 PP6
10 CM2
14 AN2
3 PP3
7 PP7
11 CM3
15 AN3
4 PP4
8 PP8
12 CM4
16 AN4
The returned string has the form "+1.000e-009" with current units implied.
If the RGA is off or disconnected, reading a partial pressure results in an error. If
an analog port has its CM Display Off or is configured as an output, reading the
CM gauge results in an error.
Example
GDAT? 1
GDTX ? p
Read Source Data With Units
The GDTX? query returns the reading from source/port p with units. The
parameter p selects a source below and is required.
p source
p source
p source
p source
1 PP1
5 PP5
9 CM1
13 AN1
2 PP2
6 PP6
10 CM2
14 AN2
3 PP3
7 PP7
11 CM3
15 AN3
4 PP4
8 PP8
12 CM4
16 AN4
The returned string has the form "1.00-09 Torr". This string is identical to data
display on the screen.
Example
GDTX? 1
LRAT ? p
Returns the reading of PP1 in the current units.
Returns the reading of PP1 with the current unit string.
Read Leak Rate
The LRAT? query returns the leak rate for partial pressure p in the current units.
The Leak Rate Coefficient (LRCE command) must be set for this query to be
meaningful. The parameter p selects a source below and is required.
p source
p source
p source
1 PP1
5 PP5
9 CM1
2 PP2
6 PP6
10 CM2
3 PP3
7 PP7
11 CM3
4 PP4
8 PP8
12 CM4
The returned string has the form "+1.000e-007".
Example
LRAT? 1
LRCE (?) {n}
Returns the leak rate of PP1.
Leak Rate Coefficient
The LRCE command sets (queries) the Leak Rate Coefficient. The parameter n is
an integer from 1 to 3000.
Examples
LRCE?
LRCE 500
PPM100 Partial Pressure Monitor
Returns the Leak Rate Coefficient.
Sets the Leak Rate Coefficient to 500.
Partial Pressure/Analog Measurement
GDES (?) p {, s}
6-19
Gas Name/Port Location
The GDES command sets (queries) the gas name or port location string. The
parameter p selects a source below and is required. The string s is the name or
location string.
p source
p source
p source
p source
1 PP1
5 PP5
9 CM1
13 AN1
2 PP2
6 PP6
10 CM2
14 AN2
3 PP3
7 PP7
11 CM3
15 AN3
4 PP4
8 PP8
12 CM4
16 AN4
Examples
GDES 3, WATER Sets the gas name of PP3 to "WATER".
GDES? 3
Returns the gas name of PP3 ("WATER" in this case).
GSTA ? p
Source Status
The GSTA? query returns the status of source/port p. The parameter p selects a
source below and is required.
p source
p source
p source
p source
1 PP1
5 PP5
9 CM1
13 AN1
2 PP2
6 PP6
10 CM2
14 AN2
3 PP3
7 PP7
11 CM3
15 AN3
4 PP4
8 PP8
12 CM4
16 AN4
The returned value is an integer n described below.
n
description
0
The gauge is operating normally.
2
The reading is underrange.
3
The reading is overrange.
4
The reading is not yet accurate.
5
There is no data from this DAC source.
7
PPM100 is scanning and is not measuring partial pressures.
8
Another source is displaying Leak Trend, this source is disabled.
9
Source is disabled.
10
ADC is overloaded.
11
The A/D is in DAC output mode. CM gauge not running.
12
External gauge is off (Voltage < 1V).
13
External gauge shows fault condition (Voltage > 10V).
15
There is no data to display.
16
RGA filament is off.
18
No RGA detected.
19
A TTL port was used to turn the source/port off.
20
No measurement - RS232 port is in RGA Pass Through Mode
21
The controller detected a fault.
22
There is no hardware to run the source/port.
See the GSTT? command.
Example
GSTA? 9
Returns 0 if CM1 is operating normally.
PPM100 Partial Pressure Monitor
6-20 Partial Pressure/Analog Measurement
GSTT ? p
Source Status Time
The GSTT? query returns the time and date that source/port p last changed status.
The parameter p selects a source below and is required.
p source
p source
p source
p source
1 PP1
5 PP5
9 CM1
13 AN1
2 PP2
6 PP6
10 CM2
14 AN2
3 PP3
7 PP7
11 CM3
15 AN3
4 PP4
8 PP8
12 CM4
16 AN4
See the GSTA? command.
Example
GSTT? 9
OAQU ?
Returns a string of the form "13:50 05aug03".
Read Monitor Alarm Status
The OAQU? query returns an 8 bit integer corresponding to the state of the
partial pressure alarms. Bit 0 is 1 if PP1 alarm is on, bit 1 is 1 if PP2 alarm is on,
etc.
Example
OAQU?
PPM100 Partial Pressure Monitor
Returns 5 if PP1 and PP3 alarms are on.
PPM Monitor Setup 6-21
PPM Monitor Setup Commands
PCME (?) p {, i}
PPM Measurement Enable
The PCME command sets (queries) the PPM Measurement mode
(enabled/disabled) for partial pressure monitor p. The parameter p selects PP1 (1)
through PP8 (8) and is required. The parameter i selects disabled (0) or
enabled (1).
Examples
PCME? 2
PCME 2, 1
MAME (?) p {, n}
Returns the Measurement Enable state (0 or 1) of PP2.
Enable PP2 measurement.
PPM Mass
The MAME command sets (queries) the mass for partial pressure monitor p. The
parameter p selects PP1 (1) through PP8 (8) and is required. The parameter n is
the mass in AMU (1-300).
Note
The actual mass range is determined by the model of RGA connected to the
PPM100.
Examples
MAME? 1
MAME 1, 18
GDES (?) p {, s}
Returns the mass of PP1.
Sets the mass of PP1 to 18 AMU.
Gas Name/Port Location
The GDES command sets (queries) the gas name or port location string. The
parameter p selects a source below and is required. The string s is the name or
location string.
p source
p source
p source
p source
1 PP1
5 PP5
9 CM1
13 AN1
2 PP2
6 PP6
10 CM2
14 AN2
3 PP3
7 PP7
11 CM3
15 AN3
4 PP4
8 PP8
12 CM4
16 AN4
Examples
GDES 3, WATER Sets the gas name of PP3 to "WATER".
GDES? 3
Returns the gas name of PP3 ("WATER" in this case).
SMCF (?) p {, x}
Gas Correction Factor
The SMCF command sets (queries) the Correction Factor for partial pressure
monitor p. The parameter p selects PP1 (1) through PP8 (8) and is required. The
parameter x is the Correction Factor (unitless).
Examples
SMCF? 2
SMCF 2, 1.8
Returns the Correction Factor x of PP2.
Sets the PP2 Correction Factor to 1.8.
PPM100 Partial Pressure Monitor
6-22 PPM Monitor Setup
SVGL (?) p {, i}
Set Gas via Library
The SVGL command sets (queries) the Gas Name and Mass via Library for
partial pressure monitor p. The parameter p selects PP1 (1) through PP8 (8) and
is required. The parameter i selects a library entry below.
i
input
i
input
0
hydrogen
6
pump oil
1
helium
7
carbon dioxide
2
water
8
methane
3
nitrogen
9
neon
4
oxygen
10
krypton
5
argon
11
unknown
Examples
SVGL? 5
SVGL 5, 4
NFTM (?) p {, n}
PPM Scan Rate
The NFTM command sets (queries) the Scan Rate for partial pressure monitor p.
The parameter p selects PP1 (1) through PP8 (8) and is required. The parameter n
is the Scan Rate (1-8).
Examples
NFTM? 8
MAME 8, 5
HVTM (?) p {, i}
Returns the Detector setting (0 or 1) of PP4.
Set PP4 to use the CDEM detector.
PPM Alarm Enable
The OAEN command sets (queries) the PPM Alarm mode (enabled/disabled) for
partial pressure monitor p. The parameter p selects PP1 (1) through PP8 (8) and
is required. The parameter i selects disabled (0) or enabled (1).
Examples
OAEN? 2
OAEN 2, 1
OALH (?) p {, x}
Returns the Scan Rate n of PP8.
Sets the Scan Rate of PP8 to 5.
PPM Detector
The HVTM command sets (queries) the PPM Detector for partial pressure
monitor p. The parameter p selects PP1 (1) through PP8 (8) and is required. The
parameter i selects Faraday Cup (0) or Electron Multipler (1).
Examples
HVTM? 4
HVTM 4, 1
OAEN (?) p {, i}
Returns the library entry used by PP5.
Sets the name and mass of PP5 to oxygen.
Returns the Alarm Enable state (0 or 1) of PP2.
Enable PP2 Alarm.
Alarm Level High
The OALH command sets (queries) the Alarm High Level of partial pressure
monitor p. The parameter p selects PP1 (1) through PP8 (8) and is required. The
parameter x is the Alarm High Level expressed in the current system units.
Examples
OALH? 1
OALH 1, 1.2E-3
PPM100 Partial Pressure Monitor
Returns the Alarm High Level for PP1 in the current units.
Set the Alarm High Level for PP1 to 0.0012 in current units.
PPM Monitor Setup 6-23
OALL (?) p {, x}
Alarm Level Low
The OALL command sets (queries) the Alarm Low Level of partial pressure
monitor p. The parameter p selects PP1 (1) through PP8 (8) and is required. The
parameter x is the Alarm Low Level expressed in the current system units.
Examples
OALL? 1
OALL 1, 3.4E-5
OABP (?) p {, i}
Returns the Alarm Low Level for PP1 in the current units.
Sets the Alarm Low Level for PP1 to 0.000034 in the current
units.
Alarm Beep
The OABP command sets (queries) the Alarm Beep mode (on/off) of partial
pressure monitor p. The parameter p selects PP1 (1) through PP8 (8) and is
required. The parameter i selects off (0) or on (1).
Examples
OABP? 1
Returns the Alarm Beep mode for PP1.
OABP 1, 0
Sets the Alarm Beep mode for PP1 to off.
PPM100 Partial Pressure Monitor
6-24 Analog IO Setup
Analog I/O Setup Commands
GADM (?) n {, i}
I/O Mode
The GADM command sets (queries) the I/O Mode of analog port n. The
parameter n (1-4) selects AN1-AN4 and is required. The parameter i selects ADC
Input (0) or DAC Output (1).
Examples
GADM? 4
GADM 4, 1
GDAS (?) n {, i}
DAC Source
The GDAS command sets (queries) the DAC Source for analog port n. The
parameter n (1-4) selects AN1-AN4 and is required. The parameter i selects
Manual (0) or PP1-PP8 (1-8).
Examples
GDAS? 1
GDAS 1, 2
GCMM (?) n {, i}
Returns the CM Mode for AN1.
Sets the CM Mode for AN1 to Linear.
Output Value
The GDAV command sets (queries) the DAC output value for analog port n. This
is the output voltage when the analog port is a DAC Output and the DAC Source
is Manual. The parameter n (1-4) selects AN1-AN4 and is required. The
parameter x is an output voltage (in Volts).
Examples
GDAV? 1
GDAV 1, 2.5
CMPX (?) n {, x}
Returns the AN1 DAC Source i.
Sets the AN1 DAC Source to PP2.
CM Mode
The GCMM command sets (queries) the CM Mode for analog port n. The
parameter n (1-4) selects AN1-AN4 and is required. The parameter i selects
Off (0), Linear (1) or Log (2).
Examples
GCMM? 1
GCMM 1, 1
GDAV (?) n {, x}
Returns the AN4 I/O Mode i.
Sets AN4 into DAC Output mode.
Returns the AN1 DAC output value in Volts.
Sets the AN1 DAC output value to 2.5 V.
CM PMax
The CMPX command sets (queries) the Maximum Pressure (Pmax) of
capacitance manometer n (1-4 for CM1-4). The parameter x is the pressure Pmax
in the current units.
Examples
CMPX 1, 100.0
CMPX? 1
PPM100 Partial Pressure Monitor
Set Pmax of CM1 to 100.0 in the current units.
Return the value of Pmax for CM1 in the current units.
RGA 6-25
RGA Commands
These commands set and query settings inside the RGA head. For more information about these
parameters, please see the RGA manual. Communication between the PPM100 Controller and the RGA
head may be slower than the host PC interface to the PPM100 so allow time for these commands to
execute. Sending many RGA commands in quick succession may cause the RGA to fall behind and the
PPM100 to abort pending commands.
MAXM ?
Read RGA Mass Range
The MAXM? query returns the mass range of the RGA, either 100, 200 or 300
(amu).
Example
MAXM?
RGAI ?
Read RGA Identification
The RGAI? query returns the RGA identification string. This string has the form
"SRSRGA300VER0.24SN08560". The string contains the RGA model number,
firmware version and serial number.
Example
RGAI?
EEEV (?) {n}
Returns the Electron Energy in eV.
Sets the Electron Energy to 100 eV.
Ion Energy
The IEEV command sets (queries) the Ion Energy. The parameter i selects
Low 8eV (0) or High 12eV (1). The default is High (1).
Examples
IEEV?
IEEV 1
FOPV (?) {n}
Returns the RGA ID string.
Electron Energy
The EEEV command sets (queries) the Electron Energy in eV. The parameter n
is an integer (25-105) with units of eV. The default is 70.
Examples
EEEV?
EEEV 100
IEEV (?) {i}
Returns 300 for an RGA300.
Returns the Ion Energy setting (0 or 1).
Sets the Ion Energy to High 12eV.
Focus Voltage
The FOPV command sets (queries) the Focus Voltage. The parameter n is an
integer (0-150) with units of Volts. The default is 90.
Examples
FOPV?
FOPV 90
Returns the Focus Voltage in Volts.
Sets the Focus Voltage to 90 Volts.
PPM100 Partial Pressure Monitor
6-26 RGA
SCRA (?) {n}
Scan Rate
The SCRA command sets (queries) the Scan Rate. The parameter n is an integer
(1-8). The default is 5.
Examples
SCRA?
SCRA 3
ECMA (?) {x}
Returns the Scan Rate (1-8).
Sets the Scan Rate to 3.
Electron Current
The ECMA command sets (queries) the Electron Current. The parameter x
(0.02-3.5) is the current in mA. The default is 1.00.
Examples
ECMA?
ECMA 1.5
EMIS (?) {i}
Returns the Electron Current in mA.
Sets the Electron Current to 1.5 mA.
RGA Filament Emission On/Off
The EMIS command turns RGA Filament Emission On (i=1) or Off (i=0). This
command duplicates the function of the 'FILAMENT' button on the front panel.
EMIS? queries whether the RGA Filament is on or off.
Turning Filament Emission OFF will cancel any pending commands to the RGA.
If commands changing RGA settings immediately precede the EMIS 0
command, they may not be executed. Verify the RGA settings before turning
emission on again.
Examples
EMIS?
EMIS 1
ENEM (?) {i}
RGA Scan Electron Multiplier On/Off
The ENEM command turns the RGA Scan Electron Multiplier On (i=1) or Off
(i=0). This command duplicates the function of the 'E. MULTIPLIER' button on
the front panel. ENEM? queries whether the RGA Scan Electron Multiplier is on
or off.
The RGA Scan Electron Multiplier may only be turned on during analog scans
(MassSpec Display).
Examples
ENEM?
ENEM 1
EMBV (?) {n}
Returns 1 if RGA Filament is on, 0 if off.
Turns RGA Filament on.
Returns 1 if RGA Electron Multiplier is on, 0 if off.
Turns RGA Electron Multiplier on.
RGA Electron Multiplier Bias Voltage
The EMBV command sets (queries) the electron multiplier bias voltage. The
parameter n is the bias voltage in Volts (0 or 10-2490). The default is 1400.
This command fails if the RGA does not have an electron multiplier.
Examples
EMBV?
EMBV 1000
PPM100 Partial Pressure Monitor
Returns electron multiplier bias in volts.
Sets the electron multiplier bias to 1000 Volts.
RGA 6-27
EREQ (?) {i}
Ionization Source
The EREQ command sets (queries) the RGA Ionization Source to RGA Filament
(i=1) or External (i=0). If set to RGA Filament, the PPM100 will not measure
pressures without RGA filament emission being on.
Examples
EREQ?
EREQ 1
IRFE (?) {i}
RF7 Error Handling
The IRFE command sets (queries) the RF7 Error Handling to Ignore (i=1) or
Warn (i=0). If set to Ignore, the PPM100 will ignore the RF7 error from 300
AMU RGA units.
Examples
IRFE?
IRFE 1
LRER (?) {0}
Returns RGA Ionization Source (0 or 1).
Sets RGA Ionization Source to RGA Filament.
Returns 1 if Ignore RF7, 0 if Warn on RF7.
Sets RF7 Error Handling to Ignore.
Last RGA Error
If the PPM100 encounters an RGA status error code while running or scanning it
will halt and briefly display an error message. The LRER? query returns the
code (i) for that message. This code is cleared by the LRER 0 command.
description
i
name
0
No error
1
Unknown error
2
RS6
RS232 parameter conflict
3
RS1
Bad RS232 parameter
4
RS4
RS232 transmit buffer overwrite
5
RS3
RS232 receive buffer overwrite
6
RS0
Bad RS232 command
7
RS2
RS232 command too long
8
RS5
RS232 jumper protection violation
9
EM7
The RGA doesn't have an electron multiplier
10
DET1
Electrometer op-amp input voltage out of range
11
DET3
Electrometer compensate can't read -5nA
12
DET4
Electrometer compensate can't read +5nA
13
DET5
Electrometer detect can't read -5nA
14
DET6
Electrometer detect can't read +5nA
15
DET7
Electrometer ADC failure
16
FL0
Single filament operation
17
FL5
Vacuum chamber pressure too high
18
FL6
Filament unable to set requested emission current
19
FL7
No filament detected
20
RF4
RF power supply in current limit mode
21
RF6
RF power supply current >2.0A
22
RF7
RF power supply RF_CT exceeds limit.
23
PS6
External 24V power supply <22V
24
PS7
External 24V power supply >26V
Examples
LRER?
LRER 0
Return RGA error code i.
Clear the last RGA error.
PPM100 Partial Pressure Monitor
6-28 RGA
PASS (?) {i}
RGA Pass Through
The PASS command sets the RGA Pass Through to Normal Operation (i=0) or
Pass Through (i=1). If set to Pass Through, the PPM100 will pass all characters
received via the Host RS-232 port directly to the RGA and all responses from the
RGA will be transmitted from the Host RS-232 port. The Host RS-232 port is
also set to emulate the serial port on the RGA itself. This allows the host
computer to run RGA Windows (or other direct RGA software) without changing
any serial cables.
This command should not be used over the RS-232 interface. Once Pass Through
is enabled, the PPM100 will not recognize any PPM100 commands it receives
via the Host RS-232 port, thus the PASS 0 command will not work to restore
normal PPM100 operation. Use the USB or GPIB port to issue the PASS 0
command or restore normal operation via the front panel.
When PASS 0 is used to return to normal mode, the Host RS-232 port settings
are not restored to their previous settings.
After using PASS 0, the SYNC? query should be used to synchronize the
PPM100 with the RGA.
Important
The PPM100 will not perform any RGA-related activity while in Pass Through
mode. Only measurements related to the Analog ports continues.
Examples
PASS?
PASS 1
SYNC?
Returns the RGA Pass Through Mode.
Enable the RGA Pass Through Mode.
RGA SYNC
The SYNC? query is used when beginning a remote session. SYNC? forces the
settings of the PPM100 to match those of the RGA. This is important if the
PPM100 has been in RGA Pass-Through mode (running RGA Windows for
example) and the RGA settings have been changed without the PPM100 knowing
about it. If the RGA has only been under PPM100 control, then SYNC? is
unnecessary.
The SYNC? query takes up to 30 seconds to complete. SYNC? returns the value
of the RGA status byte (see the RGA manual for details).
Important
Do not send any other RGA commands until the response to SYNC? has been
received!
Another way to accomplish the same thing is to run an initialization routine
which sets every parameter in the PPM100 that is required for the measurement.
This will ensure that the RGA settings are in agreement with the PPM100.
Example
SYNC?
PPM100 Partial Pressure Monitor
Synchronize the PPM100 with the RGA and return the RGA
status byte.
RGA 6-29
Warning!
The following commands (CALL, CEIV and DGAS) all interrupt PPM100 partial pressure
measurements. All process channels must be set to a safe manual state, either Active or Inactive, prior to
calibrating or degassing the RGA.
CALL ?
Calibrate RGA Detectors
The CALL? query calibrates all RGA detectors and returns the RGA status when
complete. See the RGA manual for details. This process takes about a minute and
no other commands to the RGA should be sent during this time.
Note
This corresponds to the RGA's CA command.
Example
CALL?
CEIV ?
Perform detector calibration and return the RGA status.
Calibrate RGA Electrometer
The CEIV? query calibrates the RGA electrometer's I-V response and returns the
RGA status when complete. See the RGA manual for details. This process takes
about a minute and no other commands to the RGA should be sent during this
time.
Note
This corresponds to the RGA's CL command and the Calibrate Electrometer
button in the RGA menu.
Example
CEIV?
DGAS (?) {i}
Perform electrometer calibration and return the RGA status.
Degas On/Off
The DGAS i command turns RGA Degas On (i=1) or Off (i=0). DGAS? queries
whether degas is on or off.
DGAS 1 will turn Degas On. If no other command is sent to the RGA then degas
will last 3 minutes and then turn off. If DGAS 0 or another RGA command is
sent before 3 minutes, degas will turn off immediately.
Examples
DGAS?
DGAS 1
Returns 1 if RGA Degas is on, 0 if Degas is off.
Turns RGA Degas on.
PPM100 Partial Pressure Monitor
6-30 Logging and Charts
Logging Commands
PLDS (?) {i}
Chart/Table Display
The PLDS command sets (queries) the Data Log Display to Chart (i=0) or Table
(i=1).
Examples
PLDS?
PLDS 0
PLCL
Returns 0 for Chart and 1 for Table.
Sets the Log Display to Chart.
Clear Data Log
The PLCL command clears the Data Log. All entries in the Data Log are lost
after sending the PLCL command.
Example
PLCL
PLGF ?
PLGN ?
Clear the Data Log.
Read Data Log
The PPM100 logs all pressure/analog/process readings in the Data Log. To read
the log, use the PLGF? query to return the most recent entry in the log. Then
issue PLGN? repeatedly to get the rest of the entries, until the string "&" is
returned, signaling that all entries have been read.
This command pair retrieves the log as it was when the PLGF? command was
received. Log entries created while you download the log do not appear in it. If
you try to retrieve history over two interfaces at the same time you will not get
the complete history on either.
WARNING!
The Embedded Web Server continually issues PLGF and PLGN. If you have the
web server option, you must disable it (from the Remote/Web menu or with the
WSEN command) to use these commands.
These commands return a string with the following fields separated by commas:
•
•
Date in DDMMYY format "06oct03".
Time in 24 hour format "16:42".
•
•
•
PP1 data.
PP2 data.
PP3 data.
•
•
PP4 data.
PP5 data.
•
•
•
PP6 data.
PP7 data.
PP8 data.
•
•
CM1 data.
CM2 data.
PPM100 Partial Pressure Monitor
Logging and Charts 6-31
•
CM3 data.
•
CM4 data.
•
AN1 data.
•
AN2 data.
•
AN3 data.
•
AN4 data.
•
Process control bitfield. The first digit is channel 8, the last digit is
channel 1. A '1' means the channel is active, '0' means inactive.
•
TTL input bitfield. The first digit is channel 8, the last digit is
channel 1. A '1' means the input is high, '0' means low.
Data that isn’t available shows up as an asterix '*'.
All pressure readings are expressed in the current units. All ADC inputs are in
Volts.
Example
The returned string
"06oct03,16:42,1.64-06,*,*,2.34-01,*,*,*,*,
1.2-02,*,*,*0.046,7.34,-0.029,-0.029,
00000100,1111111"
has the following interpretation:
PLIN (?) {n}
•
•
•
This data was sampled at 4:42 PM on October 6, 2003.
PP1 read 1.64e-6 in the current units.
PP2 and PP3 were off (no data available).
•
•
PP4 read 2.34e-1 in the current units.
PP5 through PP8 were off.
•
•
•
CM1 read 1.2e-3 in the current units.
CM2 through CM4 were off.
AN1 read 0.046V.
•
•
AN2 read 7.34 V.
AN3 and 4 read –0.029 V
•
•
Process control channel 3 is active, all others are inactive.
All Process TTL inputs are high (inactive).
Logging Interval
The PLIN command sets (queries) the Logging Interval. The parameter n is the
Logging Interval in milliseconds. This command will change the Log Length as
well.
Note
Times are stored in milliseconds, but this timer is only accurate to within a
second.
Examples
PLIN?
PLIN 60000
Returns the Logging Interval n in ms.
Sets the Logging Interval to 1 minute (60,000 ms).
PPM100 Partial Pressure Monitor
6-32 Logging and Charts
PLWT (?) {n}
Log Length
The PLWT command sets (queries) the Log Length. The parameter n is the Log
Length in seconds. This command will change the Logging Interval.
Examples
PLWT?
PLWT 3600
PLEN (?) {i}
Returns the Log Length n in seconds.
Sets the Log Length to 1 hours (3600 sec).
Logging Enable
The PLEN command sets (queries) whether Data Logging is enabled. The
parameter i selects Log/Enabled (1) or Pause/Disabled (0).
Examples
PLEN?
PLEN 1
PLDD (?) {i}
Returns 1 if logging is enabled, 0 if disabled.
Turns data logging on.
Display Date
The PLDD command sets (queries) whether Date Display (in Table display
format) is Enabled (i=1) or Disabled (i=0).
Examples
PLDD?
PLDD 1
PLTR (?) {i}
Returns 1 if Date Display is enabled, 0 if disabled.
Turns Date Display on.
TTL Reset Enable
The PLTR command sets (queries) whether the TTL Log Reset input is Enabled
(i=1) or Disabled (i=0).
Examples
PLTR?
PLTR 1
PPM100 Partial Pressure Monitor
Returns 1 if TTL Log Reset input is enabled, 0 if disabled.
Enables TTL Log Reset input.
Logging and Charts 6-33
Charting Commands
LCPN (?) {x}
Chart/MassSpec Pmin
The LCPN command sets (queries) the value of the Chart/MassSpec Y-Axis
Pmin. The parameter x is a pressure expressed in the current units.
Examples
LCPN?
LCPN 1.3e-10
LCPX (?) {x}
Chart/MassSpec Pmax
The LCPX command sets (queries) the value of the Chart/MassSpec Y-Axis
Pmax. The parameter x is a pressure expressed in the current units.
Examples
LCPX?
LCPX 1.3e-6
LCVN (?) {x}
Returns the value of Pmin in the current pressure units.
Sets Pmin to 1.3x10⁻¹⁰ in the current units..
Returns the value of Pmax in the current pressure units.
Sets Pmax to 1.3x10⁻⁶ in the current units.
Vmin
The LCVN command sets (queries) the value of the Chart Y-Axis Vmin. The
parameter x is expressed in Volts.
Examples
LCVN?
LCVN -10.0
LCVX (?) {x}
Vmax
The LCVX command sets (queries) the value of the Chart Y-Axis Vmax. The
parameter x is expressed in Volts.
Examples
LCVX?
LCVX 10.0
LCSA
Returns the value of Vmin in Volts.
Sets Vmin to -10.0 Volts.
Returns the value of Vmax in Volts.
Sets Vmax to +10.0 Volts.
Autoscale Chart Y-Axis
The LCSA command Autoscales the Chart Y-Axis. This command has no effect
unless the chart display is on the screen. This command has no parameters and no
query.
Example
LCSA
LCRG (?) {n}
Autoscale the Chart display.
Time Range
The LCRG command sets (queries) the Chart X-Axis Time Range. The
parameter n is a number of seconds ≥ 60.
Examples
LCRG?
LCRG 600
Returns the X-Axis Time Range in seconds.
Sets the X-Axis Time Range to 10 minutes (600 s).
PPM100 Partial Pressure Monitor
6-34 Logging and Charts
LCSF
Scale X-Axis to Full
The LCSF command Scales the X-Axis to Full. This sets Time Range to display
all of the data in the log. This command has no effect unless the chart display is
on the screen. This command has no parameters and no query.
Example
LCSF
PPM100 Partial Pressure Monitor
Set the X-Axis to the full log.
MassSpec Display 6-35
Mass Spectrum Display Commands
SCOK ?
Analog Scan OK
The SCOK? query returns 1 if the prerequisites for turning on the MassSpec
Display exist. These include
•
connection to RGA
•
PPM100 and RGA operating normally with measurement enabled
•
all process control channels in manual mode (active or inactive)
• filament emission on or RGA set to use an external ion source
If any of these conditions is not met, then SCOK? returns 0.
If SCOK? returns 1, then use the MENU5 command (below) to turn on the
MassSpec Display. If SCOK? returns 0, then the MENU5 command will NOT
turn on the MassSpec Display.
MENU (?) d
Display Screen
The MENU command changes (queries) the screen display. The parameter d
selects a display listed below.
d
display
d
display
0
Pressure Display
4
Table Display
1
Monitor Display
5
MassSpec Display
2
Process Display
6
Analog I/O Display
3
Chart Display
Use the MENU 5 command to show the MassSpec display and start analog RGA
scanning.
Example
MENU 5
SCMF (?) {n}
MassSpec Final Mass
The SSPM command sets (queries) the Final Mass for the MassSpec display
analog scan. The parameter n is the mass in AMU, from 1 to the RGA max (100,
200 or 300). The default is 50.
Examples
SCMF?
SCMF 100
SCMI (?) {n}
Shows the MassSpec Display on the screen.
Returns the Final Mass.
Sets the Final Mass to 100 AMU.
MassSpec Initial Mass
The SSTM command sets (queries) the Initial Mass for the MassSpec display
analog scan. The parameter n is the mass in AMU, from 1 to the Final Mass-1.
The default is 1.
Examples
SCMI?
SCMI 1
Returns the Initial Mass.
Sets the Initial Mass to 1 AMU.
PPM100 Partial Pressure Monitor
6-36 MassSpec Display
SCAN (?) {i}
Analog Scan On/Off
The SCAN 1 command starts analog scanning in the MassSpec display. Any
current scan is aborted, the scan data is lost and a new scan is started.
The SCAN 0 command stops analog scanning in the MassSpec display. Current
scan data is preserved until scanning is started again.
These commands have an effect only when the PPM100 is in the MassSpec
display.
The SCAN? query returns 1 is a scan is in progress, 0 is not.
Example
SCAN 1
SCAN?
OSCC ?
MassSpec Complete
The OSCC? query returns 1 if a MassSpec has been completed (a complete Mass
Spectrum is available) and 0 otherwise. Use the OSCC? query to determine
whether mass spectrum data is available for all masses in the scan range before
attempting to read the data.
Example
OSCC?
LCPN (?) {x}
Start analog scanning (in MassSpec Display only).
Returns 1 is a scan is in progress.
Returns 1 if a complete Mass Spectrum is available.
Chart/MassSpec Pmin
The LCPN command sets (queries) the value of the Chart/MassSpec Y-Axis
Pmin. The parameter x is a pressure expressed in the current units.
Examples
LCPN?
LCPN 1.3e-10
LCPX (?) {x}
Chart/MassSpec Pmax
The LCPX command sets (queries) the value of the Chart/MassSpec Y-Axis
Pmax. The parameter x is a pressure expressed in the current units.
Examples
LCPX?
LCPX 1.3e-6
SYSA
Returns the value of Pmin in the current pressure units.
Sets Pmin to 1.3x10⁻¹⁰ in the current units..
Returns the value of Pmax in the current pressure units.
Sets Pmax to 1.3x10⁻⁶ in the current units.
Autoscale MassSpec Y-Axis
The SYSA command Autoscales the MassSpec Y-Axis. This command has no
effect unless the MassSpec display is on the screen. This command has no
parameters and no query.
Example
SYSA
PPM100 Partial Pressure Monitor
Autoscale the Y-Axis in the MassSpec Display.
MassSpec Display 6-37
CTOM (?) {n}
Move MassSpec Cursor
The CTOM command sets (queries) the cursor position for the MassSpec display
analog scan. The parameter n is a mass in AMU (1-300).
Note
If the desired position is not within the current scan, the cursor will be placed at
the edge of the display.
Example
CTOM?
CTOM 18
MACB ?
Returns the Cursor mass position.
Sets the Cursor mass position to 18 AMU.
Read MassSpec Mass
The MACB? query returns the exact location of the highest peak within a 1 AMU
wide region centered on the cursor position (as set by the CTOM command).
Note
Use this command only if a MassSpec is complete (as indicated by the OSCC?
query).
Example
MACB?
PACB ?
Returns the exact mass position of the highest peak within
±0.5AMU of the cursor postion.
Read MassSpec Peak
The PACB? query returns the highest pressure within a 1 AMU wide region
centered on the cursor position (as set by the CTOM command).
Note
Use this command only if a MassSpec is complete (as indicated by the OSCC?
query).
Example
PACB?
Returns the highest pressure within ±0.5AMU of the cursor
postion.
PPM100 Partial Pressure Monitor
6-38 Process Control
Process Control Commands
RDES (?) d {, s}
Channel Description
The RDES command sets (queries) the process channel Description string. The
parameter d selects a process channel (1-8) and is required. The string s is the
channel description.
Examples
RDES 3, pump
RDES? 3
RLCL (?) d {, s}
Channel Active Message
The RLCL command sets (queries) the process channel Active Message. The
parameter d selects a process channel (1-8) and is required. The string s is the
label.
Examples
RLCL 1, on
RLCL? 1
RLOP (?) d {, s}
Sets the Description of process channel 3 to "PUMP".
Returns the Description of channel 3 ("PUMP" in this case).
Sets the Active Label of process channel 1 to "ON".
Returns the Active Label of channel 1 ("ON" in this case).
Channel Inactive Message
The RLOP command sets (queries) the process channel Inactive Message. The
parameter d selects a process channel (1-8) and is required. The string s is the
label.
Examples
RLOP 1, off
RLOP? 1
RBEP (?) d {, i}
Channel Beep
The RBEP command sets (queries) whether the Beep (channel audio alert) is On
(i=1) or Off (i=0). The parameter d selects a process channel (1-8) and is
required.
Examples
RBEP? 1
RBEP 1, 1
RMOD (?) d {, i}
Sets the Inactive Label of process channel 1 to "OFF".
Returns the Inactive Label of channel 1 ("OFF" in this case).
Returns 1 if channel 1 Beep is on, 0 if off.
Turns channel 1 Beep on.
Channel Mode
The RMOD command sets (queries) whether the mode of process channel d is
Auto (i=1) or Manual (i=0). The parameter d selects a process channel (1-8) and
is required. If the channel is Auto, its state is controlled by its process rules. If the
channel is Manual, use the RSTA to set the channel state active or inactive.
Examples
RMOD? 2
RMOD 2, 1
PPM100 Partial Pressure Monitor
Returns 1 if channel 2 is Auto, 0 if Manual.
Sets channel 2 to Auto mode.
Process Control 6-39
RSTA (?) d {, i}
Channel State
The RSTA command sets (queries) the state of process channel d when its mode
is Manual. The parameter d selects a process channel (1-8) and is required. The
parameter i selects Inactive (0) or Active (1). This command requires that
channel d is in Manual mode (RMOD command).
Examples
RSTA? 7
RSTA 7, 0
RAMS (?) d {, i}
Channel Input
The RAMS command sets (queries) the process control input (channel Linked
To) for process channel d. The parameter d selects a process channel (1-8) and is
required. The parameter i selects a control input below.
i
input
i
input
i
input
0
PP1
8
CM1
16
PPM alarm
1
PP2
9
CM2
17
Clock
2
PP3
10
CM3
18
TTL pin
3
PP4
11
CM4
4
PP5
12
AN1
5
PP6
13
AN2
6
PP7
14
AN3
7
PP8
15
AN4
Examples
RAMS? 2
RAMS 2, 3
RGOS (?) d {, i}
Returns the control input i for process channel 2.
Sets the control input for channel 2 to PP4.
Gauge Off State
The RGOS command sets (queries) the Gauge Off State for process channel d.
The parameter d selects a process channel (1-8) and is required. The parameter i
selects Inactive (0) or Active (1).
Examples
RGOS? 2
RGOS 2, 1
RTRP (?) d {, x}
Returns 0 if channel 7 is Inactive, 1 if Active.
Deactivates process control channel 7.
Returns 1 if channel 2 Gauge Off State is Active, 0 if
Inactive.
Sets channel 2 Gauge Off State to Active.
Pressure Setpoint
The RTRP command sets (queries) the Pressure Setpoint for process channel d.
The parameter d selects a process channel (1-8) and is required. The parameter x
is the Pressure Setpoint expressed in the current units.
Examples
RTRP? 8
RTRP 8, 1.0e-3
Returns the Pressure Setpoint for channel 8 in the current
units.
Sets the Pressure Setpoint for channel 8 to 1.0x10⁻³ in the
current units.
PPM100 Partial Pressure Monitor
6-40 Process Control
RTRV (?) d {, x}
Voltage Setpoint
The RTRV command sets (queries) the Voltage Setpoint for process channel d.
The parameter d selects a process channel (1-8) and is required. The parameter x
is the Voltage Setpoint in Volts.
Examples
RTRP? 8
RTRP 8, 5.2
RPHY (?) d {, n}
Percent Hysteresis
The RPHY command sets (queries) the Percent Hysteresis for process channel d.
The parameter d selects a process channel (1-8) and is required. The parameter n
is the hysteresis percentage.
Examples
RPHY? 8
RPHY 8, 10
RVHY (?) d {, x}
Returns the hysteresis percentage for channel 8.
Sets the Voltage Hysteresis for channel 8 to 1.2V.
Setpoint Activation
The RPOL command sets (queries) the Setpoint Activation for process channel d.
The parameter d selects a process channel (1-8) and is required. The parameter i
selects Active Below (0) or Above (1).
Examples
RPOL? 6
RPOL 6, 1
RDEL (?) d {, n}
Returns the hysteresis percentage for channel 8.
Sets the Setpoint Hysteresis for channel 8 to 10%.
Voltage Hysteresis
The RVHY command sets (queries) the Voltage Hysteresis for process channel d.
The parameter d selects a process channel (1-8) and is required. The parameter x
is the hysteresis voltage.
Examples
RVHY? 8
RVHY 8, 1.2
RPOL (?) d {, i}
Returns the Voltage Setpoint for channel 8 in Volts.
Sets the Voltage Setpoint for channel 8 to 5.2 V.
Returns 1 if channel 6 is active Above, 0 if Below.
Sets channel 6 to Active Above the setpoint.
Setpoint Delay
The RDEL command sets (queries) the Setpoint Delay for process channel d. The
parameter d selects a process channel (1-8) and is required. The parameter n is
the Delay in milliseconds.
Note
Times are stored in milliseconds, but this timer is only accurate to within a
second.
Examples
RDEL? 5
RDEL 5, 10000
PPM100 Partial Pressure Monitor
Returns the Setpoint Delay of channel 5 in ms.
Sets Setpoint Delay of channel 5 to 10 seconds (10,000 ms).
Process Control 6-41
RTCL (?) d {,n} {,s} Activation Time
The RTCL command sets (queries) the Activation Time of day for process
channel d. The parameter d selects a process channel (1-8) and is required. The
parameter n is the time of day in milliseconds from midnight or the string s is the
time in the format "9:30PM". Do not use both n and s in the command. The
RTCL? query returns the value n in ms.
Examples
RTCL? 4
Returns the Activation Time of channel 5 in ms.
RTCL 4, 9:30pm Sets the Activation Time of channel 4 to 9:30 PM.
RTCL 4,77400000 Sets the Activation Time of channel 4 to 77,400,000 ms after
midnight (9:30 PM).
RTOP (?) d {,n} {,s} Deactivation Time
The RTOP command sets (queries) the Deactivation Time of day for process
channel d. The parameter d selects a process channel (1-8) and is required. The
parameter n is the time of day in milliseconds from midnight or the string s is the
time in the format "9:30PM". Do not use both n and s in the command. The
RTOP? query returns the value n in ms.
Examples
RTOP? 4
Returns the Deactivation Time of channel 5 in ms.
RTOP 4, 9:30pm Sets the Deactivation Time of channel 4 to 9:30 PM.
RTOP 4,77400000 Sets the Deactivation Time of channel 4 to 77,400,000 ms
after midnight (9:30 PM).
RTIL (?) d {, i}
TTL Activation Level
The RTIL command sets (queries) the TTL Activation Level for process channel
d. The parameter d selects a process channel (1-8) and is required. The parameter
i selects Active when TTL input Low (0) or High (1).
Examples
RTIL? 3
RTIL 3, 1
Returns 1 if channel 3 is active when TTL Input High, 0 if
Low.
Sets channel 3 to active when TTL Input High.
PPM100 Partial Pressure Monitor
6-42 Process Control
TTLL ?
Read TTL Inputs
The TTLL? query returns the decimal value of a 24 bit binary number
representing the state of the process control TTL Inputs as listed below.
Each bit is 0 if the input is TTL low, and 1 if the input is TTL high. All unused
bits are 0.
bit
description
0
unused
1
unused
2
RGA_Degas_On
3
RGA_Fil_Lockout
4
RGA_Key_Disable
5
unused
6
unused
7
Clear_Data_Log
8
RGA_Remote_Enable
9
RGA_Fil_On
10
unused
11
RGA_TS_Disable
12
unused
13
unused
14
unused
15
unused
16
Process control TTL input #1
17
Process control TTL input #2
18
Process control TTL input #3
19
Process control TTL input #4
20
Process control TTL input #5
21
Process control TTL input #6
22
Process control TTL input #7
23
Process control TTL input #8
Example
If the returned value is 197136, the hex equivalent is 030210H indicating that all
bits are low except bits 4, 9, 16 and 17.
RHGF ?
RHGN ?
Read Process Log
The PPM100 logs all process control events. To read the process log, use the
RHGF? query to return the most recent entry in the log. Then issue RHGN?
repeatedly to get the rest of the entries, until the string "&" is returned, signaling
that all entries have been read.
This command pair retrieves the log as it was when the RHGF? command was
received. Log entries created while you download the log do not appear in it. If
you try to retrieve history over two interfaces at the same time you will not get
the complete history on either.
WARNING!
The Embedded Web Server continually issues RHGF and RHGN. If you have the
web server option, you must disable it (from the Remote/Web menu or with the
WSEN command) to use these commands.
PPM100 Partial Pressure Monitor
Process Control 6-43
The returned string has one of the formats below.
State or Mode change:
When a channel changes state or mode, an entry is returned with the following
format.
"<date> <time> <StateBits (LSB first)> <ModeBits (LSB first)>
<channel #> <State or Mode> <new State or Mode>"
For example, the returned string
"23jun01 12:15:49 PM 10100000 01000000 #2 Mode Auto"
indicates the date/time that channel 2 was switched to Auto mode. The first
bitfield shows 2 channels are active (1 and 3). The second bitfield shows that
only channel 2 is in Auto mode.
Another example, the returned string
"23jun01 10:42:35 AM 10000000 00000000 #1 State Active"
indicates the date/time that channel 1 switched to the Active state. The first
bitfield shows that only channel 1 is active. The second bitfield shows that no
channels are in Auto mode.
Event format:
When an event occurs, an entry is returned with the following format.
"<date> <time> <event description>"
For example, the returned string
"22may01 04:36:25 PM Instrument turned on"
indicates the date/time that the unit was turned on.
RHCL
Clear Process Log
The RHCL command clears the Process Log. All entries in the Process Log are
lost after sending the RHCL command.
Example
RHCL
RBAD ?
Clear the Process Log immediately.
Relay Failure Status
RBAD? query returns the decimal value of an 8 bit binary number representing
the state of the process control relays. Bit 0 corresponds to Channel 1 and bit 7
corresponds to Channel 8. If the bit is 0, the relay is ok. If the bit is set, the relay
is not trustworthy.
Example
RBAD?
Return the Relay Failure Status.
PPM100 Partial Pressure Monitor
6-44 Backlight
Backlight Commands
BLEN (?) {i}
Backlight Saver Enable
The BLEN command sets (queries) the Backlight Saver. The parameter i selects
Disabled (0) or Enabled (1).
Examples
BLEN?
BLEN 1
BLIT (?) {i}
Returns 1 if the Backlight Saver is Enabled, or 0 if Disabled.
Enables the Backlight Saver.
Backlight On/Off
The BLIT command sets (queries) the state of the LCD screen backlight. The
parameter i selects On (1) or Off (0).
Examples
BLIT?
BLIT 1
BLOF (?) {n} {s}
Backlight Turn-Off Time
The BLOF command sets (queries) the Backlight Turn-Off Time of day. The
parameter n is the time of day in milliseconds from midnight or the string s is the
time in the format "9:30PM". Do not use both n and s in the command. The
BLOF? query returns the value n in ms.
Examples
BLOF?
BLOF 9:30pm
BLOF 77400000
BLON (?) {n} {s}
Returns the Turn-Off Time in ms.
Sets the Turn-Off Time to 9:30 PM.
Sets the Turn-Off Time to 77,400,000 ms after midnight
(9:30PM).
Backlight Turn-On Time
The BLON command sets (queries) the Backlight Turn-On Time of day. The
parameter n is the time of day in milliseconds from midnight or the string s is the
time in the format "9:30PM". Do not use both n and s in the command. The
BLON? query returns the value n in ms.
Examples
BLON?
BLON 9:30pm
BLON 77400000
BLTD (?) {n}
Returns 1 if the backlight is On, or 0 if Off.
Turns the screen backlight On.
Returns the Turn-On Time in ms.
Sets the Turn-On Time to 9:30 PM.
Sets the Turn-On Time to 77,400,000 ms (9:30PM).
Backlight Delay
The BLTD command sets (queries) the Backlight Saver Delay. The parameter n
is the Delay in milliseconds.
Examples
BLTD?
BLTD 300000
PPM100 Partial Pressure Monitor
Returns the Backlight Saver Delay in ms.
Sets Delay to 5 minutes (300,000 ms).
System 6-45
System Commands
NAME (?) {s}
System Name
The NAME command sets (queries) the System Name. The string s is the name
and is converted to UPPER case.
Examples
NAME?
NAME my PPM
TIME (?) {s}
Returns the System Name.
Sets the Name to "MY PPM".
Time
The TIME command sets (queries) the System Time of day. The string s is the
time in the format "9:30PM" or "17:30"
Examples
TIME 9:30pm
TIME 21:30
TIME?
DATE (?) {s}
Date
The DATE command sets (queries) the System Date. The string s is the date in
the format "ddMMMyy" where "MMM" are the first 3 letters of the month (jan,
feb, mar, etc.).
Examples
DATE 23may01
DATE?
VOLC (?) {n}
Sets the system date to May 23, 2001.
Returns "23may01".
Volume
The VOLC command sets (queries) the system audio Volume. The parameter n is
the volume setting from 0 to 10.
Examples
VOLC?
VOLC 9
MENU d
Sets the system time to 9:30 PM.
Sets the system time to 9:30 PM.
Returns "21:30".
Returns the Volume setting.
Sets the Volume to 9 (loud).
Display Screen
The MENU command changes (queries) the screen display. The parameter d
selects a display listed below.
d
display
d
display
0
Pressure Display
4
Table Display
1
Monitor Display
5
MassSpec Display
2
Process Display
6
Analog I/O Display
3
Chart Display
Note
Use the SCOK? query before using MENU 5 to switch to the MassSpec Display.
Example
MENU 2
Shows the Process Display on the screen.
PPM100 Partial Pressure Monitor
6-46 System
MESG (?) {s}
Message
The MESG s command sends the message string s to the screen. The message is
cleared after about 10 seconds or may be cleared from the front panel sooner.
The MESG? query returns 1 if the message has not been cleared and 0 if it has
been cleared.
Examples
MESG warning
MESG?
DHWR ? d
Displays the message "WARNING" on the screen.
Returns 1 until the message has been cleared and then 0.
Detect Hardware
The DHWR? d command returns 1 if component d (listed below) is present, 0 if
not installed. This is a query only command.
d component
d
component
3
Process control
11 USB port
4
RS232 interface
13 Web server
10 IEEE488 (GPIB) interface
Example
DHWR? 13
Returns 1 if the Web server is installed.
*TST ?
Self-Test
The *TST ? query performs a self-test and returns 0 if the test passes.
Returned values which are warnings are listed below.
value description
0
Test pass
1
Unable to perform all tests
2
Excess load on Aux ±15 V supply
3
Relay failure
4
Communication port problem
5
RGA comm port problem
6
RS232 comm port problem
7
USB comm port problem
8
GPIB comm port problem
9
web port problem
10
calibration checksum failed
If *TST ? returns any other value, reboot the PPM100 by cycling its power (be
sure that all process channels are unconnected). If the problem persists, contact
Stanford Research Systems for further instructions.
FREV ?
Firmware Revision
The FREV? query returns the PPM100 firmware revision code.
VRDT ?
Firmware Build
The VRDT? query returns the date of the PPM100 firmware revision.
SNUM ?
Serial Number
The SNUM? query returns the unit serial number.
PPM100 Partial Pressure Monitor
Interface 6-47
Interface Commands
VERB (?) {i}
Verbose RS-232
The VERB command sets (queries) the verbose serial communication mode. The
parameter i selects Verbose (1) or Terse (0). This command only affects the
RS-232 interface. The GPIB interface is always in Terse mode.
Use Terse for programming. All responses to queries are as documented in this
chapter. Use the Verb 0 command at the start of all programs.
Use Verbose for terminal applications or debugging. All terse responses are
followed with a verbose message which explains the response.
For example, a query might return "0" (terse) or "0 off" (verbose).
Examples
VERB?
VERB 0
Returns 1 if verbose mode, 0 if terse mode.
Use terse responses.
*IDN ?
Identification
The *IDN ? query returns the PPM100's device identification string. This string
is in the format "Stanford_Research_Systems,PPM100,s/n0,ver001". In this
example, the serial number is 0 and the firmware version is 001.
*RST
Reset
The *RST command resets the PPM100 to its default configurations. The
communications setup is not changed. All other modes and settings are set to
their default conditions and values. This command takes some time to complete.
Do not send other commands on the same command line after *RST. Do not send
another command until *RST is complete. This takes about 10 seconds. You can
send a query command (like *OPC?) and wait for the response. When the
response comes, the unit is ready.
WSEN (?) {i}
Web Server Enable
The WSEN command sets (queries) whether the Web Server Option is Enabled
(i=1) or Disabled (i=0). Disable the web server to prevent web users from
interfering with local computer control. It may take up to 10 seconds for this to
take effect.
Example
WSEN?
WSEN 0
Returns 1 if web server is Enabled, 0 if Disabled.
Disables the web server option.
PPM100 Partial Pressure Monitor
6-48 Interface
PPM100 Partial Pressure Monitor
Status Reporting 6-49
Status Reporting
The PPM100 reports on its status by means of five status registers: the Serial Poll,
Standard Event, Error, Gauge and Process Control status registers.
Status Registers
In the PPM100, a status register is a read-only, 16 bit word where the state of each bit
indicates a specific instrument state or condition.
Bits in status registers are set when their corresponding condition or status is met. Except
for the Serial Poll status bits, once a status bit is set, it remains set until cleared by a read
with the appropriate status reporting command. Whenever a status bit is set, it remains set
until read.
Some status bits report that a bit is set in another status register.
Resetting the PPM100, turning it off, or issuing *RST do not clear the status registers.
Reading the status registers or issuing *CLS clears the status registers. Powering-up with
*PSC enabled also clears the status registers.
This instrument extends the IEEE-488 specification by allowing you to check and clear
individual bits in a status register.
Status Enable Registers
Status enable registers let you decide which conditions you care about and check them all
with one *STB? query or GPIB serial poll.
The Standard Event, Error, Gauge and Process status registers all have a corresponding
status enable register. Each bit in the enable register matches with a bit in the
corresponding status register. Bits in the enable registers are set with the status enable
commands. The enable bits do not affect the value of the status register and are not
affected by status reads.
When a bit in BOTH a status register AND its enable register are set, then a bit in the
Serial Poll Status register will become set. This mechanism reports underlying status
conditions to a single status register (Serial Poll Status).
Serial Poll Status Register
The Serial Poll Status register is a special status register. It is a single byte (8 bits) and
contains bits corresponding to the other four status registers. When a status bit (in another
status register) and the matching enable bit (in its corresponding enable register) are both
set, a bit is set in the Serial Poll Status register. This allows a single read of the Serial Poll
Status to determine if any enabled bits in all of the other status registers is set. These bits
in the Serial Poll Status are not cleared by reading. They remain set as long as the
enabled bit in the other status register is set. Read the other status registers to determine
which bit(s) are set and clear them.
PPM100 Partial Pressure Monitor
6-50 Status Reporting
The Serial Poll Status register has a matching Serial Poll Enable register. When a bit in
both becomes set, the Service Request, or SRQ, bit will be set. This causes an IEEE-488
bus service request. When an enabled Serial Poll bit becomes set, a single service request
is generated.
*STB? to Read the Serial Pol Status
The Serial Poll Status register is NOT cleared by reading the status using *STB?. A bit
stays set as long as the status condition exists. This is true even for bit 6 (SRQ). Bit 6 will
be set whenever the same bit in the Serial Poll Status AND Serial Poll Enable registers is
set.
Serial Poll to Read the Status
Except for SRQ, a bit in the Serial Poll Status is NOT cleared by GPIB serial polling the
status register. A bit stays set as long as the status condition exists.
When reading the status using a GPIB serial poll, the SRQ bit signals that the PPM100 is
requesting service. The SRQ bit will be set the first time the PPM100 is polled following
a service request. The serial poll automatically clears the service request. Subsequent
serial polls will return SRQ cleared until another service request occurs. Polling the status
word and reading it with *STB? can return different values for SRQ. When serial polled,
SRQ indicates a service request has occurred. When read with *STB?, SRQ indicates that
an enabled Serial Poll Status bit is set.
Service Request
A GPIB service request (SRQ) will be generated whenever a bit in both the Serial Poll
Status register AND Serial Poll Enable register is set. Use *SRE to set bits in the Serial
Poll Enable register.
A service request is only generated when an enabled Serial Poll Status bit becomes set
(changes from 0 to 1). An enabled status bit which becomes set and remains set will
generate a single SRQ. This prevents a single, persistent condition, such as overload,
from generating an endless stream of service requests.
If another service request from the same status bit is desired, the requesting status bit
must first be cleared. In the case of the PCSQ, GERR, IERR and ESB bits, this means
clearing the enabled bits in the Process, Gauge, Error or Standard Event Status registers
(by reading them) or clearing the appropriate bits in the corresponding enable registers.
Multiple enabled bits in these status registers will generate a single SRQ. Another SRQ
(from PCSQ, GERR, IERR or ESB) can only be generated after clearing the PCSQ,
GERR, IERR or ESB bits in the Serial Poll Status.
The controller should respond to the SRQ by performing a serial poll to read the Serial
Poll Status to determine the requesting status bit. Bit 6 (SRQ) will be reset by the serial
poll. The controller should then investigate the appropriate status register to find the
requesting status bit. The SRQ handler should deal with the actual problem (e.g.
removing an overload condition), NOT just clear the bit and continue. This can lead to
repeated SRQ events.
PPM100 Partial Pressure Monitor
Status Reporting 6-51
Power-On Status
Powering on does not clear the status registers. Reading status registers or issuing *CLS
clears status registers.
Upon power-on, the PPM100 may either clear all of its status enable registers or maintain
them as they were on power-off. The *PSC command determines which action will be
taken.
PPM100 Partial Pressure Monitor
6-52 Status Reporting
Status Reporting Commands
*CLS
Clear Status
The *CLS command clears all status registers. The enable registers are not
changed.
*PSC (?) {i}
Power-On Status Clear
The *PSC command sets the value of the power-on status clear bit.
If i=1 the power-on status clear bit is set and all status registers and enable
registers are cleared on power up.
If i=0 the bit is cleared and all enable registers are stored at power down. The
status registers are cleared and the enable registers are restored to their stored
values on power up. This allows a service request to be generated at power up.
The default value is 0.
*STB ? {i}
Read Serial Poll Status
The *STB? query returns the value of the Serial Poll Status register. The value is
returned as a decimal number from 0 to 255. The *STB? i query returns the value
(0 or 1) of bit i (0-7). The conditions for each bit are listed below.
bit
name
set when
0
PCSQ
An enabled bit in the Process Control Status is set.
1
IERR
An enabled bit in the Error Status is set.
2
GERR
An enabled bit in the Gauge Status is set.
3
RCC
PPM100 has no pending commands for the RGA.
4
MAV
Data is available in the GPIB output buffer.
5
ESB
An enabled bit in the Event Status is set.
6
SRQ
Service request occurs.
7
IFC
No PPM100 Command Execution is in progress.
The value of bit 6 (SRQ) when read using *STB? returns 1 if a bit is set in BOTH
the Serial Poll Status register AND the Serial Poll Enable register. This is
independent of serial polling and GPIB service requests. Bit 6 is the SRQ bit only
when serial polled.
*STB? has no effect on the value of the Serial Poll Status register. To clear a bit
in the Serial Poll Status, the condition which causes it to be set must be cleared.
For the PCSQ, GERR, IERR or ESB bits, this is accomplished by clearing the
enabled status bits in the Process, Gauge, Error or Standard Event status words
(by reading them).
Examples
*STB?
*STB? 2
PPM100 Partial Pressure Monitor
Returns the Serial Poll Status register (0-255).
Returns 0 if bit 2 (GERR) is clear, 1 if it is set.
Status Reporting 6-53
*SRE (?) {i} {, j}
Serial Poll Enable
The *SRE i command sets the Serial Poll Enable register to the decimal value i
(0-255). The *SRE i, j command sets bit i (0-7) to j (0 or 1).
The *SRE? query returns the value (0-255) of the Serial Poll Enable register. The
*SRE? i query returns the value (0 or 1) of bit i (0-7).
When a bit becomes set in BOTH the Serial Poll Status register AND the Serial
Poll Enable register, an SRQ (GPIB service request) is generated. The SRQ is
cleared by performing a serial poll. The bit in the Serial Poll Status which caused
the SRQ must be cleared before this bit can cause another SRQ. To clear this bit,
the condition which causes it to be set in the Serial Poll Status needs to be
cleared. For the PCSQ, GERR, IERR or ESB bits, this is accomplished by
clearing the enabled status bits in the Process, Gauge, Error or Standard Event
status words (by reading them).
Examples
*SRE?
*SRE? 2
*SRE 40
*SRE 1, 0
*ESR ? {i}
Returns the Serial Poll Enable register (0-255).
Returns 0 if bit 2 is clear, 1 if it is set.
Sets the Serial Poll Enable register to 40 decimal (bits 3 and 5
set).
Clears bit 1 of the Serial Poll Enable register.
Read Standard Event Status
The *ESR? query returns the value of the Standard Event Status register. The
value is returned as a decimal number from 0 to 255. The *ESR? i query returns
the value (0 or 1) of bit i (0-7).
*ESR? clears the entire register while *ESR? i clears just bit i.
The conditions for each bit are listed below.
set when
bit
name
0
OPC
The *OPC command completes.
1
Unused
2
Unused
3
Unused
4
EXE
A command cannot be executed.
5
CME
A command syntax error occurs.
6
Unused
7
PON
Unit turns on.
The Standard Event Status is defined by IEEE-488.2 (1987) and is used primarily
to report errors in commands received over the interface. These bits remain set
until read, cleared by *CLS or power-up with *PSC enabled.
Examples
*ESR?
*ESR? 5
Returns the Standard Event Status register (0-255).
Returns 0 if bit 5 (CME) is clear, 1 if it is set.
PPM100 Partial Pressure Monitor
6-54 Status Reporting
*ESE (?) {i} {, j}
Standard Event Enable
The *ESE i command sets the Standard Event Enable register to the decimal
value i (0-255). The *ESE i, j command sets bit i (0-7) to j (0 or 1).
The *ESE? query returns the value (0-255) of the Standard Event Enable register.
The *ESE? i command queries the value (0 or 1) of bit i (0-7).
When a bit becomes set in BOTH the Standard Event Status register AND the
Standard Event Enable register, bit 5 (ESB) of the Serial Poll Status is set. This
causes an SRQ if bit 5 in the Serial Poll Enable register is set. To clear a bit in the
Standard Event Status, use *ESR?.
Examples
*ESE?
*ESE? 2
*ESE 48
*ESE 7, 0
ERSW ? {i}
Returns the Standard Event Enable register (0-255).
Returns 0 if bit 2 is clear, 1 if it is set.
Sets the Standard Event Enable register to 48 decimal (bits 4
and 5 set).
Clears bit 7 of the Standard Event Enable register.
Read Error Status
The ERSW? query returns the value of the Error Status register. The value is
returned as a decimal number from 0 to 65535. The ERSW? i query returns the
value (0 or 1) of bit i (0-15).
ERSW? clears the entire register while ERSW? i clears just bit i.
The conditions for each bit are listed below.
set when
bit
name
0
Tst_Err
Selftest fails.
1
Math_Err An internal math error occurs.
2
RAM_Err The RAM checksum fails.
3
ROM_Err The ROM checksum fails.
4
Batt_Err
Data in battery backed-up RAM was lost.
5
Stk_Err
An internal stack error occurs.
6
Heap_Err An internal heap error occurs.
7
Rly_Err
A process control relay failure is detected.
8
Com_Err
An error with a communications port occurs.
9
Mnt_Err
A selftest requests routine maintenance.
10
Unused
11
Unused
12
Unused
13
Reset_Err A Watchdog timer reset has occured.
14-15 Unused
These bits REMAIN SET until read, cleared by *CLS or power-up with *PSC
enabled.
Examples
ERSW?
ERSW? 8
PPM100 Partial Pressure Monitor
Returns the Error Status register (0-65535).
Returns 0 if bit 8 (Com_Err) is clear, 1 if it is set.
Status Reporting 6-55
ERSE (?) {i} {, j}
Error Status Enable
The ERSE i command sets the Error Status Enable register to the decimal value i
(0-65535). The ERSE i, j command sets bit i (0-15) to j (0 or 1).
The ERSE? query returns the value (0-65535) of the Error Status Enable register.
The ERSE? i query returns the value (0 or 1) of bit i (0-15).
When a bit becomes set in BOTH the Error Status register AND the Error Status
Enable register, bit 1 (IERR) of the Serial Poll Status is set. This causes an SRQ
if bit 1 in the Serial Poll Enable register is set. To clear a bit in the Error Status,
use ERSW?.
Examples
ERSE?
ERSE? 2
ERSE 48
ERSE 12, 0
GSSW ? {i}
Returns the Error Status Enable register (0-65535).
Returns 0 if bit 2 is clear, 1 if it is set.
Sets the Error Status Enable register to 48 decimal (bits 4 and
5 set).
Clears bit 12 of the Error Status Enable register.
Read Gauge Status
The GSSW? query returns the value of the Gauge Status register. The value is
returned as a decimal number from 0 to 65535. The GSSW? i query returns the
value (0 or 1) of bit i (0-15).
GSSW? clears the entire register while GSSW? i clears just bit i.
The conditions for each bit are listed below.
set when
bit
name
0
RGA_Com a problem communicating with the RGA head occurs.
This includes the RGA being turned off or disconnected.
1
Unused
2
Unused
3
Unused
4
AN1_Rng AN1 reading is out-of-range.
5
AN2_Rng AN2 reading is out-of-range.
6
AN3_Rng AN3 reading is out-of-range.
7
AN4_Rng AN4 reading is out-of-range.
8-13 Unused
14
Scan_Done an analog scan in the MassSpec display completes.
15
Log_Entry a new point is added to the pressure lo g.
These bits REMAIN SET until read, cleared by *CLS or power-up with *PSC
enabled. For example, if AN1 is out-of-range, bit 4 will become set. Reading this
status register will clear the bit. However, if AN1 remains out-of-range, then bit 4
will become set again (within 0.5 second). This can lead to repeated SRQs if the
appropriate enable bits are set. In this case, the SRQ handler should not just read
the status to clear the bit but also deal with the actual cause, in this case, why is
the signal at AN1 out of range?, and remove the source of the problem.
Examples
GSSW?
GSSW? 14
Returns the Gauge Status register (0-65535).
Returns 0 if bit 14 (Scan_Done) is clear, 1 if it is set.
PPM100 Partial Pressure Monitor
6-56 Status Reporting
GSSE (?) {i} {, j}
Gauge Status Enable
The GSSE i command sets the Gauge Status Enable register to the decimal value
i (0-65535). The GSSE i, j command sets bit i (0-15) to j (0 or 1).
The GSSE? query returns the value (0-65535) of the Gauge Status Enable
register. The GSSE? i query returns the value (0 or 1) of bit i (0-15).
When a bit becomes set in BOTH the Gauge Status register AND the Gauge
Status Enable register, bit 2 (GERR) of the Serial Poll Status is set. This causes
an SRQ if bit 2 in the Serial Poll Enable register is set. To clear a bit in the Gauge
Status, use GSSW?.
Examples
GSSE?
GSSE? 15
GSSE 48
GSSE 14, 0
RSSW ? {i}
Returns the Gauge Status Enable register (0-65535).
Returns 0 if bit 15 is clear, 1 if it is set.
Sets the Gauge Enable register to 48 decimal (bits 4, 5 set).
Clears bit 14 of the Gauge Status Enable register.
Read Process Status
The RSSW? query returns the value of the Process Status register. The value is
returned as a decimal number from 0 to 65535. The RSSW? i query returns the
value (0 or 1) of bit i (0-15).
RSSW? clears the entire register while RSSW? i clears just bit i.
The conditions for each bit are listed below.
set when
bit
name
0
Ch1_Chg Process control channel 1 changes state.
1
Ch2_Chg Process control channel 2 changes state.
2
Ch3_Chg Process control channel 3 changes state.
3
Ch4_Chg Process control channel 4 changes state.
4
Ch5_Chg Process control channel 5 changes state.
5
Ch6_Chg Process control channel 6 changes state.
6
Ch7_Chg Process control channel 7 changes state.
7
Ch8_Chg Process control channel 8 changes state.
8
Ch1_Act
Process control channel 1 is active.
9
Ch2_Act
Process control channel 2 is active.
10
Ch3_Act
Process control channel 3 is active.
11
Ch4_Act
Process control channel 4 is active.
12
Ch5_Act
Process control channel 5 is active.
13
Ch6_Act
Process control channel 6 is active.
14
Ch7_Act
Process control channel 7 is active.
15
Ch8_Act
Process control channel 8 is active.
The Process Control Status reflects the current process control state and indicates
channels that have changed state (1 or more times) since the last time the status
was read.
The lower 8 bits are set when a channel changes state and REMAIN SET until
read, *CLS executes, or power-on with *PSC enabled. These bits can be enabled
PPM100 Partial Pressure Monitor
Status Reporting 6-57
to generate an SRQ. Reading this register will clear these bits and they will
remain cleared until the relay changes state again.
The upper 8 bits always reflect the state of the process control channels at the
time this status is read. These bits should NOT be enabled to generate an
SRQ. Reading this register will clear these bits but if the relay remains active, the
bit will immediately be reset and generate another SRQ.
Examples
RSSW?
RSSW? 10
RSSE (?) {i} {, j}
Returns the Process Control Status register (0-65535).
Returns 0 if bit 10 (Ch3_Act) is clear, 1 if it is set.
Process Status Enable
The RSSE i command sets the Process Status Enable register to the decimal
value i (0-65535). The RSSE i, j command sets bit i (0-15) to j (0 or 1).
The RSSE? query returns the value (0-65535) of the Process Status Enable
register. The RSSE? i query returns the value (0 or 1) of bit i (0-15).
When a bit becomes set in BOTH the Process Status register AND the Process
Status Enable register, bit 0 (PCSQ) of the Serial Poll Status is set. This causes
an SRQ if bit 0 in the Serial Poll Enable register is set. To clear a bit in the
Process Status, use RSSW?.
Examples
RSSE?
RSSE? 2
RSSE 48
RSSE 12, 0
Returns the Process Status Enable register (0-65535).
Returns 0 if bit 2 is clear, 1 if it is set.
Sets the Process Status Enable register to 48 decimal (bits 4
and 5 set).
Clears bit 12 of the Process Status Enable register.
PPM100 Partial Pressure Monitor
6-58 Using USB
Using USB
Introduction
Remote control of the PPM using USB requires:
•
An OS that supports USB (Windows 2000, XP, 98, Mac OS 8 or OS 9, Linux).
•
Application software (your own Labview, C++, etc. program or a terminal emulator
such as HyperTerm) that can access a COM port.
•
USB driver for your OS.
•
USB hardware on your computer.
•
A USB cable.
SRS supplies the Virtual COM Port (VCP) driver from FTDI (ftdi.com) for Windows and
Mac OS. Once installed, VCP makes an attached USB device appear as if it were
connected via a normal serial port (COM port). Programmatic control is possible in
Windows using LabView, the Windows VCOMM API, or a 3rd party COM library.
RealBasic and LabView can be used on a Mac.
The baud rate, start, stop, and parity are ignored by VCP. The port number (COM1,
COM2, etc) can be manually set in the VCD driver page of the Windows device
manager. Linux users should follow the link from the FTDI Driver Download page for
Linux drivers.
Windows 2000, XP, and 98
Installing VCP (Virtual Com Port [without PNP support])
•
Download the Windows driver set from http://www.thinkSRS.com (remember where
you put it).
•
Unzip it into a temporary directory.
•
If the FTDI driver is already installed, uninstall it using Uinstal.exe.
•
Plug the PPM100 into the PC USB port and turn the unit on. Windows will prompt,
“a new device has been found” and “Building Driver Information Database” followed
by the Add New Hardware Wizard. If Windows asks to search for the driver, click
OK.
•
Windows should find the file that you just unzipped. If not, navigate to the correct
directory. Select Next.
•
To confirm that the installation has completed successfully look under Device
Manager of the System Properties screen. The device should have installed as a USB
Serial Port (COMx) attached to USB High Speed Serial Converter.
PPM100 Partial Pressure Monitor
Using USB 6-59
Testing
It’s a good idea to test the COM port installation before attempting to write a program to
communicate with your PPM100.
•
Open Hyperterminal from the Start Menu:
Programs/Accessories/Communications/Hyperterminal
•
Enter a name (e.g. PPM on COM5) at the New Connection dialog.
•
Choose the COM port that VCP installed to in the Connect To dialog.
•
Ignore the COMx settings page – just click OK.
If the PPM is connected and turned on, you should be able to type in *IDN? <Enter> and
get the instrument identification string in response. You can modify the terminal settings
to improve the readability of your session as follows:
•
Select Call/Disconnect from the Hyperterminal menu.
•
Select File/Properties and click on the Settings Page tab.
•
Click on ASCII setup and check the “Echo typed characters locally” and “append line
feeds to incoming line ends” boxes.
•
Click OK and OK again to finish the Properties dialog.
•
Select File/Save to save your HyperTerminal configuration for later use.
This HyperTerminal setup will allow you to try out the PPM commands before you
include them in your program. However, only one application can be connected to a
COM port at a time. If HyperTerminal is running, your program will fail to open the
COM port. Likewise, HyperTerminal will not be able to use the COM port if your
program is running.
VCP Options : COM port number
Some Applications (e.g. HyperTerminal) can only use COM ports within a certain range
(e.g. COM1 through COM4). If this is the case, you may want to manually select the
COM port number that VCP uses. To change the virtual COM port properties
•
Open the Device Manager
•
Select the USB Serial Port
•
Click Properties.
•
Select Port Settings.
•
Select Advanced.
•
Click the drop down arrow on COM Port Number and scroll to the required COM
port.
•
Select OK.
PPM100 Partial Pressure Monitor
6-60 Using USB
Be sure not to select a COM port which is already in use. When you return to the Device
Manager Screen you will see that the USB Serial Port installation has been changed to
the desired COM number.
Mac OS8 and OS9
Installing USBSerial extension
•
Download the mac drivers from http://www.thinkSRS.com
•
Unstuff it.
•
Drag it into the System/Extensions folder.
•
Reboot.
•
Open AppleWorks and Open a new Comm Module.
•
Select USBSerial (instead of modem)
•
Begin a session and check “echo locally” and “carriage return on line feed”
If the PPM is connected and turned on, you should be able to type in *IDN? <Enter> and
get the instrument identification string in response.
PPM100 Partial Pressure Monitor
7-1
Chapter 7
Embedded Web Server (EWS)
The embedded web server (EWS) provides an ethernet connection between the PPM100 and a network.
The EWS allows monitoring and control of the PPM100 from a local network or the world wide web.
The EWS allows you to
•
•
•
Monitor and control the PPM100 from virtually anywhere in the world.
View vacuum system data using a standard web browser.
Get log data from the PPM100 without writing a custom program.
In This Chapter
EWS Quick Start
Connect the PPM100 to Your Network
Set the Network Addresses
Set the Security Level
Enable the EWS
Access the Web Page
Installing the EWS
Network Administration Concerns
Static IP
Port Number
Setting Network Addresses
Enable the EWS
System Name
MAC Address
Choosing a Network Configuration
Crossover Cable Configuration
Internal LAN Configuration
Conventional LAN Configuration
Outside Firewall Configuration
Testing with a Crossover Cable
Testing Within a Network
Configuring EWS Security
Web Server Enable
Web Control Enable
Security Type
IP Checking
IP and Password Checking
Password Checking Only
7-3
7-3
7-3
7-3
7-3
7-4
7-5
7-5
7-5
7-6
7-6
7-7
7-7
7-8
7-9
7-9
7-10
7-11
7-12
7-13
7-14
7-15
7-15
7-15
7-16
7-16
7-16
7-17
Using the EWS
Bookmarking the PPM100
Monitoring the PPM100
Get Readings
Show Stored Plot
Auto Monitor
Process History
Get Datalog
Get Userlog
Email Status
Controlling the PPM100
Request Control
Release Control
Get Chart Type
MassSpec Display and Analog Scanning
Email Notices
Change Relays
Networking Terms
7-18
7-19
7-19
7-19
7-19
7-20
7-21
7-22
7-23
7-23
7-24
7-24
7-24
7-24
7-25
7-28
7-31
7-32
PPM100 Partial Pressure Monitor
7-2
Embedded Web Server
PPM100 Partial Pressure Monitor
EWS Quick Start
7-3
EWS Quick Start
If you are comfortable with networking and wish to get your EWS up and going as
quickly as possible, use the Quick Start instructions here. Please read the rest of this
chapter for a more complete description of the EWS features and capabilities.
Connect the PPM100 to Your Network
Warning!
•
Connecting your vacuum system to the world-wide-web can expose it to
unauthorized access, resulting in harm to personnel as well as equipment.
•
Network security is a serious matter. Consult your network administrator for more
information about using web-enabled instruments in your lab.
Use a CAT5 ethernet cable to connect your hub or switch to the ethernet connector on the
back of the PPM100 (with EWS installed). Do not use a crossover cable.
Bring up the Web setup menu by pressing the [Menu] QuickKey (in the Pressure
Display), choosing [Remote] and then [Web].
Set the Network Addresses
For full use of the EWS, you will need a static IP (Internet Protocol) address, subnet
mask, DNS (Domain Name Server) address, and gateway address. See your network
administrator to obtain addresses appropriate for your network environment. If you
already know the IP address you will be using, you may be able to find your subnet mask
and gateway by typing "ipconfig" from your workstation’s command line prompt.
Enter these values in the Main/Remote/Web menu of the PPM100.
Set the Security Level
To quickly allow access to all EWS features, go to the Main/Remote/Web/Control
submenu and set Web Control to Enabled and Security Type to Password. The default
password is "PPM100".
Read the section 'Configuring EWS Security' later in this chapter for a complete
description of EWS security features.
Enable the EWS
Return to Main/Remote/Web and set Web Server to Enabled. Your EWS stores the
network addresses into non-volatile memory, then gathers data on your PPM100 setup
(gauge and relay descriptions, etc.). Allow the EWS about 30 seconds before continuing.
To make sure the EWS is functioning, touch the [Web Queue] button. If commands are
streaming across the display, the EWS is communicating with the PPM100.
PPM100 Partial Pressure Monitor
7-4
EWS Quick Start
Access the Web Page
Start your web browser and in the location (URL) bar, type the IP address you assigned
to the EWS. Make sure JavaScript is not disabled in your browser. You should see a web
page similar to below.
Figure 7-1. EWS web page.
PPM100 Partial Pressure Monitor
Installing the EWS
7-5
Installing the EWS
This section covers the network installation and configuration of the Embedded Web
Server. While this adds powerful functionality to the PPM100, connecting your vacuum
system to the world-wide-web can expose it to unauthorized access, resulting in harm to
personnel as well as equipment.
Warning!
Network security is a serious matter. Consult your network administrator for more
information about using web-enabled instruments in your lab.
Network Administration Concerns
Your network administrator has a difficult job. In addition to making sure your network
is always running smoothly, she also needs to keep track of which IP addresses are
assigned to which machines. This prevents IP address collisions (where more than one
computer has the same IP address), as well as maintains the security of the network.
Your administrator may have a limited number of free IP addresses, and may show
concern about having an instrument on the network in the first place.
Some of the first questions she may ask include:
•
Why does an instrument need an IP address?
•
Why does it need a static IP address?
•
What happens if everyone in the department wants instruments with IP addresses?
•
What is the MAC address for this instrument?
•
What kind of security measures are in place?
These are all very valid concerns. You will need to explain what you want to do, and
allow your administrator enough leeway to accomplish your goals while still satisfying
hers. Some of the information in this chapter may help you both.
Static IP
The reason your instrument needs a static IP address is because it is a server. You need
your server to be at the same address all the time, so you always know where to point
your browser. It is likely that once your instrument is running, it will remain on 24 hours
a day, 7 days a week. This makes using a dynamic IP address (one that changes with each
power up sequence) somewhat infeasible. Note that the EWS does not use a conventional
file system; data is generated on the fly for dynamic pages and static pages are stored in
flash memory. This makes the server less prone to common security risks.
PPM100 Partial Pressure Monitor
7-6
Installing the EWS
Port Number
The default port is 80 and should NOT be changed except in the following situations.
1. If IP addresses are scarce in your network environment, consider using a network
address translation (NAT) router. With such a device, several PPM100's can 'share' a
single IP address. Each PPM100 is assigned a 'fictitious' IP address and the router
presents a single IP address to the rest of the world. In this case, all of the PPM100's
will appear at the same IP address to the outside world (they will have different IP
addresses on the local network). Each PPM100 needs to be on a different port and the
router must be configured to forward port requests to the correct PPM100. From the
outside, each PPM100 is accessed at its own port number (but the same IP address).
2. If you are experiencing attacks on port 80 that block access to the PPM100. In this
case, change the port to something else (like 8080). You will need to specify this port
in your browser address window as 208.123.123.32:8080 where 208.123.123.32 is
the IP address of the PPM100 and 8080 is the port number.
For more information about NAT routers and ports, see your network administrator.
Setting Network Addresses
To enter network addresses into the PPM100, press the [Menu] QuickKey from the
Pressure Display, then choose [Remote] from the Main Menu. Finally, choose [Web] in
the Remote Menu.
Figure 7-2. Getting to the Web menu.
In order to use the EWS, you will need to have a connection to the internet and some
information about your network environment.
The best source of information about your network environment is your network
administrator. Here is a list of information you will need from that person:
1)
2)
3)
4)
5)
An IP (Internet Protocol) address for the instrument
The IP address of a domain name server (DNS)
The IP address of the gateway
The address of a simple mail transfer protocol (SMTP) server
The Subnet mask
PPM100 Partial Pressure Monitor
Installing the EWS
7-7
An IP address is made up of four bytes. It is often expressed as a set of three digit
numbers separated by a '.' such as 209.239.160.084. The Internet protocol maps each
machine's individual media access control (MAC) address to an IP address. Every page
you are served from the world wide web is actually from a machine with a particular IP
address.
People have a difficult time remembering and using long strings of numbers, so domain
name servers (DNS) are in use. You can think of these machines as a kind of telephone
book; they associate a particular IP address (209.239.160.084) with a string of characters
(www.thinksrs.com). A DNS is not required to use the EWS, but it can make your life a
little easier.
Next we need to consider the gateway. The gateway is simply the machine that connects
your network to the outside world. It is the link between two networks, routing data
traffic between those networks. For this reason, a gateway is sometimes referred to as a
router. Its IP address is required for you to be able to send email from the EWS. If you
will not be using the email notices feature of the EWS, and you will always be contacting
the EWS from a machine on the same network, this IP address is not required.
A simple mail transfer protocol (SMTP) server often has one purpose in life: to relay
email from one machine to another. It follows some simple rules for how the information
that makes up the email is exchanged between the machine sending the email and the
machine that will relay the message to its destination. This address is not required if you
will not be using the email feature of the EWS.
Lastly, the subnet mask is required. In a network, there are quite often sub-networks. The
subnet mask is required to let the EWS know which subnet it will be on.
Enable the EWS
After entering network addresses, set the Web Server to Enabled. Your EWS stores the
network addresses into non-volatile memory, then gathers data on your PPM100 setup
(gauge and relay descriptions, etc.). Allow the EWS about 30 seconds before continuing.
To make sure the EWS is functioning, touch the [Web Queue] button. If commands are
streaming across the display, the EWS is communicating with the PPM100.
Important
Whenever network setup information is changed, the new addresses are read and burned
into flash memory, then the EWS is re-started. You must wait at least 5 seconds for the
changes to take effect.
System Name
The System Name (Menu/Remote/System Name) identifies this PPM100 on the web.
This is important if your setup includes multiple web-enabled PPM100's. The system
name is displayed in the web pages to identify the source of the data.
PPM100 Partial Pressure Monitor
7-8
Installing the EWS
MAC Address
Your administrator may want to know the media access control (MAC) address of your
instrument. The MAC is a unique address used at a lower layer of the internet protocol.
Each IP address is mapped to a unique MAC address. Administrators often like to know
this address as a crosscheck for the IP address (both should be unique). Knowing the
MAC address also provides some extra security; if the administrator finds a MAC
address that isn’t listed in their directory, it could be an unauthorized user. When you put
a server on a network, you are essentially inviting people to come and get information.
Your administrator will want to make sure that this server doesn’t create a security risk
for the rest of the network.
To find the MAC address of your PPM100 from a standalone PC use a crossover cable to
connect the PPM100 to the PC. Type in the PPM100's IP address (and port if not 80) in
your browser's address window. This should bring up the PPM100 web page. Click on
"Get Userlog" on the left. This displays the network settings of the PPM100 including its
MAC address.
PPM100 Partial Pressure Monitor
Installing the EWS
7-9
Choosing a Network Configuration
This section illustrates some possible network configurations for the EWS. This may help
in choosing the best network configuration for your EWS.
Crossover Cable Configuration
This setup uses a crossover ethernet cable that allows the EWS to connect to a single
computer without a network. A crossover cable is wired differently than regular network
cables. A normal ethernet cable is wired 'straight through' (Tx to Tx, Rx to Rx), while a
crossover cable connects transmit to receive (Tx to Rx, Rx to Tx). To use this
configuration, make sure you use a crossover cable!
This configuration will NOT allow email, use of a DNS, or access from more than one
computer. It will NOT allow the computer connected to the PPM to connect to the
internet. However, it does allow you to use a standard web browser to monitor, control
and receive data from the PPM100.
Crossover Cable Configuration
Crossover Cable
RS232 Cable
RGA
Vacuum Chamber
PPM100
Laboratory PC
Figure 7-3. Crossover Cable Configuration
This configuration does NOT allow access to the PPM100 from the outside world.
However, if security is a concern, this limitation is a strong reason for its use. The only
security question to ask is "who will have access to this computer?". Since there is no
intermediate connection, or dependence on outside hardware, this is also a very reliable
connection. Furthermore, since the EWS will not actually be on the internet, you do not
need a 'real' IP address. The crossover cable forms a 'network' of one PC to one
instrument. Since you have created your own enclosed network, you can use any IP
addresses you wish; use the same subnet mask for both the PC and the PPM100. See the
section below entitled "Testing with a crossover cable" for more details.
PPM100 Partial Pressure Monitor
7-10 Installing the EWS
Internal LAN Configuration
You can retain the security of the crossover connection and still allow more than one
computer to access the PPM100. An ethernet hub will allow you to make a local area
network (LAN) that can use fictitious IP addresses in order to access the instrument (as
well as other computers on the LAN). The figure below shows a conceptual diagram of
this configuration. While the IP addresses are fictitious, other networking parameters are
still required and your network administrator can help you set up this type of LAN.
LAN Connection Using Fictitious IP Addresses
RGA
Vacuum Chamber
PPM100
Ethernet
Hub
Lab PC #1
Lab PC #4
Lab PC #2
Lab PC #3
Figure 7-4. Internal LAN Configuration
Note that no connection to the internet is made in this LAN. The network is completely
within your laboratory or plant floor, so security from an outside attack on this LAN is
not a concern. Of course this also means that you cannot access the LAN outside of the
workplace. However, the PPM100 can be accessed from other computers on the same
LAN.
PPM100 Partial Pressure Monitor
Installing the EWS 7-11
Conventional LAN Configuration
Chances are good that you are currently using a LAN with real IP addresses that is also
connected to the internet through a firewall. A firewall is a piece of hardware designed to
exclude unwanted data traffic coming from the outside world. A gateway is often
employed in order to allow data traffic from the LAN to reach the outside world. Within
a LAN that is using real IP addresses, you need to contact your network administrator in
order to set up your EWS. For details, see the section 'Network Administration Concerns'.
This configuration allows anyone on your LAN to use the EWS. With a gateway in place,
it also allows the EWS to send out email to a computer which is outside the LAN.
However, this configuration may not allow you to monitor or control your vacuum
system from outside your workplace. Talk with your network administrator for their
advice on setting up this configuration to allow outside access to the PPM100. To
maintain the security of the LAN, your administrator may wish to place the PPM100
outside the firewall, as described in the next section.
Conventional LAN Connection
RGA
Vacuum Chamber
PPM100
Ethernet
Hub
Firewall / Gateway
Lab PC #1
Lab PC #2
Lab PC #3
The Internet
Figure 7-5. Conventional LAN Configuration
PPM100 Partial Pressure Monitor
7-12 Installing the EWS
Outside Firewall Configuration
Here, the PPM100 is connected to the world wide web via a router outside the workplace
firewall. This connection requires setting up real network parameters (as discussed in the
previous sections) and your network administrator should work with you to set up this
type of connection. This configuration allows you to interact with your instrument from
any computer, anywhere on the internet, via a standard browser. You can monitor your
data, control relay states, and even receive email notification about relay state changes,
from any location. There is a trade-off for all this flexibility and power. Once your
instrument is accessible throughout the world, security issues must be addressed. See
'Configuring EWS Security' later in this chapter.
World Wide Web Connection
Firewall / Gateway
Router
The Internet
PPM100
Ethernet
Hub
Lab PC #1
RGA
Lab PC #2
Vacuum Chamber
Lab PC #3
Figure 7-6. Outside Firewall Configuration
PPM100 Partial Pressure Monitor
Installing the EWS 7-13
Testing with a Crossover Cable
Before putting your instrument on the web, it is best to test it via a direct PC to
instrument connection. You will need an ethernet crossover cable, and a computer with a
network card, already configured with network parameters. If you need to set up a
computer for networking, contact your network administrator. Please do not contact SRS
for support of your network. A workstation attached to the same network you wish to use
the EWS with is ideal for this test. If the computer is already hooked up to a network,
make sure disconnecting it will not cause problems for others on that network.
In this crossover configuration, real networking parameters (Subnet mask, DNS,
Gateway) are not required.
1) Make sure the PPM100 is powered up and running normally.
2) Disconnect the computer from its ethernet network.
3) Connect the PPM100 EWS to the computer using a crossover cable.
4) From the command line prompt of your workstation, enter the command ‘ipconfig’.
This command will report the workstation’s IP address.
5) On the PPM100, go to the Main/Remote/Web menu. Make sure the EWS is Disabled.
6) For this test, the IP address can be 'fictitious'. Set the EWS to use a fictitious address
by subtracting one from the IP address of your workstation. For example, if your
workstation IP address was reported as 111.111.111.111, use 111.111.111.110 for
your fictitious EWS IP address. This is the only networking parameter required for
this crossover test.
7) In the PPM100 Main/Remote/Web menu, set EWS to Enabled. This sets the IP
addresses in the EWS and starts the EWS.
8) Under Main/Remote/Web, touch [Web Queue]. This screen should show web server
activity as it queries the PPM for information. Allow the web server to gather
information from the PPM for several seconds.
9) Run a web browser on your workstation. At the browser’s "http://" prompt, type the
fictitious IP address you set on the PPM100 front panel and hit the return key. In a
moment, you should see the opening screen of the web page.
If you did not see the opening screen within a few seconds, make sure of the following:
•
The web server is enabled. Check Main/Remote/Web/Web Queue (see above) for
activity.
•
When the cable is plugged in and the server is enabled, a green activity light on the
ethernet connector on the rear panel should be illuminated. Verify this light is on. If it
does not light, there may be a hardware problem with the crossover cable or your PC
network card.
•
The IP address on the front panel of the PPM100 matches the IP address you typed in
on your browser.
•
The crossover cable is connected directly from the PC to the PPM (no hub or switch
is in the path).
PPM100 Partial Pressure Monitor
7-14 Installing the EWS
•
The cable is wired as a crossover cable.
•
If the web page display seems garbled or if parts are incomplete, try waiting a few
seconds and reloading the page in your browser. The most likely cause for this
problem is that the web server has not had time to initialize.
Testing Within a Network
In order to test your EWS with a real network, you will need an IP address from your
network administrator. You will also need the subnet mask, and IP address of the default
gateway machine. You can get these addresses from the administrator. If you wish to use
electronic mail, you may also wish to obtain the address of a domain name server (DNS).
1) Make sure the EWS is Disabled (Go to the Main/Remote/Web menu on the PPM100
if necessary).
2) Set the IP address.
3) Set the gateway address and subnet mask.
4) Connect the PPM100 EWS to a hub (or other network connection) with a standard
ethernet network cable. Do not use a crossover cable.
5) In the PPM100 Main/Remote/Web menu, set EWS to Enabled. This sets the IP
addresses in the EWS and starts the EWS.
6) Under Main/Remote/Web, touch [Web Queue]. This screen should show web server
activity as it queries the PPM for information. Allow the web server to gather
information from the PPM for several seconds.
7) Run a web browser on your computer. At the browser’s "http://" prompt, type the IP
address you entered on the PPM100 front panel and hit the return key.
If you did not see the opening screen within a few seconds, make sure of the following:
•
The web server is enabled. Check Main/Remote/Web/Web Queue (see above) for
activity.
•
When the cable is plugged in and the server is enabled, a green activity light on the
ethernet connector on the rear panel should be illuminated. Verify this light is on. If it
does not light, there may be a hardware problem with the crossover cable or your PC
network card.
•
The IP address on the front panel of the PPM100 matches the IP address you typed in
on your browser.
•
The ethernet cable is connected from the PPM100 to a hub or other ethernet port (not
directly to a PC).
•
The cable is NOT a crossover cable.
•
If the web page display seems garbled or if parts are incomplete, try waiting a few
seconds and reloading the page in your browser. The most likely cause for this
problem is that the web server has not had time to initialize.
PPM100 Partial Pressure Monitor
Installing the EWS 7-15
Note
Your local network environment may prohibit your ability to get web pages from the
EWS from outside your facility. See the section below entitled 'Network Configurations'
and consult your network administrator for possible solutions.
Configuring EWS Security
You must decide if the PPM100/EWS offers enough security for your application. The
EWS employs a number of security measures, however, no network can be made entirely
secure! All security measures are implemented from the front panel of the PPM100 and
cannot be changed via the web interface. This ensures that only authorized users set
security levels.
Monitoring of the PPM100 through the EWS is allowed for all users. The security
measures are designed to prevent unauthorized users from making changes to the
PPM100 settings.
Web Server Enable
If you use your EWS only during certain hours, simply disable it when not in use. No
web monitoring or control of the PPM100 is possible when the EWS is disabled. This
setting can only be changed from the front panel.
Figure 7-7. Web server enable/disable.
Important
Whenever network setup information is changed, you must wait at least 5 seconds for the
changes to take effect.
Web Control Enable
If you only wish to monitor your vacuum system from the web, you should disable Web
Control. Web Control of the PPM100 includes setting relay states, running scans, and
configuring email. When control is disabled, the EWS does not allow changes to the
PPM100 settings. If you allow web control, make sure that the security features below are
enabled.
Touch [Control] in the Main/Remote/Web menu to access the control and security
features of the EWS.
PPM100 Partial Pressure Monitor
7-16 Installing the EWS
Figure 7-8. Web Control menu.
Security Type
The PPM100 offers a choice of security options when web control is enabled.
IP Checking
Within a networking environment in which the IP addresses do not change (the IP
addresses are static), you can limit who has access to the instrument by checking the IP
address of users asking for data.
Figure 7-9. Trusted-IP setup menu.
The PPM100 allows you to specify the IP addresses that will be allowed to access the
instrument over the web. You may specify a range of addresses as well as four addresses
that are outside that range. The addresses outside the range are for trusted users outside
the local network with static IP addresses. If your network uses dynamic IP addresses, but
they always fall in the same range, you can still use IP checking security. If you do not
require control of the EWS via a dial-up connection, this is the security measure to use.
Note that no password is required - if the IP address is trusted, control access is granted.
IP and Password Checking
As an extra measure of security in addition to IP checking, you can also assign a
password to gain access to control of the PPM100. If you have set special parameters that
are to remain unchanged even by in-house personnel, this is this measure to use.
PPM100 Partial Pressure Monitor
Installing the EWS 7-17
Password Checking Only
This is the lowest level of security for the PPM100’s control functions. However, if you
require access to the control functions over a dial-up connection to the instrument, this is
the method to use. A dial-up connection almost always assigns a different IP address to
your connection each time you log on to your internet service provider (ISP). This means
IP checking is not a feasible option.
Note
The password exchange is not encrypted. This means that if someone is monitoring your
communication with the EWS, they will see your password.
PPM100 Partial Pressure Monitor
7-18 Using the EWS
Using the EWS
To view the EWS web pages, simply type the IP address of the EWS into your web
browser.
Figure 7-10. Enter the PPM100's IP address into your browser.
Figure 7-11. Main EWS web page.
PPM100 Partial Pressure Monitor
Using the EWS 7-19
Bookmarking the PPM100
You can add a bookmark to the PPM100 in your browser. Be sure to rename the
bookmark to something meaningful. If you are accessing multiple PPM100's, make sure
each bookmark is unique.
Monitoring the PPM100
The simplest use of the EWS is to monitor your data. The EWS offers four distinct ways
to monitor.
•
Display a page with all active gauges and current relay states
•
Monitor selected parameters in an automatically updated window
•
Display the data log to see how your system is behaving over time.
•
Display a graph of partial pressure versus time or partial pressure versus mass
(MassSpec Display).
Get Readings
Get Readings reports the value of all inputs that are not in an error state as well as the
process control relay states. If a gauge reading does not appear, use the Auto Monitor
function described below to display the error state of the gauge. Note that all analog ports
which can be converted to capacitance manometer readings are listed twice; the display
shows both the analog voltage and the corresponding pressure value.
The system name (default "SRS PPM100") can be changed in the Main/Remote menu of
the PPM100. This is important if you are monitoring multiple units.
This screen only updates when you click Get Readings. For continuous updates, use Auto
Monitor.
Show Stored Plot
Show Stored Plot exists to allow examination of a pressure graph after it is acquired. If
the system the PPM is sampling shows unusual yet transient behavior, performing the
scan again at a later time may not reveal the problem. Any plot (analog scan, pressure
versus time chart or voltage versus time chart) is automatically stored in the EWS
memory after it is acquired. If desired, a technician can inform a supervisor at a remote
location to look at the unusual scan through Show Stored Plot. Note that only one plot
can be stored at any given time. If a new plot is acquired, it overwrites the old one.
Access of the stored plot is allowed by all users, even those without control privileges.
PPM100 Partial Pressure Monitor
7-20 Using the EWS
Auto Monitor
Figure 7-12. Auto Monitor menu.
This function allows automatic monitoring of specific inputs or values. Select the
quantities you wish to monitor from the menu and how often you wish the display to
update. A new browser window will be created displaying only the selected data. This
window will refresh every 20 seconds (depending upon network availability). The auto
monitor function will show the status of a gauge that cannot report a value.
The auto monitoring window can be on your desktop while you work, allowing you to
keep tabs on critical parameters (see below). You can create multiple windows to group
critical parameters by type, or use a single window and look at several types of data at
once. This feature can be especially useful when a relay state is tied to a pressure reading;
you can make absolutely sure that the relays are functioning correctly with the given
pressure input. These same ideas can be applied to the analog inputs to monitor
parameters such as temperature.
Figure 7-13. Auto Monitor window.
PPM100 Partial Pressure Monitor
Using the EWS 7-21
Process History
This function will return up to the last 20 events in the process history. Each entry of the
history has a timestamp, a listing of what relays were active at that moment, a listing of
what relays were under automatic control at that moment, and what change took place at
that moment. By examining the process history, you can trace how your vacuum system
arrived in its current state. Often, you can quickly diagnose a problem in your vacuum
system when you learn which interlocks were activated and the order in which they were
activated.
Figure 7-14. Process History.
PPM100 Partial Pressure Monitor
7-22 Using the EWS
Get Datalog
The Get Datalog function downloads PPM100 log data to your computer, via the web.
You can select data from four categories: pressures, analog port values, relay states, and
TTL levels. The data is downloaded either as a web page or as a comma separated
variable (.csv) file compatible with Microsoft Excel.
Web Output
The number of log points in a web page is fixed at 10 points per data type.
Figure 7-15. Web Output of datalog.
PPM100 Partial Pressure Monitor
Using the EWS 7-23
CSV Output
The CSV file is downloaded when you click Get Datalog. If the browser is not set up to
automatically handle a .csv file, the data will be displayed in the browser. Users of
Netscape Navigator can easily configure the browser to automatically launch Excel (or
another graphing program) whenever a .csv file is downloaded.
In Navigator:
1) Go to Edit in the menu bar, and choose Preferences.
2) In the Category pane, double click on Navigator, then click on Applications.
3) Click on New Type. Enter the description "comma separated values", file
extension "csv", MIME type "text" and browse to your application. Do not
type the quote symbols!
4) Click OK.
5) Download the CSV data and your chosen application should open.
Remember, the application must be able to handle data in this format!
Internet Explorer uses the Windows file associations. Installing Excel usually associates
.csv files to Excel. If you need to add the association, go to Windows Explorer or My
Computer. Go to View in the menu bar, then choose Options. Click on the File Types tab.
Either edit an existing entry or add a new one.
If Internet Explorer will not automatically open Excel, try saving the downloaded .csv
data to a file. To do this, right-click on the downloaded data frame and choose view
source. This usually opens a Notepad window with the data in it. Save this file to disk.
Either double-click on this file to launch Excel or open it from within Excel.
Some browsers may require a page reload after a CSV download. Simply hit the 'reload'
icon in your browser.
Note
The EWS is limited in how much data it can send out at a time. Selecting fewer quantities
(for example, pressures only instead of pressures and relay states) will increase the
number of log points you acquire in a single CSV download.
Get Userlog
This feature is simply for security purposes. It displays the recent activity on the EWS
and it shows the IP address and files accessed.
The network settings of the PPM100 are also displayed, including the MAC address.
Email Status
This page displays information about email notification including a summary of the email
setup and a list of emails which have been sent from the PPM100. In addition, the
number of messages sent is shown along with the maximum number allowed.
For more information about setting up email, see the next section 'Controlling the
PPM100'.
PPM100 Partial Pressure Monitor
7-24 Using the EWS
Controlling the PPM100
The world wide web allows the ultimate in remote control. You can change parameters of
the instrument from virtually any location. For security purposes, the EWS only allows
control of relay states, email configuration, some RGA settings and obtaining pressure
graphs. All the control functions are under the security layer and require either the correct
trusted IP address and/or password in order to gain access.
Request Control
If web control is disabled from the front panel of the PPM100, the control functions do
not appear on the EWS web pages. If control is disabled while someone is browsing the
page, the control functions will still be in the web page, but any control operation is
prevented.
You must log on as the controller before any of the control functions can be accessed.
Click this button to log on as the controller. Once you log in, the page reloads, and this
button is re-drawn as 'Release Control'. Only one user can have control of the EWS at a
time.
The log on prompt depends upon the type of security selected on the PPM100. If you
have selected password or both password and IP checking security, you will have to enter
the password. If you are just using IP checking for security, no password is required. In
both cases, you will need to enter a controller name for identification purposes.
If someone is already controlling the instrument, you will be informed of their log on
name, their IP address, and how long it has been since that controller performed a control
function (their idle time). If the current controller has been idle for hours, it is likely they
simply forgot to logout by clicking 'Release Control'. For this reason, you are allowed to
take control from an idle user, provided you know the password and/or have a trusted IP.
Release Control
Click this button to logoff as the controller of the instrument.
Note
Email notification will remain enabled after control is released.
Get Chart Type
This function provides a way to get pressure or voltage versus time graphs over the world
wide web. You first select the chart type from a drop-down list. You can select to plot a
partial pressure (PP1-8), a capacitance manometer pressure (CM1-4) or a voltage (AN14) versus time. Clicking on the button "Get Chart Type" produces the chart. The time
span of the chart depends upon the chart X-axis setting keyed in on the front panel of the
PPM100. A typical result from a partial pressure plot is shown in Figure 7-16. If you
need to change the displayed pressure range, click on "Analog Scanning" and change the
pressure range on that page (see "Analog Scanning" below). Note that the charts plot new
data on the left and old data on the right; this is opposite from the way the data are plotted
on the PPM100 chart display.
PPM100 Partial Pressure Monitor
Using the EWS 7-25
Figure 7-16. Partial pressure versus time chart.
Figure 7-17. Voltage versus time chart.
MassSpec Display and Analog Scanning
Warning!
Process control is disabled during an analog scan. The interruption of process control
may be lengthy depending upon the scan's parameters. If your PPM100 is actively being
used for process control, be sure that it is safe to interrupt your process before performing
an analog scan.
This function allows you to set up and acquire an analog scan similar to that shown in
Figure 7-18.
PPM100 Partial Pressure Monitor
7-26 Using the EWS
Figure 7-18. An Analog Scan.
You can control the RGA's filament and electron multiplier from the analog scan page
(Figure 7-19) as well as setting scan range, noise floor, and displayed pressure limits.
Figure 7-19. Analog Scan Setup.
Filament Control
Filament control is a "dynamic button". The function of the button changes depending
upon the current state of the RGA. For example, if the RGA's filament is off when this
PPM100 Partial Pressure Monitor
Using the EWS 7-27
page is loaded into your browser, the button's label will read "Click to Turn Filament On"
and clicking the button will send a request to energize the filament. If the RGA's filament
is already on when the page is loaded, the label will read "Click to Turn Filament Off"
and clicking the button will send a request to turn the filament off.
Multiplier Control
Multiplier control is a "dynamic button". The function of the button changes depending
upon the current state of the RGA. For example, if the RGA's electron multiplier is off
when this page is loaded into your browser, the button's label will read "Click to Turn
Multiplier On" and clicking the button will send a request to activate the electron
multiplier. If the RGA's multiplier is already on when the page is loaded, the label will
read "Click to Turn Multiplier Off" and clicking the button will send a request to turn the
filament off. Note that your RGA must be equipped with an electron multiplier (RGA
Option 01) for this button to have physical meaning.
Scanning Parameters
If you are satisfied with the state of the filament and multiplier, you may still need to
adjust some parameters before your scan begins. Each parameter and its function is
described below. When you are satisfied with the parameters, press the button labeled
"Click to Set Parameters". The changes you made will be sent to the PPM and RGA, and
the page will be re-drawn to reflect these changes. If you are happy with the changes,
"Click to Accept all Parameters and Begin Analog Scan".
Note
Your scanning parameter changes are NOT submitted until you press the button labeled
"Click to Set Parameters". Do not press "Click to Accept all Parameters and Begin
Analog Scan" before your changes are submitted.
Mass Range
Set the initial and final mass for your scan by typing values (in AMU) into these boxes.
Make sure that your final mass is within the mass range allowed by your RGA (≤ 100 for
an RGA100, and so on).
Pressure Range
This parameter allows you to set the minimum and maximum displayed pressure. Rather
than keying in a number as in the Mass Range parameters, a drop-down box is used to
allow quick changes of scale. Click on the drop-down box and choose an exponent from
0 to -12. For each parameter, this gives a range of 1 to 1E-12 in the pressure units in force
on the PPM.
Noise Floor
This parameter changes how fast the RGA performs a scan. A drop-down box is used to
select a value from 0-7. If the noise floor is set to 7, the RGA scans very quickly. If the
noise floor is set to 0, the RGA scans very slowly. The slower the scan, the better the
signal to noise ratio (and the lower the detection limit).
PPM100 Partial Pressure Monitor
7-28 Using the EWS
Email Notices
This function allows configuration of the email notification feature. In order to use email,
you must have entered a valid gateway address in the PPM100. A valid Simple Mail
Transfer Protocol server (SMTP) address is also required. The gateway address is
required so the EWS can access the SMTP server. The SMTP server is the machine
(typically outside your network) that accepts email and routes it to the appropriate
address. These addresses should be obtained from your local network administrator. A
mnemonic address may be used only if the PPM100 has a valid DNS address entered.
Remember, email is inherently unreliable - SMTP servers fail, delivery time is
inconsistent, you don't read your mail regularly, etc. Use email notification as a backup
to an interlock system, not in replacement of one.
Figure 7-20. Email configuration web page.
PPM100 Partial Pressure Monitor
Using the EWS 7-29
Testing the Email Function
It is very important to test the email function before using it routinely. If any address is
incorrect, you will never get an email notice.
1. Set the SMTP address. Make sure you type it correctly. If you are using a verbose
address (relay.mailhandling.com), make sure the DNS address was entered correctly
on the PPM100.
2. Set the "from" address. The SMTP may require a "from" address that has a certain
domain name. The domain name is typically the string after the '@' sign in an email
address. For example, if your email address is [email protected], you may wish
to use [email protected] as the "from" address. Ask your network
administrator if a particular domain name is required is required to use your SMTP
server.
3. Set the "to" address; this is the email address where you want notifications to be sent.
4. Click the 'Send A Test Message' button.
To learn the fate of your email message, click 'Email Status'. Your sent email and the
reply from the SMTP server will be listed there. Any reply other than "250 - OK" is an
error. Click 'Email Status' again to refresh the status if it was listed as "-2 -Awaiting
reply". If the SMTP reply is "-1 : No Reply", a connection to the SMTP server was never
made. Re-check your physical network connection as well as the gateway and SMTP
addresses. If no error occurs, but you still do not receive the email, check the "from" and
"to" addresses used.
Using the Email Function
Once you have successfully tested the email function, you can set a carbon copy (CC)
address to send a copy of the notice to another user. Use only one email address in the
CC field.
1. Set the email notices to "Enabled". A test message can always be sent by clicking the
"Send A Test Message" button, even if email notification is disabled. If you will be
unable to receive email for an extended period, it is a good idea to disable
relay-linked email notification.
2. Set the maximum number of relay-linked email notices the EWS is allowed to send.
This feature prevents accidental flooding of your mailbox. The default is 16. You
probably wish to limit this number even further. The maximum cannot be set higher
than 32. To reset the email count after a number of emails have been sent, disable
email by setting the notices to "Disabled" and then clicking "Use This Email
Configuration", then re-enable email.
3. Link process relays to email notices by clicking their checkboxes. The subject line of
each email will be the channel number of the relay that changed and its new state,
e.g. "Channel 1 : Inactive".
4. Enter a message you wish to send in the notification for both the activation and
deactivation of the relay. Note the message cannot be more than 50 characters long.
5. Click "Use This Email Configuration" to store your email setup in the EWS. Verify
the configuration is correct by clicking "Email Status".
PPM100 Partial Pressure Monitor
7-30 Using the EWS
6. Test that your configuration by manually changing the state of a linked relay from the
front panel.
If you wish to clear the configuration when you begin a new process, click "Erase This
Email Configuration".
To reset the email count after a number of emails have been sent, disable then re-enable
email.
Note
Email notification remains enabled after control is released.
PPM100 Partial Pressure Monitor
Using the EWS 7-31
Change Relays
Warning!
Changing relay states from a remote interface can be dangerous. Make sure you
understand your vacuum system and all process controls you have in place before using
this feature.
By clicking this button, you receive a web page showing the current state of all eight
relays of process control. You can set a relay to be active, inactive, or under automatic
control. To send your desired relay states to the PPM100, click the button labeled "Click
Here To Set All 8 Relays".
Figure 7-21. Relay control web page.
PPM100 Partial Pressure Monitor
7-32 Networking Terms
Networking Terms
Some terms that are used throughout this chapter are defined here.
Server
A server is simply a computer capable of delivering data to another computer. Typically,
the server is only used to deliver data and all its resources are allocated to that task.
IP Address
Each computer that is connected to the world wide web needs to have a unique address in
order for other machines to access that computer. An IP address is made up of four bytes.
It is often expressed as a set of three digit numbers separated by a '.', e.g.
209.239.160.084.
Static IP Address
A static IP address never changes. Static IP addresses are often used for servers, so that
computers on the web can find them.
Dynamic IP Address
A dynamic IP address changes frequently. Often, clients have dynamic IP addresses that
are assigned to them when they boot up. When you use a dial-up connection, an IP
address is assigned to you each time. This means you get a different IP address every
time you log on from a dial-up connection.
Fictitious IP Address
Networks that are not directly connected to the world wide web sometimes use fictitious
IP addresses valid only for local communication. Machines connected to this type of
network are not directly accessible from outside that network. This improves security of
the network and conserves the number of real IP addresses required for a facility. A
network of fictitious addresses can be connected to the web using a router.
MAC Address
The media access control (MAC) address is another unique address that belongs to the
physical network interface card. It is sometimes called an 'ethernet address'. It is often
expressed as a series of hexadecimal codes separated by a dash (for example,
00-00-1A-18-FF-00). The Internet Protocol (IP) maps each machine's individual MAC
address to an IP address.
DNS Address
People have a difficult time remembering and using long strings of numbers, so domain
name servers are in use. You can think of these machines as a kind of telephone book they associate a particular IP address (209.239.160.084) with a string of characters
(www.thinksrs.com). A DNS is not required to use the EWS, but it can make your life a
little easier.
SMTP Address
In order to send email, a special machine called a Simple Mail Transfer Protocol server is
often used. These servers respond to commands for sending email and will forward your
messages to the recipient’s local mail handling machine.
PPM100 Partial Pressure Monitor
8-1
Chapter 8
Troubleshooting and Maintenance
Troubleshooting a vacuum system can be a complex and daunting task. This chapter contains
troubleshooting information for the PPM100. Please read and follow all warnings presented in this
chapter. See 'Safety and Preparation for Use' at the beginning of this manual to remind yourself of some
of the dangers involved in working with vacuum systems.
In This Chapter
Warnings
8-3
Resetting the PPM100
8-3
Error Detection
8-4
Built-in Checks
Event Logging
Remote Status Checking
Interface Queues
8-4
8-5
8-5
8-6
PPM100 Error Messages
8-7
Pressure/Voltage Display
RGA
8-7
8-8
Basic Troubleshooting
Input Power
RGA
Capacitance Manometer
Process Control
Analog I/O
8-9
8-9
8-9
8-11
8-12
8-12
Maintenance
8-13
Touchscreen
8-13
Damage Requiring Service
8-14
PPM100 Partial Pressure Monitor
8-2
Troubleshooting and Maintenance
PPM100 Partial Pressure Monitor
Troubleshooting and Maintenance
8-3
Warnings
•
Read and follow all 'Safety and Preparation for Use' warnings before handling
this product (see front of this manual).
•
Dangerous voltages, capable of causing injury or death, are present in this instrument. Use extreme
caution whenever troubleshooting any of its parts.
•
Do not substitute parts or modify the instrument. Do not use the product if it has unauthorized
modifications. Return the product to Stanford Research Systems for service and repair to ensure that
safety features are maintained.
•
Use only SRS supplied replacement/accessory parts.
•
The PPM100 controller does not have any serviceable parts.
•
Consult the 'Damage Requiring Service' section at the end of this chapter for instructions on how to
return the instrument for authorized service and adjustment.
Resetting the PPM100
If the unit appears to be 'hung' and unresponsive to front panel inputs, disconnect and
then reconnect line power.
To reset the instrument to its default settings, turn the unit on (using the red POWER key)
while holding down the E. MULTIPLIER key.
PPM100 Partial Pressure Monitor
8-4
Error Detection
Error Detection
Important
Diagnose and troubleshoot problems as soon as they are detected.
Even though the hardware tests built into the PPM100 can test the instrument for a large
variety of problems, they cannot detect all possible error conditions.
If system downtime is of prime concern, it is recommended that a spare PPM100 unit be
available for immediate replacement in the cause of failure or problems.
Built-in Checks
Several built-in hardware tests automatically check the RGA head when the unit is turned
on. Additional tests are performed (as required) during the routine operation of the mass
spectrometer. Error and Status registers, routinely queried by the PPM100, store the
results of all tests in the RGA head’s internal memory.
Tip
For a detailed listing of RGA Error conditions and Troubleshooting options , consult the
RGA’s Operation and Programming Manual.
Several additional built-in hardware test procedures automatically check the PPM100
electronics when the unit is turned on, and continuously track the internal workings of the
controller during operation.
All detected PPM100 and RGA errors are immediately reported through on-screen
messages, audio alarms, LEDs or over the computer interfaces.
Error Messages
Text error messages are shown in the Data Bars and Data Boxes of the PPM100 display.
Consult the 'Error Messages' section of this chapter for more information.
Touch the Data Box and choose 'Status Information' to display an explanation of the
gauge status message.
Audio Alarms
Sounds are used to draw the user’s attention to potentially serious problems.
PPM100 Partial Pressure Monitor
Error Detection
8-5
Error Status Words
Internal status words signal all status and error conditions through the computer
interfaces.
RGA Error Pop-up Windows
RGA Errors are reported through pop-up windows which display RGA error codes and,
in some cases, troubleshooting instructions. Consult Chapter 9 of the SRS RGA
Operation and Programming manual to obtain troubleshooting information for all RGA
error codes.
RGA Error LED
A Red LED on the back plane of the RGA Electronics Box lights up to indicate the
presence of detected Errors within the RGA Head. All detected RGA Errors are
prompted, and described, on the front panel of the PPM100.
RGA Connection Indicators
The status of the RGA RS-232 connection between the PPM100 and the RGA head is
indicated by a connection icon at the upper right of the LCD screen.
The connected symbol indicates that the RS-232 connection to the RGA head is
fully functional and in normal operation mode.
The unconnected symbol indicates that the RS-232 interface is configured for
normal operation mode but that the PPM100 has failed to detect the RGA head.
P/T
Indicates that the HOST RS-232 port is in Pass Through Mode.
Event Logging
All Process Control events are stored in the Process History log. Use the [History]
QuickKey in the Process Control Display to trace all channel actions and debug your
process control settings. Use the [Overview] QuickKey to list the state and rules for all
the Process Control channels.
Remote Status Checking
Status reporting commands are available to query the RGA, Gauges and Process Control
Status through the computer interfaces. Users developing their own control software
should integrate status-checking commands into their programs and use them to monitor
the condition of their system. Status checking and error reporting should be an integral
part of any custom-built control software.
The PPM100 controller offers sophisticated error and status reporting capabilities,
beyond the simple error reporting capabilities of the RGA Head.
Tip
Keep in mind that the PPM100 also offers a pass-through communication mode that can
be used to query the RGA’s Error and Status bytes directly through the PPM100
interface.
PPM100 Partial Pressure Monitor
8-6
Error Detection
For More Information
Consult Chapter 6 for a complete listing of the error checking commands and status
registers.
Consult Chapter 6 of the SRS RGA Operation and Programming manual for details on
RGA error codes and status checking commands.
Interface Queues
The PPM100 buffers the most recent characters received and transmitted over the RS-232
(HOST RS-232), GPIB, USB and Web interfaces. A Queue Display, accessed through
the Remote submenu of the Main Menu, shows the interface history for both transmitted
and received data. Use this feature to troubleshoot communications during the
development of your custom control software.
For More Information
Consult the RS-232, GPIB, USB and Web Queue menu items in Chapter 3 of this
manual. Consult Chapter 6 for communications troubleshooting information.
PPM100 Partial Pressure Monitor
Error Messages
8-7
PPM100 Error Messages
Error Messages alert PPM100 users of instrument malfunctions detected during normal
operation. They are short descriptive messages (one or two words) displayed within a
Data Box or Data Bar where measurements are normally displayed. Touch the Data Box
and choose 'Status Information' to display a more complete description of the problem.
The following tables list all Error Messages, along with possible causes and
recommended solutions.
Pressure/Voltage Display
Error Message
Cause
Solution
OVERRANGE
The Data is too large for a valid
reading
Reduce the pressure or voltage in your
system.
NEGATIVE
The PPM100 cannot display
negative numbers in this display
mode.
Rezero the controller.
The input voltage is beyond the
±12V range of the analog I/O port.
Excessive input voltage.
Limit the voltage range of the input signal.
Use a voltage divider if necessary.
There is a serious system hardware
problem in the controller that needs
immediate attention.
Contact SRS.
RESET
There has been no data to display
since the unit was turned on.
Contact SRS.
DISPLAY OFF
Pressure Display turned off
This usually means that the CM Mode
has been set to Off for the AnalogIO Port.
DAC OUTPUT
The CM is connected to an analog
I/O port configured as a DAC output.
Configure the capacitance manometer
port as an AD input so that you can read
pressures directly.
GAUGE OFF
The external Gauge is off
The voltage provided by the gauge is
<1V, indicating an OFF condition.
OVERLOAD
FAULT
Choose a different display mode.
Reduce the pressure of the capacitance
manometer connected to the port.
Do NOT use the PPM100 until the
problem is diagnosed.
Note: Most compact gauges provide
voltage outputs between 2 and 10V. A
voltage output below 1V is interpreted as
the gauge being Off.
GAUGE FAULT
The external Gauge is in a FAULT
Status
The voltage provided by the gauge is
>10V, indicating a FAULT condition.
Note: Most compact gauges provide
voltage outputs between 2 and 10V. A
voltage output above 10V is interpreted
as the gauge being in a FAULT
Condition.
PPM100 Partial Pressure Monitor
8-8
Error Messages
Error Message
Cause
Solution
WAIT
The controller is computing the
answer.
Wait for the answer.
Emission current is being
established in the RGA
Wait for the emission current to stabilize.
The RGA has not returned the data
requested yet.
Wait for the data to be returned
RS-232 cable to RGA is damaged.
Check RS-232 cable continuity or replace
cable.
The gauge has not been selected.
Select the gauge.
Error Message
Cause
Solution
NO RGA
No RGA is connected to this
PPM100.
Connect RGA to PPM100 (see
Chapter 1).
RGA power is off.
Turn RGA power on.
RS-232 cable to RGA is damaged.
Check RS-232 cable continuity or replace
cable.
RGA Filament is turned off
Turn the RGA Filament on using the
FILAMENT button on the front panel.
NOT SELECTED
RGA
The RGA connect
icon is indicating
no communication
with the RGA head.
FILAMENT OFF
Or
Set “Ionization Source=External” in the
RGA Setup menu of the PPM100 if an
external ion source is being used.
TTL LOCKOUT
The RGA filament is turned off by the
RGA_Fil_Lockout pin of the TTL
Remote Control Module. The
filament remains off as long as this
pin is held LOW, and
RGA_Remote_Enable is LOW.
PPM100 Partial Pressure Monitor
Set the RGA_Fil_Lockout pin high or
disable Remote Control (set
RGA_Remote_Enable=High).
Basic Troubleshooting
8-9
Basic Troubleshooting
This section documents symptoms, causes and possible solutions for some of the
common problems encountered during the operation of a PPM100 controller.
Note
The problems listed below DO NOT GENERATE Error Messages.
Input Power
Power Problems
Symptom
Possible Cause
Solution
LINE LED is off
No AC power available to the
controller
Check your connection to the AC power
outlet.
Look for defective power outlet, defective
power cord or power cord not connected.
Defective internal power supply
module
If AC power is available to the controller
but the LED is still off, contact SRS.
RGA
RGA
Symptom
Possible Cause
Solution
Pressure reading is
very inaccurate
Electrical leakage in the RGA
feedthrough
Bakeout the RGA probe. Wash the RGA
probe if no change.
Defective electrometer circuit
Contact SRS.
Electrometer drift
Perform "Calibrate Electrometer"
operation
Tube sensitivity improperly
programmed
Reprogram the RGA's sensitivity factor
(using the RGA Windows software).
Contaminated RGA probe
Bakeout and/or degas the RGA probe.
Wash the RGA probe if no change.
Poor conductance in RGA's
connection to vacuum system
Move the RGA probe to the
point-of-measure and/or increase
conductance.
Cross-talk with other ion sources
Separate the RGA head from other ion
sources such as magnetrons, ion gauges,
ion pumps, ion guns, etc.
PPM100 Partial Pressure Monitor
8-10 Basic Troubleshooting
RGA
Symptom
Possible Cause
Solution
Pressure reading too
low
Electrometer drift
Perform "Calibrate Electrometer"
operation.
Defective electrometer circuit
Contact SRS.
Contaminated RGA head
Clean RGA head.
Defective RGA head
Replace/repair the RGA head.
RGA probe badly contaminated
Bakeout, and/or degas. Wash the RGA
probe if no change.
Improper grounding
Perform a Proper Grounding Test (see
Chapter 1).
Bad electrical connection
Check connection between RGA probe
and ECU.
Faulty electrometer
Contact SRS.
Cross-talk with other ion sources
Turn off all other sources of ions.
Separate/shield the RGA from other
ionization gauges, ion pumps, etc.
Excessive vibrations
Isolate the vacuum system from the
vibration source.
Contaminated/damaged filament
Bakeout and/or degas the RGA probe.
Try alternate filament if available. Identify
and eliminate any source of
contamination.
Pressure is too high
Reduce the pressure at the RGA head.
Defective power supply
Contact SRS.
RGA filament not turned on
Turn on the RGA filament before
selecting DEGAS.
Defective RGA ECU
Contact SRS.
RGA shuts off after
degas is initiated
Damaged filament
Replace the filament.
Badly contaminated tube
Bakeout or wash the RGA probe.
RGA not detected
PPM100 is in RS-232 Pass
Through Mode
Check the Main/Remote/RS232 menu
and set RGA Pass Through to Normal
Operation.
Pressure readings
erratic
RGA filament is
unusually bright as
soon as emission is
turned on. (Requires a
viewport in the
system.)
Degas will not turn on
PPM100 Partial Pressure Monitor
Basic Troubleshooting 8-11
Capacitance Manometer
Capacitance Manometer Problems
Symptom
Possible Cause
Solution
Pressure reading
grossly in error
Gauge contaminated or damaged
Consult your gauge manual or
manufacturer for possible solutions.
Excessive mechanical vibration
Remove the vibrations or mechanically
isolate.
Wrong full range (CM Pmax)
setting
Check the CM Pmax value, and adjust if
necessary.
Poor conductance in gauge’s
connection to vacuum system
Move the gauge to the
point-of-measurement, or increase
conductance.
Gauge needs to warm up
Temperature compensated gauges need
up to one hour to completely warm up.
Controller out of calibration or
faulty gauge electronics
Contact SRS.
Wrong supply voltage
Check power supply voltage and current
limit settings. Do not use the AUX ±15V
supply for heated gauges.
Zero drifted off
Adjust the Zero calibration (using the
Gauge Setup menu).
Gauge zero is off
Perform a Trim-Pot Zero Adjustment.
Consult Chapter 3 for details.
Gauge Pmax reading
is Off
The gauge’s gain calibration has
drifted. This is a rare problem.
Follow the manufacturer’s
recommendations to adjust your gauge’s
calibration trim pots.
Gauge is unpowered
Check your cable and connections, check
the current limit in your power supply,
check the power supply operation.
Gauge output circuit is faulty
Contact the gauge manufacturer.
The pressure output signal from
the CM exceeds 12V
Reduce the pressure at the CM until it is
below Pmax.
(Vout ≠10V when
P=Pmax)
Gauge reading is too
low and unresponsive
to pressure changes
Gauge reading is
'OVERLOAD'
PPM100 Partial Pressure Monitor
8-12 Basic Troubleshooting
Process Control
Process Control Problems
Symptom
Possible Cause
Solution
Channel output does
not respond to input
signal
Incorrect rules
Review the Channel Rules.
Bad connection
Check the channel connections.
Delay is too long
Reduce the Delay setting.
Hysteresis is too large
Reduce the Hysteresis setting.
MassSpec Display is active
(analog scan in progress)
Exit the MassSpec Display.
Channel activates at
wrong setpoint or time
Incorrect rule
Check the Channel Rules – Setpoint,
Hysteresis and Delay settings
Relay closure does the
opposite of what is
expected
Wrong connection
Check the relay connection. Each SPDT
relay has three connection pins, make
sure you are connected to the right ones.
Relay contact opens
and closes
intermittently around
the setpoint
Hysteresis percentage setting is
too small
Increase the Hysteresis Percentage
setting.
Check for excessive noise in the input
signal. Filter if necessary.
Analog I/O
Analog I/O Problems
Symptom
Possible Cause
Solution
The analog output
does not follow the log
of the pressure of the
gauge
The Analog I/O port is not
configured properly.
Make sure the analog I/O port is
configured as an Output and linked to the
right gauge.
Analog reading is
'OVERLOAD'
The input signal exceeds ±12V
range.
Reduce the input voltage until it is
between –12V and +12V.
PPM100 Partial Pressure Monitor
Maintenance 8-13
Maintenance
SRS RGA
The SRS RGA requires routine maintenance and occasional troubleshooting. For
information consult the Maintenance chapter of the RGA’s Operating Manual and
Programming Reference.
PPM100 Controller
IMPORTANT
The PPM100 controller box does not have any serviceable parts and requires no
scheduled maintenance.
The PPM100 is only recommended for use in a clean, dry laboratory environment.
Operation in other environments may cause damage to the controller and reduce the
effectiveness of the safety features.
In all cases provide adequate ventilation for the control unit to dissipate heat - ≈1 inch
clearance around the side ventilation slots is recommended. Allow at least 6 inches at the
back of the controller for cable routing. Do not mount the unit above other equipment that
generates excessive heat.
The PPM100 is designed to operate over the range 0-40°C. Ambient temperatures above
that value might damage the product. For optimum electrometer stability (particularly
while using calibrated gauges) the control unit ambient temperature should be 25±5°C.
Touchscreen
The surface of the touchscreen should be kept free of dirt, dust, fingerprints and other
materials that could degrade its optical properties. Long term contact with abrasive
materials will scratch the front surface and harm image quality.
Do not operate the touchscreen with the tips of pens or sharp objects that might
permanently stain or damage the screen surface.
Use a clean, non-abrasive cloth towel and a commercial window cleaner to regularly
clean the screen. The cleaning solution should be applied to the towel, NOT the surface
of the touchscreen. Fluid may seep behind the panel if it is not cleaned properly. Turn off
the unit or activate the Clean Touchscreen (Main menu, then Screen menu) while wiping
the screen’s surface.
PPM100 Partial Pressure Monitor
8-14 Damage Requiring Service
Damage Requiring Service
Caution
Do not use this product if it has unauthorized modifications. Unauthorized modifications may result in
fire, electric shock and other hazards.
Do not use accessories not recommended in this manual as they may be hazardous.
Note
Within this section, the word 'product' specifically refers to the PPM100 Partial Pressure Monitor, any of
its accessories, or any SRS manufactured vacuum gauge.
Contact the factory for instructions on how to return the instrument for authorized service and adjustment.
Service of this product, by Authorized Service Personnel only, may be required under any of the
following conditions:
• Any cable or plug is damaged.
• The product does not operate properly even after strictly following the operating instructions.
• The product exhibits a distinct change in performance.
• A liquid has spilled inside the product.
• The product has been exposed to rain or water.
• An object has fallen into the product.
• The product has been dropped or the enclosure has been damaged.
• The product contains unauthorized modifications. Do not substitute parts or modify the product. No
user-serviceable parts are inside the controller. All service and repair information in this manual is for
the use of Authorized Service Personnel only.
• The repair and/or service of products exposed to vacuum systems can only be carried out if a
completed Declaration of Contamination (at front of manual) has been submitted. Stanford Research
Systems reserves the right to refuse acceptance of vacuum equipment where the Declaration of
Contamination has not been fully or correctly completed. SRS also reserves the right to deny return
authorizations for any vacuum equipment that could potentially be harmful to the personnel carrying
out the repair and service of the product.
PPM100 Partial Pressure Monitor