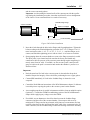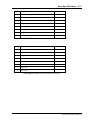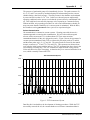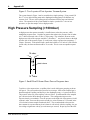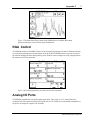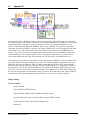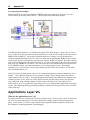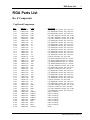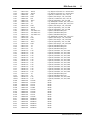
1
Operating Manual and Programming Reference Models RGA100, RGA200, and RGA300 Residual Gas Analyzer 1290-D Reamwood Ave. Sunnyvale, CA 94089 408-744-9040 · 408-744-9049 fax [email protected] · www.thinkSRS.com Revision 1.8 (May, 2009) ii Certification Stanford Research Systems certifies that this product met its published specifications at the time of shipment. Warranty This Stanford Research Systems product is warranted against defects in materials and workmanship for a period of one (1) year from the date of shipment. Service For warranty service or repair, this product must be returned to a Stanford Research Systems authorized service facility. Contact Stanford Research Systems or an authorized representative before returning this product for repair. All users returning an RGA Probe back to the factory for repair and/or service must submit a correctly completed “Declaration of Contamination of Vacuum Equipment” form along with the instrument. The SRS personnel carrying out the repair and service of vacuum equipment must be informed of the condition of the components before any work is done on the parts. A copy of the form is attached to the end of this manual. Information in this document is subject to change without notice. Copyright © Stanford Research Systems, Inc., 1996. All rights reserved. Stanford Research Systems, Inc. 1290-D Reamwood Avenue Sunnyvale, California 94089 SRS Residual Gas Analyzer Safety and Preparation For Use iii Printed in U.S.A. Safety and Preparation for Use WARNING! Dangerous voltages, capable of causing injury or death, are present in this instrument. Use extreme caution whenever the instrument cover is removed. Do not remove the cover while the unit is plugged into a live outlet. Line Cord The RGA built-in power module option (Opt02) has a detachable, three-wire power cord for connection to the power source and to a protective ground. The exposed metal parts of the instrument are connected to the outlet ground to protect against electrical shock. Always use an outlet which has a properly connected protective ground. Service Do not attempt to service or adjust this instrument unless another person, capable of providing first aid or resuscitation, is present. Do not install substitute parts or perform any unauthorized modifications to this instrument. Contact the factory for instructions on how to return the instrument for authorized service and adjustment. Fan The fans in the RGA are required to maintain proper operation. Do not block the vents in the chassis or the unit may not operate properly. SRS Residual Gas Analyzer iv SRS Residual Gas Analyzer Contents v Contents Safety and Preparation For Use ............................................................................................................... iii Contents ...................................................................................................................................................... v Specifications .......................................................................................................................................... xiv Command List.......................................................................................................................................... xvi Chapter 1 Getting Started 1-1 Unpacking ................................................................................................................................................1-2 Before You Open the Box...........................................................................................................1-2 Checklist.......................................................................................................................................1-2 Standard Equipment / Supplies .................................................................................................1-2 Accessories................................................................................................................................1-2 Optional Equipment ..................................................................................................................1-2 Related Equipment ....................................................................................................................1-3 Installation................................................................................................................................................1-4 Introduction .................................................................................................................................1-4 Probe Installation ........................................................................................................................1-4 Hardware Requirements............................................................................................................1-5 Procedure ..................................................................................................................................1-6 Electronics Control Unit Installation .........................................................................................1-8 Hardware Requirements............................................................................................................1-8 Procedure ................................................................................................................................1-10 RGA Windows Installation........................................................................................................1-11 Minimum System Requirements (Single Head Operation) ....................................................1-11 Procedure ................................................................................................................................1-12 Turning on the RGA ..................................................................................................................1-12 Running the SRS RGA System ............................................................................................................1-13 Chapter 2 RGA General Operation 2-1 What is an RGA? .....................................................................................................................................2-2 The SRS RGA...........................................................................................................................................2-3 Basic Operating Modes of the SRS RGA ..............................................................................................2-5 The SRS RGA as a Mass spectrometer.....................................................................................2-5 The SRS RGA as a Single Gas monitor.....................................................................................2-6 The SRS RGA as a Total Pressure Gauge ................................................................................2-6 Residual Gas Analysis Basics................................................................................................................2-8 How Mass Spectra are Interpreted ............................................................................................2-8 Partial Pressure Measurement ...................................................................................................2-9 Partial Pressure Sensitivity Factors ........................................................................................2-11 SRS Residual Gas Analyzer vi Contents Chapter 3 RGA Quadrupole Probe 3-1 Introduction ............................................................................................................................................. 3-2 Ionizer ...................................................................................................................................................... 3-3 Description .................................................................................................................................. 3-3 Principle of operation ................................................................................................................. 3-3 Parameter Settings ..................................................................................................................... 3-4 Quadrupole mass filter........................................................................................................................... 3-7 Description .................................................................................................................................. 3-7 Principle of operation ................................................................................................................. 3-8 Mass Range, Resolution and Throughput ............................................................................... 3-9 Zero Blast Suppression............................................................................................................ 3-12 Ion Detector ........................................................................................................................................... 3-13 Description ................................................................................................................................ 3-13 Faraday Cup operation............................................................................................................. 3-14 Electron Multiplier Operation .................................................................................................. 3-14 Hardware modifications ....................................................................................................................... 3-18 Repeller and anode grid modifications .................................................................................. 3-18 Repeller removal ....................................................................................................................... 3-19 Operation without a filament ................................................................................................... 3-19 W filament replacement............................................................................................................ 3-19 RGA Cover Nipple Replacement ............................................................................................. 3-20 Chapter 4 RGA Electronics Control Unit 4-1 Introduction ............................................................................................................................................. 4-2 Front Panel .............................................................................................................................................. 4-3 Rear Panel................................................................................................................................................ 4-4 [email protected] Connector .......................................................................................................... 4-4 RS232/DCE/28.8k Connector ..................................................................................................... 4-5 LED’s............................................................................................................................................ 4-5 Locking Knobs ............................................................................................................................ 4-5 Power entry module (Option 02) ............................................................................................... 4-5 LED Functionality ....................................................................................................................... 4-6 STATUS (Green) LED’s .......................................................................................................... 4-6 ERROR (Red) LED’s .............................................................................................................. 4-7 Electrometer ............................................................................................................................................ 4-8 Detection limit vs. scan rate ...................................................................................................... 4-8 Adjusting the Zero of the Ion Detector ..................................................................................... 4-9 SRS Residual Gas Analyzer Contents vii Mass Filter Power Supply.....................................................................................................................4-10 Maintenance and Service .....................................................................................................................4-11 Chapter 5 RGA Windows Software 5-1 Overview ..................................................................................................................................................5-3 Program Structure.......................................................................................................................5-3 RGA Files .....................................................................................................................................5-3 RGA files (.rga).........................................................................................................................5-3 RGA Scan log files (.ana .hst .tbl) ............................................................................................5-3 RGA ASCII Data files (.asc).....................................................................................................5-4 RGA Graph Metafiles (.wmf) ...................................................................................................5-4 System Requirements.................................................................................................................5-4 Getting Started.........................................................................................................................................5-5 Starting the RGA Software .........................................................................................................5-5 Connecting to a Head .................................................................................................................5-5 Shutting Down the RGA System................................................................................................5-5 Features and Operation ..........................................................................................................................5-7 The RGA Window ........................................................................................................................5-7 Multiple Head Operation .............................................................................................................5-7 Display Modes .............................................................................................................................5-7 Analog (Mode Menu)................................................................................................................5-7 Histogram (Mode Menu) ..........................................................................................................5-8 Table (Mode Menu) ..................................................................................................................5-8 P vs T (Mode Menu) .................................................................................................................5-9 Leak Test (Mode Menu) .........................................................................................................5-10 Annunciator (Mode Menu) .....................................................................................................5-10 Library (Mode Menu) .............................................................................................................5-11 Data Acquisition ........................................................................................................................5-11 Scan Data Logging....................................................................................................................5-11 Graph Management...................................................................................................................5-12 Head Management.....................................................................................................................5-12 Sensitivity Factors.....................................................................................................................5-13 Spectrum Analysis ....................................................................................................................5-13 Background Data.......................................................................................................................5-13 RGA Head and Scan Parameters .........................................................................................................5-14 Changing Scanning Parameters ..............................................................................................5-14 Changing Head Parameters .....................................................................................................5-14 Changing Scan Trigger Rates ..................................................................................................5-15 Display Modes .......................................................................................................................................5-16 Changing Display Modes..........................................................................................................5-16 SRS Residual Gas Analyzer viii Contents Running in Split Display Mode ................................................................................................ 5-16 Manual Scaling of Graphs........................................................................................................ 5-16 Using Scan Data as Background............................................................................................. 5-17 General Utilities..................................................................................................................................... 5-18 Using the Data Cursors ............................................................................................................ 5-18 Cursor command..................................................................................................................... 5-18 Cursor Properties command ................................................................................................... 5-18 Scheduled Saving of Data........................................................................................................ 5-18 Logging Scans ........................................................................................................................ 5-18 Viewing Scans ........................................................................................................................ 5-18 Browsing Through the Gas Library ........................................................................................ 5-19 Analyzing the Mass Spectrum ................................................................................................. 5-20 Spectrum Analysis description ............................................................................................... 5-20 Analysis Procedure................................................................................................................. 5-20 Averaging Scan Spectrum ....................................................................................................... 5-20 Pressure Reduction .................................................................................................................. 5-21 Y-Axis Unit Change................................................................................................................... 5-21 Head Calibration and Security.............................................................................................................. 5-22 Tuning the RGA Sensitivity...................................................................................................... 5-22 Adjusting the CEM Gain ........................................................................................................... 5-22 Peak Tuning the RGA Head ..................................................................................................... 5-23 Securing the RGA Head ........................................................................................................... 5-24 RGA On-line Help .................................................................................................................................. 5-25 Context Sensitive Help ............................................................................................................. 5-25 Help Search ............................................................................................................................... 5-25 Help Index.................................................................................................................................. 5-25 Commonly Asked Questions ................................................................................................... 5-25 Sample Scans............................................................................................................................ 5-25 Chapter 6 Programming the RGA Head 6-1 Introduction ............................................................................................................................................. 6-4 The RGA COM Utility .............................................................................................................................. 6-4 Intoduction .................................................................................................................................. 6-4 Communicating with a Head...................................................................................................... 6-4 RS232 Interface ....................................................................................................................................... 6-6 LED Indicators......................................................................................................................................... 6-6 Command Syntax.................................................................................................................................... 6-7 Examples of command formats ................................................................................................ 6-7 Programming tips...................................................................................................................... 6-8 SRS Residual Gas Analyzer Contents ix Communication Errors............................................................................................................................6-9 Command errors........................................................................................................................6-9 Parameter errors ........................................................................................................................6-9 Jumper Protection violation ......................................................................................................6-9 Troubleshooting the RGA communications .......................................................................................6-11 Programming the RGA Head ................................................................................................................6-12 Initializing the RGA Head..........................................................................................................6-12 Programming the Ionizer ..........................................................................................................6-13 Programming the Detector .......................................................................................................6-14 Setting up Analog Scans ..........................................................................................................6-16 Setting up Histogram Scans ....................................................................................................6-18 Single Mass Measurements .....................................................................................................6-20 Total Pressure Measurements .................................................................................................6-22 Storing information in the RGA Head......................................................................................6-23 Programming the Quadrupole Mass Filter .............................................................................6-24 Error Checking the RGA ...........................................................................................................6-25 RGA Command Set ...............................................................................................................................6-29 Initialization Commands ...........................................................................................................6-30 ID?....................................................................................................................................6-30 IN0, IN1, IN2 ...................................................................................................................6-30 Ionizer Control Commands ......................................................................................................6-32 DGparam, param: 0 - 20,*...............................................................................................6-32 EEparam, param: 25 - 105, *, ?.......................................................................................6-33 FLparam, param: 0.00 - 3.50, *, ? ...................................................................................6-34 IEparam, param: 0,1, *, ? ................................................................................................6-36 VFparam, param: 0 - 150, *, ?.........................................................................................6-36 Detection Control Commands..................................................................................................6-38 CA ....................................................................................................................................6-38 CL.....................................................................................................................................6-39 HVparam, param: 0 - 2490, *, ? ......................................................................................6-40 MO?..................................................................................................................................6-42 NFparam, param: 0 - 7, *, ?.............................................................................................6-42 Scan and Measurement Commands........................................................................................6-44 AP? ...................................................................................................................................6-44 HP? ...................................................................................................................................6-44 HSparam, param:0 - 255,* ..............................................................................................6-45 MFparam, param: 1 - M_MAX, *, ? ...............................................................................6-47 MIparam, param: 1 - M_MAX, *, ? ................................................................................6-48 MRparam, param:0 - M_MAX .......................................................................................6-48 SAparam, param: 10 - 25, *, ?.........................................................................................6-50 SC[param], param: 0 - 255, * ..........................................................................................6-51 TP?, TP0, TP1 ..................................................................................................................6-53 Parameter Storage Commands................................................................................................6-55 SRS Residual Gas Analyzer x Contents MGparam, param: 0.0000 - 2000.0000,?........................................................................ 6-55 MVparam, param: 0 - 2490,?.......................................................................................... 6-55 SPparam, param:0.0000 - 10.0000, ?.............................................................................. 6-56 STparam, param:0.0000 - 100.0000, ?............................................................................ 6-56 Mass Filter Control Commands............................................................................................... 6-58 MLparam, param: 0.0000 - M_MAX ............................................................................. 6-58 Error Reporting Commands..................................................................................................... 6-59 EC? .................................................................................................................................. 6-59 ED? .................................................................................................................................. 6-59 EF?................................................................................................................................... 6-60 EM?.................................................................................................................................. 6-60 EP?................................................................................................................................... 6-61 EQ? .................................................................................................................................. 6-61 ER? .................................................................................................................................. 6-62 Tuning Commands ................................................................................................................... 6-63 CE? .................................................................................................................................. 6-63 DIparam, param: 0 - 255, *, ? ......................................................................................... 6-63 DSparam, param: -0.8500 - +0.8500, *, ?....................................................................... 6-64 RIparam, param: -86.0000 - +86.0000, *, ?, none .......................................................... 6-65 RSparam, param: 600.0000 - 1600.0000, *, ?, none....................................................... 6-67 Error Byte Definitions........................................................................................................................... 6-69 Chapter 7 RGA Tuning 7-1 Introduction ............................................................................................................................................. 7-2 Tuning Options ....................................................................................................................................... 7-3 Peak Tuning Procedure.......................................................................................................................... 7-4 Introduction ................................................................................................................................. 7-4 General Procedure...................................................................................................................... 7-5 Peak Position Tuning Algorithms ............................................................................................. 7-6 Peak Width Tuning Algorithms: ................................................................................................ 7-8 Temperature effects on the mass scale calibration: ............................................................... 7-9 Sensitivity Tuning Procedure .............................................................................................................. 7-11 Electron Multiplier Tuning Procedure................................................................................................. 7-14 Chapter 8 RGA Maintenance 8-1 Warnings!................................................................................................................................................. 8-3 Probe Bakeout......................................................................................................................................... 8-5 Procedure .................................................................................................................................... 8-6 Ionizer Degas........................................................................................................................................... 8-7 Ionizer Replacement ............................................................................................................................... 8-8 Equipment ................................................................................................................................... 8-8 SRS Residual Gas Analyzer Contents xi Procedure.....................................................................................................................................8-8 Filament Replacement ..........................................................................................................................8-11 Handling and care of the filament............................................................................................8-11 Equipment ..................................................................................................................................8-11 Procedure...................................................................................................................................8-11 CDEM Handling and Care .....................................................................................................................8-14 Handling and mounting ............................................................................................................8-14 Operating pressure ...................................................................................................................8-14 Operating temperature..............................................................................................................8-14 Bakeout temperature ................................................................................................................8-14 Operating voltage......................................................................................................................8-14 Initial pump-down......................................................................................................................8-14 Contamination ...........................................................................................................................8-15 Storage .......................................................................................................................................8-15 CDEM Pre-conditioning ........................................................................................................................8-16 CDEM Refreshment ...............................................................................................................................8-17 Materials .....................................................................................................................................8-17 Procedure...................................................................................................................................8-17 CDEM Replacement ..............................................................................................................................8-18 Equipment ..................................................................................................................................8-18 Procedure...................................................................................................................................8-18 Quadrupole filter cleaning....................................................................................................................8-21 Equipment ..................................................................................................................................8-21 Procedure...................................................................................................................................8-22 SRS Probe Refurbishing Service .........................................................................................................8-25 Chapter 9 RGA Troubleshooting 9-1 Warnings ..................................................................................................................................................9-2 Internal Error Detection in the SRS RGA ..............................................................................................9-3 Basic Troubleshooting ...........................................................................................................................9-5 Built-in Hardware Checks.....................................................................................................................9-10 24V DC Power Supply ...............................................................................................................9-10 Electrometer...............................................................................................................................9-10 Quadrupole Mass Filter RF P/S................................................................................................9-11 Filament’s Background Protection mode ...............................................................................9-12 SRS Residual Gas Analyzer xii Contents Chapter 10 RGA Circuit Description 10-1 Overview of the RGA ............................................................................................................................ 10-3 Circuit Description................................................................................................................................ 10-4 General Description.................................................................................................................. 10-4 Circuit Boards ........................................................................................................................... 10-5 Description of Schematics................................................................................................................... 10-6 Schematic name: QMSE_T1 .................................................................................................... 10-6 Microprocessor ....................................................................................................................... 10-6 Digital I/O Ports...................................................................................................................... 10-6 The LED port.......................................................................................................................... 10-7 The MPX port......................................................................................................................... 10-7 The MISC port........................................................................................................................ 10-7 Clocks ..................................................................................................................................... 10-7 RS232 Interface ...................................................................................................................... 10-8 Schematic name: QMSE_T2 .................................................................................................... 10-8 I/V calibration......................................................................................................................... 10-8 A/D Conversion...................................................................................................................... 10-8 Power-up Conditioning........................................................................................................... 10-9 Schematic name: QMSE_T3) ................................................................................................... 10-9 DC Control Voltages .............................................................................................................. 10-9 RF Amplitude Detection....................................................................................................... 10-10 RF Amplitude Control .......................................................................................................... 10-10 Foldback Current Limiting ................................................................................................... 10-10 Schematic name: QMSE_B1. ................................................................................................. 10-11 Mass filter RF Supply........................................................................................................... 10-11 DC Potentials........................................................................................................................ 10-12 Schematic name: QMSE_B2. ................................................................................................. 10-12 Filament Heater Supply........................................................................................................ 10-12 Bias Regulators..................................................................................................................... 10-13 Schematic name: QMSE_B3 .................................................................................................. 10-14 Power Supplies ..................................................................................................................... 10-14 Schematic name: QMSE_V1 .................................................................................................. 10-14 Signal Conditioning.............................................................................................................. 10-14 Schematic name: QMSE_V2 .................................................................................................. 10-16 Electron Multiplier High Voltage Power Supply ................................................................. 10-16 Chapter 11 RGA Probe Assembly RGA Probe Assembly Schematic ......................................................................................................... 11-3 Feedthru Flange Connectors Schematic............................................................................................. 11-4 O100MAX Maximum Insertion Nipple Drawing ................................................................................... 11-5 Appendix A Vacuum Diagnosis with SRS RGA’s SRS Residual Gas Analyzer Contents xiii Appendix B Using SRS RGA’s to Sample High Pressure Gasses Appendix C Do I Need a PPM100 Partial Pressure Monitor for My SRS RGA? Appendix D SRS RGA LabVIEW Development Kit Glossary of Terms Vacuum References RGA Parts List and Schematics Declaration of Contamination of Vacuum Equipment Form SRS Residual Gas Analyzer xiv Specifications Specifications Operational Mass Range: RGA100 1 to 100 amu RGA200 1 to 200 amu RGA300 1 to 300 amu Mass filter type Quadrupole (Cylindrical rods, rod diameter: 0.25”, rod length: 4.5”) Detector type Faraday cup (FC) - standard Electron multiplier (CDEM) - optional Resolution Better than 0.5 amu @ 10% peak height Adjustable to constant peak width throughout the entire mass range. (per AVS standard 2.3). Sensitivity (A/Torr)* 2.10-4 (FC) <200 (CDEM). User adjustable throughout high voltage range. Minimum detectable partial pressure (MDPP)* 5.10-11 Torr (FC). 5.10-14 Torr (CDEM). Operating pressure range 10-4 Torr to UHV (FC) 10-6 Torr to UHV (CDEM) Max. bakeout temperature (without ECU) 300°C Operating Temperature 70°C (max.) Recommended bakeout temperature 200°C (O100HJR Heater Jacket recommended) Total press. measurement Available with FC measurements only * Measured with N2 @ 28 amu with 1 amu full peak width @ 10% height, 70 eV electron energy, 12 eV ion energy and 1 mA electron emission current. Ionizer Design Open ion source, cylindrical symmetry. Operation Electron impact ionization. Material Stainless steel, type 304. SRS Residual Gas Analyzer Specifications Filament Thoriated Iridium (dual) with firmware protection. Field replaceable. Degas 1 to 10 W Degas ramp-up. Electron energy 25 to 105 V, programmable. Ion energy 8 or 12 V, programmable. Focus voltage 0 to 150 V, programmable. Electron emission current 0 to 3.5 mA, programmable. xv General Probe dimension 8.75" from flange face to top of ionizer Probe insertion 2.0" Probe mounting flange 2.75" CF Minimum port I.D. 1.375" ECU dimensions 9.1" x 4.1"x 3.1". Easily separated from the probe for bakeout. LED indicators Power (ON/OFF), Filament (ON/OFF), Degas (ON/OFF), Elec. mult. (ON/OFF), RS-232 (Busy signal), Error, Leak, and Burnt Filament. Computer interface RS-232C, 28,800 Baud with high level command set and fully enabled RTS/CTS handshaking. Software Windows OS based application. Power Requirement 24 VDC @ 2.5 Amps. Male DB9 connector. Optional 110/120/220/240 VAC (50/60 Hz) built-in power module. Weight 6 lbs. Warranty One year parts and labor on materials and workmanship. SRS Residual Gas Analyzer xvi Command List Command List Initialization Name ID IN Description Identification Query Initialization Parameters ? 0,1,2 Echo ID String STATUS Byte Echo STATUS Byte STATUS Byte or query response STATUS Byte or query response STATUS Byte or query response STATUS Byte or query response Ionizer Control Name DG EE Description Degas Ionizer Electron Energy Parameters 0-20, * 25-105, *, ? FL Electron Emission Current 0-3.50, *, ? IE Ion Energy 0, 1, *, ? VF Focus Plate Voltage 0-150, *, ? Detection Control Name CA CL HV Description Calibrate All Calibrate Electrometer CDEM’s High Voltage Parameters none none 0-2490, *,? MO NF Multiplier Option Noise Floor ? 0-7,? Echo STATUS Byte STATUS Byte STATUS Byte or query response CDEM option Query response Parameters ? ? 0-255, *, none 1-M_MAX, *, ? 1-M_MAX, *, ? 0, M_MAX 10-25,*,? 0-255,*, none 0, 1, ? Echo Query response Query Response Ion Currents Query response Query response Ion Current Query response Ion Currents Ion Current Parameters 0.0000-2000.0000,? 0-2490, ? 0.0000-10.0000,? 0.0000-100.0000, ? Echo Query Response Query Response Query response Query response Scan and Measurement Control Name AP HP HS MF MI MR SA SC TP Description Analog Scan Points Histogram Scan Points Histogram Scan Trigger Final Mass Initial Mass Single mass measurement Steps per amu Analog Scan Trigger Total Pressure measurement Parameter Storage Name MG MV SP ST Description CDEM gain storage CDEM Bias Voltage storage Partial Pressure Sensitivity Total Pressure Sensitivity SRS Residual Gas Analyzer Command List xvii Mass filter control Name ML Description Mass Lock Parameters 0.0000-M_MAX Echo none Description Calibration Enable Query DI parameter (Peak Width Tuning) DS parameter (Peak Width Tuning) RF_Driver @0 amu (Peak Position Tuning) RF_Driver @ 128 amu (Peak Position Tuning) Parameters ? 0-255, *, ? Echo Query response Query response -2.5500-2.5500, *, ? Query response -86.0000-86.0000, *, ?,none 600.0000-1600.0000, *, ?,none Query response Parameters ? ? ? ? ? ? ? Echo Query response Query response Query response Query response Query response Query response Query response Tuning Name CE DI DS RI RS Query response Error Reporting Name ER EP ED EQ EM EF EC Description STATUS Byte Query PS_ERR Byte Query DET_ERR Byte Query QMF_ERR Byte Query CEM_ERR Byte Query FIL_ERR Byte Query RS232_ERR Byte Query Note: M_MAX= 100 for RGA100, 200 for RGA200 and 300 for RGA300. SRS Residual Gas Analyzer xviii Command List SRS Residual Gas Analyzer 1-1 Chapter 1 Getting Started This chapter describes the process of unpacking, checking and installing the SRS RGA on a vacuum system. Please read and follow all installation instructions to insure that the optimum performance of the instrument is not compromised during the installation process. In This Chapter Unpacking................................................................................................................................................ 1-2 Before You Open the Box .......................................................................................................... 1-2 Checklist ...................................................................................................................................... 1-2 Standard Equipment / Supplies................................................................................................. 1-2 Accessories ............................................................................................................................... 1-2 Optional Equipment.................................................................................................................. 1-2 Related Equipment.................................................................................................................... 1-3 Installation ............................................................................................................................................... 1-4 Introduction ................................................................................................................................. 1-4 Probe Installation........................................................................................................................ 1-4 Hardware Requirements ........................................................................................................... 1-5 Procedure .................................................................................................................................. 1-6 Electronics Control Unit Installation ........................................................................................ 1-8 Hardware Requirements ........................................................................................................... 1-8 Procedure ................................................................................................................................ 1-10 RGA Windows Installation ....................................................................................................... 1-11 Minimum System Requirements (Single Head Operation) .................................................... 1-11 Procedure ................................................................................................................................ 1-11 Turning on the RGA.................................................................................................................. 1-12 Running the SRS RGA System............................................................................................................ 1-13 SRS Residual Gas Analyzer 1-2 Unpacking Unpacking Before You Open the Box 1. To reduce the chance of contamination, do not remove the probe from its plastic shipping container until moments before it is ready to be installed in the vacuum system. 2. Avoid contaminating the RGA gauge. Follow good high vacuum practice. Set aside a clean, dust free, work area next to the vacuum port before installation begins. 3. Please read and follow all installation instructions in this chapter to insure that the optimum performance of the instrument is not compromised during the installation process. 4. Do not power up the instrument until it is instructed in the installation procedure. 5. Take a moment at this time to read the CDEM Handling and Care section of the RGA Maintenance chapter if your unit includes the electron multiplier option (Option 01). 6. Do not operate the RGA if the pressure in the chamber is greater than 10-4 Torr. Consult Appendix B for information on Pressure Reduction Systems. 7. Read the General Operation chapter of this manual for an overview of the instrument and its functions. 8. Inspect all components of the SRS RGA System upon unpacking. Report any damage to Stanford Research Systems immediately. Compare the contents of the shipping container with the Checklist below and report any discrepancies. Checklist Standard Equipment / Supplies 1. One RGA Probe (in sealed plastic container.) 2. One Electronics Control Unit box. 3. Compact Disk with RGA Windows software. 4. DB9-DB9 RS232 cable (25’ length). 5. Operating Manual and Programming Reference. Accessories 1. Female DB-9 cable connector, with two wires for 24V power supply connection (not provided with Option 02). Optional Equipment 1. Option 01 Electron multiplier, with HVPS. Preinstalled at the factory. SRS Residual Gas Analyzer Unpacking 1-3 2. Option 02 Built-in power module for AC line operation (Option 02). Preinstalled at the factory. Includes one power cord. 3. Option 03 Electron Multiplier Ion Counting Output (must also have Option 01.) 4. Option 04 NIST Traceable 5 % calibration (N2) 5. O100RF Replacement Thoriated Iridium Filament Kit. 6. O100RI Replacement Ionizer Kit (includes filament). 7. O100EM Replacement Electron Multiplier. 8. O100HJR 200 qC Heater Jacket for RGA (cannot be used with O100MAX) 9. O100MAX Maximum Insertion nipple with 4.5” CF Flange (Factory installed; standard nipple not supplied when this option is ordered). Related Equipment 1. QMS100/200/300 Quadrupole Mass Sampler system. 2. PPR100/200/300 Vacuum Process Monitoring system. 3. CIS100/200/300 Closed Ion Source quadrupole mass spectrometer. 4. PPM100 Optional stand-alone Partial Pressure monitor for RGA. 5. IGC100 Ionization Gauge Controller SRS Residual Gas Analyzer 1-4 Installation Installation Introduction The standard SRS RGA System consists of: 1. RGA Probe. 2. Electronics Control Unit (ECU.) 3. RGA Windows Software. Specific hardware requirements and installation instructions are needed for each one of the components. Important x Follow the installation steps in the strict order in which they are presented in this chapter. x Do not power up the instrument until it is indicated in the procedure. x Read the hardware requirements before installation begins. Do not start the installation procedure until all requirements are met. x Please read and follow all installation instructions to insure that the optimum performance of the instrument is not compromised during the installation process. Probe Installation The RGA probe can be mounted on any standard 2 3/4" CF port of the vacuum chamber that provides enough clearance for the ionizer’s outer cage. A stainless steel tube (RGA Cover Nipple) covers the probe assembly with the exception of the ionizer. The ionizer is the only component of the probe that protrudes into the vacuum system (see Figure 1.) Warnings: i Do not remove the probe from its plastic shipping cover until it is ready to be installed in the vacuum system. i Do not remove the RGA Cover Nipple from the probe. The stainless steel tube is an integral part of the quadrupole assembly and the RGA will not operate properly without it. Please consult the Hardware Modifications section in the RGA Quadrupole Probe chapter of this manual for information on operating the RGA probe without its factory provided cover nipple. i Do not disassemble or modify the quadrupole probe in any way without reading first the Hardware Modifications section of the RGA Quadrupole Probe chapter. i Use proper vacuum procedures while installing the probe: Set aside a clean, dust free, work area next to the vacuum port. SRS Residual Gas Analyzer Installation 1-5 Wear gloves! Do not talk or breath directly into the probe’s ionizer. Use clean tools during the installation procedure! i Protect the integrity of the Vacuum seals: Do not use nonmetal seals. Avoid scratching the metal seals. i Verify that the vacuum port is electrically grounded before attempting the installation of the RGA Probe on the vacuum system. Hardware Requirements 1. Do not operate the SRS RGA in corrosive gas environments. If the presence of corrosive gases in the vacuum environment is known or suspected, consult SRS before installing the probe in the vacuum chamber. 2. Do not operate the SRS RGA in the presence of strong magnetic fields. Magnetic fields, such as those caused by superconducting magnets or cold cathode total pressure gauges (i.e. Penning type), can affect the ion trajectories through the quadrupole filter resulting in very unreliable measurements. If the presence of magnetic fields in the vacuum environment is known or suspected, consult SRS before mounting the probe on the vacuum chamber. 3. The maximum operating pressure of the RGA is 10-4 Torr. A pressure reduction system is required if the operating pressure of the vacuum chamber is greater than 10-4 Torr. Consult Appendix B of this manual for details. 4. The probe can be mounted directly onto any standard 2 3/4" CF port of a vacuum chamber provided the following placement requirements are met: x The vacuum port must have at least 1.375” internal diameter and 2.5” depth to provide enough clearance for the ionizer (The insertion volume is comparable to that required by a nude Bayard-Albert ion gauge). x Any mounting orientation of the probe may be used. x The ionizer is the only component of the probe that protrudes into the vacuum system and it must be located close to the point where partial pressures are to be measured. If placed near a pump, the pressure in the ionizer may be considerably lower than in the rest of the system. If placed near a gas inlet or source of contamination, the pressure in the gauge may be much higher. Long tubulation or other constrictions between the ionizer and the rest of the vacuum system can cause large errors in the partial pressure readings. x The probe must be distanced or shielded from all other instruments that could potentially affect the RGA readings. For example, cross-talk with hot-cathode ion gauges is possible but easily eliminated by proper shielding or changes in the relative placement of the gauges. x The probe must be protected from evaporation sources that could coat the ionizer. SRS Residual Gas Analyzer 1-6 Installation x Enough clearance must be allowed for the ECU box that attaches directly to the probe’s feedthru flange. x Choose the orientation of the ECU box prior to the installation of the probe. Six different orientations can be obtained rotating the probe about its axis and lining up the bolt holes of the 2 3/4” Conflat flanges. Note: The ECU will operate in any orientation, but limited space, free access to the rear panel connectors and visual access to the LED’s might limit the orientation options in your vacuum system. 5. The following equipment must be available before the installation procedure starts: x One standard OFHC copper gasket for 2 3/4” CF flange. New and clean! x Six high-strength stainless steel bolts for 2 3/4” CF flanges: Use six 1/4-28 x 1 3/8” bolts, with one nut and two washers per screw, for flanges with through holes; or six 1/4-28 x 7/8” bolts, with one washer per screw, to attach the probe’s flange to a tapped vacuum port. Both standard hex and 12-point bolt heads are compatible with the RGA’s flange. Use silver-plated bolts instead of messy anti-seize lubricants whenever available. x Wrenches: One or two wrenches will be needed to tighten the six bolts and compress the copper gasket. Use a 7/16” 12-point wrench for standard hex head bolts and nuts, or a 1/4” 12-point wrench for 12-point bolt heads. x Optional adapter flanges: Install an adapter flange in the vacuum system if no 2 3/4” CF ports are available. Zero-Length Adapter flanges, with a 2 3/4” CF flange on one side and a bigger size flange on the other, are an economical alternative to reducing nipples. Procedure 1. Determine the placement of the probe in the vacuum chamber following the instructions listed in step 3 of the Hardware Requirements section. 2. Remove the probe from its plastic container. Avoid contamination following good high vacuum practices. Do not touch with bare fingers any part of the probe that will be exposed to the vacuum. Do not talk directly at an open vacuum port. 3. Hold the probe in a secured upright position and do a thorough visual inspection of the part. Check for loose, damaged or misaligned components. Minor misalignments of the ionizer’s outer cage (i.e. repeller) can occur during shipping and must be corrected before the ionizer is inserted into the vacuum chamber. Check the integrity of the metal seals in all CF flanges. Important: Abort the installation procedure and contact SRS immediately if the probe appears damaged in any way. 4. Position the copper gasket and insert the probe’s ionizer into the vacuum system. Rotate the probe about its axis and align the holes on the CF flanges, as necessary to achieve the desired orientation for the ECU box. Avoid scratching the vacuum seals SRS Residual Gas Analyzer Installation 1-7 and do not use non-metal gaskets. Important: Avoid touching the internal walls of the vacuum port with the repeller cage during the installation procedure, since that could lead to serious misalignment of the ionizer. Get an extra hand from a co-worker if necessary. RGA Mounting Flange Vacuum Chamber RGA Cover Nipple Vacuum Port Ionizer Probe Assembly Figure 1 RGA Probe Installation 5. Insert the 6 bolts through the holes in the flanges and fingertighten them. Tighten the bolts according to the standard tightening procedure for 2 3/4” CF flanges. Use 1/8 turns in crisscross order: 1, 4, 2, 5, 3, 6, 4, 1, 5 , 2, 6, 3, 1.... until the flanges are in contact, and finish the tightening process with an extra 1/16 of a turn on each bolt. 6. Start pumping down the vacuum chamber as soon as the flange connection is sealed. The RGA probe is pre-cleaned and leak tested at the factory and should only contribute to the base pressure of the vacuum system through regular outgassing (i.e. mostly water) from its walls. If available, use the vacuum system’s total pressure gauge to leak test the probe’s connection and monitor the chamber’s pressure as a function of time. Important: x Redo the metal seal if a leak in the vacuum system is detected after the probe is installed. Inspect the integrity of the seals before positioning the new copper gasket . x Contact SRS immediately if a leak in the feedthru flange is detected or even suspected. x Consult the Probe Bakeout instructions of the RGA Maintenance chapter if a bakeout is needed prior to exposing the probe to the vacuum system’s main chamber. x An overnight pump-down is needed in instruments with the electron multiplier option (Option 01). Consult the CDEM Preconditioning section of the RGA Maintenance chapter before applying any voltage across the CDEM. x If available, use an ohmmeter to check for shorts between the feedthru flange connectors and the walls of the vacuum chamber. Vacuum ports with severely misaligned CF Flanges and/or large internal weld joints are not uncommon, and can result in a short between the ionizer and the inside walls of the vacuum port tube. If a short is detected, use the Feedthru Flange Connectors drawing in the RGA Assembly SRS Residual Gas Analyzer 1-8 Installation chapter to identify the probe electrode that is causing the short. If the short is in the repeller, remove the probe from the vacuum system and correct the alignment of the outer repeller cage before reattaching the flanges (Correct alignment is best assured when the two small holes on the side of the repeller cage line up with the filament screws). If the vacuum port is severely misaligned, and the short cannot be eliminated, consider replacing the vacuum port, using a different port or operating the RGA without the repeller (See Hardware Modifications in the RGA Quadrupole Probe chapter for instructions on operating without a repeller cage.) Electronics Control Unit Installation The Electronics Control Unit (ECU) attaches directly to the probe’s feedthru-flange. Its correct alignment to the probe is very important during installation. Carefully follow the instructions below to insure proper alignment. Warning: Failure to follow the installation instructions below could result in damage to the ceramic feedthru connectors of the probe’s flange, and would require sending the entire unit back to Stanford Research Systems for a complete flange replacement. Hardware Requirements 1. External Power source: Standard ECU boxes require an external 24 +/- 2V DC power supply @ 2.5 Amps (i.e. 60 Watt) to power its electronics. Units with the optional built-in power module (Option 02) plug directly into a wall AC outlet and require no extra power sources. SRS Residual Gas Analyzer Installation 1-9 2. Power cables: External 24V power supplies must have a cable with a 9 pin, type D, female connector on the free end, wired as described in the “ECU- 24VDC power connector” diagram shown below. Note: A power cable, with a properly wired, female, DB-9 cable connector, is provided by SRS with all RGA units that do not include the built-in power module (Option 02). Attach the connector’s wires to a longer two-wire cable, of similar or bigger gauge, to make a power cord compatible with the RGA’s power connector. RGA units with the optional built-in power module (Option 02) are connected directly to a wall outlet using the three wire power cord provided by SRS. 9 5 8 4 7 3 6 2 1 Pin # Voltage 1 2 3 +24VDC +24VDC Ground 4 5 6 Ground Ground +24 VDC 7 8 Ground +24 VDC 9 Ground Figure 2 ECU 24 VDC Power Connector 3. RS232 cable: A straight through RS232 cable with 9-pin, type D connectors is needed to connect the IBM compatible PC to the ECU box. An adapter will be needed if the RS232 port of the computer has a 25 pin Type D connector. 4. The probe must be installed in the vacuum chamber before the ECU box is mounted on its flange. SRS Residual Gas Analyzer 1-10 Installation Procedure 1. Begin by inspecting the front panel of the ECU box. Use the following diagram as a reference during installation. Probe alignment holes WARNING High Voltage inside this unit. See manual for safety notice. Clearance holes (6 places) High Voltage inside this unit. See manual for safety notice. WARNING Internal connectors Locking screws (2 places) Figure 3 ECU Front Panel 2. Next, inspect the probe’s feedthru flange: Eight ceramic feedthru connectors on a 1” diameter circle surround a center tube terminated by a coaxial connector. Two alignment rods (1/4” diameter) insure the correct alignment of the ECU box to the probe during installation and two threaded holes (1/4-28) line up with the locking screws of the ECU box. 3. Push the locking screws of the ECU box as far as they will go into the box. 4. Orient the ECU so that the two small alignment holes (1/4” diameter) on its front panel and the alignment rods of the flange line up. Note that there is only one correct way to do this! 5. Slide the ECU into the probe using the alignment rods as a guide, and until physical contact is made between the probe and the ECU’s internal connectors. 6. Using gentle pressure on the back of the box, push the probe’s conductors into the ECU’s connectors until the front surface of the ECU rests flat against the back of the feedthru flange. Warning: The alignment of the probe/ECU connections is checked at the factory, for each individual RGA system and only slight resistance should be experienced during this step. If significant resistance is noted while sliding the ECU onto the probe do not exert excessive force since that might damage the ceramic-to-metal seals of the SRS Residual Gas Analyzer Installation 1-11 feedthrus. Instead, rock the ECU box up and down, while gently pushing on its back, until the connectors line up. Once the connectors are all lined up, push the box in the rest of the way. 7. Once the ECU is in place, use the knobs on the back panel of the ECU box, to turn the locking screws and lock the assembly in place. Do not over tighten! (Hand tighten.) 8. ECU Power Connection: Important: Do not power up the RGA at this time. Standard ECU boxes must be connected to the external 24 VDC power supply. Insert the 9 pin, Type D female cable connector into the ECU connector marked +24 VDC @ 2.5A on the back panel of the ECU box. Units with the optional built-in power module (Option 02) plug directly into an AC outlet and require no extra power sources: Use the power entry module on the back panel of the ECU box to power the RGA directly from an AC outlet. Use the threewire power cord provided by SRS to connect the RGA directly to a properly grounded wall outlet. 9. ECU RS-232 connection: Use the straight through RS232 cable with 9-pin, type D connectors to connect the computer (usually DTE) to the RGA. (If your computer does not have an RS232 port, use a USB-to-RS232 or Ethernet-to-RS232 adapter.) Insert the 9 pin, Type D male cable connector into the ECU connector marked: RS232/DCE/28.8k on the back panel of the ECU box. Insert the 9 pin Type D female cable connector into the RS232 port on the computer (or serial adapter). Use the DB25 to DB9 connector adapter if the computer (or serial adapter) has a 25 pin Type D connector. RGA Windows Installation Minimum System Requirements (Single Head Operation) x IBM PC compatible computer x Mouse or equivalent pointing device. x Serial port (RS232) or serial port adapter (USB-to-RS232 or Ethernet-to-RS232). x Straight through, DB-9 to DB-9, RS-232 cable. x 100 Mbytes of free hard disk space. x CD drive (for the installation disk). Software may also be downloaded directly to your computer from the SRS website at www.thinkSRS.com. x Microsoft Windows 98 or later. x If a USB to Serial adapter is required, install all necessary software drivers according to the manufacturer’s instructions. Procedure 1. Turn on the computer and start MS Windows. SRS Residual Gas Analyzer 1-12 Installation 2. Insert the RGA Windows software CD into the CD-drive of the computer. 3. Run the Setup program. 4. The software is automatically and completely installed by the RGA Setup Wizard. Read and follow all instructions. 5. An “RGA” program group with the “RGA 3.0” icon is automatically created at the end of the installation process. 6. Take a moment at this time to read the RGA Windows Software Chapter of this manual. 7. Connect any third party USB-to-Serial or Ethernet-to-serial adapter to the computer and install all necessary software drivers as indicated by its manufacturer before attempting to run the RGA Windows software. Turning on the RGA 1. Power up the RGA Head: Standard RGA heads are powered up by turning on the external 24V power supply. Units with a built in power module (Option 02) have a power switch on the back panel of the ECU box. 2. When power is applied to the ECU, a firmware routine automatically checks the external voltage level and turns on the green Power LED if the voltage is within the acceptable range of 24 +/-2 V DC. The SRS RGA Head is now ready to communicate with the computer. SRS Residual Gas Analyzer Running the SRS RGA System 1-13 Running the SRS RGA System This section describes how to launch the RGA Windows program and start acquiring data from the RGA Head. An analog scan from 1 to 50 amu is executed as an example. Important: The following steps assume that all the installation instructions described in the previous section were completed. The RGA Head should be mounted on the vacuum system, powered up and connected to the RS232 port of the IBM compatible PC computer or serial adapter. RGA Windows should be installed in the computer and ready to run. Warning: Do not operate the RGA if the pressure in the chamber is greater than 10-4 Torr. 1. Turn on the computer and start MS Windows. 2. Start the RGA Software: To start the RGA software simply double-click on the RGA icon in the "RGA" program group created by the RGA installation program, or select the program directly from the Window’s task bar: 3. Connect to the RGA Head: x Click on the toolbar’s RS232 Setup button from the Head menu. x Locate the port to which the RGA head is connected on the connector column and click to select it. x Click on the Connect button. x The connection is made when “Connected” is displayed in the status column and the toolbar’s GO button or select Connector List Setup turns green. 4. Close the connector list when the connection is completed. 5. Turn on the filament: . x Click on the toolbar’s Filament button x The ionizer is biased with default voltage values and the filament is turned on to the default emission current. It takes a few seconds for the filament wire to warm up during which a small informative dialog box is active. The Filament button remains highlighted as long as the filament is emitting electrons. x The filament emission can be toggled on/off at any time clicking on the Filament button. The ionizer settings can be changed selecting Ionizer Settings from the SRS Residual Gas Analyzer 1-14 Running the SRS RGA System Head Menu. A green status LED on the back panel of the ECU box indicates the emission status of the filament at all times and it provides the fastest way to verify if the filament is emitting electrons. 6. Perform an analog scan under the current scan conditions: Analog mode is the spectrum analysis mode common to all Residual Gas Analyzers. The X-Axis represents the mass range displayed in the Mass Spec Parameters menu. The Y-Axis represents the ion current amplitudes of every mass increment measured. RGA starts in the Analog mode of display by default. The scan range defaults to 1 to 50 amu. x Select Start from the Scan menu, or simply click on the toolbar’s GO button to trigger an analog scan. x After a small delay, the analog scan data starts to be displayed on the screen. x Rescale the Y-Axis clicking on the Auto Scale button Scale from the Graph Menu. x Change the Y-Axis to a logarithmic scale selecting the Log/Linear option of Select Scale in the Graph menu item. or selecting Auto Please refer to the RGA Windows chapter of this manual, and the RGA On-Line Help files, provided with the program disks, for detailed information on all the features, procedures, and commands available in the RGA program. Consult the RGA General Operation chapter of this manual for a general overview of the SRS RGA and its basic operating modes. SRS Residual Gas Analyzer , 2-1 Chapter 2 RGA General Operation This chapter describes the basic properties of the Stanford Research Systems Residual Gas Analyzer (SRS RGA). In This Chapter What is an RGA?..................................................................................................................................... 2-2 The SRS RGA .......................................................................................................................................... 2-3 Basic Operating Modes of the SRS RGA ............................................................................................. 2-5 The SRS RGA as a Mass spectrometer .................................................................................... 2-5 The SRS RGA as a Single Gas monitor.................................................................................... 2-6 The SRS RGA as a Total Pressure Gauge................................................................................ 2-6 Residual Gas Analysis Basics............................................................................................................... 2-8 How Mass Spectra are Interpreted............................................................................................ 2-8 Partial Pressure Measurement .................................................................................................. 2-9 Partial Pressure Sensitivity Factors ....................................................................................... 2-11 SRS Residual Gas Analyzer 2-2 What is an RGA? What is an RGA? Complete characterization of a vacuum environment requires the detection of all the component gases present, as well as measurement of the total pressure. The instruments used for this purpose are called Residual Gas Analyzers or Partial Pressure Analyzers. A Residual Gas Analyzer (RGA) is mass spectrometer of small physical dimensions that can be connected directly to a vacuum system and whose function is to analyze the gases inside the vacuum chamber. The principle of operation is the same for all RGA instruments: A small fraction of the gas molecules are ionized (positive ions), and the resulting ions are separated, detected and measured according to their molecular masses. RGA’s are widely used to quickly identify the different molecules present in a residual gas environment and, when properly calibrated, can be used to determine the concentrations or absolute partial pressures of the components of a gas mixture. SRS Residual Gas Analyzer The SRS RGA 2-3 The SRS RGA The SRS RGA is a mass spectrometer consisting of a quadrupole probe, and an Electronics Control Unit (ECU) which mounts directly on the probe’s flange, and contains all the electronics necessary to operate the instrument. Ionizer Electronics Control Unit (ECU) Quadrupole Probe Figure 1Quadrupole Head Components The probe is a specially engineered form of quadrupole mass spectrometer sensor that mounts directly onto any standard 2 3/4" CF port of a vacuum chamber. It is described in detail in the RGA Probe chapter of this manual. The total probe equipment consists of three parts: the ionizer (electron impact), the quadrupole mass filter and the ion detector. All of these parts reside in the vacuum space where the gas analysis measurements are made. The detector measures the ion currents directly (Faraday Cup) or, using an optional electron multiplier detector (Option 01), measures an ion signal proportional to the ion current. A stainless steel tube (CF Full nipple) covers the probe assembly with the exception of the ionizer. The ECU is a densely packed box of electronics (3” x 4” x 9”) that connects directly to the probe’s feedthru-flange and also to a host computer. It is described in detail in the “RGA Electronics Control Unit” chapter of this manual. It includes several regulated power supplies, a microprocessor, control firmware, and a standard RS232 communications port. It is powered by either an external 24 VDC (@2.5 Amps) power supply or an optional built-in power module (Option 02) which plugs directly into an AC outlet. A unique, temperature-compensated, logarithmic picoammeter built into its box measures the ion currents collected by the Faraday cup (FC), or electron multiplier (CDEM). The electrometer is completely autoranging and measures both positive and negative currents with the same accuracy and resolution. Its operating range covers current magnitudes between 10-7 and 10-15 A, providing six orders of magnitude dynamic range during single mass measurements and scans, and detectable partial pressures better than 10-13 Torr during electron multiplier detection. The instrument is completed with the RGA Windows software package that runs on IBM compatible PC’s. The intuitive graphical user interface allows measurements to be made and displayed in a variety of modes. The program is fully interactive and measurements are set up quickly and easily with the click of a mouse. The software also supports multiple head operation when more than one RGA head is needed. Please refer to the RGA Windows chapter of this manual, and the RGA On-Line Help files, provided with SRS Residual Gas Analyzer 2-4 The SRS RGA the program disks, for detailed information on the features, procedures, and commands available in the RGA Windows program. Intelligent firmware, built into the RGA Head, completely controls the operation of the instrument, and provides four basic modes of operation of the mass spectrometer: x Analog scanning x Histogram scanning x Single mass measurement x Total pressure measurement. RGA Windows provides fast access to all the RGA functions without the need for any computer programming; however, the instrument can also be programmed directly using the RGA Command Set supported by its serial interface. Consult the RGA Programming chapter of this manual for information on the programming options and a complete listing of the RGA Command Set. The SRS RGA is available in three different models with mass ranges of 1 to 100 (RGA100), 1 to 200 amu (RGA 200), and 1 to 300 amu (RGA300). All models operate in the “Constant Resolution” or “Constant 'm” mode, with 'M10% preset to one amu at the factory. The operating pressure is UHV to 10-4 Torr for all models. A complete product specifications listing is included in the introductory sections of this manual. SRS Residual Gas Analyzer Basic Operating Modes of the SRS RGA 2-5 Basic Operating Modes of the SRS RGA The SRS RGA is a mass spectrometer that analyzes residual gases by ionizing some of the gas molecules (positive ions), separating the resulting ions according to their respective masses and measuring the ion currents at each mass. Partial pressure measurements are determined with the help of previously calculated sensitivity (i.e. calibration) factors by reference to the abundance of the individual mass numbers attributed to each gas type. During analysis, positive ions are formed within the ionizer and directed towards the spectrometer’s quadrupole mass-filter. The mass filter determines which ions reach the detector at any given time. It is operated by a combination of RF and DC voltages and the filtering action is based on the mass-to-charge dependency of the ion trajectories on the RF and DC fields. The magnitude and frequency of the RF determine the mass-to-charge ratio of the ions that can pass through the filter without striking the rods (i.e. with stable oscillations). The RF/DC ratio determines the filter selectivity. Ions that successfully pass through the filter are focused towards the detector and the resulting analog current is measured by the very sensitive electrometer. A brief note on Mass Units in Mass Spectrometry: Since molecules are so small, it is convenient to define a special type of mass units to express the masses of individual ions. The atomic mass unit, amu, defined as 1/12 of the mass of a single carbon atom, isotope 12 (i.e. 12C), is the unit of molecular mass most commonly used in mass spectrometry (1 amu = 1.660 540 x 10-27 kg). To a very accurate approximation, the mass of a molecule in atomic mass units (amu) is equal to its mass number M, defined as the sum of the number of protons and neutrons in the molecule. Mass spectrometers do not actually measure the molecular mass directly, but rather the mass-to-charge ratio of the ions. The mass-to-charge ratio, M/Q, is defined as the ratio of the mass number M of the ion to its charge Q, measured in units of the electron charge e-. For example: doubly charged ions of argon isotope 36 (36Ar2+) and singly charged ions of water, 1H216O1+, have M/Q = 18, and cannot be differentiated from each other with most mass spectrometers. For singly charged ions, the mass to charge ratio is numerically equal to the mass of the ion in atomic mass units (amu). RGA users often use the term “mass of an ion” when they really mean the mass-tocharge ratio. This convenient way of speaking is strictly valid for singly charged ions only. The SRS RGA as a Mass spectrometer The SRS RGA can perform both analog and histogram scans over its entire mass range. Residual gas analysis relies on the interpretation of the spectral data generated by these two modes to completely characterize, both qualitatively and quantitatively, a vacuum environment. SRS Residual Gas Analyzer 2-6 Basic Operating Modes of the SRS RGA RGA Windows uses the two modes to generate the data for the Analog and Histogram Scan Modes. Analog scanning is the most basic operation of the RGA as a quadrupole mass spectrometer. During analog scanning the quadrupole mass spectrometer is stepped at fixed mass increments through a pre-specified mass-range. The ion current is measured after each mass-increment step and transmitted to the host computer over RS232. Analog scanning allows the detection of fractional masses and provides the only direct view of the peak shapes and resolution of the instrument. A Histogram (Bar Mode) Scan consists of a succession of individual peak-height measurements over a pre-specified mass range. A single value is used to represent the peak heights at each integer mass within the range. The peak height measurements are made with the Peak-locking scanning procedure described in the next section. Histogram scanning is one of the most commonly used modes of operation for the RGA. Its two main advantages are a faster scan rate than analog scans, and a reduced amount of data being exchanged during the scan. The SRS RGA as a Single Gas monitor The SRS RGA can measure individual peak heights at any integer mass within its mass range. This mode of operation is used to generate data for leak testing measurements, and to track changes in the concentrations of several different components of a mixture as a function of time. The outputs provided by a set of single mass measurements are often used in process control programs to control alarms, analog and digital outputs, and relays. RGA Windows uses this mode to generate its data for the Table, Pressure vs time, Annunciator and Leak Detection modes. Peak Locking procedure: During a Single Mass Measurement the RGA performs a Miniscan around the mass requested, and the maximum current value measured is sent out over RS232. The scanning procedure, referred to as Peak-Locking, is designed to measure peak currents for individual masses in a mass spectrum without being affected by drifts in the mass-axis calibration. The Miniscan covers a 0.6 amu range centered at the mass requested, and selects the maximum current from 7 individual measurements performed at 0.1 amu mass increments. The SRS RGA as a Total Pressure Gauge The SRS RGA can measure total pressures. The RGA might be thought of as a Total Pressure Ionization gauge with a mass analyzer interposed between the ionizer and the detector. Thus, by disabling the mass-filtering action of the analyzer section, it is possible to detect the total ion current from the ionizer and perform total pressure measurements. A total pressure sensitivity factor, stored in the non-volatile memory of the RGA, is used by RGA Windows to convert total current measurements into total pressures. SRS Residual Gas Analyzer Basic Operating Modes of the SRS RGA 2-7 Important: The RGA’s sensitivity factor for total pressure measurements is highly mass dependent. Some residual mass discrimination takes place in the filter that results in the mass dependence of the RGA readings being different from that of the Bayard-Alpert gauges. Expect to see deviations between the two gauges as the composition of the residual gas changes. Do not rely on the RGA total pressure measurement for critical applications where accurate total pressure measurements are required. A high precision IGC100 controller connected to a calibrated Bayard-Alpert ionization gauge is recommended instead. Note: RGA Windows cannot perform total pressure measurements while the electron multplier is activated. As a result, the total pressure window displays zero values while the electron multiplier is being used. For more information on this subject please consult the section titled Total Pressure Measurements in the Programming chapter of this manual. SRS Residual Gas Analyzer 2-8 Residual Gas Analysis Basics Residual Gas Analysis Basics The SRS RGA can perform both qualitative and quantitative analysis of the gases in a vacuum system. Obtaining spectra with the SRS RGA is very simple. Interpreting the spectra, that is, understanding what the spectra is trying to tell you about your vacuum system requires some work. The following sections will introduce some basic concepts of Spectral Analysis emphasizing the main aspects of Residual Gas Analysis. Consult Appendix A of this manual for specific examples on the application of the SRS RGA to vacuum diagnosis For additional information on the subject of Residual Gas Analysis refer to: 1. J. Drinkwine and D. Lichtman, Partial Pressure Analyzers and Analysis, AVS Monograph Series published by the Education Committee of the American Vacuum Society 2. Basford et. al., J. Vac. Sci. Technol. A 11(3) (1993) A22-40 “Recommended Practice for the Calibration of Mass Spectrometers for Partial Pressure Analysis. Update to AVS Standard 2.3”. For information on multiple linear regression analysis consult: 1. William H. Press, et. al., 1992, Numerical Recipes in C, The Art of Scientific Computing, Second Edition, Cambridge Univ. Press, section 15.4, page 671. 2. Bevington, P.R., 1969, Data Reduction and Error Analysis for the Physical Sciences, New York, McGraw-Hill, Chapters 8-9. How Mass Spectra are Interpreted A mass spectrum, taken in a real system, will almost always contain signals from a mixture of various gases. Careful and complete interpretation of the spectrum (i.e. a complete spectral analysis) should reveal the identity, as well as the concentrations, of the various components which have produced the spectrum. The first step in the spectral analysis process is to correctly identify the mass-to-charge ratio of all the peaks in the mass spectrum. A well calibrated mass scale is essential to this task. See the RGA Tuning Chapter for a detailed description of the mass scale calibration procedure. Once all the peaks have been labeled, the next step is to identify the residual gases that have produced the spectrum. A knowledge of the recent history of your system may provide very valuable clues as to the possible gases that may be residuals in the vacuum chamber. A familiarity with the standard spectra of commonly expected gases will generally help to determine the major and minor components in the system. Any peak in the spectrum may consist of contributions from molecular ions and/or fragment ions, or multiply ionized species. The qualitative spectral analysis is completed when all the peaks in the spectrum have been “uniquely assigned” to the components of a gas mixture, in complete agreement with the known fragmentation patterns of the components. SRS Residual Gas Analyzer Residual Gas Analysis Basics 2-9 In cases where only the major components are of interest, some of the minor peaks of the spectrum will remain unassigned. If only a few species are being monitored, only the peaks corresponding to the substances of interest need to be assigned and monitored. Notes on Fragmentation Patterns: The electron impact type of ionizer used in modern RGA’s almost always causes more than one kind of ion to be produced from a single type of gas molecule. Multiple ionization, molecular fragmentation and changes in the isotopic composition of the molecule are responsible for the effect. All ions formed contribute to the mass spectrum of the molecule and define its fragmentation pattern. The identification and interpretation of mass spectra must begin with a knowledge and understanding of the standard fragment patterns of atoms and molecules that may exist in the system. The standard fragment patterns of most molecules commonly encountered in residual gas analysis are well established and listed in the general RGA Literature. A very complete library can also be accessed through the Library Search Utility of the RGA Windows software. The Gas Library has a standard text file format, and can easily be read, extended or modified by the user to fit his individual needs. Residual Gas Analysis Tip: Virtually every vacuum system will have detectable amounts of hydrogen (2 amu), water (18 amu), carbon monoxide (28 amu) and carbon dioxide (44 amu). Become familiar with these species and their fragmentation patterns, and use their peaks to verify the correct performance of the instrument (i.e. mass scale calibration and mass resolution) while operating the RGA. Partial Pressure Measurement Once the different components of a mixture have been identified it is possible to use the SRS RGA to obtain quantitative values for the various partial pressures. This section describes the basic steps needed to perform quantitative measurements with the instrument. The formalism presented assumes multiple gas analysis, but is equally valid for single gas measurements. Please consult the suggested references for details and examples of these procedures. The entire mathematical formalism used to derive the partial pressures of a mixture based on a single mass spectrum is based on one assumption: The total spectrum is a linear combination of the spectra of the different species that are present in the mixture. In other words, the total spectrum is equal to the sum of the individual peaks that would be observed if each constituent were alone in the system. In mathematical terms, the assumption stated above can be written as the following linear equation: HM = 6g hMg (1) where: g is an integer variable that represents the gases present (i.e. assign an integer to each gas starting with one) M is an integer variable that represents the mass numbers for the entire mass range of the spectrum. SRS Residual Gas Analyzer 2-10 Residual Gas Analysis Basics HM= total peak height (amps) of the spectrum at mass number M. hMg= peak height contribution (amps) from gas g at mass M. hMg is related to the fragmentation pattern, the RGA’s sensitivity and the partial pressure of gas g by the equation: hMg = DMg Sg Pg (2) where: DMg = Fragmentation factor of gas g at mass M: Ratio of ion signal at mass M to the ion signal at the principal mass peak for gas g. Sg = RGA’s partial pressure sensitivity factor for gas g, in amp/Torr (see Partial Pressure Sensitivity Factor below) Pg = Partial pressure of gas g in the system. Equations (1) and (2) are combined to obtain the system of equations: HM = 6g (Sg DMg) Pg (3) Since all gases have more than one peak in their fragmentation pattern, the number of peaks (M) in a real spectrum is generally larger than the number of gases (g). As a result, the system of equations (3) usually has more equations than unknowns. This situation is sometimes simplified eliminating some of the extra equations; however, the best results are obtained using all the equations and a multiple linear regression procedure to calculate the best possible fit to the data. Obviously, accurate results can only be obtained if the constants DMg and Sg are well known for the RGA being used. Note: The Analyze Utility of RGA Windows uses a multiple linear regression algorithm, as mentioned above, to automatically calculate the composition of a “typical residual gas environment” at the end of any 1-50 amu spectral scan. Please see the RGA On-Line Help files for details. Standard fragmentation patterns (for example, the fragmentation patterns included in the RGA Library of RGA Windows) can be used as a source of DMg values in moderately quantitative determinations. However, when very precise numbers are desired, one should obtain the appropriate fragment patterns by introducing pure gas into the RGA being used. The fragment patterns must be obtained under the same conditions that will be used during regular spectral analysis since they depend on many instrumental parameters, including: electron energy, emission current, ionizer design, mass filter settings, detector type, multiplier gain, etc. The principal mass peak of a fragmentation pattern is simply the most intense peak of the spectrum, and the intensity of all the other peaks in the pattern are normalized to its height for the calculation of fragmentation factors. Note that by our definition the DMg value for the principal mass peak of any gas is equal to one. Principal mass peaks are used in the calculation of the sensitivity of the SRS RGA to different gases as shown below. SRS Residual Gas Analyzer Residual Gas Analysis Basics 2-11 Partial Pressure Sensitivity Factors The partial pressure sensitivity of the RGA to a gas g, Sg, is defined as the ratio of the change (H-H0) in principal mass peak height to the corresponding change (P-P0) in total pressure due to a change in partial pressure of the particular gas species. H0 and P0 are background values. Sg = (H-H0) / (P-P0) The units of Sg are of ion current per unit pressure (amp/Torr, for example). The sensitivity of the RGA varies with different gases, changes with time due to aging of the head, and is a strong function of the operating conditions of the instrument. Careful quantitative analysis requires that the sensitivity factor, Sg, be determined for every gas which may be a component gas in the system being analyzed. The sensitivity factors must be obtained under the same operating conditions that will be used during general partial pressure analysis since they depend on many instrumental parameters, including: ionization energy, emission current, mass filter setting, type of detector, etc. In order to separate the gain of the electron multiplier from the intrinsic sensitivity of the RGA head, the sensitivity factors of the SRS RGA are defined for Faraday Cup detection. A separate Electron Multiplier Gain Factor, is used to correct the ion signals when the electron multiplier is turned on. See the Sensitivity and Electron Multiplier Tuning sections of the RGA Tuning Chapter for details. The basic procedure for determining the sensitivity of a particular gas in the RGA is the following: x Introduce the pure gas into the vacuum system, at a known or calculable pressure (typically around 10-6 Torr). x Measure the output signal from the RGA for the principal mass peak of that gas using the Faraday cup detector. x The ratio of this output signal to the pressure of the gas is the sensitivity factor, Sg. During these measurements it is very important to insure that the partial pressures of all other gases in the system are small enough so that they may be neglected. The sensitivity factors calculated can only be applied to situations where the RGA is used with the same operating parameters. See the Sensitivity Tuning section in the RGA Tuning chapter of this manual for more details on this calibration procedure. A total pressure sensitivity factor is also needed by the SRS RGA to convert the ion currents obtained during total pressure measurements into total pressures. Total pressure sensitivity factors vary with different gases and share many of the properties of the partial pressure factors. They are determined by a procedure identical to the one described above, but with the partial pressure measurements replaced by total pressure measurements. SRS Residual Gas Analyzer 2-12 Residual Gas Analysis Basics The underlying assumption when using sensitivity factors in quantitative calculations is that there is a linear relation between the partial pressure and the corresponding RGA signals of the gases. Deviations from linearity are to be expected above 10-5 Torr due to space charge effects in the ionizer and ion-neutral scattering interactions in the filter. A more thorough check of the RGA’s sensitivity involves measuring the RGA signals over several orders of magnitude of partial pressure to determine the range over which a linear relationship exists. The sensitivity factor for the gas is calculated as the slope of the “signal vs. partial pressure” response over the linear range. RGA Windows uses two sensitivity factors stored in the non-volatile memory of the RGA Head. The sensitivity factors, one for total pressure and one for partial pressure, are used as conversion factors between the ion currents received form the head and the pressure units selected by the user. The sensitivity factors are measured with the Faraday Cup detector and can be updated or changed very easily using the Sensitivity Tuning command in the Head menu. A separate Electron Multiplier Gain Factor, stored in the non-volatile memory of the RGA Head, is used to correct the ion signals for the gain of the electron multiplier. The gain of the electron multiplier is highly mass dependent and defined relative to the corresponding FC signal. An automatic Electron Multiplier Gain Adjustment command, built into the program, can adjust the CDEM voltage for any gain between 10 and 106. Consult the RGA On-Line Help Files for details on the automated tuning procedures built into the RGA Windows program. Also see the Sensitivity and Electron Multiplier Tuning sections of the RGA Tuning Chapter for more general information. The Table mode of RGA Windows offers scaling factors for all of its channels eliminating the limitations imposed by the single sensitivity factor on multiple partial pressure calculations. For example, the scaling factors can be used to display correct partial pressure for all the species in a table if the ratios between the partial pressure sensitivities of the different components are known and only principal mass peaks are used to monitor them. The scaling factors can also be adjusted to correct against the mass discrimination of the electron multiplier’s gain. Important: Following current industry standards, the partial pressure sensitivity factor stored at the factory corresponds to N2 measured at 28 amu with 'm10%=1 amu, default ionizer settings and Faraday Cup Detection. Single gas measurement example: Monitoring the concentrations of one or few components in a system is easy in the absence of severe spectral interference. Suppose a system where argon is measured at 40 amu (principal mass), in the absence of any other gases that contribute a signal at that mass value. The sensitivity to argon was previously measured at SAr=10-4 amps/Torr, and the electron multiplier is biased and its gain at mass 40 was previously measured at gCDEM=1.02.103 relative to the FC signal. The partial pressure of argon, PAr, is easily calculated measuring the intensity (i.e. peak height) of the ion current at mass 40, I40. PAr = I40 / (gCDEMSAr) , units of Torr (4) The peak value, I40 , can be extracted from a spectral scan or measured directly using the single mass measurement mode of the SRS RGA. For example, a 10-9 amp peak value corresponds to SRS Residual Gas Analyzer Residual Gas Analysis Basics 2-13 9.8.10-9 Torr of Ar. Note that equation (4) is a particular case of equation (3), and that the fragmentation factor for the principal peak of Ar is one by definition. SRS Residual Gas Analyzer 2-14 Residual Gas Analysis Basics SRS Residual Gas Analyzer 3-1 Chapter 3 RGA Quadrupole Probe This chapter describes the design and principles of operation of the components of the RGA Quadrupole probe. In This Chapter Introduction ............................................................................................................................................. 3-2 Ionizer....................................................................................................................................................... 3-3 Description .................................................................................................................................. 3-3 Principle of operation ................................................................................................................. 3-3 Parameter Settings ..................................................................................................................... 3-4 Quadrupole mass filter........................................................................................................................... 3-7 Description .................................................................................................................................. 3-7 Principle of operation ................................................................................................................. 3-8 Mass Range, Resolution and Throughput ............................................................................... 3-9 Zero Blast Suppression ........................................................................................................... 3-11 Ion Detector ........................................................................................................................................... 3-12 Description ................................................................................................................................ 3-12 Faraday Cup operation............................................................................................................. 3-13 Electron Multiplier Operation .................................................................................................. 3-13 Hardware modifications ....................................................................................................................... 3-17 Repeller and anode grid modifications .................................................................................. 3-17 Repeller removal ....................................................................................................................... 3-18 Operation without a filament ................................................................................................... 3-18 W filament replacement ........................................................................................................... 3-18 RGA Cover Nipple Replacement ............................................................................................. 3-20 SRS Residual Gas Analyzer 3-2 Introduction Introduction The SRS RGA is a mass spectrometer consisting of a quadrupole probe, and an Electronics Control Unit (ECU) which mounts directly on the probe’s flange and contains all the necessary electronics for operating the instrument. Ionizer Quadrupole Probe Electronics Control Unit (ECU) Figure 1 Quadrupole Head Components The probe is a specially engineered form of quadrupole mass spectrometer sensor. It is mostly constructed out of type 304 stainless steel and high purity alumina, and mounts directly onto any standard 2.75" CF port of a vacuum chamber. It analyzes residual gases ionizing some of the gas molecules (positive ions), separating the resulting ions according to their respective masses and measuring the ion currents at each mass. The total probe equipment consists of three parts: the ionizer, the quadrupole filter and the ion detector. All of these parts reside in the vacuum space where the gas analysis measurements are made. Ionizer Ion Filter Ion Detector Figure 2 Probe Components A stainless steel tube (RGA Cover Nipple) covers the probe assembly with the exception of the ionizer. A 2.75” CF port with at least 1.375” inside diameter and 2.5” depth is needed to provide clearance for the insertion of the ionizer into a vacuum system. This insertion volume is comparable to that taken by a regular Bayard-Albert ion gauge. A high vacuum environment (10-4 Torr or less) is required for operation. SRS Residual Gas Analyzer Ionizer 3-3 Ionizer Positive ions are produced in the ionizer by bombarding residual gas molecules with electrons derived from a heated filament. The ions are then directed toward the entrance of the ion filter where they are separated based on their mass-to-charge ratio. Description The SRS RGA ionizer is of an open design (wire mesh construction) with cylindrical symmetry and mounted co-axially with the filter assembly. The open configuration provides unrestricted communication between the vacuum environment and the ionizing region. The entire assembly is built out of type 304 stainless steel for complete vacuum compatibility. The simple mesh design is very clean (low outgassing) and easy to service. The principle parts of the ionizer are: the repeller, the anode grid, the filament and the focus plate. Focus Plate Anode Grid Filament Repeller Figure 3 Ionizer Components The filament is made out of oxidation-resistant thoria coated iridium wire, which operates at low temperature and can be exposed to atmosphere without the risk of burn-out. The circular construction consisting of two ThO2/Ir wires surrounding the anode grid preserves the cylindrical symmetry of the ionizer. Both filaments operate simultaneously under normal operation, and service is not interrupted if a single filament burns out (i.e. the emission regulator automatically readjusts the temperature of the remaining filament to restore the electron emission current). Once they wear out, the filaments can easily be replaced in the field (Please see the RGA Maintenance chapter for details). A firmware driven filament-protection feature constantly monitors (675 Hz) for overpressure. If overpressure is detected the filament is immediately shut off, preserving its life. Principle of operation The principle of operation of the ionizer is similar to the Bayard-Alpert gauge, except there is no central wire collector, and the electron repeller has been added. SRS Residual Gas Analyzer 3-4 Ionizer Filament Repeller Focus plate Anode grid Figure 4 Ionizer Schematic The filament is the source of the electrons used in ionizing the gas molecules. It operates at a negative potential relative to ground and is resistively heated to incandescence with an electrical current from the emission regulator. The thermionically emitted electrons are accelerated towards the anode grid which is positively charged with reference to the filament and ground. Because of the open (i.e. wire mesh) design of the anode grid cage, most electrons do not strike the anode immediately, but pass through the cage where they create ions through electron impact ionization. Electrons which do not strike a grid wire or ionize any molecules, pass through the grid volume into the region between the anode grid and the repeller. There they decelerate and re-accelerate back toward the grid because of the electric field created between the repeller and the anode grid. Electrons continue circulating in this fashion until they are collected by the grid or are lost by recapture. The multiple passes increase the ionization efficiency of the electron current relative to single pass configurations. Within the anode grid volume, ions are attracted to the center by the negative potential produced by an increasing electron density toward the center. Hence, the ions, once formed, tend to stay within the anode grid structure, and the ion distribution is more localized along the axis. The ions formed within the anode grid volume, are extracted from the ionizer by the electric field produced by the difference in voltage bias between the anode grid and the focus plate. The focus plate is kept at a negative potential (relative to ground) and its function is to draw the ions out of the anode cage and focus them into the filter section. The repeller, which completely encloses the ionizer, is biased negative relative to the filament and prevents the loss of electrons from the ion source. The Repeller Grid and the Focus Plate are only biased while the filament is emitting electrons. The technique of electron impact ionization requires low pressure for the efficient production of electrons and the subsequent formation of ions. The ionizer is best suited for operation in the high and ultrahigh vacuum range (10-4 to 10-14 Torr). Non-linearities in the ion currents, attributed mostly to space charge effects, are to be expected at pressures above 10-5 Torr. Non-linearity effects can be minimized operating at reduced electron emission current settings. Parameter Settings The parameters that affect the ionization efficiency of the ionizer are: electron energy, ion energy, electron emission current and focusing voltage. The general principles by which they affect the performance of the source are well understood. SRS Residual Gas Analyzer Ionizer 3-5 The ECU contains all the necessary high voltage and current supplies needed to bias the ionizer’s electrodes and establish an electron emission current. The ionizer settings can be directly controlled and monitored by the user through the RGA’s high level command set. The following table summarizes the ionizer settings available to the user, including default factory values, parameter ranges and minimum acceptable increments: Ionizer settings: Ion Energy Electron Energy Focus Voltage Emission Current Units eV eV V mA Default 12 70 -90 1.00 Range 8(low) or 12(high) 25 to 105 0 to -150 0 to 3.5 mA Min. Incr. n.a. 1 1 .02 The average electron energy, expressed in eV, is equal to the voltage difference between the filament and the anode grid and can be set anywhere in the range of 25 to 105 eV. For electrons to produce ionization of gas molecules by bombardment, they must have a certain minimum kinetic energy. This minimum energy is called the ionization potential and is different for every molecule. Above the threshold, the ionization efficiency increases linearly with the electron energy until a maximum is reached. For most molecules, this maximum is in the range of about 50 -100 eV, and for electron energies above the maximum, the ionization efficiency slowly decreases with electron energy. The kinetic energy of the ions as they move down the ion filter, simply referred to as the ion energy, and expressed in eV, is equal to the voltage biasing of the anode grid. Two ion energy settings (i.e. anode grid voltages) are: 8 (low) or 12 eV (high). The ion energy setting affects the magnitude of the ion signals collected (i.e. sensitivity of the spectrometer) and limits the ultimate resolution of the mass filter. Newly formed ions are attracted by the negative potential of the focus plate and passed to the ion filter where they are decelerated by the ground potential at the central axis of the quadrupole rod assembly. Hence, the anode grid voltage defines the kinetic energy of the ions as they enter the ion filter. Ion energy determines the time spent by the ions in the filter and hence, limits the resolution that can be obtained. It is well established that the resolution limit is governed by the number of cycles of RF field to which the ions are exposed before they reach the detector. In practice, the minimum resolution, 'm10%, is mass independent, linearly related to the ion energy, and inversely proportional to the square of the product of the quadrupole length and frequency. The two available ion energy settings correspond to ultimate resolutions of approximately 0.3 and 0.5 amu (well under the 1 amu factory default setting). Ion energy also determines the time spent by the ions in the fringing fields at the entrance and exit points of the filter. Ions passing through the fringing fields can collect high transverse velocities and are more likely to collide with the quadrupole rods and never be collected at the detector. As a result, ion signals (i.e. sensitivity) generally increase with ion energy. The focus plate negative potential can be adjusted to any value within the range of 0 to -150 V. In general, the voltage is selected so as to optimize the ion signals. The plate serves the double purpose of drawing the ions away from the anode grid, and containing the ionizing electrons inside the source. Electron leakage into the filter is only detectable SRS Residual Gas Analyzer 3-6 Ionizer at low mass settings (1 to 10 amu) and can easily be eliminated biasing the focus plate at least 30V more negative than the repeller. The electron emission current is the electron current from the filament to the grid. The available emission current range is 0 to 3.5 mA. When an electron emission current is requested, the RGA biases the ionizer’s electrodes and activates the filament’s heater until the desired emission current is achieved. A “Background Filament Protection” Mode is automatically enabled to monitor the performance of the filament while it is emitting electrons. The Filament LED remains on as long as the filament is emitting electrons. If a problem is detected in the operation of the filament (i.e. burnt filament or overpressure), the heater is immediately shut down and the problem is prompted by the LED’s. If a current of 0 mA is requested, the filament’s heater is shut down, the repeller and focus plate are biased to ground, the CDEM is turned off (if necessary), and the Filament LED is turned off to indicate the absence of emission in the ionizer. The electron emission current is very tightly regulated by a feedback control loop which dynamically adjusts the operating temperature of the filaments to keep the total emission current constant. The emission of electrons from the filaments is limited by space-charge effects (Child’s Law limitations). The maximum current attainable is a function of the grid-to-repeller spacing and its potentials. Ideally, the rate of formation of ions should be proportional to the electron emission current. In practice, the exact dependence between ion signal and electron emission current in small ion sources is complicated by spacecharge effects and only general trends can be predicted. Greater ionization efficiency is to be expected as the electron emission current increases. SRS Residual Gas Analyzer Quadrupole mass filter 3-7 Quadrupole mass filter Positive ions are transferred from the ionizer into the quadrupole where they are filtered according to their mass-to-charge ratios. Ions that successfully pass through the quadrupole are focused towards the detector by an exit aperture held at ground potential. Description The quadrupole mass filter is an electrodynamic quadrupole operated by a combination of DC and RF voltages. It is constructed of four electrically-conducting, cylindrical rods accurately held in place by a set of two high-purity alumina insulators. Ribbon connectors Quadrupole rods Spring loaded perforated screws Alumina spacers Figure 5 Quadrupole Mass Filter Components Round electrodes are a common replacement for hyperbolic ones in modern RGA’s and result in reduced cost and ease of construction. The stainless steel (type 304) rods are 4.5” long, have a 0.250” diameter (100 Pin tolerance) and are held in quadrature and parallel to each other, to tolerances better than 300 Pin, by the precision ground alumina spacers. Spring loaded, perforated screws fasten the rods to the spacers. The whole assembly is self-aligning, can easily be taken apart for cleaning and it can withstand repeated cycling to 300qC for bakeout. The exact placement of the rods is optimized to minimize the distortion of the electrodynamic quadrupole field by canceling higher order (multipole) potential terms. The radius of the circle inscribed by the rods is 0.109”. The frequency of operation is f=2.7648 MHz. SRS Residual Gas Analyzer 3-8 Quadrupole mass filter Principle of operation The following figure schematically represents the quadrupole mass filter and its connections. Quadrupole axis + – – X + + ions Z + Y – X Y – U+Vo cosωt + -(U+Vo cosωt) Figure 6 Quadrupole Connections During operation, a two dimensional (X-Y) quadrupole field is established between the four cylindrical electrodes with the two opposite rods connected together electrically. Ions enter the filter along the Z-axis and start oscillating in the X- and Y- directions. The ions are separated based on their mass-to-charge ratio by lateral forces resulting from the electric potentials applied to the rods. A combination of DC and RF voltages control the quadrupole filter operation. Successful separation of a specific mass species requires setting the RF and DC values such that only the ions of interest have stable trajectories down the quadrupole rod assembly. By simultaneously varying the amplitude of the DC and RF voltages an entire mass spectrum can be scanned. The RGA is completely calibrated at the factory so that the ECU automatically programs the RF and DC voltages on the rods to the necessary levels during scans or individual mass measurements. The calibration parameters can be accessed and modified by the user in case recalibration or a change in resolution is required. (Please see the RGA Tuning chapter for details.) The quadrupole mass filter must be operated in a vacuum. Linear operation can be expected up to pressures of the order of 10-4 Torr. In general quadrupoles can be operated at relatively high pressures compared to other types of analyzers. The upper limit of useful operation is determined by the collisions between the ions and the neutral gas molecules. In order to avoid collisional scattering it is necessary to maximize the mean SRS Residual Gas Analyzer Quadrupole mass filter 3-9 free path of the ions. The general principle of operation of the filter can be visualized qualitatively in the following terms: One rod pair (X-Z plane) is connected to a positive DC voltage upon which a sinusoidal RF voltage is superimposed. The other rod pair (Y-Z plane) is connected to a negative DC voltage upon which a sinusoidal RF voltage is superimposed, 180 degrees out of phase with the RF voltage of the first set of rods. The potentials are represented by the expression: Vx/y= +/- (U + V0 cos Zt) where, U is the magnitude of the DC voltage applied to either pair of rods, V0 is the amplitude of the RF voltage applied to either set of rods, and Z is the angular frequency (=2Sf) of the RF. Light ions (low mass-to-charge ratio) are able to follow the alternating component of the field. For the X direction, those ions will stay in phase with the RF drive, gain energy from the field and oscillate with increasingly large amplitudes until they encounter one of the rods and are discharged. Therefore, the X direction is a high-pass mass filter: Only high masses will be transmitted to the other end of the quadrupole without striking the X electrodes. On the other hand, in the Y direction, heavy ions will be unstable because of the defocusing effect of the DC component, but some lighter ions will be stabilized by the alternating component if its magnitude and amplitude are such as to correct the trajectory whenever its amplitude tends to increase. Thus, the Y direction is a low-pass mass filter: Only low masses will be transmitted to the other end of the quadrupole without striking the Y electrodes. The two directions together give a mass filter suitable for mass analysis: By a suitable choice of RF/DC ratio the filter can be made to discriminate against both high and low mass ions to the desired degree. The RF voltage magnitude and frequency determine the mass of the ions that undergo stable trajectories down the filter. As the RF amplitude increases, heavier ions start to oscillate in phase with the RF and collide with the rods. The DC/RF ratio determines the filter selectivity. As the DC increases (at constant RF) heavier ions are defocused by the negative DC component. The attractive features of the quadrupole as a mass analyzer are evident from the above discussion: The quadrupole provides a convenient filter which can be tuned to the desired mass by varying the amplitude of the RF voltage; the mass selectivity (i.e. resolution) can also be varied electronically by simply adjusting the DC/RF ratio. Simultaneously varying the amplitude of the DC and RF voltages allows entire mass spectra to be scanned. Mass Range, Resolution and Throughput The most important characteristics of a quadrupole are the mass range, its ultimate resolution and its throughput characteristics. The mass range is the range of masses defined by the lightest and the heaviest singly SRS Residual Gas Analyzer 3-10 Quadrupole mass filter charged ions which can be detected by the mass spectrometer. The SRS RGA is offered in three different models with mass ranges of 1 to 100 (RGA100), 1 to 200 amu (RGA 200) and 1 to 300 amu (RGA300). The main difference between the three models is given by the maximum supply voltage available to the rods. The terms Resolution and Resolving Power are often used by mass spectroscopists to express the ability of a mass filter to resolve ions having different masses: Resolution, or Absolute Resolution = 'M10%: The width 'M of the pass band of the filter, defined as the full width at which the ion current falls down to 10% of the maximum value. Units = amu. Resolving Power: R= M/'M10% : Ratio between a particular mass M and the resolution, 'M10% , at that mass. Dimensionless ratio. It is common practice in modern RGA’s to keep 'M10% constant at a value which insures adequate separation of masses that are 1 amu apart. The SRS RGA quadrupole operates in that “Constant Resolution” or “Constant 'm” mode. 'M10% is preset at the factory to 1 amu, but it can easily be adjusted by the user all the way to the theoretical ultimate resolution of the filter. The following figure illustrates the resolution concepts explained above, using a Krypton mass spectrum as an example. The different isotopes of the gas are well separated from each other, and a 1 amu peak width (= 'm10%) is measured on the 86Kr peak at 10% of its peak height. Also notice the 20% valley between the 82Kr and 83Kr peaks. 5.0E-08 . (Torr) 4.5E-08 . 4.0E-08 . 3.5E-08 . 3.0E-08 . 2.5E-08 . 2.0E-08 . 1.5E-08 . 100% 100% 1.0E-08 . 5.0E-09 . 10% Peak Height 20% 0.0E-09 80 . 82 . 83 . 84 . M/Q (amu/e). 86 . 1 amu Figure 7 Peak Width Measurement SRS Residual Gas Analyzer Quadrupole mass filter 3-11 It is well established that the resolution attainable by a quadrupole is limited by the number of cycles of RF field to which the ions are exposed before they reach the detector. In practice, the minimum resolution ('M10%) value attainable is mass independent, linearly related to the ion energy, and inversely proportional to the square of the product of the quadrupole length and frequency. The two available ion energy settings of the RGA correspond to ultimate resolutionvalues of approximately 0.3 amu (8 eV) and 0.5 amu (12 eV) which are well under the factory default setting, and more than adequate to separate ions which differ in mass by 1 amu or less. The resolving power, R, at a mass M is strictly related to the DC/RF voltage ratio. An increase in the resolving power usually results in a decrease in the effective throughput of the filter As the DC/RF ratio is increased the amplitude of the ion oscillations within the filter increase and a greater fraction of the ions are lost to collisions with the analyzer rods. The throughput of the quadrupole affects the overall sensitivity of the spectrometer to the mass being filtered. The exact relationship between resolution and sensitivity is very complex as it depends on the concentration and divergence of the ion beam leaving the source. It is complicated further by the defocusing action of the fringing fields between the ion source and the rods. However, as a general rule of thumb Sensitivity decreases at 1 to 1.5 times the rate of resolving power increase. The inverse relationship between sensitivity and resolving power is also responsible for a very important feature of quadrupole mass filters operated at constant resolution: The throughput of the analyzer decreases with mass. (Since 'M10% is constant, the resolving power, R= M/'M10%, increases with mass reducing the effective throughput of the filter for high masses. This effect must be taken into account when calculating partial pressure sensitivities from ion currents.) Zero Blast Suppression When the applied potentials are small (or zero) as at the beginning of a scan, ions entering the filter may be transmitted even though their trajectories are mathematically unstable. This gives rise to an output signal at the beginning of mass scans called the “Zero Blast”. In the SRS RGA the Zero Blast is suppressed preventing the DC voltage from reaching zero under 1.5 amu. Zero Blast suppression is standard practice in all commercially available RGAs and is responsible for the lack of reliable readings for hydrogen at 1 amu. SRS Residual Gas Analyzer 3-12 Ion Detector Ion Detector Positive ions that successfully pass through the quadrupole are focused towards the detector by an exit aperture held at ground potential. The detector measures the ion currents directly (Faraday Cup) or, using an optional electron multiplier detector, measures an electron current proportional to the ion current. Description The following figure describes the detector assembly including the electron multiplier option. CDEM anode CDEM CDEM cone Exit Plate CDEM signal ions FC signal Faraday cup Probe flange Faraday cup shield Figure 8 Detector Components The Faraday Cup (FC) is a small stainless steel (type 304) metal bucket located on-axis at the end of the quadrupole. It is shielded from the intense RF and DC fields of the quadrupole by the grounded exit plate, which also provides some focusing of the ions into the detector. A cylindrical tube (FC Shield) encloses the FC, protecting it from the strong electrodynamic potentials of the adjacent rods and from collecting ions originated at sources other than the ionizer. The signal is carried to the electrometer through a coaxial feedthru which extends into the ECU box and efficiently shields the small ion currents. The FC is attached to the center feedthru with a push-on connector and can easily be pulled out for cleaning or modification. Notice that an electron suppressor electrode (commonly found in several commercially available RGA’s) is not part of this detection setup since the large aspect ratio (length-todiameter) of the FC assures efficient recapture of secondary electrons. The electron multiplier is a state-of-the-art Macro Multi-Channel Continuous Dynode Electron Multiplier (CDEM). It consists of a straight, four or six channel tube made out of a special resistive glass (i.e. high secondary electron emission yield) with a cone of the same material attached to the front end. It is placed upright, next to the FC, and away from the axis of the analyzer (off-axis configuration). It is held safely in position by a clamp and a clip. The clamp is connected to the neighboring rod that carries the voltage from the High Voltage power supply, and is responsible for biasing the cone as well as assuring its correct placement next to the FC. A hole on the side of the FC Shield allows space for mounting the CDEM cone very close to the top of the FC. The clip anchors the CDEM glass tube to the side of the FC Shield and holds the lower end of the tube at ground. Chrome electrical coatings, deposited at both ends of the tube provide the SRS Residual Gas Analyzer Ion Detector 3-13 necessary electrical contacts. A plate (CDEM Anode) mounted at the exit of the CDEM collects the secondary electrons. The resulting electron current flows into the electrometer through a separate feedthru of the flange. The entire setup is self -aligning and easily serviced by the user in the field. For example, removing the screw that fastens the clamp to the HV rod is all that is needed to replace the CDEM (Please see the Maintenance chapter for details.) FC detection is standard in all RGA probes. All FC-only units can be upgraded to electron multiplier detection without the need to replace the probe. When the electron multiplier is not turned on, multiplier systems operate exactly like the FC-only systems. The same electrometer is used to measure the ion (or electron) currents under both detection schemes. The ECU automatically connects the necessary electrode to the electrometer depending on the type of detector being used. Faraday Cup operation The Faraday Cup (FC) detector, measures the incident ion current directly. Positive ions enter the grounded detector, strike a metal wall, and are neutralized by electron transfer from the metal to the ion. The electrons given up in this process establish an electrical current that has the same intensity as the incoming ion current. Since the nominal sensitivity of the RGA is in the order of 10-4 Amps/Torr, the currents measured are very small: 10-9 to 10-15 Amps for pressures in the order of 10-5 to 10-11 Torr, respectively. Minimum-detectable-partial pressures as low as 5.10-11 Torr are possible with the FC. However, in real-time applications, FC detectors are rarely used to measure partial pressures below 10-9 Torr. At pressures below that value, the CDEM option becomes a much better alternative allowing for faster scan rates and improved signal-to-noise ratios. The best characteristics of FC detection are: simplicity, stability, large dynamic range and lack of mass discrimination. All ions are detected with the same efficiency regardless of their mass. The ECU automatically connects the FC electrode to the electrometer input upon poweron reset, and whenever the electron multiplier is not turned on. Electron Multiplier Operation An Electron Multiplier upgrade (Option 01) to the standard Faraday Cup (FC) detection setup is recommended when the SRS RGA is routinely used at pressures under 10-9 Torr. The detection upgrade consists of a state-of-the art Macro Multi-Channel Continuous Dynode Electron Multiplier (CDEM), and a negative high voltage power supply (0 to 2500V). Macro Multi-Channel Continuous Dynode Electron Multipliers are used in the SRS RGA models with the electron multiplier option (Option 01). They consist of a straight four or six channel tube made out of a special resistive glass (i.e. high secondary electron emission yield) with a cone of the same material attached to the front end. The extruded channels run along the length of the device and are twisted at the time the part is drawn to eliminate ion feedback. Each CDEM is placed upright next to the FC and away from the line of sight of the ionizer (i.e. off-axis configuration). When the cone is biased negatively (-1000 to -2500V) relative to the back end, positive ions are very efficiently SRS Residual Gas Analyzer 3-14 Ion Detector attracted away from the FC and strike the cone at high velocity producing electrons by secondary electron emission. The secondary electrons are subsequently accelerated down the four channels and produce more secondary electrons. For each ion entering the cone of the CDEM, and depending on the bias voltage applied, up to 107 electrons come out at the back end and are picked up by a grounded plate (the CDEM anode). The resulting electron current is proportional to the ion current and is measured by the same logarithmic electrometer used in the FC measurements. The sign of the electron multiplier currents is reversed before the current value is sent out over RS232 so that the computer does not need to do any sign flipping on the currents received when the CDEM is activated. The gain of the electron multiplier in the RGA is a function of the bias voltage and is measured relative to the FC signal. The following figure shows a typical “gain characteristic” (i.e. gain vs bias voltage) curve obtained for H2O+ ions at 18 amu. 1E8 1E7 1E6 Gain 1E5 1E4 1000 100 10 1 1000 1100 1200 1300 1400 1500 1600 1700 1800 1900 2000 2100 2200 HV Bias (V) Figure 9 Typical CDEM Gain Characteristic Curve Very high gain values can be obtained and controlled with voltages smaller than -2500 Volts. The sensitivity of the spectrometer increases with the gain of the electron multiplier. Higher sensitivities provide lower minimum detectable partial pressures and faster spectral scans. Minimum detectable partial pressure limits as low as 5.10-14 Torr are commonly achieved. However, the increase in sensitivity is obtained at the price of limited dynamic range, SRS Residual Gas Analyzer Ion Detector 3-15 mass discrimination effects, gain instabilities and finite lifetime of the device. A good understanding of these limitations is very important to assure accurate quantitative measurements. The dynamic range of electron multipliers is determined by their dark current at the low end, and by the bias current value at the high end. The bias current is established by the external voltage drop along the resistive glass tube and flows along the channel walls replenishing their charge as secondary electrons are emitted. Channel electron multipliers, operate linearly in the analog mode until the output current is approximately 10% of the bias current. The dark current of a multiplier is the electron current measured at its output in the absence of an input ion current. The minimum output current that can be accurately measured with the multiplier is equal to the dark current noise. Example: For a typical resistance of 200 Mohms, and a bias voltage of -2000V, the bias current is 10 PAmps and the output current must be kept under 1 PAmp. Since the gain at that voltage is roughly 106, the maximum input current at which the output current behaves linearly is 10-12 Amps (1 PAmp / 106). Typical dark currents are lower than 10-13 Amp, and the minimum input current that can be detected is 10-19 Amps. For a sensitivity of 10-4 Amp/Torr, this corresponds to an lower and upper limits of 10-15 and 10-8 Torr, respectively, and 7 orders of magnitude of dynamic range. The total gain of electron multipliers varies as a function of the mass of the incident ions. As a rule of thumb, and for small molecules, the gain decreases as mass increases. This mass discrimination effect is caused by the dependence of ion-electron conversion efficiencies on the velocities of the ions entering the detector. For example, an inverse relationship with the square root of the mass has been reported for monoatomic ions of the same energy. For accurate quantitative measurements, it is essential to calibrate in advance the gain of the multiplier for the specific ionic species being detected. An important problem when working with multipliers is that their gain changes with time. Gain degradation is unavoidable, and particularly serious just after the detector has been exposed to air, or after high quantities of reactive gases have been introduced into the vacuum system. The increased surface area provided by the extra channels in the multi-channel devices reduces this problem; however, frequent calibration of the multiplier gain against the FC output is recommended for reliable quantitative measurements. This is done automatically with the RGA Windows software. Gain degradation limits the lifetime of all electron multipliers. Eventually the gain drops to unacceptable values and the multiplier needs to be replaced. As a rule of thumb, the multiplier should be replaced when the required gains can no longer be achieved by increasing the bias voltage. The lifetime of electron multipliers is ultimately dependent upon the accumulated charge drawn from the multiplier (Gain degradation typically starts at accumulated output current values of a few thousand PAmp-hr). However, the lifetime also depends critically on the residual gas environment and the duration of transient signals. Contamination by organic compounds (i.e. diffusion or mechanical pump oil) and the interaction with highly reactive gases must be avoided at all times. It has been found that, in many cases, channel multipliers may be successfully refreshed SRS Residual Gas Analyzer 3-16 Ion Detector by cleaning them in high purity isopropyl alcohol. The procedure is described in the RGA Maintenance chapter (CDEM Refreshment section) and, even though it is not guaranteed to always work, it is worth trying as a last resort before discarding a multiplier. Channel electron multipliers have a history of high performance and dependability in mass spectrometry applications. However, in order to achieve maximum useful lifetime and optimum performance, it is very important to handle them very carefully. Please read the CDEM Handling and Care section in the RGA Maintenance chapter to familiarize yourself with some of the basic procedures that must be followed for the correct operation of the multipliers. SRS Residual Gas Analyzer Hardware modifications 3-17 Hardware modifications Warning The information in this section is for the use of Qualified Personnel only. To avoid shock and irreparable damage to the unit, do not attempt any of the changes in this section unless you are authorized to do so. Read and follow all “Safety and Precaution” instructions before handling the product. Because of the danger of introducing additional hazards, do not install substitute parts or perform any unauthorized modification to the product. Do not use the product if it has unauthorized modifications. Return the product to SRS for service and repair to ensure that safety features are maintained. The SRS RGA is a quadrupole mass spectrometer specially engineered to perform all the functions of a residual gas analyzer, and its standard electron impact ionizer is designed specifically for that type of operation. However, the simplicity of design of the probe facilitates the modification of the instrument so that measurement applications other than simple partial pressure analysis are possible. The relative insensitivity of quadrupole mass filters to variations in ion entrance conditions makes it possible to apply quadrupole mass spectrometers to the detection of ions from sources other than the standard electron impact ionizers of RGA’s. For example, quadrupole mass filters have been used to monitor ion formation in plasma, SIMS, electrospray, ICP, laser ionization and surface desorption experiments. Many of the changes required to apply the RGA probe to alternative measurement schemes involve the modification of the ionizer from its standard design. The ionizer is of a very simple design and can be completely disassembled by the user loosening a few screws (please see the RGA Maintenance chapter). Ease of disassembly is ideal for periodic cleaning and very convenient when design modifications are needed. Special applications might require modifying, replacing or even removing ionizer parts. The scope of this section is to discuss the effects that design changes will have on the overall performance of the probe. These types of modifications are most common in research applications, and obviously should only be attempted by qualified personnel who completely understand the operation of the quadrupole mass spectrometer. It is a good practice to minimize the changes performed on the probe so that the RGA can still perform its basic functions of residual gas analysis, which are invaluable tools for vacuum system diagnostics. Repeller and anode grid modifications The two ionizer grids can easily be removed from the probe for replacement or modification. They are structurally very strong because they are made out of sintered wire mesh (i.e. all crossing wires are welded to each other). Typical modifications, such as punching holes or cutting slots, can be performed by skilled personnel without compromising their shape. The replacements and modifications should obviously be compatible with the operation of the rest of the quadrupole probe. Optimum performance of the quadrupole can only be achieved if the ions are injected in the form of a beam of low energy (2 to 15 eV) and low divergence (i.e. close to and parallel to the axis of the SRS Residual Gas Analyzer 3-18 Hardware modifications quadrupole). For example, it is well established that the correct alignment of the anode grid is critical to the operation of RGA spectrometers: a misalignment as small as 0.010” can result in decreased sensitivity, decreased resolution and peak shape deterioration ( i.e. peak splitting). The alignment and symmetry of the repeller are not as critical as that of the anode grid. Repeller removal It is possible to operate the ionizer without the repeller. The repeller is held in place by a single, easily accessible screw (See RGA Probe Assembly drawing) . It is sometimes eliminated when a smaller ionizer insertion volume is needed, when a laser beam needs to be focused into the anode grid or when a collimated beam of molecules needs to be directed through the anode grid without molecular scattering taking place at the repeller’s wires. The repeller serves several purposes in the ionizer that must be carefully considered before removal: 1. It mechanically protects the delicate filament while the probe is being mounted on the vacuum system. The filament might easily be damaged during installation without that protection. 2. It constrains the electrons to the ionizer volume, minimizing cross talk with other gauges in the vacuum system (Free electrons can affect the readings of neighboring ion gauges). 3. It increases the ionization efficiency by folding the electron trajectories back into the anode grid (multiple-pass configuration). A decrease in ionization efficiency will usually be noticed when the repeller is removed. Operation without a filament It is possible to use the quadrupole mass filter to detect ions originating from sources other than the standard electron impact ionizer. For example, the filament and the grids can easily be removed to expose the quadrupole to ions from a SIMS or Laser desorption ionization experiment. All the measurement and scanning functions of the mass spectrometer are still operational when the filament is not installed or not emitting electrons As mentioned previously, optimum performance of the quadrupole can only be achieved if the ions are injected into the filter in the form of a beam of low energy (2 to 15 eV) and low divergence (i.e. close to and parallel to the axis of the quadrupole). Whenever possible, complete removal of the filament and the grids should be avoided so that the residual gas analysis functions of the RGA are still available. For example, since service is not interrupted if a single filament burns out, it might be possible to keep one of the sides of the filament intact instead of removing it completely. W filament replacement The standard SRS RGA filament is made out of thoriated iridium. In order to replace the standard filament with tungsten wire, remove the dual filament (full circle) and connect a single 0.003” diameter tungsten wire between the two filament rods. Make sure to use filament quality tungsten wire, and do not attempt a dual filament configuration since the filament heater will not be able to power the assembly. SRS Residual Gas Analyzer Hardware modifications 3-19 In order to scan without filament emission, uncheck the “warn if the filament off” box in the ionizer settings menu of the RGA software. RGA Cover Nipple Replacement A stainless steel tube covers the probe assembly with the exception of the ionizer. This tube, referred to as the RGA Cover Nipple, contributes to the overall capacitance of the quadrupole rod assembly, and should not be removed from the probe unless it is replaced with a similar grounded metal shield tube inside the vacuum system (see below). Failure to replace the Cover Nipple will push the RF driving circuit out of regulation, and will limit the operating mass range of the quadrupole filter. The tube also acts as a barrier, preventing ions from sources other than the RGA’s ionizer from reaching the detector and affecting the ion current readings. The RGA Cover Nipple consists of two non-rotatable, 2.75” CF Flanges, connected by a short section of 1.5” OD tube (0.065” wall thickness). The entire part is made out of stainless steel type 304, and its overall length is 6.75” (including the two flanges.) Some experiments require being able to insert the RGA’s probe deep into the vacuum chamber. When a large insertion depth is required, the standard RGA Cover Nipple can be repalced with the O100MAX Maximum Insertion nipple illustrated in Figure 10. Figure 10 RGA Probe with Shield Tube The O100MAX Shield tube consists of a 1.5” OD tube welded onto the large-flange side of a 4.5”-to-2.75” Zero Length CF Adapter Flange. The tube has a wall thickness of 0.065” and is strictly perpendicular (90q r0.2°) to the flange’s face. The RGA’s quadrupole assembly is attached to the small-flange side of the Adapter Flange so that the tube completely covers the mass filter (replacing the standard RGA Cover Nipple). This modified probe can be mounted on any standard 4.5” CF port of a vacuum chamber, and the ionizer penetrates the vacuum system by roughly 7”. SRS Residual Gas Analyzer 4-1 Chapter 4 RGA Electronics Control Unit This chapter describes the most important features of the RGA Electronics Control Unit. In This Chapter Introduction ............................................................................................................................................. 4-2 Front Panel .............................................................................................................................................. 4-3 Rear Panel ............................................................................................................................................... 4-4 [email protected] Connector .......................................................................................................... 4-4 RS232/DCE/28.8k Connector ..................................................................................................... 4-5 LED’s ............................................................................................................................................ 4-5 Locking Knobs ............................................................................................................................ 4-5 Power entry module (Option 02) ............................................................................................... 4-5 LED Functionality ....................................................................................................................... 4-6 STATUS (Green) LED’s .......................................................................................................... 4-6 ERROR (Red) LED’s .............................................................................................................. 4-7 Electrometer ............................................................................................................................................ 4-8 Detection limit vs. scan rate ...................................................................................................... 4-8 Adjusting the Zero of the Ion Detector ..................................................................................... 4-9 Mass Filter Power Supply .................................................................................................................... 4-10 Maintenance and Service ..................................................................................................................... 4-11 SRS Residual Gas Analyzer 4-2 Introduction Introduction The SRS RGA is a mass spectrometer consisting of a quadrupole probe, and an Electronics Control Unit (ECU). The ECU completely controls the operation of the RGA, handles its data and transmits it to the computer for analysis and display. Ionizer Electronics Control Unit (ECU) Quadrupole Probe Figure 1 Quadrupole Head Components The ECU is a densely packed box of electronics (3” x 4” x 9”) that connects directly to the probe’s feedthru-flange and also to a host computer. It includes several regulated power supplies, a built-in microprocessor, control firmware, and a standard RS232 communications port. It is powered by either an external 24VDC (@2.5Amps) power supply or an optional, built-in power module which plugs directly into an AC outlet. Warning The ECU does not have any serviceable parts and does not require any routine maintenance. All calibration procedures should be done using the RS232 interface and the RGA calibration command set. During normal operation of the RGA, regulated power supplies built into the ECU set the electron emission current, the voltage levels on the ionizer electrodes, and the high voltage across the electron multiplier. RF/DC levels for each mass are also set and regulated by the ECU, based on internal mass calibration parameters permanently stored in non-volatile memory. A built-in, logarithmic electrometer detects the ion currents collected by the FC, or electron multiplier, and converts them to voltage signals that are read by a built in A/D converter. The microprocessor automatically compares those signal voltages against an internal calibration and calculates the magnitude of the ion currents. The ion currents are then averaged as needed, offset corrected and transmitted to the host computer over RS232 for immediate display. Several built-in checks constantly monitor the operation of the probe and its operating environment. For example, the filament emission, and the electron multiplier, are immediately turned off in the case of accidental overpressure. Active LED's on the rear panel of the ECU provide constant feedback on the status of the filament, electron multiplier, electronics system, probe and communications, and alert the user of any problems. SRS Residual Gas Analyzer Front Panel 4-3 Front Panel The ECU mounts directly on the probe’s feedthru flange. Its front panel is designed to rest flat against the back surface of the probe’s flange, and it is not visible while the ECU is locked in place. Probe alignment holes WARNING High Voltage inside this unit. See manual for safety notice. Clearance holes (6 places) High Voltage inside this unit. See manual for safety notice. WARNING Internal connectors Locking screws (2 places) Figure 2 ECU Front Panel The front panel of the ECU box has nine holes of three different sizes, and two locking screws. The big hole in the center provides access to internal connectors that line up with the feedthru connectors of the probe. The six equally-spaced holes, surrounding the big hole, provide clearance for the six bolt heads on the back of the probe’s feedthru flange. The two remaining holes (1/4” diameter) line up with the alignment rods of the probe and assure the correct alignment between the ECU and the Probe during installation. The locking screws line up with two threaded holes on the back of the feedthru flange, and are used to lock the ECU box in place. SRS Residual Gas Analyzer 4-4 Rear Panel Rear Panel The rear panel of the standard ECU Box has two connectors, two locking knobs, a cooling fan, and eight LED’s. Units with the optional, built-in power module (Option 02) also have a fused Power Entry Module with a built-in power switch. Locking knob Power Filament Degas ElecMult RS232 Error Leak Burnt RS232/DCE/28.8k RS232 connector LEDs Lock Power connector Cooling fan +24VDC @ 2.5A Lock Input voltage is set automatically. Use a line voltage and frequency within ranges at right. Input Voltage 90 - 264 VAC Input Frequency 47 - 63 Hz Chassis Ground Built in power module* *option 02 Figure 3 ECU Rear Panel [email protected] Connector Use this connector to provide external power to the RGA. The ECU electronics must be powered with a 24 V (+/- 2V) DC power supply @2.5Amps. The power supply must have a cable with a 9 pin, type D, female connector on the free end, wired as described in the “ECU- 24VDC power connector” diagram shown below. SRS Residual Gas Analyzer Rear Panel 9 5 8 4 7 3 4-5 6 2 1 Pin # Voltage 1 2 3 +24VDC +24VDC Ground 4 5 Ground Ground 6 +24 VDC 7 8 Ground +24 VDC 9 Ground Figure 4 ECU 24 VDC Power Connector RS232/DCE/28.8k Connector Use this connector to interface the RGA to a computer. The RS232 interface connector of the RGA is configured as a DCE (transmit on pin 3, receive on pin 2) with full RTS/CTS handshaking enabled. Use a straight through RS232 cable with 9-pin, type D connectors to connect the computer (usually DTE) to the ECU. The communication parameters are fixed at: 28,800 baud rate, 8 data bits, no parity, 2 stop bits. LED’s Eight LED’s provide constant feedback on the operation of the RGA. The function of the LED’s is described later in this chapter. Locking Knobs Use the two knobs to lock the ECU box in place at the end of the ECU installation procedure. Do not overtighten the knobs. (Hand tighten only.) Power entry module (Option 02) Use this connector to power the RGA directly from an AC outlet. Use the three-wire power cord provided by SRS to connect the RGA directly to a properly grounded AC outlet. Use the built in switch to turn the unit on-off. Refer to the first page of this manual for instructions on selecting the correct line voltage and fuse. The built-in power module (Option 02), has universal input (90-264 VAC, 4763 Hz), and completely eliminates the need for an external 24VDC power supply connection. SRS Residual Gas Analyzer 4-6 Rear Panel LED Functionality LED's on the rear panel of the ECU provide constant feedback on the status of the filament, electron multiplier, electronics system, probe and communications, and alert the user of any detected errors. This section describes in detail the function of each LED. Power Filament Degas ElecMult RS232 Error Leak Burnt RS232/DCE/28.8k Lock ERROR LEDs STATUS LEDs +24VDC @ 2.5A Lock Figure 5 ECU LED’s STATUS (Green) LED’s Power: The Power LED is turned on whenever the RGA is successfully powered up. When power is applied to the ECU, a firmware routine automatically checks the external voltage level and turns on the Power LED if the voltage is within the acceptable range of 24 +/-2 V DC. The same test is performed in units with built-in power modules (Option 02) to check the voltage output of the internal switching power supply. If the check fails, the red Error LED is turned on instead to indicate the problem. Note: A check on the external power supply can be performed at any time during operation using the EP? diagnostic command. Filament: The Filament LED indicates the presence of electron emission current in the RGA’s ionizer. It is turned on when a finite emission current is requested by the user and during Degas processes. It is turned off when the user requests a null emission current or when a filament error condition (i.e. overpressure, worn out or burnt filament) is detected and the filament emission is turned off. Note: Filament error conditions are easily diagnosed with the help of the Leak and Burnt LED and the assortment of diagnostic checks built into the firmware and supported by the RGA Windows program. Degas: The Degas LED is activated during Filament Degas processes. The Filament LED is also activated during a Degas. The ElecMult LED is turned off during a Degas. SRS Residual Gas Analyzer Rear Panel 4-7 ElecMult: The ElecMult LED is turned on whenever the electron multiplier detector is active (i.e. when a finite biasing voltage is applied across the electron multiplier). Several different mechanisms can turn off the electron multiplier and its LED: a null bias voltage request by the user, a Degas process, and an overpressure that shuts down the filament emission. RS232: The RS232 LED reflects the activity on the RS232 Transmit and Receive lines. ERROR (Red) LED’s Error: The Error LED indicates the presence of errors in the operation of the RGA. Errors can originate from many different sources including hardware, communications, probe (i.e. bad filament) and operating environment (i.e. overpressure). Troubleshooting is simplified by an assortment of diagnostic commands built into the firmware, and fully supported by the RGA Windows program. Leak: The Leak LED is automatically turned on whenever the filament heater is unable to establish a requested emission current. The most common reason for this problem is a serious leak in the vacuum system. In the event of an overpressure detection, the filament emission and the electron multiplier are immediately turned off, and the Error and Leak LED’s are turned on to indicate the problem. Important: The Leak LED will also be turned on if the Thoria coating of the filament is excessively worn down or damaged. However, this is a more rare event due to the long life of the thoriated iridium filaments. Burnt: The Burnt LED is turned on whenever the ECU fails to detect a filament. A burnt or missing filament are possible sources for this problem. The Error LED is also turned on to clearly signal the presence of a filament error. SRS Residual Gas Analyzer 4-8 Electrometer Electrometer Detection limit vs. scan rate A unique, temperature-compensated, logarithmic picoammeter built into the ECU box measures the ion currents collected by the Faraday cup (FC), or electron multiplier (CDEM). The output voltage of the electrometer is equal to the logarithm of the ion current so that several decades of signal can be read on the meter without any gain switching being necessary. The microprocessor automatically configures the electrometer and connects its input to the correct signal based on the type of detector being used. The electrometer is completely autoranging and measures both positive and negative currents with the same accuracy and resolution. Its operating range covers current magnitudes between 1.32 u10-7 and 10-15 A. The accuracy of the measurements is insured by an internal calibration procedure that calibrates the output of the electrometer against input current over its entire operating range, and stores a calibration table in the non-volatile memory of the RGA Head. Instead of simply relying on the intrinsic logarithmic I-V behavior of the electrometer, a digital logarithmic interpolation algorithm calculates the currents from the calibration curve. The I-V response of the electrometer can be recalibrated at any time through a single command (CL) supported by the RGA Windows software (Auto Calibrate option in the Head menu), making it possible to generate accurate readings under different operating conditions. Excellent resolution is achieved using a 16 bit A/D converter to digitize the output of the electrometer. The bandwidth and detection limit of the logarithmic electrometer are fully programmable. This programmability is achieved biasing the electrometer with extra current from a microprocessor-controlled current source. The biasing current is added to the ion current and sets the gain and bandwidth of the electrometer during measurements. An increase in the biasing current results in lower I-V gain and larger bandwidth, but also means increased baseline noise due to the additional shot noise introduced by the extra current. During regular mass scans the RGA automatically adjusts the scanning rate and averaging to match the bandwidth of the detector. The microprocessor calculates the total current flowing into the meter using the interpolation algorithm described above, and subtracts the biasing current from the total to provide the actual ion current values used for averaging. Obviously, the amount of biasing current must be chosen keeping in mind the strong interplay between bandwidth (i.e. acquisition rates) and baseline noise (i.e. minimum detectable partial pressures). The single command NF (Noise Floor), supported by the RGA Windows program, is used to program the electrometer’s response. Histogram scans, analog scans, single-mass measurements and total pressure measurements all share the same NF setting during measurements. A decrease in the Noise-Floor setting reduces the biasing current resulting in longer measurement times with cleaner baselines and lower detection limits. As mentioned above, the NF parameter value must be chosen keeping in mind the compromise between detection limit and acquisition speed. When using the RGA Windows program to operate the RGA, the Scan Speed parameter SRS Residual Gas Analyzer Electrometer 4-9 setting available in the Scan Parameter Setups of the Scan menu is used to set the NF parameter value in the RGA Head according to the equation: NF = ScanSpeed - 1. The following table summarizes the performance of the RGA electrometer during mass measurements as a function of the Scan Speed and NF settings. Please refer to this table to estimate minimum detectable partial pressures and scan rates for different scanning conditions. Scan Speed NF Scan rate Single mass meas. Baseline noise(a) (std.dev.)(Amps) parameter parameter (msec/amu) time (msec) 1 0 2000 2200 7e-15 2 1 1000 1100 1e-14 3 2 400 440 1.5e-14 4 3 200 220 2e-14 5 4 126 139 4e-14 6 5 45 50 1.2e-13 7 6 30 33 2.5e-13 8 7 15 16.5 5e-13 (a) The values in this column are the result of averaging a large number of data points from several different units. Use this values for reference only. Variations are to be expected from unit-to-unit, as a function of operating conditions and even as a function of time. Adjusting the Zero of the Ion Detector The zero of the ion detector is automatically readjusted at the beginning of each analog and histogram scan so that the baseline is always centered around zero. The zero can also be readjusted at any time with the command CA. In both zeroing procedures, the output of the electrometer is measured in the absence of input ion current and stored, as a current value, in the RGA’s memory. The current value (called offset correction factor) is then automatically used by the firmware to offset-correct all ion currents measured (i.e. including those from single mass and total pressure measurements) under the same detector settings. The detector settings are the electrometer’s noise floor parameter value and the type of detector (i.e. FC or CDEM) in use at the time the zeroing is performed. Offset correction factors for all the possible combinations of detector settings can be generated and accumulated in the RGA’s memory. However, all offset correction factors are cleared after a recalibration (CL) of the electrometer is performed, and when the unit is turned off. Please consult the RGA Command Set section for details on the CL and CA commands. SRS Residual Gas Analyzer 4-10 Mass Filter Power supply Mass Filter Power Supply All the necessary electronics required to power up the quadrupole mass filter during mass measurements are built into the ECU box. The RF/DC levels for each mass are set and regulated from the ECU, under microprocessor control, and based on internal calibration parameters permanently stored in non-volatile memory. The difference between the three RGA models (RGA100, RGA200 and RGA300) is given by the maximum supply voltage available to the rods. For example, the maximum RF amplitude delivered to the probe in the RGA300 is 1284 V (2568 Vpp) and corresponds to ions with mass of 300 amu (8.56 Vpp/amu). The corresponding DC potential is a maximum of about 430 VDC for masses of 300 amu (+215 Vdc on one rod pair, and -215 Vdc on the other). The frequency of operation of the mass filter is the same for all models and is fixed at 2.7648 MHz by an internal clock. The rod structures in the mass filter are primarily capacitive, so to reduce the circuit drive requirements, the rod reactance is resonated with an inductance. The advantages of this resonant drive circuit is the primary reason for operation at a fixed frequency. Important: The RGA Cover Nipple (i.e. stainless steel tube) that encloses the quadrupole filter assembly contributes to the overall capacitance of the rod assembly, and should not be removed from the probe unless it is replaced with a similar grounded metal shield inside the vacuum system. Failure to replace the cover will push the driving circuit out of resonance, and will limit the operating mass range of the filter. Consult the Hardware Modifications section in the RGA Probe chapter of this manual for information on the modification of this important probe component. The internal calibration parameters used by the microprocessor to set the RF/DC levels during scans and measurements, are pre-programmed at the factory as part of the test and calibration procedures performed on the instrument before shipping. However, the parameters can be readjusted easily and whenever necessary using the Peak Tuning procedures described in the RGA Tuning chapter. SRS Residual Gas Analyzer Maintance and Service 4-11 Maintenance and Service x The ECU box does not have any serviceable parts and does not require any routine maintenance. x Do not perform any unauthorized service, adjustment or modification of the instrument. x Do not install any substitute parts. x Contact the factory for instructions on how to return the instrument for authorized service and adjustment. SRS Residual Gas Analyzer 4-12 Mass Filter Power supply SRS Residual Gas Analyzer 5-1 Chapter 5 RGA Windows Software For detailed information and command description of the RGA program please refer to the RGA On-Line Help files provided with the program disks. The RGA help system includes current and detailed description of all the features, procedures, and commands available in the program. In This Chapter Overview..................................................................................................................................................5-3 Program Structure.......................................................................................................................5-3 RGA Files .....................................................................................................................................5-3 RGA files (.rga).........................................................................................................................5-3 RGA Scan log files (.ana .hst .tbl) ............................................................................................5-3 RGA ASCII Data files (.txt)......................................................................................................5-4 RGA Graph Metafiles (.wmf) ...................................................................................................5-4 System Requirements.................................................................................................................5-4 Getting Started........................................................................................................................................5-5 Starting the RGA Software .........................................................................................................5-5 Connecting to a Head .................................................................................................................5-5 Shutting Down the RGA System................................................................................................5-5 Features and Operation .........................................................................................................................5-7 The RGA Window ........................................................................................................................5-7 Multiple Head Operation .............................................................................................................5-7 Display Modes .............................................................................................................................5-7 Analog (Mode Menu)................................................................................................................5-7 Histogram (Mode Menu) ..........................................................................................................5-8 Table (Mode Menu) ..................................................................................................................5-8 P vs T (Mode Menu) .................................................................................................................5-9 Leak Test (Mode Menu) .........................................................................................................5-10 Annunciator (Mode Menu) .....................................................................................................5-10 Library (Mode Menu) .............................................................................................................5-11 Data Acquisition ........................................................................................................................5-11 Scan Data Logging....................................................................................................................5-11 Graph Management...................................................................................................................5-12 Head Management.....................................................................................................................5-12 SRS Residual Gas Analyzer 5-2 RGA Windows Software Sensitivity Factors .................................................................................................................... 5-13 Spectrum Analysis.................................................................................................................... 5-13 Background Data ...................................................................................................................... 5-13 RGA Head and Scan Parameters........................................................................................................ 5-14 Changing Scanning Parameters ............................................................................................. 5-14 Changing Head Parameters ..................................................................................................... 5-14 Changing Scan Trigger Rates ................................................................................................. 5-15 Display Modes ...................................................................................................................................... 5-16 Changing Display Modes ......................................................................................................... 5-16 Running in Split Display Mode ................................................................................................ 5-16 Manual Scaling of Graphs........................................................................................................ 5-16 Using Scan Data as Background ............................................................................................ 5-17 General Utilities.................................................................................................................................... 5-18 Using the Data Cursors ............................................................................................................ 5-18 Cursor command..................................................................................................................... 5-18 Cursor Properties command ................................................................................................... 5-18 Scheduled Saving of Data........................................................................................................ 5-18 Logging Scans ........................................................................................................................ 5-18 Viewing Scans ........................................................................................................................ 5-18 Browsing Through the Gas Library ........................................................................................ 5-19 Analyzing the Mass Spectrum ................................................................................................. 5-20 Spectrum Analysis description ............................................................................................... 5-20 Analysis Procedure................................................................................................................. 5-20 Averaging scan spectrum ........................................................................................................ 5-20 Pressure Reduction ................................................................................................................ 5-21 Y-axis unit change .................................................................................................................... 5-21 Head Calibration and Security.............................................................................................................. 5-22 Tuning the RGA Sensitivity...................................................................................................... 5-22 Adjusting the CEM Gain ........................................................................................................... 5-22 Peak Tuning the RGA Head ..................................................................................................... 5-23 Securing the RGA Head ........................................................................................................... 5-24 RGA On-line Help ................................................................................................................................. 5-25 Context Sensitive Help............................................................................................................. 5-25 Help Search ............................................................................................................................... 5-25 Help Index.................................................................................................................................. 5-25 Commonly Asked Questions ................................................................................................... 5-25 Sample Scans............................................................................................................................ 5-25 SRS Residual Gas Analyzer Overview 5-3 Overview Program Structure The RGA program is a fully interactive Windows program capable of managing several RGA Heads simultaneously. Fully interactive means that you can double-click on any graph object and the program responds by executing a specific command such as editing the color of a data line. There are also various shortcut menu buttons to access specific commands in the Toolbar. The function of each button is explained in the Status bar, which is at the bottom of the program window. RGA was designed to handle data acquisition from multiple heads simultaneously by assigning one head for each window and by making all the windows independent from each other. Each window can be thought of as a separate RGA Head control & display file. This file, called an RGA file, stores all the information regarding the graph parameters, scan parameters, some head parameters, what port the head was connected to, etc. It is not necessary for an RGA file window to be connected to a specific head at all times. You could, for example, open a file just to browse through a few dozen scans that were done overnight. You can also copy the graph to the clipboard so you can paste it into a word processor. Once an RGA window is connected to a Head, you can start scanning (acquiring data) in any of the display modes available. When you are done scanning, you can either close the file which will automatically disconnect you from the head, or you can issue a disconnect command and keep the file open for further data analysis. You can even connect the same window to a different head on another RS232 port. RGA Files The RGA program is capable of saving files in a variety of formats. describes all the file formats and their different uses. This section RGA files (.rga) RGA files are the main files used in the RGA program. They are binary files that contain scan data with all the information on the graph parameters, scan parameters, scan schedule parameters, etc. When the RGA file is saved, it saves the last scan data along with all the setup parameters of that window. When the file is open again, it creates a window that has the same parameters as when it was saved including the data from the last scan. RGA Scan log files (.ana .txt) RGA scan log files are binary files that contain mostly raw data from multiple scans acquired over a period of time. These files do not have any of the RGA file setup parameters in them in order to save disk space. They contain the time and date for each scan and the minimum scan setup information to reconstruct the scan data graph. These log files are available for the Analog, Histogram, and Table modes. SRS Residual Gas Analyzer 5-4 Overview RGA ASCII Data files (.txt) The RGA program can save the last scan data in an ASCII format that is easily read by spreadsheet programs for data analysis. The file header contains the scan setup information followed by the scan data. The RGA program does not read these ASCII file, it only writes them. RGA Graph Metafiles (.wmf) RGA can also save the active graph as a Windows Metafile. Windows Metafiles are easily read by many word processing, page layout, and graphic programs. The graphs can be easily saved by RGA and then recalled by any of these programs for documentation and presentations. System Requirements The RGA program system requirements vary depending on the performance required of the RGA system and on how many heads are connected and run simultaneously. The RGA Head can scan data at different scan speeds that effect noise floor and averaging. Following, is the minimum recommended system to run a SINGLE head system: • IBM compatible PC • Mouse or equivalent pointing device • Serial port (or serial port adapter) and DB-9 to DB-9 RS232 cable • 100 Mbytes of free hard disk spaces (for RGA installation and runtime use) and CD drive (for the installation disk) • Microsoft Windows 2000 or later SRS Residual Gas Analyzer Getting Started 5-5 Getting Started The following sections describe how to launch the RGA program and start acquiring data from the RGA Head. Note: For detailed information and command description of the RGA program please refer to the RGA On-Line Help files provided with the program disks. The RGA help system includes current and detailed description of all the features, procedures and commands available in the program. Starting the RGA Software To start the RGA software simply double-click on the RGA icon in the "SRS" program group created by the RGA installation program. You may also type the full path name of the RGA program in the Run command from the Program manager. You can only run one copy of RGA at the same time. If you attempt to start another copy of RGA while it is already running, the existing copy is activated and brought to the front of the screen. Connecting to a Head Connecting to an SRS RGA Head requires an available RS232 port on your PC and a full DB9-DB9 RS232 cable. To connect to an RGA Head do the following: 1. Connect the RS232 cable to the DB9 connector on the Head labeled "RS232/DCE/28.8k.Baud". 2. Connect the other end of the cable to the RS232 port on the PC side (computer or serial adapter). 3. Turn On the SRS RGA Head. 4. Start MS Windows and the RGA Program. 5. Select Connector List Setup from the Head menu or click the shortcut button (the RS232 button). 6. Select the port to which the RGA head is connected from the connector column. 7. Press the Connect button. The connection is made when “connected” is displayed in the status column, the RS232 button is checked, the toolbar GO button turns green, and the Scan and Head menu commands get enabled. Shutting Down the RGA System The recommended shutdown procedure is as follows: SRS Residual Gas Analyzer 5-6 Getting Started 1. Stop the scan if there is one in progress using the Stop Now command in the Scan menu or click the shortcut button (the STOP sign button). 2. Turn off the filament by deselecting the Filament On command in the Head menu or click the shortcut button (the filament figure button). 3. Save the RGA file you have been working on, using the Save or Save As command in the File menu. 4. Terminate the RGA program using the Exit command in the File menu. 5. Turn off the RGA Head. SRS Residual Gas Analyzer Features and Operation 5-7 Features and Operation Note: For detailed information and command description of the RGA program please refer to the RGA On-Line Help files provided with the program disks. The RGA help system includes a detailed description of all the features, procedures and commands available in the program. The RGA Window The RGA window represents one SRS RGA Head operating in a specific display and scan mode. The RGA window does not need to be connected to a head at all times. It can be used to print graphs or to review some old scan logs. You may size, tile, minimize, or cascade several RGA windows together even while scanning. When an RGA window is sized, all the graph objects in it are also sized down or up. For optimum viewing of a graph, maximize the RGA program window, and maximize the RGA file you wish to view. Multiple Head Operation The RGA program can monitor several SRS RGA Heads simultaneously. Each RGA window represents a separate RGA Head that is controlled independently from any other window/head combination. To connect an RGA Head to an RGA window use the Connector List Setup command to assign a port (that you know is attached to an RGA Head) to that window. The operation of the RGA program is unchanged whether you have one or several heads connected and scanning. The only difference you might see is a slowdown in display updates and that is dependent on the computer hardware you use. Display Modes There are seven distinct display modes in RGA along with split modes that consist of combinations of these modes. Following are the seven distinct modes: Analog (Mode Menu ) Analog mode is the spectrum analysis mode common to all Residual Gas Analyzers. The X-Axis represents the mass range chosen in the Mass Spec Parameters menu. The YAxis represents the ion current amplitudes of every mass increment measured. Select the Schedule menu to set the scan trigger timing. Once the scan is in progress, the AutoScale command in the Graph menu may be used to scale the data. The Analog Trace parameters such as color and width may be changed by either double clicking on a data point directly (if data is present) or by using the Traces command from the Graph menu. In Analog mode the RGA Head scans from the start to the stop mass using the Points Per AMU variable specified in the Mass Spec Scan Parameters dialog box (the Scan Parameters… command in Scan menu or the shortcut button of the Parameter button ). This value is used to determine the mass increments between data points. The SRS Residual Gas Analyzer 5-8 Features and Operation time to acquire each partial pressure depends on the scan speed selected (the plotting speed depends on the user's computer). Histogram (Mode Menu ) Histogram mode displays the individual mass amplitudes for the selected scan range. In this mode the RGA head performs a peak-lock for each mass and calculates one amplitude per mass. This peak is then plotted as a bar at the appropriate mass. The XAxis represents the mass range chosen in the Mass Spec Scan Parameters dialog box activated by the Scan Parameters… command or the shortcut button of the Parameter button . The Y-Axis represents the ion current amplitudes of every mass measured. A mass index indicator is located at the left of the X-Axis. The index displays the mass that is currently being updated (assuming a live scan is in progress). Use either the Schedule command from the Scan menu or the shortcut button of the clock figure to set the scan trigger timing. Once the scan is in progress, the AutoScale command (Graph menu) menu may be used to scale the data. The Histogram Traces (bars) colors may be changed by either double clicking on the bars or selecting the Traces command from the Graph menu. In Histogram mode the RGA Head scans from the start to the stop mass running 7 measurements per AMU. After performing a peak lock on each 7 points it then sends the maximum value to the RGA program. This results in one point per mass being plotted as a bar graph. The time to acquire each partial pressure depends on the scan speed selected (the plotting speed depends on the user's computer). Table (Mode Menu ) Table mode presents a tabular form readout of preselected gases along with alarm level warnings. The gas masses, names, and parameters can be set using the Scan Parameters… command (Scan menu) or the shortcut button of the Parameter . Table entries can be configured independently from each other. Some entries can use the Channel Electron Multiplier (CEM), while others can have different scan speeds with the CEM off. The alarm control and level settings can be edited by either double- clicking on the Alarm text of the desired table entry, or by clicking on the 'Alarm X' (where X is the channel number) button for the appropriate table entry in the Table Parameters dialog box. Select the Schedule command (Scan menu) or the shortcut button of the clock figure to set the scan trigger timing and frequency. The Table Traces may be edited by either double-clicking on the text directly (except for the Alarm text), or by selecting the Traces command (Graph menu). Important: Table mode, P vs T mode, and Annunciator mode share the same table scan parameters, alarm parameters, and graph trace colors. SRS Residual Gas Analyzer Features and Operation 5-9 The data acquisition method for the table scan will vary depending on the display mode selected: In Table mode or Table mode split with P vs T mode, each table entry value (partial pressure) is acquired directly from the RGA head by individually querying the partial pressure for the appropriate mass. This is done for all the selected masses using the present scan schedule as a trigger. The time to acquire each partial pressure depends on the scan speed selected for that mass (the plotting speed depends on the user's computer). In Table mode split with Analog or Histogram mode, the Table entry values are extracted from the Analog or Histogram spectrum. No individual mass query is performed. If a Table mass lies outside the Analog or Histogram mass range, its partial pressure will show a zero value with the alarm indicating the appropriate zero value warning. A table entry can be easily disabled using the Table Parameters dialog box. P vs T (Mode Menu ) Pressure versus Time mode is a scroll graph of up to ten gas masses in the same plot. The graph scrolls to the left as the data fills the screen and the data is saved for review at any time. The gas masses, names, and parameters can be set using the Scan Parameters… command from the Scan menu or the shortcut button of the Parameter . P vs T entries can be configured independently from each other. Some entries can use the Channel Electron Multiplier (CEM) while others can have different scan speeds with the CEM off. When this mode is split with Table mode, the result is a wealth of information on the selected gases behavior. The Schedule command (Scan menu) or the shortcut button of the clock figure may be used to set the scan trigger timing and frequency. The P vs T Traces may be edited by either double clicking on them directly, or by selecting the Traces menu. The ViewControl Bar ( ) may be used to zoom, scroll, and view all the data in the history buffers. While in this history mode, the RGA can still be scanning new data without scrolling the graph. Note that the Table mode, P vs T mode, and Annunciator mode share the same table scan parameters, alarm parameters, and graph trace colors. The data acquisition method for the P vs T scan will vary depending on the display mode selected: In P vs T mode or Table mode split with P vs T mode, each table entry value (partial pressure) is acquired directly from the RGA head by individually querying the partial pressure for the appropriate mass. This is done for all the selected masses using the present scan schedule as a trigger. In P vs T mode split with Analog or Histogram mode, the P vs T entry values are extracted from the Analog or Histogram spectrum. No SRS Residual Gas Analyzer 5-10 Features and Operation individual mass query is performed. If a P vs T mass lies outside the Analog or Histogram mass range, its partial pressure will show a zero value. A table entry can be easily disabled using the Table Parameters dialog box. Leak Test (Mode Menu ) Leak Test mode provides the most effective way to study the behavior of a single gas. This mode provides a scroll graph that monitors the gas trend over a period of time, an instantaneous partial pressure readout, a bar meter, and an Alarm message. An Audible beep with a pitch proportional to the partial pressure is also available if a sound card is installed. If the beep is disabled, an Audio message can be enabled to reflect the status of the Alarm levels. The gas mass, name, and scan parameters may be configured from the Scan Parameters… command (Scan menu). The Leak Trace, bar meter color, and text readout color can be edited by double clicking on them directly (if data is present) or by selecting the Traces command form the Graph menu. Only one color can be selected for all data objects. The Schedule command (Scan menu) or the shortcut button of the clock figure may be used to set the scan trigger frequency. In Leak Test mode, the partial pressure for the specified gas is acquired by querying the RGA head for that specific mass only. The frequency of data acquisition is set in the Schedule setup. The time to acquire each partial pressure depends on the scan speed selected (the plotting speed depends on the user's computer). The Leak Test display mode cannot be split with other modes. Annunciator (Mode Menu ) Annunciator mode provides an effective way to visually monitor gas warning levels from a distance. The graph is composed of large green panels each representing a gas and alarm level. The partial pressure value is clearly visible and so is the gas name. When an Alarm level is reached, the panel color changes to bright red and the appropriate alarm message is shown. The gas masses, names, and parameters can be set using the Table Parameters command from the Scan menu. The Annunciator channels can be independently configured. Some channels can use the Channel Electron Multiplier (CEM) while others can have different scan speed with the CEM off. The alarm control and level settings can be edited by either double clicking on the Alarm text of the desired annunciator entry, or by clicking on the 'Alarm X' (where X is the channel number) button for the annunciator channel in the Table Parameters dialog box. The Schedule command (Scan menu) or the shortcut button of the clock figure may be used to set the scan trigger frequency. The Annunciator display mode cannot be split with other modes. Important: Table mode, P vs T mode, and Annunciator mode share the same table scan parameters, SRS Residual Gas Analyzer Features and Operation 5-11 alarm parameters, and graph trace colors. In Annunciator mode each channel value (partial pressure) is acquired directly from the RGA head by individually querying the partial pressure for the appropriate mass. This is done for all the selected masses using the present scan schedule as a trigger. Library (Mode Menu ) Library mode displays the selected library gas fragment patterns in a histogram graph. When split with a histogram or analog graph, the mass range of the library will automatically match that graph's range for easy comparison of gases. All library information is read from the "srsgas.lib" ASCII file located in the same directory as "rga.exe". This file may be edited (with a text editor) to add, delete, or modify gases in the library. The exact library file format must be preserved for proper operation of this mode. The Library Traces (bars) colors may be changed by either double clicking on the bars directly or by using the Traces command (Graph menu). The library scan parameters (displayed mass range) may be changed using either the Scan Parameters… command in the Scan menu or the shortcut button of the Parameter button . Data Acquisition The terms Data Acquisition and Scanning are used interchangeably in the SRS RGA documentation. A scan implies that the SRS RGA Head is performing ion current readings and sending the data over the RS232 cable to the PC running the RGA program at a fixed rate of 28.8 kbaud. This data is graphed using the currently active display mode chosen by the user. The speed of graphing depends on the hardware used and can vary with types of CPUs, video cards, Serial ports etc. The main procedure for establishing a live scan is outlined below: 1. Turn on the SRS RGA Head. 2. Establish a connection between the RGA program and Head (Head menu or Connection button). 3. Select the desired display mode (Mode Menu or mode button). 4. Turn On the Filament (Head menu or Filament button). 5. Select the desired scan parameters (Scan menu or Parameter button). 6. Select the desired trigger rate (Scan menu or Schedule button). 7. Select the Start scan command (Scan menu or Start button). Scan Data Logging Scan Data logging (or scan logging ) is used for saving raw scan data to disk without the overhead that comes with saving an RGA Head file. SRS Residual Gas Analyzer 5-12 Features and Operation Scan logging continuously saves scan data along with the time and date, with only the essential information about each scan. The user can easily browse through the scans after the scan logging is complete using the Next Item and Previous Item commands from the View menu or the arrow buttons in the Tool Bar. Scan logging is implemented for all the display modes. Even the split mode and the spectrum analysis function can be logged. Any encountered errors will be logged for troubleshooting. Each mode has its own file folder to save the logged data by default in the log main folder (..\SRS\RGA3_0\Log). The analog scan (.ana), the histogram (.hst), and the table scan (.tbl) are saved in both RGA spectrum format and ASCII text format (.txt). Other scans are saved only in ASCII text format. The ASCII format file can be opened with any word processor program and also can be opened with a spreadsheet program. Graph Management RGA is a fully interactive Windows program that allows the user to directly manipulate graphical objects on the screen by double-clicking on them with a point and click device such as a mouse or track ball. The ViewControl Bar contains shortcut buttons for controlling the active graphic display: rescaling, zooming out, zooming in, pan left, pan right, full scale. These functions can be performed during scanning. Almost every graph object in every display mode may be edited by double clicking on it. The extent of the editing depends on the actual object. For example you may change the text color, font, and size of any graph title but you may only change the color of the bar graphs in Histogram mode. Every graph object that can be edited by doubleclicking on it may also be edited by using an equivalent command from the Graph menu. All graph parameters relating to graph objects are saved when the Save or Save As commands are used form the File menu. Graph object parameters are local variables to the presently active display mode only. For example, if the background mode in Analog mode is changed to yellow, the background mode of all the other modes remains unchanged. Also, any new file using the Analog mode still uses the default background color. After an RGA file has been edited to have a desired look, it may be used as a template for new files by clearing its data using the Clear Graph Data command in Edit menu, saving it using the Save As command, and opening it again using the Open command. Head Management The SRS RGA Head has nonvolatile memory that stores most head variables such as sensitivity factors, Channel Electron Multiplier gain, high voltage, calibration factors, etc. When the RGA program connects to a head, all these variables are read from the head and stored temporarily in the program for use in the active file. When a head parameter is edited using the command in the Head menu, that parameter is stored back in the head immediately. SRS Residual Gas Analyzer Features and Operation 5-13 Saving RGA files does not save any of the head parameters to that file since each RGA Head has unique parameters due to minor variations in electronic and physical properties. Head parameters cannot be changed unless an SRS RGA Head is connected and turned on. Sensitivity Factors The RGA Head uses two sensitivity factors stored in its non-volatile memory. The sensitivity factors, one for total pressure and one for partial pressure, are used as conversion factors between the ion currents received form the head and the pressure units selected by the user. The sensitivity factors can be changed using the Sensitivity Tuning command in the Head menu. In order to set these factors, you need a reference ion gauge installed in the same vacuum system. The reading from the gauge is used to set the new sensitivity factor for the RGA Head. Note: The pressure limits you may enter will change if you have the Pressure Reduction option enabled. If this option is enabled RGA lets you enter much higher pressure values. Spectrum Analysis Mass spectrum analysis takes you one step beyond visual analysis and Library lookup tables. RGA looks at the spectrum from 1 to 50 amu and uses a matrix inversion technique to analyze the composition of the residual gas and approximate its composition. Note that Analysis mode requires a minimum span of 1 to 50 amu. (The span can be higher than 50.) Background Data This mode is helpful in providing the user with a clean baseline after the background data gets subtracted from newly acquired scans. This utility is available in Analog mode, Histogram mode, Table mode, and P vs T mode. In Analog mode and Histogram mode the scan must be allowed to finish at the Stop mass before the data can be used as background. Use the Stop at End command from the Scan menu (if in continuous scan mode) to guarantee this condition. In Analog and Histogram modes the full spectrum is subtracted from the newly acquired spectrum. In Table and P vs T modes, only the last acquired partial pressure of each mass get used as a background data. When a Table or P vs T mode is split with Analog or Histogram mode AND background is enabled, the data in the Table or P vs T graph is extracted from the Analog or Histogram graph and NOT subtracted form its own previous data. SRS Residual Gas Analyzer 5-14 RGA Head and Scan Parameters RGA Head and Scan Parameters The following topics describe how a user might change any of the RGA Head or scan parameters. specific command information please use the On-Line Help for the RGA Program. For Note: For detailed information and command description of the RGA program please refer to the RGA On-Line Help files provided with the program disks. The RGA help system includes a detailed description of all the features, procedures and commands available in the program. Changing Scanning Parameters Every display mode has scan parameters that are used to setup the display and to acquire data form the RGA head. Some modes such as the P vs T, Table, and Annunciator modes share the same scan parameters. For example, if a scan parameter is changed in table mode, this change will be reflected in the P vs T and annunciator mode when those modes are activated. It is not necessary to be connected to an RGA Head to modify the scan parameters, the head will be updated when a connection is established. To change the scan parameters do the following: 1. Select the desired display mode from the Mode menu or by clicking one of the mode buttons. 2. Select Scan parameters from the Scan menu (the applicable parameters will be enabled). If the user accepts the new parameters, the display is recreated using the new parameters and, if an RGA Head is connected, its parameters get updated also. Note: Changing scan parameters will result in loss of all displayed data on the screen. Use the File menu to save the data in one of the formats available before changing any scan parameters. Changing Head Parameters The head parameters menu items are available only when there is an SRS RGA Head connected and turned on. The head parameters are variables that depend on the actual RGA Head and reside in non-volatile memory in the RGA Head circuitry. These parameters are read from the Head when a connection is established and vary from one Head to another due to physical properties, electronic properties, and aging of the unit. To change or view any of the Head parameters, do the following: 1. Connect to a head using the Connector List Setup from the Utilities menu. 2. Select an item from the Head menu. SRS Residual Gas Analyzer RGA Head and Scan Parameters 5-15 If the operation is not canceled, the new parameters are stored in the Head and are used in subsequent operations. Changing Scan Trigger Rates The scan trigger rate (schedule) determines the frequency with which a scan is repeated. Not all display modes have the same schedule options. When changing trigger rates keep in mind the following: • When a graph with a time axis is active, only timer triggered schedule is allowed. • When a split mode is active, the graph with the more restrictive schedule is used for triggering scans. • If a selected trigger period is smaller than the actual period of the scan, RGA will change the trigger period to the minimum value. To change the scan schedule for a mode do the following: 1. Connect to an RGA Head. 2. Select the desired display mode. 3. Select the Schedule command from the Scan menu or by clicking the shortcut button of the clock figure. 4. Select the trigger mode or rate you want. IMPORTANT: Since Windows can be running one of many applications at once, it is possible for the RGA program to miss a scan trigger while other applications are busy performing other tasks such as printing or file copying. These facts should be taken into account if optimum performance is desired when using Timer Triggered modes and display modes that use a time axis. SRS Residual Gas Analyzer 5-16 Display Modes Display Modes Note: For detailed information and command description of the RGA program please refer to the RGA On-Line Help files provided with the program disks. The RGA help system includes detailed description of all the features, procedures and commands available in the program. Changing Display Modes A display mode presents the user with a specific way to analyze the RGA data acquired. The RGA program has several display modes including a combination of those modes (split modes). To change the present display mode to any other mode do the following: 1. Stop the scan if one is in progress. 2. Select the desired display from the Mode menu or click on one of the mode buttons in the Toolbar. Note: Changing display modes will not affect the displayed data on the screen of the previous mode. When the previous display mode is called back, the last scan data will be shown. Running in Split Display Mode Running in split display mode allows you to view scan data in two different formats or to scan two different sections of the mass spectrum with different scan parameter settings. The following is a list of all the split display modes available: • Analog split with: Analog, Table, P vs T, and Library • Histogram split with: Histogram, Table, P vs T, and Library • Table split with : Analog, Histogram, P vs T, and Library • P vs T split with : Analog, Histogram, Table, and Library You cannot split with Leak Test or Annunciator modes to split a graph do the following: 1. Make sure you are running in any of the Analog, Histogram, Table, or P vs T single graph modes. 2. Select any of the enabled graph modes from the Split Submenu of the Mode menu Manual Scaling of Graphs Manual scaling applies to graphs with both X- and Y-Axis. To manually scale a graph do the following: SRS Residual Gas Analyzer Display Modes 5-17 1. Select the any axis by double-clicking on it or selecting X- or Y-Axis form the Graph menu. 2. Enter the new desired limits for the axis in the From and To parameters. 3. Select OK. Using Scan Data as Background This mode is helpful in providing the user with a clean baseline after the background data gets subtracted from newly acquired scans. This utility is available in Analog mode, Histogram mode, Table mode, and P vs T mode. To Enable the Background mode make sure the graph has valid data and the RGA head is connected. In Analog and Histogram mode the scan must be allowed to finish at the Stop mass before the data can be used as background. Use the Stop at End command (if in continuous scan mode) to guarantee this condition. To Enable the Background: 1. If a scan is in progress, issue the Stop at End command from the Scan menu or yellow ‘End’ button. 2. Select Background Setup from the Utilities menu. 3. Click on the Enable check box to enable this mode. 4. Select the desired data subtraction mode. 5. Press OK. The data gets cleared and the next scan will be the result of subtraction selected. To Disable the Background: 1. Select the Background command from the Utilities menu. 2. Click on the Enable Background Mode check box to disable this utility. 3. Press OK. When the background mode is disabled, the old background data reappears on the screen. SRS Residual Gas Analyzer 5-18 General Utilities General Utilities Note: For detailed information and command description of the RGA program please refer to the RGA On-Line Help files provided with the program disks. The RGA help system includes a detailed description of all the features, procedures and commands available in the program. Using the Data Cursors Cursor command The cursor command is enabled in Analog, Histogram and P vs. T modes. This mode allows you to display the value of individual masses by moving around the data cursor to the point of interest on the graph. The X and Y values are automatically updated and displayed. You may move the data cursor by either left-clicking on a point in the graph or by dragging the mouse with the left button pressed down. Cursor Properties command You may change the cursor properties such as color, line width, and line style using this command. Scheduled Saving of Data Logging Scans Scan logging is enabled by default. This is to prevent data loss when power is interrupted. All scans in a scan log file share the same parameters. To log scans to disk do the following: 1. Establish a connection between the RGA program and Head. 2. Select a display mode that supports scan logging (except the annuciator mode). 3. Select Scan Logging from the File menu or clicking the scan logging button in the Tool Bar and configure the scan logging mode. 4. Check to enable the log. 5. Start the scan using Start scan from the Scan menu or clicking the green button. To disable scan logging, use the scan logging dialog box again. Viewing Scans To view a scan log, the active RGA display mode must be the same type of display mode that was used to log that scan if the Open Scan Logs command is used for analog or histogram or table scan retrieval. The Open Scan Logs command only works for three scan types; the analog scan, the histogram scan, and the table scan. If the active RGA display window is for the other scan type except the above three scan types, the Open Scan Logs command will be deactivated. When the log file of analog or histogram scan is double-clicked or dragged in RGA program, a new RGA active window will be open with the proper display mode. Other types of log files, which are saved as ASCII text format, can be open with a simple ASCII text reader. SRS Residual Gas Analyzer General Utilities 5-19 . To view analog or histogram or table scans stored on disk do the following: 1. Select the Open Scan Logs from the File menu or double-click a file or drag in a file to the RGA program window. 2. Select the desired scan log file (it must be the same type of scan as the currently active one). 3. Use either the Next Item or Previous Item from the View menu or the arrow buttons in the Tool Bar to view the sequential logs (The time and date of the scan appears on each log). Browsing Through the Gas Library Library Browsing Description There are several ways to browse through the gas library depending on the display mode and whether the Library Search utility is active. The Library display mode and search utility are linked together to provide an intuitive interface to locate and view any gas in the library file. Library Display mode only: 1. Activate the Library mode by selecting the Library command from the Mode menu. 2. Use the Next Item and Previous Item in the View menu to plot the next and previous gases in the list (you may also use the left and right arrow keys). Library Search utility only: You may start this utility from any display mode 1. Start the search utility by selecting the Library Search command from the Utilities menu. 2. Press the Show All button to list all available gases. 3. Use the scroll bar, and/or the keyboard to search the list or use the Search Masses section to look for specific gases. Library Display mode AND Search Utility: The combination of these two modes provides a very quick way to look for gases. 1. Make sure both the Library mode and the Library Search utility are active (see procedure above). 2. If you want to plot a gas, double click on its name in the Search utility dialog box or click on it once (to highlight it) and press the plot button. The gas fragment pattern will then appear as a histogram in the Library display. SRS Residual Gas Analyzer 5-20 General Utilities Analyzing the Mass Spectrum Spectrum Analysis description This utility provides the user with immediate analysis of residual gas based on a complete histogram or analog scan. Using a matrix inversion technique, the composition of the residual gas is analyzed and the best approximation to its composition is given in either pressure units or percentages. The user can enable up to 12 common gases for analysis. This function is only available during active scanning. Note: Analysis mode is only available in Analog mode or Histogram mode. must be at least from 1 to 50 amu. The mass range Analysis Procedure Make sure the RGA window is in either Analog mode or Histogram mode and connected to an RGA head. Set the scan range to be from 1 amu to at least 50 amu. 1. Select the Analyze Setups command from the Utilities menu to access the gas selection display box, and select/unselect gases from the library for analysis. 2. Select the Analyze command from the Utilities menu or click the analysis button in the Tool Bar to activate the analysis function. 3. To bring up the Spectrum Analysis dialog box, select the Analyze Window command from the Utilities. You may place the dialog box anywhere on the screen. 4. Press the Setup button if you need to change the gas selection or the analysis units. 5. Select the Start command form the Scan menu (if not already scanning) to begin a scan. 6. When the scan is complete (the stop mass is reached) the analysis results will be displayed in the Spectrum Analysis dialog box. The analysis will be repeated every time the scan reaches the stop mass. Note: You may enable or disable the analysis procedure even while the RGA Head is performing a scan by clicking the analysis button. Averaging scan spectrum One of the methods to improve noisy signals is signal averaging. The RGA program has the function of the averaging signals over a user defined value (the default value is 12). The user can setup this function at any time. 1. Select Average Setup… command in the Utilities menu. will be pop upped. Average Setup dialog box 2. Choose the desired method and set the average number and a condition. 3. Click ‘OK’ to close the pop up window SRS Residual Gas Analyzer General Utilities 5-21 4. Enable averaging with the function button. The button should be pressed. 5. Start the scan if it is not running. Pressure Reduction If you purchased a pressure reduction system from SRS this feature allows you to display true pressure values using the pressure reduction factor that corresponds to your system. If pressure reduction is enabled, all pressure readings are multiplied by the pressure reduction factor before they are displayed. IMPORTANT: Entering the wrong pressure reduction factor will result in erroneous measurements being displayed. Y-Axis Unit Change The default unit of the Y-Axis in the display modes of analog, histogram, P vs T, Leak Test, and Library is Torr. This can be changed by double clicking the unit word to open the RGA global unit dialog box. The user can choose a desired unit among Torr, mTorr, mbar, bar, Pascal, Amps (this is a current unit measured in the head), or a User defined unit in the box. There are a couple of other relative units in the box. When a unit is selected, all the related display modes employ the same units. SRS Residual Gas Analyzer Head Calibration and Security 5-22 Head Calibration and Security Note: For detailed information and command description of the RGA program please refer to the RGA On-Line Help files provided with the program disks. The RGA help system includes current and detailed description of all the features, procedures and commands available in the program. Tuning the RGA Sensitivity WARNING! The sensitivity tuning procedure should be performed by qualified personnel only. A mistuned RGA Head could give erroneous readings until it is retuned properly. Please refer to the RGA Tuning Chapter for more information about tuning and calibration. While performing the tuning procedure the total pressure in the vacuum chamber should be around 10E-6 Torr. In order to set the sensitivity factors of the RGA Head you must have a reference pressure gauge installed on your vacuum system. There are two sensitivity factors, one for total pressure and one for partial pressure. Both factors are stored in non-volatile memory in the RGA Head. To tune the sensitivity factors do the following: Make sure you are connected to the head. 1. Select the Sensitivity Tuning command from the Head menu. 2. Select which sensitivity factor you would like to adjust from the Measurement Mode section (Partial or Total). 3. If you selected Partial Pressure then enter the mass whose pressure you will be measuring in the Mass Selection edit box. 4. Enter the pressure indicated by your pressure gauge in the Reference Pressure Reading. 5. Press the Measure button. 6. Press Accept to start using the new factor(s) or Undo to revert back to the old one(s). Adjusting the CEM Gain The CEM gain may be set to any desired value between 10 and 1,000,000. The RGA program will automatically search the required high voltage for such a gain if the Adjust button is pressed. All data acquired while the CEM is ON gets divided by the gain automatically before it is displayed. SRS Residual Gas Analyzer Head Calibration and Security 5-23 To change the CEM Gain do the following: 1. Connect to an RGA Head with a CEM option (Utilities menu). 2. Select the CEM Settings command form the Head menu. 3. Enter the desired gain in the Gain edit box. 4. Press the Adjust button and wait for the procedure to finish. 5. Press OK. Peak Tuning the RGA Head WARNING! The peak tuning procedure should be performed by qualified personnel only. A mistuned RGA Head could give erroneous readings. Please refer to the RGA Tuning chapter of this manual for more information about tuning and calibration. All the variables displayed are initially read from the SRS RGA Head when the dialog box is activated. When you are done with this procedure, the new parameters are stored in non-volatile memory in the RGA Head. Activating this dialog box automatically puts the display mode in Dual Analog mode. The span is set to 10 amu with the two peak tuning gas masses set in the middle of each span. If you press Scan and you have sufficient gas amounts of each peak tuning gas, you should see the two peaks on the graphs. Use these peak for width and position adjustments. Every time you make a change to any of the parameters, press the Scan button to see the effect of the change on the graph. Use the graph scaling command AutoScale to scale the data. The peak tuning procedure must be performed in the order described below. repeat the entire procedure as needed until you are satisfied with the results. You may To tune the RGA Head peaks do the following: 1. Select the two gases you are going to use for peak tuning. Use the Gas Selection command (Head Menu)to enter the gas names and masses. 2. Press Scan to see where the peaks are positioned. you can see the gas peaks. Rescale the graph as needed so 3. Enter a Position Shift value for the Low Mass Peak if the peak does not fall exactly at its required mass. Press Scan. Repeat this step as needed until the peak is at the correct mass. SRS Residual Gas Analyzer 5-24 Head Calibration and Security 4. Repeat step 3 for the High Mass Peak Position 5. Iterate between steps 3 and 4 as needed 6. Enter a Width Adjust value for the Low Mass Peak (if needed ) and press scan (The full width of the mass peak at 10% of its maximum should be less than or equal to 1 amu). 7. Repeat step 6 for the High Mass Peak Width 8. Iterate between steps 7 and 8 as needed When you are done you may: • Press Done if you are satisfied with the results, or • Press Undo ALL to revert to the initial settings, or • Press Factory Settings to recall factory set values. Securing the RGA Head Use this feature in an environment where you would like to restrict access to the head parameters. When the RGA Head is locked, you cannot perform certain parameter editing procedures such as Peak Tuning, Sensitivity Tuning, and Ionizer parameter editing. The encrypted password is stored in the rga.ini file in the Windows directory. To lock the head parameters do the following: 1. Select the Lock Head Parameters command form the Head menu or click on the Lock button in the main Toolbar. 2. Enter an alphanumeric password. The password is case sensitive. 3. Confirm the password exactly as entered above. 4. Press Lock. To Unlock the head parameters do the following: 1. Select the Lock Head Parameters command form the Head menu or click on the Lock button in the main Toolbar. 2. Enter you password. 3. Press Unlock. SRS Residual Gas Analyzer 5-25 RGA On-line Help The RGA Help system contains detailed information on the operation of the program that is not contained in this manual. Use the On-Line Help to get up to date detailed information on the RGA Windows program. The following sections describe the different ways to use the RGA Help system. Context Sensitive Help Context Sensitive Help provides a quick and direct way to display information on a specific topic. Click on the Help cursor button whose help topic you wish to view. and then select the button or menu Help Search You may search the RGA Help system for any topic or keyword. Once you have the RGA Help system window open, select the search command and enter any keyword to display that topic. Help Index Displays a comprehensive index to information contained in the RGA Help system. To see the entries for a topic, click the first letter of the word you want to look up, or press TAB to select the letter and then press ENTER. Click on any entry highlighted in green and the topic for that entry is displayed automatically. Commonly Asked Questions A Q&A help files has been included with the RGA program. This file includes the most commonly asked questions about the SRS RGA system. Double click on the RGA Q&A Help Icon to view this file. Sample Scans The RGA Windows program includes several samples scan files that demonstrate some of the SRS RGA capabilities. The scan files are located in Scans subdirectory of the main RGA program directory. Double click on the Sample Scans Help Icon to view the description of the each scan file. SRS Residual Gas Analyzer 6-1 Chapter 6 Programming the RGA Head This chapter describes how to program the RGA Head from a host computer using the RGA Command Set and an RS232 Link. In This Chapter Introduction ............................................................................................................................................. 6-4 The RGA COM Utility .............................................................................................................................. 6-4 Intoduction .................................................................................................................................. 6-4 Communicating with a Head ..................................................................................................... 6-4 RS232 Interface ....................................................................................................................................... 6-6 LED Indicators......................................................................................................................................... 6-6 Command Syntax.................................................................................................................................... 6-7 Examples of command formats ................................................................................................ 6-7 Programming tips...................................................................................................................... 6-8 Communication Errors ........................................................................................................................... 6-9 Command errors ....................................................................................................................... 6-9 Parameter errors........................................................................................................................ 6-9 Jumper Protection violation ...................................................................................................... 6-9 Troubleshooting the RGA communications ...................................................................................... 6-11 Programming the RGA Head ............................................................................................................... 6-12 Initializing the RGA Head ......................................................................................................... 6-12 Programming the Ionizer ......................................................................................................... 6-13 Programming the Detector ...................................................................................................... 6-14 Setting up Analog Scans ......................................................................................................... 6-16 Setting up Histogram Scans.................................................................................................... 6-18 Single Mass Measurements..................................................................................................... 6-20 Total Pressure Measurements................................................................................................. 6-22 Storing information in the RGA Head..................................................................................... 6-23 Programming the Quadrupole Mass Filter............................................................................. 6-24 Error Checking the RGA .......................................................................................................... 6-25 SRS Residual Gas Analyzer 6-2 Programming the RGA Head RGA Command Set ...............................................................................................................................6-29 Initialization Commands ...........................................................................................................6-30 ID?..........................................................................................................................................6-30 IN0, IN1, IN2 .........................................................................................................................6-30 Ionizer Control Commands ......................................................................................................6-32 DGparam, param: 0 - 20,*.....................................................................................................6-32 EEparam, param: 25 - 105, *, ?.............................................................................................6-33 FLparam, param: 0.00 - 3.50, *, ? .........................................................................................6-34 IEparam, param: 0,1, *, ? ......................................................................................................6-36 VFparam, param: 0 - 150, *, ?...............................................................................................6-36 Detection Control Commands .................................................................................................6-38 CA ..........................................................................................................................................6-38 CL...........................................................................................................................................6-39 HVparam, param: 0 - 2490, *, ? ............................................................................................6-40 MO? .......................................................................................................................................6-42 NFparam, param: 0 - 7, *, ?...................................................................................................6-42 Scan and Measurement Commands .......................................................................................6-44 AP?.........................................................................................................................................6-44 HP?.........................................................................................................................................6-44 HSparam, param:0 - 255,* ....................................................................................................6-45 MFparam, param: 1 - M_MAX, *, ? .....................................................................................6-47 MIparam, param: 1 - M_MAX, *, ? ......................................................................................6-47 MRparam, param:0 - M_MAX .............................................................................................6-48 SAparam, param: 10 - 25, *, ?...............................................................................................6-50 SC[param], param: 0 - 255, * ................................................................................................6-51 TP?, TP0, TP1 ........................................................................................................................6-52 Parameter Storage Commands................................................................................................6-55 MGparam, param: 0.0000 - 2000.0000,? ..............................................................................6-55 MVparam, param: 0 - 2490,? ................................................................................................6-55 SPparam, param:0.0000 - 10.0000, ? ....................................................................................6-56 STparam, param:0.0000 - 100.0000, ? ..................................................................................6-56 Mass Filter Control Commands ...............................................................................................6-58 MLparam, param: 0.0000 - M_MAX....................................................................................6-58 Error Reporting Commands.....................................................................................................6-59 EC?.........................................................................................................................................6-59 ED?.........................................................................................................................................6-59 EF? .........................................................................................................................................6-60 EM? ........................................................................................................................................6-60 EP? .........................................................................................................................................6-61 EQ?.........................................................................................................................................6-61 ER?.........................................................................................................................................6-62 Tuning Commands....................................................................................................................6-63 CE?.........................................................................................................................................6-63 DIparam, param: 0 - 255, *, ? ...............................................................................................6-63 DSparam, param: -0.8500 - +0.8500, *, ? .............................................................................6-64 RIparam, param: -86.0000 - +86.0000, *, ?, none ................................................................6-65 RSparam, param: 600.0000 - 1600.0000, *, ?, none .............................................................6-67 SRS Residual Gas Analyzer Programming the RGA Head 6-3 Error Byte Definitions........................................................................................................................... 6-69 SRS Residual Gas Analyzer 6-4 The RGA Com Utility Introduction The RGA comes standard with an RS232 communications port. A host computer interfaced to the RGA can easily configure, calibrate, diagnose and operate the quadrupole mass spectrometer using ASCII commands. The RGA head executes the commands in the order received and, when information is requested, data is quickly returned to the computer for analysis and display. The fast exchange of data between the host computer and the RGA provides dynamic information about the status of a vacuum process or system. This Command Set facilitates integration of all the RGA functions into any processing or diagnostic program. The RGA COM Utility Introduction Note: If you are going to use the RGA Windows program you do not need to use this utility. The RGA Com Utility is a simple Windows Terminal program that allows you to communicate with the RGA Head directly by typing valid RGA commands on your keyboard. The program functions like any common terminal program where the typed characters are sent directly to the serial communications port and any received characters are displayed immediately on the screen. The RS-232 communication parameters of RGA Com are fixed to be compatible with the SRS RGA Head. The only variable that may be selected is the communications port. RGA Com Fixed parameters: x 28.8k Baud rate x 8 Data bits x No Parity x 1 Stop Bit Communicating with a Head To connect to an SRS RGA Head do the following: 1. Start the RGA Com program. 2. Locate the port to which the RGA is connected on the connector column and click to select it. 3. Click on the connect button to connect RGA COM to the RGA head. 4. Begin typing commands into the right panel with the blinking cursor. Press “enter” after each command to validate it. 5. When you are done, select “Disconnect” and exit the program. SRS Residual Gas Analyzer The RGA Com Utility 6-5 Tip x When you first connect to the head (step 4 above), send the ID? command to verify the connection with the RGA Head. This command will return the Model number, Serial number , and firmware version of the RGA Unit you are connected to. Important x If you make typing error the RGA’s Error LED will blink. Press “Enter” and retype the command, the Backspace character is not processed. x When you are done using RGA Com you must disconnect the COM port or exit the program, otherwise no other Windows program can communicate with the open COM port. SRS Residual Gas Analyzer 6-6 RS232 Interface RS232 Interface The RS232 interface connector of the RGA is a standard 9 pin, type D, female connector configured as a DCE (transmit on pin 3, receive on pin 2) with full RTS/CTS handshaking enabled. The CTS signal (pin 8) is an output indicating that the RGA is ready, while the RTS signal (pin 7) is an input that is used by the host computer to control the RGA’s data transmission. The communication parameters are fixed at: 28,800 baud rate, 8 databits, no parity, 1 stop bit. Cable connection: Use a straight through RS232 cable with 9-pin, type D connectors to connect the computer (usually DTE) to the ECU. The DB9 to DB25 adapter (provided with the unit) will be needed if the computer has a 25 pin Type D connector. Important: If you use your own RS232 cable check the connectors to make sure all the necessary handshaking lines are connected correctly. If a USB-to-Serial or Ethernet-toserial adapter is used, make sure all required drivers are installed in the computer before communication is attempted. LED Indicators To assist in programming, the RGA has two status LED’s on the rear panel of the ECU box. RS232 LED: RS232 Activity indicator that flashes whenever a character is received or transmitted over RS232. Error LED: The Error LED flashes on/off a couple times when an error, such as an illegal command or parameter, has been detected. SRS Residual Gas Analyzer Command Syntax 6-7 Command Syntax The RGA commands are ASCII character strings consisting of a two letter (case insensitive) command name, a parameter, and a carriage return terminator. Note: The carriage return character, decimal ASCII value=13, is represented throughout this manual with the symbol <CR>. All command strings must be terminated with this character in order to be acknowledged by the RGA. Valid parameters are: Numbers: Numbers are the most common type of parameter used to program the RGA. Number parameters must be within a command-specific range and must not conflict with any pre-existing parameter values of the head. Only Decimal format is accepted. The fractional parts are truncated to four decimal places before being stored in memory. The '+' sign is optional for positive numbers. A zero in front of the period is optional in fractional numbers with magnitude less than one. Asterisk “” (default): A single asterisk indicates that the default parameter value (stored in the RGA head’s permanent memory) is to be used for command execution. The asterisk must be strictly followed by a <CR>. Question mark “?” (Query): Query commands are used to read error bytes, to measure total pressure and to confirm internal parameter values. The question mark must be strictly followed by a <CR> terminator. With a few exceptions, the data returned by most query commands is a string of ASCII characters terminated by a linefeed (<LF>, decimal ASCII value=10) and a <CR> terminator: string<LF><CR>. No parameter: Some commands do not require a parameter. The RGA assumes a potential command-string has been received over RS232 when a <CR> character is detected in the serial interface. A command handler immediately analyzes the string, and if everything checks, the command is executed. However, if a problem is encountered a communication error is reported and no command execution takes place. The RGA has a 140 character input buffer and processes commands in the order received. If the buffer fills up, the RGA will hold off handshaking on the RS232 interface using the CTS line. Similarly, the RGA has a 32,000 character output buffer to store outputs until the host computer is ready to receive. If either buffer overflows, the buffer is cleared and the error is reported. Linefeed characters (<LF>, decimal ASCII value=10) and single carriage returns (<CR>, decimal ASCII value=13)) are ignored by the serial interface. Examples of command formats The following list of commands activates the ionizer and triggers a single analog scan from 1 to 100 amu at the default scan rate setting. Note that each one of the command character strings must be strictly followed by a <CR> character in order to be detected by the RGA’s command handler. SRS Residual Gas Analyzer 6-8 Command Syntax ID? MI1 MF100 FL1.0 NF* AP? SC1 RGA Identification Query. Set initial scan mass to 1 amu. Set final scan mass to 100 amu. Turn on the filament to a 1.0 mA emission current. Use default noise floor setting. (sets scan rate and averaging.) Query the number of scan points to be received by the computer. Trigger a single analog scan. Programming tips x Whenever possible, immediately follow a command that sets a parameter value with one that queries the parameter setting in the RGA memory. For example, the second command in the list above should be followed by a MI?, and a number 1 should be echoed by the RGA. x Whenever practical, check for errors at the end of command execution to make sure “everything went well”. x Even though the RGA head can store multiple commands in its receive buffer, it is highly recommended that the host computer wait for the response of a query before a new command (especially a new query) is transmitted to the RGA. This simplifies the communications and also eliminates buffer overwrites. x Commands that involve hardware control (such as turning the filament or the CDEM on) trigger diagnostic checks on the hardware as they are executed. Since the command execution time can be rather long, the RGA prompts the end of execution by sending back the value of the STATUS byte to the computer. Always check the value of the STATUS Byte returned for possible errors. In cases where a hardware error is reported retry the command one more time before declaring a hardware problem. x With the exception of the ion current values, the output of the RGA are ASCII character strings terminated by a <LF><CR> terminator. Ion signals are represented as integers in units of 10-16 Amps, and transmitted directly in hex format (four byte integers, 2’s complement format, Least Significant Byte first) for maximum data throughput. SRS Residual Gas Analyzer Communication Errors 6-9 Communication Errors Communication errors are signaled to the user flashing the Error LED a few times, setting Bit 0 of the STATUS error byte and setting the error-specific bits of the RS232_ERR error byte . Many different circumstances can result in a communication error being reported after a command string is received by the RGA. Some problems are detected early by the command handler and result in the command never being executed. Other errors are found later, during the actual command execution, and they result in the execution being immediately halted. The following is a list of the communication errors that might be encountered during the analysis and execution of a command, including the specific ways in which they are reported: Command errors Bad Command Name : The first two characters in a command string must be letters (case insensitive) and must be part of the Command Set, otherwise the Error LED is flashed, Bit 0 of RS232_ERR and Bit 0 of STATUS are set, and no command is executed. Command-too-long error : 14 characters are received over RS232 without a <CR> ever being detected. The Receive buffer is flushed, Bit 2 of RS232_ERR and Bit 0 of STATUS are set, and no command is executed. Note that the LED is not flashed for this error (only exception to the rule!). Parameter errors Bad-Parameter error: Many different possibilities lead to a bad-parameter error. x The number parameter is out of the command's acceptable range. x A “?” is not strictly followed by <CR> in a Query command. x A “*” is not strictly followed by <CR> in a Default command. x A non-zero fractional part is found in a parameter that can only be an integer. x No parameter is found in a command that strictly requires one. x A parameter other than a “?” is found in a Query-only command. x A default parameter value is used with a command that does not have one defined. All Bad-Parameter errors are reported flashing the Error LED, and setting Bit 1 of RS232_ERR and Bit 0 of STATUS. No command is executed. Parameter-conflict error: When the parameter is in conflict with some other related parameter value which pre-existed in the RGA head, the Error LED is flashed, Bit 6 of RS232_ERR and Bit 0 of STATUS are set and the command is not executed. Jumper Protection violation Some calibration related commands are subject to jumper protection. Jumper JP100 on the digital (i.e. top) board of the RGA electronics box can be used to enable/disable some of the tuning features of the instrument. The jumper setting is checked before the command is executed and if calibration is disabled, the Error LED is flashed, Bit 5 of RS232_ERR and Bit 0 of STATUS are set, and the command is not executed. The SRS Residual Gas Analyzer 6-10 Communication Errors jumper setting provides very solid protection against inadvertently tampering with important calibration parameters stored in the RGA’s memory. Please refer to the “RGA Command Set” list to find out which calibration commands are jumper protected. SRS Residual Gas Analyzer Troubleshooting the RGA communications 6-11 Troubleshooting the RGA communications The RGA’s communication interface includes a complete set of tools for troubleshooting communications between a host computer and the spectrometer’s head during programming: 1. Visual Clue The first clue of a communication error can be obtained watching the Error LED while communicating with the head. The ERROR_LED is flashed on/off two times every time a communication error is detected. 2. Error Queries The presence of a communication error can also be detected queering the contents of the STATUS byte in the RGA head. The query command ER? returns the value of the STATUS Byte for analysis, and a communication error is present if Bit 0 of STATUS is found set. The specific problem is determined querying the bits of RS232_ERR byte using the EC? which clears the RS232_ERR byte and Bit 0 of STATUS at the end of its execution to provide a clean error-reporting slate. Communication errors accumulate in the RS232_ERR byte as they occur and the byte can only be cleared by reading it with the EC? command. Note: Please refer to the “Error Byte Definitions” section of this chapter for a complete listing of the error and status bytes of the RGA. Also consult the “Error Reporting Commands” list for details on the EC and ER commands. SRS Residual Gas Analyzer 6-12 Programming the RGA Head Programming the RGA Head This section describes the basic programming steps needed to configure, operate, and diagnose the RGA. The emphasis is on general program implementation without going into specific details on the different commands that are mentioned. Please consult the “RGA Command Set” section of this chapter to get more detailed information on the RGA commands and their implementation. Initializing the RGA Head The RGA Head is ready to communicate a few seconds after it is turned on and all the built-in internal checking is performed. The Initialization commands are commonly used to test the quality of the RS232 interface, to reset the RGA’s communication buffers, to scan the hardware for problems, and to reset the unit to its default (factory preferred) parameter settings. Initializing the RGA communications The two commands most often used after connecting to the head are: ID? Identification Query. Echoes the RGA’s ID string. IN0 Clear communication buffers. Echoes the STATUS Byte. The ID? command is used to test the RS232 interface: The ID String, stored in the RGA Head, is returned to the computer and the integrity of the RS232 link is assured once the character string is received. The ID string also contains useful information such as model and serial number of the RGA head. The IN0 command clears all the RGA’s RS232 buffers, runs a fresh set of tests on the ECU’s hardware and sends back the STATUS Byte. Check the value of the STATUS byte for potential errors. Programming tips x Use the IN0 command every time there seems to be problems with the RS232 communications. The following procedure is recommended in those cases: 1. Reset the buffers in the computer. 2. Send a few carriage returns to clear the RGA’s receive buffer. 3. Send the IN0 command to reinitialize the RGA’s buffers. 4. Wait for the STATUS error byte to come back. 5. Test STATUS for possible errors. This trick is very useful to reset communications on both ends and is often implemented as a menu item. x The ID? command is used for a variety of purposes: -Make sure the RGA is powered up and ready to go. -Check the quality of the serial connection to the host computer. -Check the user’s communication software to make sure it is communicating properly with the RGA. -Check the serial numbers of the RGA heads connected to the computer's serial ports. SRS Residual Gas Analyzer Programming the RGA Head 6-13 Programming the Ionizer Positive ions are produced in the ionizer by bombarding residual gas molecules with electrons derived from a heated filament. The operational parameters that affect the efficiency of the ionizer are: electron energy, ion energy, electron emission current, and focusing voltage. The Ionizer Control Commands program all the ionizer voltages, turn the filament on/off, and Degas the ionizer. The STATUS byte is transmitted at the end of their execution. Important: Remember that the Repeller grid and the focus plate are only biased while the filament is emitting electrons. Setting the ionizer parameters The following list of commands will set the electron energy to 70 eV, ion energy to high (12eV), focus voltage to -100V and it will then turn the filament on with an emission current setting of 1.0 mA. It is a typical example of the set of commands sent to the RGA while programming the ionizer. EE70 IE1 VF100 FL1.0 Electron Energy = 70 eV. Echoes the STATUS Byte. Ion Energy = high (12eV). Echoes the STATUS Byte. Focus Voltage= -100V. Echoes the STATUS Byte. Filament emission = 1 mA and turn filament on. Echoes the STATUS Byte. Ionizer Programming Tips x It is possible to trigger scans and single mass measurements if the filament is not turned on. x Make sure the pressure is under 10-4 Torr before turning the filament on or degassing. x Whenever possible replace a Degas procedure with a thorough Probe Bakeout (See RGA Maintenance Chapter for details). Keep the degas time to the minimum value that will get the job done. Frequent degassing compromises the lifetime of the filament. x The filament is frequently tested by the CPU while it is turned on. Consult the Filament, Leak and Burnt LED’s after activation for immediate status feedback. x Wait for the STATUS byte to be returned between commands and check it every time for possible errors. x In cases were a hardware error is reported retry the command one more time before declaring a hardware problem. x Default parameter settings are available for all the Ionizer Control commands x Use the FL0 command to turn off the filament. SRS Residual Gas Analyzer 6-14 Programming the RGA Head Programming the Detector Positive ions that successfully pass through the quadrupole filter are focused towards a detector that measures the ion currents directly (Faraday Cup, FC) or, using an optional electron multiplier (CDEM), measures an ion signal proportional to the ion current. Use the Detection Control commands to choose the detector type (FC or CDEM), query the CDEM option, recalibrate the electrometer’s I-V response and set the electrometer’s averaging and bandwidth. Use the CA command to zero the ion detector at any time. Important: Faraday Cup detection is the default setting when the RGA head is turned on. Use the MO? command to determine whether an electron multiplier option (Option 01) is available in the RGA head being programmed. The CDEM is available if the response is 1<LF><CR>. The HV command activates/deactivates the CDEM detector. Its parameter value represents the bias voltage applied across the multiplier, and determines the gain of the amplifier. The null parameter, HV0, deactivates the CDEM and reconnects the FC detector to the electrometer. Note: The ElecMult LED reflects the status of the CDEM at all times. A temperature compensated logarithmic picoammeter measures the ion currents collected by the FC or CDEM. The microprocessor automatically configures the electrometer and connects its input to the correct signal based on the type of detector being used. The sign of the electron multiplier currents is reversed before the current value is sent out over RS232 so that the computer does not need to do any sign flipping on the currents received when the CDEM is activated. The accuracy of the ion current measurements is insured by an internal calibration procedure that calibrates the output of the electrometer against input current over its entire operating range. The I-V response can be recalibrated by the user at any time with the CL command. The bandwidth and detection limit of the electrometer are programmed with the NF (Noise Floor) command. A decrease in the Noise-Floor setting results in longer measurement times with cleaner baselines and lower detection limits. Histogram scans, analog scans, single-mass measurements and total pressure measurements share the same NF setting. The RGA automatically adjusts the scanning rate and averaging based on the NF setting selected. Important: The zero of the ion detector is automatically readjusted at the beginning of each analog and histogram scan so that the baseline is always centered around zero. The zero can also be readjusted at any time with the command CA. In both zeroing procedures, the output of the electrometer is measured in the absence of input ion current and stored, as a current value, in the RGA’s memory. The current value (called offset correction factor) is then automatically used by the firmware to offset-correct all ion currents measured (i.e. including those from single mass and total pressure measurements) under the same detector settings. The detector settings are the electrometer’s noise floor parameter value and the type of detector (i.e. FC or CDEM) in use at the time the zeroing is performed. Offset correction factors for all the possible combinations of detector settings can be generated and accumulated in the RGA’s SRS Residual Gas Analyzer Programming the RGA Head 6-15 memory. However, all offset correction factors are cleared after a recalibration (CL) of the electrometer is performed, and when the unit is turned off. Please consult the RGA Command Set section for details on the CA command. Detector Programming example The following list of commands starts by checking the RGA head to make sure there is a multiplier installed: A CDEM is present if a 1<LF><CR> response is sent back to the computer. After the test (and assuming the CDEM option was detected), a voltage of -1400V is set across the multiplier, and the noise floor setting is programmed for minimum averaging and maximum scan rate. The detector is now fully configured for CDEM measurements with -1400 V of CDEM bias voltage. MO? Multiplier Option Query. Check query response: 1<LF><CR> confirms CDEM option. HV1400 High Voltage CDEM = 1400V. Echoes the STATUS Byte. NF7 Noise Floor = 7. Notes: Append a CA command at the end of this list to readjust the zero of the ion detector measurements under the present detector settings. The correction factor will then be used by all measurements (i.e. single mass and total pressure) under this same detector settings to correct against zero drifts. Use the HV0 command to go back to FC detection mode. Important: Total Pressure measurements are disallowed when the CDEM is activated (TP_Flag is cleared as soon as the CDEM is biased). Please see the TP command for details. Detector Programming Tips x Use the ElecMult LED to visually inspect the status of the CDEM during programming. x Use the HV? command to query the type of detector that is currently active. The CDEM is active if a non-zero response is returned to the computer. x Check the value of STATUS as returned after the HV command execution: Bit 3 provides immediate information about the success of the command. x The HV command checks for the presence of a CDEM option in the RGA Head before execution starts and an error is reported if no CDEM is available. (Please see EM query command for details.) x It is possible to activate the CDEM if the filament is not emitting electrons, but the CDEM will be deactivated by any overpressure that shuts-down the filament. x The correct operation of the electrometer can be tested using the Error Reporting command ED?. SRS Residual Gas Analyzer 6-16 Programming the RGA Head x The scan rates and signal-to-noise ratios for the different NF settings of the electrometer are listed in a table in the Electrometer section of the “RGA Electronics Control Unit” chapter. x When using the RGA Windows program to operate the RGA, the Scan Speed parameter setting available in the Scan Parameter Setups of the Scan menu is used to set the NF parameter value in the RGA Head according to the equation: NF = ScanSpeed - 1. x Use the CA command to readjust the zero of the detector every time the detector settings are changed (i.e. after changing the NF parameter setting or changing detector type). This is particularly important if the new settings have not been used in a long time or since the unit was turned on or recalibrated with the CL command. x Follow all recommended procedures for the operation of the CDEM. Consult the RGA Maintenance chapter for complete CDEM Care and Handling information. Setting up Analog Scans Analog scanning is the most basic operation of the RGA as a quadrupole mass spectrometer. During analog scanning the quadrupole mass spectrometer is stepped at fixed mass increments through a pre-specified mass-range. The ion current is measured after each mass-increment step and transmitted to the host computer over RS232. Analog scans are triggered with the SC command. The scan parameter can be set for single, multiple and continuous scanning operation. The mass range for the scan is set in advance with the commands MI (Initial Mass) and MF (Final Mass) and the massincrements are fixed with the command SA. Scan rate and detection limits are preprogrammed by the NF (Noise Floor) setting. A current value is transmitted for MI and after each mass increment through MF for a total of (MF-MI )*SA+1 measurements (See AP query command). For maximum data throughput, the ion currents measured are represented as integers in units of 0.1 fA, and transmitted directly in Hex format ( four byte integers with 2's complement format and Least significant byte first). The detector settings (i.e. detector type and electrometer’s noise-floor setting) to be used during the scans must be selected in advance with the NF and HV commands. The zero of the RGA’s ion detector is automatically readjusted at the beginning of each analog scan so that the baseline is centered around zero. (The offset correction factor calculated and stored in memory, will then be automatically used to correct all currents measured (i.e. including those from single mass and total pressure measurements) under the same detector settings) The internal scan parameters used by the firmware to step the RF during the scan, are checked and corrected at the beginning of the scan to make sure that the correct RF levels (i.e. as specified by the last Peak Tuning procedure) are programmed on the RF rods as a function of mass. SRS Residual Gas Analyzer Programming the RGA Head 6-17 Important: x The detector’s zero and the internal scan parameters are checked and corrected at the beginning of each scan resulting in a slight delay before the scan actually starts. x The measurements are performed with the detector that is active at the time the scan is triggered. x A Total Pressure measurement is performed at the end of each scan and transmitted out to the host computer. In the event where the CDEM is turned on, the total pressure returned from the head is 0.00. (Please see AP and TP Commands). Setting up an analog scan The following list of commands sets a scanning range of 10 to 150 amu, the fastest scan rate (minimum averaging), 0.1 amu steps, and, after checking the number of currents to be measured per scan (not including total pressure), it triggers 10 scans under those conditions. Each one of the 10 scans transmits 1401 scan currents and one total pressure current, and each current is 4 bytes long. MI10 MF150 NF7 SA10 AP? SC10 Initial mass = 10 amu. Final mass = 150 amu. Fastest scan rate selected. Steps/amu = 10. Analog Points query. The number 1401 is echoed. Add one for total pressure. Analog Scan trigger: 10 scans are generated and transmitted. Analog Scan Programming Tips x It is good programming practice to follow each command that sets a parameter with a query of the parameter setting. For example, the first command in the list should be followed by a MI?, and a number 10 should be echoed by the RGA. x Notice that MI and MF are shared by analog and histogram scans. x Any command sent to the RGA during scanning will immediately halt the scanning action and clear the RGA’s transmit buffer. Remember to also clear the computer’s receive buffer to reset the communications. The new command responsible for stopping the scan will be executed! x The RGA has the ability to store a complete scan in its output buffer. The scan remains in memory until all the data is transmitted out to the host computer over RS232. As a result of the high acquisition rate of the RGA there might be a delay between the time at which the data is collected by the RGA head and the time at which a complete spectrum is displayed by the host computer. The time lag between data acquisition and display depends on a large number of factors including the scan rate (NF setting) of the RGA, the host computer’s processing speed, and the amount of handshaking activity over the RS232 lines. As computers get faster, they will be able to catch up with the RGA data acquisition speed and this problem will no longer need any consideration. SRS Residual Gas Analyzer 6-18 Programming the RGA Head x Before a new scan starts the RGA checks its internal memory to make sure that no data from any previous scan is pending to be transmitted. If data is still pending, the RGA must finish transmitting it before the new scan can start. This process may result in a delay from the time the scan trigger is received to the time it actually starts. Using the SC1 command and waiting until the whole scan data stream is transmitted back to the host computer will minimize the problems that are associated to this feature. x Perform a complete Peak Tuning procedure on the RGA Head if the peaks in the spectrum do not appear at their correct mass values (Consult the Peak Tuning section in the RGA Tuning chapter). Setting up Histogram Scans A Histogram (Bar Mode) Scan consists of a succession of individual single mass measurements over a pre-specified mass range. A single value is used to represent the peak heights at each integer mass within the range. Histogram scanning is one of the most commonly used modes of operation for the RGA. Its two main advantages are a faster scan rate than analog scans, and a reduced amount of data being exchanged during the scan. Histogram scans are triggered with the HS command. The scan parameter can be set for single, multiple and continuous scanning operation. The mass range for the scan is set in advance with the commands MI (Initial Mass) and MF (Final Mass). A current value is transmitted for each integer mass value between MI and MF for a total of (MF-MI +1) measurements (See HP command). For maximum data throughput, ion currents are represented as integers in units of 10-16 Amps, and transmitted directly in hex format (four byte integers, 2’s complement format, Least Significant Byte first). The detector settings (i.e. detector type and electrometer’s noise-floor setting) to be used during the scans must be selected in advance with the NF and HV commands. The zero of the RGA’s ion detector is automatically readjusted at the beginning of each histogram scan so that the baseline is centered around zero. The offset correction factor calculated and stored in memory, will then be automatically used to correct all currents measured (i.e. including those from single mass and total pressure measurements) under the same detector settings. The internal scan parameters used by the firmware to step the RF during the scan, are checked and corrected at the beginning of the scan to make sure that the correct RF levels (i.e. as specified by the last Peak Tuning procedure) are programmed on the RF rods as a function of mass. Important: x The detector’s zero and the internal scan parameters are checked and corrected at the beginning of each scan resulting in a slight delay before the scan actually starts. x The measurements are performed with the detector that is active at the time the scan is triggered. SRS Residual Gas Analyzer Programming the RGA Head 6-19 x A Total Pressure measurement is performed at the end of each scan and transmitted out to the host computer. In the event where the CDEM is turned on, the total pressure returned from the head is 0.00. (Please see AP and TP Commands). Setting up a histogram scan The following list of commands sets a scanning range of 1 to 50 amu and the slowest scan rate, and, after checking the number of currents to be measured per scan (not including total pressure), it triggers a single scan under those conditions. During the scan, 50 scan currents and one total pressure current are transmitted to the computer, and each current is 4 bytes long. MI1 MF50 NF0 HP? HS1 Initial mass=1 amu. Final mass=50 amu Slowest scan rate selected. Histogram Points query. The number 50 is echoed. Add one for total pressure. Histogram Scan trigger: 1 scan is collected and transmitted. Histogram Scan Programming Tips x It is good programming practice to follow each command that sets a parameter with a query of the parameter setting. For example, the first command in the list should be followed by a MI?, and a number 1 should be echoed by the RGA. x Notice that MI and MF are shared by analog and histogram scans. x Any command sent to the RGA during scanning will immediately halt the scanning action and clear the RGA’s transmit buffer. Remember to also clear the computer’s receive buffer to reset the communications. The new command responsible for stopping the scan will be executed! x It is good practice to perform an analog scan before triggering a large set of histograms to assure the correct peak tuning (i.e. correct peak locations and widths) of the quadrupole mass filter. Perform a complete Peak Tuning Procedure as described in the RGA Tuning chapter of this manual if significant shifts in the peak locations are observed. x The RGA has the ability to store a complete scan in its output buffer. The scan remains in memory until all the data is transmitted out to the host computer over RS232. As a result of the high acquisition rate of the RGA there might be a delay between the time at which the data is collected and the time at which a complete spectrum is displayed by the host computer. The time lag between data acquisition and display depends on a large number of factors including the scan rate (NF setting) of the RGA, the host computer’s processing speed, and the amount of handshaking activity over the RS232 line. As computers get faster, they will be able to catch up with the RGA data acquisition speed and this problem will no longer need any consideration. x Before a new scan starts, the RGA checks its internal memory to make sure that no data from any previous scan is pending to be transmitted. If data is still pending, the RGA must first finish transmitting the stored data before the new scan can start. This SRS Residual Gas Analyzer 6-20 Programming the RGA Head process may result in a delay from the time the scan trigger is received to the time it actually starts. Using the HS1 command and waiting until the whole scan data stream is transmitted back to the host computer will minimize the problems that are associated to this feature. Single Mass Measurements Single mass measurements are triggered with the MR command. The parameter is the integer mass number (mass-to-charge ratio in amu units) at which the measurement is performed. The type of detector and noise-floor settings to be used by the measurement must be selected in advance with the NF and HV commands. The precision and duration of the measurement are totally determined by the NF parameter value. The scan rates and signal-to-noise ratios for the different NF settings of the electrometer are listed in a table in the Electrometer section of the “RGA Electronics Control Unit” chapter. The command execution time includes some initial time spent waiting for the Quadrupole Mass Filter and the electrometer response to settle. As usual, a compromise must be made between signal-to-noise and measurement time. The ion current is expressed in the usual format: 4 byte long, 2's complement integer in units of 10-16 A, with Least Significant Byte transmitted first. Important: x During a Single Mass Measurement the RGA performs a “Miniscan” around the mass requested, and the maximum current value measured is sent out over RS232. The scanning procedure, referred to as Peak-Locking, is designed to measure peak currents for individual masses in a mass spectrum without being affected by drifts in the mass scale calibration. The Miniscan covers a 0.6 amu range centered at the mass requested, and selects the maximum current from 7 individual measurements performed at 0.1 amu mass increments. x The detector settings (i.e. type of detector and noise-floor setting) to be used during the measurement must be selected in advance with the NF and HV commands; otherwise, the measurements are performed with the detector settings that are present at the time the scan is triggered. x The ion detector can be zeroed, prior to the measurements, performing an analog or histogram scan or using the CA command, under the same detector settings (An offset-correction factor is calculated and stored in memory that it is then automatically used by the Miniscan procedure to correct all ion currents measured). The CA command will also update the internal scan parameters to assure that the correct RF levels (i.e. as specified by the last Peak Tuning procedure) are programmed on the RF rods as a function of mass during the Miniscan. Single Mass Measurement example The following list of commands can be used to perform a single mass measurement at 28 amu. First, the electron multiplier is turned off and the FC is connected to the SRS Residual Gas Analyzer Programming the RGA Head 6-21 electrometer, the noise floor is set to the maximum averaging (best signal-to-noise ratio and longest measurement time), the zero of the detector is readjusted, and the measurement is triggered. The single current value returned by this command is the maximum current in the 28 +/-0.3 amu region of the mass spectrum, and must be corrected with a sensitivity factor to obtain the actual partial pressure reading at mass 28. Important: The RF/DC on the QMF are left at 28.3 amu at the end of this measurement, and the MR0 command can be used to turn them off. Important: The CA command turns off the RF/DC at the end of its execution. HV0 NF0 CA High Voltage CDEM = 0 Volts, FC detection enabled. Maximum averaging (slowest scan rate) selected. Readjust the zero of the detector for clean baseline and update the internal scan parameters. MR28 Single measurement triggered @ 28 amu. A single current value is returned and the RF/DC are left at 28.3 amu. Collect the 4 byte current value returned.(Use sensitivity factor to convert it to pressure value.) MR0 Turn off the RF/DC on the QMF rods when done measuring. Single Mass Measurement programming tips x Single mass measurements are very commonly used in program loops where several different masses are monitored in a merry-go-round fashion and their partial pressures displayed as a function of time. x The outputs provided by a set of single mass measurements are often used in process control programs to control alarms, analog and digital outputs, and relays. For example: The output of a D/A converter can be linearly related to the readings obtained at a certain mass. A relay switch can be closed whenever another mass concentration goes above a certain level. A digital output can be set high when a third mass goes under a minimum acceptable partial pressure value. x For best accuracy of results, it is best to perform all consecutive mass measurements in a set with the same type of detector and at the same noise floor (NF) setting. Fixed detector settings eliminate settling time problems in the electrometer and in the CDEM’s HV power supply. x It is good practice to perform an analog scan before triggering a long set of measurements to assure the correct tuning (i.e. correct peak locations and widths) of the quadrupole mass filter. Perform a complete Peak Tuning Procedure as described in the RGA Tuning chapter of this manual if shifts in the peak locations are observed. SRS Residual Gas Analyzer 6-22 Programming the RGA Head x The RF/DC voltages are not turned off at the end of a measurement. Use the MR0 command at the end of a set of measurements and before quitting a program to make sure the RF/DC voltages are deactivated completely. Total Pressure Measurements The RGA might be thought of as a Total Pressure Ionization gauge with a mass analyzer interposed between the ionizer and the detector. Thus, by disabling the massdiscriminating action of the analyzer section, it is possible to use the RGA as a total pressure ionization gauge. Total pressure measurements are automatically requested at the end of each analog and histogram scan, and can also be triggered directly by the user with the TP? command. The response of the RGA to a Total Pressure measurement request depends on the status of TP_Flag at the time the measurement is requested: TP_Flag : 1 => The measurement is performed and the total ion current is transmitted. TP_Flag : 0 => No actual measurement is performed but a null current is still sent out over RS232. TP_Flag is set upon a power-on reset and cleared when the CDEM is activated. It can also be toggled on/off by the user with the TP command. For example, total pressure measurement can be re-enabled after the CDEM is turned on by using the TP1 command (see Tips below). The total ion current measured by the electrometer is transmitted in the standard format : Integer in units of 10-16 A, 4 Bytes long, 2's complement format, with the Least significant byte transmitted first. Note: While performing a total pressure measurement the RF in the quadrupole mass filter is set to 1 amu and the DC bias is zeroed. All ionic species have stable trajectories down the filter under those conditions and reach the ion current detector with different efficiencies. Important: The sensitivity factor for the TP measurements is highly mass dependent. The additional mass discrimination that takes place in the filter results in the mass dependence of the RGA readings being very different from that of the Bayard Alpert gauge readings. Expect to see deviations between the two gauges as the composition of a residual gas changes. Total Pressure measurement example The following list of commands is an example of a total pressure measurement setup. The first step sets up the FC as the detector, and automatically sets the TP_Flag = 1. The second step triggers a total pressure measurement in the RGA Head. The total current returned to the computer can be converted into a pressure using a mass dependent sensitivity factor. HV0 High Voltage CDEM = 0 Volts, FC detection activated, TP_Flag = 1. TP? Total pressure measurement trigger. Total ion current is returned. SRS Residual Gas Analyzer Programming the RGA Head 6-23 Total Pressure measurement programming tips x Use the TP query command to check the total pressure with the FC prior to turning on the CDEM. Do not turn on the CDEM if the pressure is too high! See the CDEM Handling and Care recommendations, in the RGA Maintenance chapter, for details. x There is no query for the TP_Flag value. If the status of the flag is unknown prior to requesting a Total Pressure measurement, use TP1 to set the flag or TP0 to clear it as needed. x TP_Flag is cleared whenever the CDEM is turned on to protect the multiplier from large ion currents. TP1 can be used to reset the TP_Flag to one after making sure the total pressure is in a “safe” range for the CDEM. x The sensitivity of the RGA for total pressure measurements will usually be affected after mass axis recalibrations (i.e. Peak Tuning). Check the sensitivity calibration after any peak tuning procedure. Storing information in the RGA Head In order to make the RGA a stand-alone mass spectrometer, four parameter storage commands can be used to store head-specific information in the instrument’s non-volatile memory. The head specific parameter values that can be stored are: SP: Sensitivity factor for partial pressure measurements, generally for nitrogen or argon. See SP command. ST: Sensitivity factor for Total Pressure measurement, generally for nitrogen or argon. See ST command. MV: CDEM High Voltage setting that corresponds to the gain stored by MG. See MV command. MG: CDEM gain at the HV setting stored in MV. See MG command. See the Parameter Storage commands list in the next section for details. Important: x The Parameter Storage commands are used by the RGA Windows software to store and retrieve the partial and total pressure sensitivity factors, and the gain and voltage settings of the CDEM calculated and used by the program. x The parameter values are not used internally by the RGA to correct for sensitivity or gain, they are simply stored so they can be read and used by any computer connected to the RGA Head. SRS Residual Gas Analyzer 6-24 Programming the RGA Head x MV and MG are only available in units with the CDEM option (Option 01) installed (See MO command for details) and usually store a calibrated pair of [gain, high voltage] values for the CDEM. Programming example The following list shows a typical application of the storage commands to save head specific information in the RGA Head. The first line stores a partial pressure sensitivity factor of .1mA/Torr, the second line stores into memory a total pressure sensitivity of .02mA/Torr, and the last two lines store a [1400V | 10,000 gain] calibrated pair for the CDEM. SP0.1 ST.02 MV1400 MG10 Partial pressure Sensitivity= 0.1 mA/Torr. Total pressure Sensitivity = 0.02 mA/Torr. CDEM HV setting (for MG gain): 1400 V. CDEM gain (@MV setting)=10,000x. Programming the Quadrupole Mass Filter Use the ML (Mass Lock) command to activate the quadrupole mass filter (QMF) and center its pass-band at any mass number within the available range. The command ML is included for the convenience of users who wish to use the RGA as a mass filter. The QMF is parked at the mass requested but no actual measurements take place. The command’s parameter can be a real number and the step resolution is 1/256 amu. The command execution involves two steps: 1. The RF/DC levels corresponding to the mass requested are calculated and set on the QMF rods based on the mass axis calibration parameter values specified by the last Peak Tuning procedure. 2. A firmware driven algorithm is then automatically enabled to stabilize the voltage output of the RF Driver’s controller against temperature fluctuations. The net result is very stable RF/DC levels that are highly insensitive to the operating conditions of the RGA Head. Important: The RF/DC stabilization algorithm (Step 2 above) remains active as long as no new commands are detected by the RGA Head. Once a new command is received, stabilization stops, and the new command is executed. Use the ML0 command to turn off the RF/DC bias when finished performing measurements and before quitting the program controlling the RGA. QMF programming example ML28 ML42.50 ML0 SRS Residual Gas Analyzer Activate the mass filter and center its pass band at 28 amu Activate the mass filter and center its pass band at 42.50 amu. Deactivate the QMF. (same as MR0 command) Programming the RGA Head 6-25 QMF Programming tips x Take advantage of the stabilization feature of the ML command whenever possible. For example: Do not send any new commands to the RGA Head once the QMF has been set to the specified mass value, or otherwise recall the ML command, whenever practical, to refresh the QMF RF/DC settings. x A typical application of the ML command involves monitoring a single mass concentration looking directly at the linear output of the CDEM anode with a boxcar or transient digitizer. x Use the ML0 command to turn off the RF/DC bias when finished performing measurements and before quitting the program controlling the RGA. x It is good practice to perform an analog scan before using the ML command to assure the correct tuning (i.e. correct peak locations and widths) of the quadrupole mass filter. Perform a complete Peak Tuning Procedure as described in the RGA Tuning chapter of this manual if shifts in the peak locations are observed. Error Checking the RGA Several firmware-driven checks automatically test the RGA when the unit is turned on, and continuously monitor the internal workings of the instrument. A “Background Filament Protection Mode” is activated when the filament is turned on to protect the delicate filament (and CDEM) from accidental overpressures. Several commands can be used to trigger hardware tests on the ECU. Any one of the internal checks just described can detect and report errors, and it is the responsibility of the user to constantly monitor the RGA Head for error reports. There are two ways to detect the presence of errors in the RGA: 1. Visually: Inspecting the red LED’s on the rear panel of the ECU. The Error LED is turned on whenever a hardware problem is detected, and it flashes twice if a communications error is generated during programming. The Burnt and Leak LED’s indicate specific filament problems and are turned on, in addition to the Error LED, whenever the ionizer’s emission is internally shut down or not established as requested. 2. Error Queries: Queering the Error Bytes with the Error Reporting commands. The “Error Byte Definitions” section of this chapter describes the different error bytes used to store the results of the internal checks. The “Error Reporting Commands” query the error bytes and are used to quickly diagnose problems. Important: The RGA Windows software supports all the Error Reporting commands and routinely monitors the Error Bytes. Detected errors are immediately reported to the user and identified based on Error Codes. See the RGA Troubleshooting chapter for recommended solutions to the problems. The STATUS error byte is the gateway to error diagnosis: SRS Residual Gas Analyzer 6-26 Programming the RGA Head Important: The RGA is free of detected errors as long as the STATUS byte is clear (no bits set). Each bit of the STATUS byte reflects the result of a different type of internal check. Each internal check involves several different tests on a component of the RGA (See the RGA Troubleshooting Chapter for details). The results of the specific tests are stored in check-specific error bytes. All error bytes can be queried by the computer, using the Error Reporting commands, to find out which bits are set. Internal Check(a) ERROR Byte 7 not used N.A. N.A. 6 24V External P/S(b) PS_ERR EP? 5 Electrometer(b) DET_ERR ED? 4 Quadrupole Mass Filter(b) QMF_ERR EQ? 3 Electron Multiplier CEM_ERR EM? 2 not used N.A. N.A. 1 Filament FIL_ERR EF? 0 Communications RS232_ERR EC? STATUS Bit (c) Query (d) (a) RGA component checked. Each check involves several tests on the component. (b) Internal checks automatically performed upon a power-on-reset (c) Error bytes that store the results of the tests for each type of internal check. (d) The Error Reporting command that queries the error byte. The Error LED is immediately turned on if any one of the bits 1-7 of STATUS is set. Bit 0 of STATUS reports communications errors and the Error LED is only flashed twice when the bit is set. The STATUS Byte should be queried regularly by the programming software (ER? command.) Commands that involve hardware control (such as Ionizer Control commands) do diagnostic checks on the hardware as they are executed. Since the command execution time can be rather long, the RGA prompts the end of execution by sending back the value of the STATUS byte to the computer. Always check the STATUS Byte value returned for possible errors. If one or more bits of the STATUS byte are found set, the specific error bytes (PS_ERR, DET_ERR, QMF_ERR, CEM_ERR, FIL_ERR, and RS232_ERR) must be queried individually to diagnose the problem. Error diagnosis examples Example #1: The RGA is powered up and, after the automatic internal checking is over, the Power SRS Residual Gas Analyzer Programming the RGA Head 6-27 LED is turned off and the Error LED is turned on. The problem is immediately diagnosed visually as a failure in the 24V External P/S check. A multimeter could be used to check the output of the external power supply and determine the nature of the problem; however, the computer could also be used to diagnose the problem using the query commands: The ER query command returns a STATUS Byte with bit 6 set indicating a 24V P/S problem. The EP query command is then used to query PS_ERR. Bit 6 of PS_ERR is found set (Error Code: PS6) indicating that the P/S output is less than the acceptable minimum of 22 V. This error is also immediately reported by the RGA Windows software as an Error Code: PS6, and the RGA Troubleshooting section can be consulted to solve the problem. Example #2: The RGA is idling between scans, waiting for commands from the computer, when suddenly a vent-valve is accidentally opened and the vacuum system is pressurized. The Background Filament Protection mode immediately detects the problem and turns off the filament. The change is easily detected because the Filament LED turns off, and the Error and Leak LED’s simultaneously turn on. A visual inspection of the red LED’s is all that is needed in this case to detect and diagnose the problem; however, a computer could do the same diagnosis with the help of the query commands: The ER? command, used to monitor the STATUS byte regularly, returns a non-zero byte value. Further analysis, shows that bit 1 is set indicating a filament problem. The EF? command is then used to read in the value of FIL_ERR. Bit 6 is found set indicating that the filament was unable to set the requested emission current and had to be shut down (Error Code: FL6). The problem is quickly diagnosed as an overpressure using the RGA Troubleshooting chapter directions. The error is also immediately reported by the RGA Windows software as Error Code: FL6, and the RGA Troubleshooting section can be consulted to solve the problem. Example #3: The RGA is turned on and, after all the internal checks are performed, the green Power LED and the Error LED are turned on. The red LED signals the operator that a problem was detected. A 24V P/S error is not expected since the Power LED is on. The ER? command returns a STATUS byte with bit 4 set, pointing to a quadrupole mass filter problem. The command EQ? is used to read in the QMF_ERR byte. Bit 7 is found set indicating that the RF driver is unable to set the maximum RF value available to the RGA (Error code RF7 in Troubleshooting Chapter). A quick visual inspection of the RGA head shows that the ECU is not pushed all the way into the probe and no actual connection exists between the rods and the RF driver. This error is also immediately reported by the RGA Windows software as Error Code: RF7, and the RGA Troubleshooting section can be consulted to solve the problem. Example #4: The user notes that the Error LED flashes every time the ID? command is sent to the SRS Residual Gas Analyzer 6-28 Programming the RGA Head RGA and the ID string is never returned (i.e. receive timeout). The STATUS byte returned by the ER command has the bit 0 set as expected for a communications problem. The specific communications problem is diagnosed using the EC? command. Bit 0 of RS232_ERR is found set indicating that a bad command is being detected by the RGA. The user checks the communications program and finds out that, due to mistyping, the IM? string is being sent to the RGA instead of ID?. The problem is easily corrected. Error Checking Programming tips x Keep a close eye on the Error LED’s while programming the RGA. Diagnose problems as soon as they are detected. x Even though a lot of internal checks are performed by the microprocessor, not all possible internal error conditions are accounted for. x The values of the Error Bytes often change after an Error Byte query command is executed. Some query commands update the byte value after performing a fresh test on the hardware, while others clear error bits, after they are read, to provide a clean error-reporting slate. Please see the Error Reporting Commands list for details. x It is good programming practice to check the value of the STATUS byte whenever it is returned at the end of command execution. x In cases were a hardware error is reported at the end of a command attempt the command one more time before declaring a hardware problem. SRS Residual Gas Analyzer RGA Command Set 6-29 RGA Command Set This section lists and describes the commands of the RGA’s Command Set. The commands are separated into several lists, based on their functions. They are each identified by a header that describes the command’s syntax (with the acceptable parameter values), the command’s function, and the information returned (Echo) to the computer during execution. The RGA commands are ASCII character strings consisting of a two letter (case insensitive) command name, a parameter, and a carriage return terminator. Note: The carriage return character, decimal ASCII value=13, is represented throughout this manual with the symbol <CR>. All command strings must be terminated with this character in order to be acknowledged by the RGA. The two letter mnemonic in each command sequence specifies the command name. The rest of the sequence consists of parameters. Three types of parameters are allowed: numbers, asterisk (default param), and question mark (query). Not all commands accept all types of parameters, and some need no parameters at all. In general, number parameters can be real or integer; however, some commands will only accept integers. Commands that accept only integers are recognized because the numbers used to specify their parameter range do not have a fractional part. The maximum mass number recognized by the RGA is model dependent and is represented by M_MAX: 100 for the RGA100, 200 for the RGA200, and 300 for the RGA300. With a few exceptions, the data returned by most query commands is a string of ASCII characters terminated by a linefeed (<LF>, decimal ASCII value=10) and a <CR> terminator: string<LF><CR>. Ion currents are represented as integers in units of 10-16 Amps, and transmitted directly in Hex format: four byte integers, 2’s complement format, Least Significant Byte first. SRS Residual Gas Analyzer 6-30 Initialization Commands Initialization Commands ID? Description: Identification query. Echo: ID string. Use to identify the RGA head connected to the host computer. The RGA returns the ID string (ASCII format): SRSRGA###VER#.##SN#####<LF><CR> The three string parameters, in the exact format shown above, correspond to: 1. Model number (=M_MAX): 100 for RGA100, 200 for RGA200 and 300 for the RGA300. 2. Firmware version ( for example: 0.23). 3. Serial Number of the unit (5 digit format). The ID command is used for a variety of purposes: x Make sure the RGA is powered up and ready to go. x Check the quality of the RS232 connection to the host computer. x Check the user’s communication software to make sure it is communicating properly with the RGA. x Check the serial numbers of the RGA heads connected to the computer's serial ports. The unique serial number attached to each head can be used for identification purposes avoiding the problems caused by cable swapping in the RS232 connections under multiplexed operation, or head swapping in the vacuum system. Parameters: Only one possible format: ID? Error checking: Only a query format is accepted. Anything else results in a Bad-parameter error. IN0, IN1, IN2 Description: Initialization command Echo: STATUS Byte Initialize the RGA to a known state. Three different levels of initialization are available. SRS Residual Gas Analyzer Initialization Commands 6-31 Command excecution times vary depending on the pre-existing ionizer conditions. The end of the command excecution is prompted to the host computer returning the STATUS byte over RS232. Parameters: IN0: Initialize communications and check the ECU hardware. x The input and output data buffers are emptied (all communications are disabled while this happens). x Bit 0 of STATUS and RS232_ERR are cleared x A fresh check of the ECU hardware, including the 24V P/S, the Electrometer and the QMF RF P/S, is performed and the necessary error bytes are updated. IN1: Reset the RGA to its factory default settings. In addititon to the above, the RGA is reprogrammed to its default (i.e. Factory preferred) values: x Total Pressure measurement. is enabled: TP_Flag =1 x Default parameter settings are selected for: MI (1), MF (M_MAX), SA (10), NF (4), IE (1), EE (70), and VF (90). x The filament’s electron emission setting is left unmodified and the ionizer is biased to default voltages if necessary. IN2: Activate Standby mode. In addition to the above: x The filament and the CDEM are turned off. Error Checking: The command accepts no default or query parameter values. The absence of a parameter is treated as a bad-parameter error. SRS Residual Gas Analyzer 6-32 Ionizer Control Commands Ionizer Control Commands DGparam, param: 0 - 20,* Description: Ionizer Degas command Echo: STATUS error byte (unless command is stopped before completion, or param=0). DEGAS the ionizer by heating and electron stimulated desorption. The parameter represents the desired DEGAS time in minutes and includes a one minute initial ramping time. Warning: Repeated degassing will considerably limit the lifetime of the filament. Whenever possible replace a Degas procedure with a thorough probe and vacuum system bakeout (See Probe Bakeout in RGA Maintenance Chapter). Important: The Electron Multiplier is turned off at the beginning of a Degas cycle, and left unbiased at the end, for protection. During the DEGAS process, the electron energy is set to 400 eV, and the electron emission current is ramped to 20 mA over a 1 minute period. The high ionizer energy (c.a. 8W) combined with a large flux of highly energetic electrons degasses the ionizer in a process known as electron stimulated desorption. Degassing is done in a very controlled fashion. The electron emission current is ramped slowly to avoid sudden bursts of pressure into the vacuum chamber, and the filament is constantly checked to make sure it is always protected from a harsh environment. If a problem is found in the filament operation at any time, degassing is interrupted and the filament is left without any electron emission current. The degassing process involves several steps: 1. The FIL_ERR Byte is checked to make sure it is zero. If not zero, jump to 12. 2. The filament status is memorized so it can be restored at the end of the command ( step 10). 3. The Degas_LED is turned on. 4. The FC and CDEM anode are connected to ground, and (if necessary) the CDEM is turned off. 5. The electron energy is set to 400 eV. 6. The emission current is ramped from 1 to 20 mA over a period of one minute (with the filament checked every 3 seconds) 7. The rest of the degas time is spent at full emission current and with the filament checked once every second. SRS Residual Gas Analyzer Ionizer Control Commands 6-33 If a filament check fails at any time the following steps are taken automatically: filament is turned off, Degas_LED is turned off, jump to step 12). 8. At the end of the time specified by the parameter (and if no problems were encountered) the Degas_LED is turned off. 9. Ionizer goes back to pre-Degas configuration 10. The electron emission current is reprogrammed to its pre-Degas value and background filament protection is reenabled. 11. The Filament LED is updated. 12. The STATUS byte is sent out to the host computer to indicate the DEGAS process is over. Any command recieved before degassing is over will stop the process immediately without the STATUS byte being echoed to the computer. During degassing a check for new commands is done once a second, so a time margin must be allowed once the stop command is issued for the Degas command to react to it. Some more time (a few seconds) must be provided to let the pre-degas electron emission current be reestablished at the end. Parameters: DG0: Do nothing command. Commonly used to stop degassing. Nothing is echoed over RS232. DGparam, param: 0-20: The parameter represents the degas time in minutes. The first minute is used to ramp the current up to 20 mA. DG*: The default time is used to degas. Default=3 (minutes) Error Checking: Number parameters must be within the accepted range, and must be integers. No parameter (i. e. DG) is treated as a parameter error. No queries are allowed. EEparam, param: 25 - 105, *, ? Description: Electron Energy (eV). Echo: STATUS error byte or query response. Set the Electron Impact Ionization Energy of the ionizer. The parameter represents the desired electron ionization energy in units of eV. If the filament is emitting electrons at the time the command is invoked, the repeller voltage is immediately reconfigured to provide the desired electron energy, while the ion energy and electron emission currents remain unafected. If SRS Residual Gas Analyzer 6-34 Ionizer Control Commands the filament is off, the new electron energy setting is stored in memory for the next time the filament’s emission is activated Command excecution times vary depending on the pre-existing ionizer conditions. The end of the command excecution is prompted to the host computer by sending out the STATUS byte over RS232. Note: The Electron Impact Ionization Energy is set to the default value when the unit is turned on. Important: The repeller grid and the focus plate are only biased while the filament is emitting electrons. Parameters: EEparam, param: 25-105: The parameter represents the electron impact ionization energy in eV. EE*: The default Electron Energy value is used to run the command. Default: 70 (eV) EE?: Query. The electron energy parameter setting is returned over RS232 in ASCII format. Error checking: Number parameters must be within the accepted range and must be integers. The absence of a parameter (i. e. EE) is treated as a parameter-error. FLparam, param: 0.00 - 3.50, *, ? Description: Electron emission current (mA). Echo: STATUS error byte or query response. Set the electron emission current level in the ionizer. The parameter represents the desired electron emission current in units of mA. When a finite emission current is requested, the RGA biases the ionizer’s repeller grid and focus plate, and activates the filament’s heater until the requested electron current is established. A null parameter value, turns off the filament and grounds the ionizer’s repeller grid and focus plate. Command excecution times vary depending on the pre-existing ionizer conditions. The end of the command excecution is prompted to the host computer sending out the STATUS byte over RS232. The Filament LED reflects the ionizer’s emission status at all times. SRS Residual Gas Analyzer Ionizer Control Commands 6-35 A firmware-driven “Filament Protection Mode” monitors the performance of the filament while it is emitting electrons and if a problem is detected at any time, the heater is immediately shut down and the problem is reported through the error bytes and the error LED’s (see below). WARNING: The pressure in the chamber must be under 10-4 Torr before turning the filament on! Important: x The repeller grid and the focus plate are only biased while the filament is emitting electrons. x In order to protect the filament, the emission current is defaulted to zero when the RGA is turned on. x The CDEM is turned off by any overpressure that also shuts down the filament. Parameters: FL0.00: The filament is turned off and the repeller grid and the focus plate are grounded. FLparam, param: 0.02-3.50: The parameter is the requested Electron Emission Current in units of mA. The repeller grid and the focus plate are biased, and the filament’s heater is activated until the requested electron current is achieved. FL*: The command is excecuted using the default parameter value. Default: 1.00 mA FL?: Returns over RS232 the value of Electron Emission Current (in mA) actually flowing through the ionizer. Important: The number returned by the query command will always be very close, but rarely identical, to the current value set with the FLparam command. The difference observed will never exceed +/-0.02 mA. The value returned is the actual electron current circulating through the ionizer as internally calculated by the RGA head. The discrepancy is due to the finite resolution of the digital-toanalog converters used to program the ionizer's emission current. Error Checking: The absence of a parameter (i. e. FL) is treated as a bad-parameter error. The STATUS byte is echoed to the host computer at the end of the command excecution, and it should be checked to determine whether the requested electron emission current was succesfully established. If Bit 1 of STATUS is found set, FIL_ERR should be immediately checked to identify the specific problem (See EF? command in the Error Reporting Commands list). It is good practice to attempt the command a second time before declaring a hardware problem. Once SRS Residual Gas Analyzer 6-36 Ionizer Control Commands it has been set, FIL_ERR can only be cleared after succesfully turning on the filament. IEparam, param: 0,1, *, ? Description: Ion Energy (eV). Echo: STATUS error byte or query response. Set the Ion Energy to one of two possible levels: Low (8eV) or High(12eV). The parameter represents the ion energy level: 0 for Low and 1 for High. Since the axis of the quadrupole mass filter is at ground, the ion energy (in eV) is equal to the anode grid voltage (in Volts). Important: The anode grid is always biased regardless of the ionizer’s emission status. Upon reset the grid level is set to the default value. Parameters: IE0 Low ion energy: 8 eV . IE1 High ion energy: 12 eV. IE*: The default Ion Energy parameter value is used to run the command. Default: 1 => high ion energy: 12 eV IE?: Query. The value of the anode grid parameter is returned over RS232 in ASCII format. Note that it is the parameter value and not the actual voltage level that is returned. Error checking: Number parameters can be 0 or 1 only, and must be integers. The absence of a parameter (i. e. IE ) is treated as a bad-parameter error. VFparam, param: 0 - 150, *, ? Description: Focus plate voltage (Volts) Echo: STATUS Error Byte and query response. Set the focus plate voltage in the ionizer. The parameter represents the magnitude of the biasing voltage (negative) in units of volts. The ions formed inside the anode grid are extracted into the quadrupole mass filter by the negative attractive potential of the "Focus" or Extraction Plate. The plate serves the double purpose of drawing the ions away from the anode grid, and containing the ionizing electrons inside the source. Electron leakage into the filter is only detectable at low mass settings (1 to 10 amu) and can easily be eliminated biasing the focus plate at least 30V more negative than the repeller. SRS Residual Gas Analyzer Ionizer Control Commands 6-37 Careful adjustment of the voltage results in optimum coupling of the ion beam into the QMF and maximum sensitivity. If the filament is emitting electrons at the time the command is invoked, the focus voltage is immediately reprogrammed, while the ion energy, electron energy and electron emission currents remain unaffected. If the filament is off, the new focus voltage value is stored in memory for the next time the filament’s emission is activated. Command excecution times vary depending on the pre-existing ionizer conditions. The end of the command excecution is prompted to the host computer sending out the STATUS byte over RS232. Parameters: VFparam, param: 0-150: The parameter represents the magnitude of the focus plate bias potential in Volts (The actual bias voltage is negative). The STATUS byte is transmitted at the end of command execution. VF*: The default Focus plate biasing Voltage value is used to excecute the command. Default: 90 (V). VF?: Query the focus plate biasing voltage setting. Error checking: Number parameters must be integers within the accepted range. The absence of a parameter (i. e. VF) is treated as a bad-parameter error. SRS Residual Gas Analyzer 6-38 Detection Control Commands Detection Control Commands CA Description: Calibrate All. Echo: STATUS Error Byte. Readjust the zero of the ion detector under the present detector settings, and correct the internal scan parameters against small temperature fluctuations to assure that the correct RF voltages (i.e. as specified by the last Peak Tuning procedure) are programmed on the QMF rods as a funtion of mass. In order to readjust the zero of its ion detector, the RGA measures the output of its electrometer in the absence of input ion current and under the present detector settings (i.e. noise floor and detector type). The current value obtained is stored in internal memory as an offset correction factor that is automatically used by the firmware to correct all ion currents measured (i.e. including those from single mass and total pressure measurements) under the same detector settings. Important: x Offset correction factors for all the possible combinations of detector settings can be accumulated in the RGA’s memory. x All offset correction factors are automatically cleared after a complete recalibration (CL) of the electrometer is performed, and also when the unit is turned off. x Use the CA command every time the detector settings are changed to values that have not been used in a long time or that were never used since the unit was turned on or recalibrated with the CL command. x The zero of the ion detector is also automatically readjusted at the beginning of each analog and histogram scan so that the baseline is always centered around zero. In order to correct the mass axis against peak position shifts caused by smalltemperature fluctuations, the RGA characterizes the voltage output of the RF driver’s control circuit, and recalculates its internal scan parameters to assure that the correct RF levels (i.e. as specified by the last Peak Tuning procedure) are programmed on the QMF rods as a funtion of mass. Important: Use a complete Peak Tuning Procedure to correct the mass axis calibration when large temperature fluctuations are suspected. The calibration procedure triggered by the CA command cannot correct the mass axis against large temperature drifts that affect the response of the RF Driver to its controlling voltage, or the relationship between mass and RF levels in the QMF itself (i.e. due to changes in the QMF’s physical dimensions). SRS Residual Gas Analyzer Detection Control Commands 6-39 Notes: x This mass axis correction procedure can also be triggered at any time, by itself, using the RS and RI commands with no parameters (See Tuning commands). x The correction procedure is also automatically performed at the beginning of all analog and histogram scans. However, no correction is performed at the beginning of single mass measurements since the extra checking would significantly extend the time it would take the measurement to be completed. x Please see the Peak Tuning section of the RGA Tuning chapter for more details on mass axis calibration requirements under small and large temperature fluctuations in the RGA Head. x Remember that the CA command turns off the RF/DC voltages at the end of execution. Parameters: Only one possible command format is allowed CA Error Checking: An attempt to pass any parameter with CA results in a bad-parameter error being reported. CL Description: Calibrate Electrometer’s I-V response. Echo: STATUS error byte. Perform a complete calibration of the electrometer’s I-V response. The calibration procedure calibrates the output of the electrometer against input current over its entire operating range, and stores a calibration table in the nonvolatile memory of the RGA Head. Instead of simply relying on the intrinsic logarithmic I-V behavior of the electrometer, a digital logarithmic interpolation algorithm calculates the currents from the calibration curve during measurements. The procedure takes several seconds (longer when CDEM option is installed) and its completion is signaled to the host computer by returning the STATUS byte value. Important: x The electrometer is designed for maximum long term stability, however, it is good practice to recalibrate it periodically, particularly in the presence of a large change in the operating temperature of the RGA Head. SRS Residual Gas Analyzer 6-40 Detection Control Commands x All offset correction factors previously stored in memory are cleared after a complete calibration of the electrometer is performed (see CA command for more information). Parameters: Only one possible command format is allowed CL Error Checking: An attempt to pass any parameter with CL results in a bad-parameter error being reported. HVparam, param: 0 - 2490, *, ? Description: Electron Multiplier High Voltage Bias setting. Echo: STATUS error byte or Query Response. Set a negative high voltage across the electron multiplier (CDEM), connect the CDEM signal output to the electrometer and reconfigure the electrometer and current measurement algorithms to handle negative electron currents. The parameter value represents the magnitude of the bias voltage in units of Volts. Warning: This command only works in heads with the CDEM option (Option 01) installed (See MO command.) Since the CDEM turns ion signals into amplified electron currents, the RGA head automatically reconfigures the electrometer to measure negative currents when a finite biasing voltage is selected. The current measurement algorithm is also automatically reconfigured so that the magnitude of the currents measured is transmitted over RS232. The host computer can then handle the amplified signals the same way it did with the positive ion currents (i.e. it does not need to flip the sign of the currents received). The HV_LED reflects the status of the CDEM bias at all times. Since it takes time for the CDEM and for the electrometer to settle, completion of the command is prompted to the host computer transmitting the STATUS byte value over RS232. Important: x Faraday Cup detection is the default setting upon a power-on reset of the RGA head. x The voltage set by this command is the output of the high voltage power supply. A 1MOhm resistor is placed between that output and the CDEM’s cone. CDEM's typically have an internal resistance in the order of 100-2500 MOhm, and consequently the voltage measured on the CDEM will always have a magnitude smaller than the value returned by a HV? command (i.e. the CDEM becomes part of a voltage divider in conjunction with the 1MOhm resistor). SRS Residual Gas Analyzer Detection Control Commands x 6-41 It is good practice to readjust the Zero of the ion detector every time the type of detector (FC or CDEM) is changed. This is particularly important if the new detector settings have not been used in a long time or since the unit was turned on or recalibrated with the CL command. See the CA command for details and more recommendations. Parameters: HV0: Use this parameter value to “turn off” the Electron Multiplier and enable Faraday Cup (FC) Detection. The following steps are taken: x The biasing voltage of the CDEM is set to Zero (i.e. no ion collection and no gain). x The electrometer is connected to the FC signal output and reconfigured to measure positive currents. x The firmware algorithms are reconfigured to transmit the magnitude of the positive currents measured. x The HV_LED is turned off. x The STATUS Byte is sent out to prompt the end of the command HVparam, param: 10-2490: The parameter is the magnitude of the CDEM bias voltage requested (the actual biasing voltage is negative). The following steps are taken: x The requested biasing voltage is set on the CDEM. x The electrometer is connected to the CDEM anode and reconfigured to measure negative currents. x The firmware algorithms are reconfigured to transmit the magnitude of the negative currents measured. x The HV_LED is turned on. x The STATUS Byte is sent out to prompt the end of the command HV*: The command is excecuted with the default parameter value. Default: 1400 (Volts) HV?: Returns the magnitude of the biasing voltage on the CEM. The number returned by the query command is the actual voltage available at the output of the HV driver and will always be very close but rarely identical to the one requested with the HVparam command. SRS Residual Gas Analyzer 6-42 Detection Control Commands Error Checking: The CDEM option (Option 01) must be available in the RGA head receiving the command or a bad-command error is reported (see MO command for details). Number parameters must be within the accepted range, and must be integers. No parameter (i. e. HV) is treated as a bad-parameter error. Bit3 of STATUS (transmitted at the end of the command) reports errors in the excecution of the command. CEM_ERR byte must be consulted to find out the specific problem encountered ( See EM? in Error Reporting command list). MO? Description: Electron Multiplier Option Query. Echo: Query Response. Query the electron multiplier (CDEM) option in the RGA unit being programmed. The RGA is provided standard with a Faraday Cup detector. For increased sensitivity and faster scan rates an optional CDEM is offered. The MO? command can be used to determine whether Electron Multiplier detection is an option in the RGA being programmed. Note: See also EM? command in the Error Reporting commands list for an alternative way to query the CDEM option. Parameters: Query is the only possible format: MO? The value returned over RS232 in ASCII format has two possible values: 0<LF><CR> 1<LF><CR> No CDEM option is available. CDEM option is available. Error checking: Command must have a query format or a bad parameter error is reported. NFparam, param: 0 - 7, *, ? Description: Electrometer’s Noise-floor setting. Echo: Query Response Set the rate and detection limit for ion current measurements. A decrease in the Noise-Floor setting results in cleaner baselines and lower detection limits during scans and measurements, but also means longer SRS Residual Gas Analyzer Detection Control Commands 6-43 measurement and scanning times due to the reduced bandwidth of the electrometer and increased averaging. The NF parameter must be chosen keeping in mind the strong interplay between detection limit and acquisition speed. Histogram scans, analog scans, single-mass measurements and total pressure measurements all share the same value of NF setting during measurements. Important: The NF parameter is set to its default value when the RGA is turned on. It is good practice to readjust the Zero of the ion detector every time the electometer’s noise floor setting is changed. This is particularly important if the new detector settings have not been used in a long time or since the unit was turned on or recalibrated with the CL command. See the CA command for details and more recommendations. RGA Windows note: When using the RGA Windows program to operate the RGA, the Scan Speed parameter setting available in the Scan Parameter Setups of the Scan menu is used to set the NF parameter value in the RGA Head according to the equation: NF = ScanSpeed - 1. Parameters: NFparam, param: 0-7: The parameter represents the noise-floor level desired. Lower parameter values correspond to lower baseline noise, better detection limits and increased measurement times. Please refer to the Electrometer section of the RGA Electronics Control Unit chapter to obtain detailed information about detection limits and bandwidth values as a function of NF settings. NF*: The noise-floor is set to its default value. Default value: 4. NF?: Returns the noise-floor setting currently used by the electrometer . Error checking: Number parameters must be within the specified range, and be integers. The absence of a parameter (i. e. NF) is treated as an error. SRS Residual Gas Analyzer 6-44 Scan and Measurement Commands Scan and Measurement Commands AP? Description: Analog Scan Points Query. Echo: Query Response. Query the total number of ion currents that will be measured and transmitted during an analog scan under the current scan conditions. Important: The query response does not include the extra current (4 bytes) corresponding to the total pressure measurement performed at the end of all analog scans (Please see SC command for details). The number of points (i.e. ion currents) retuned over RS232 is calculated based on the MI, MF and SA parameter values. Number of points = (MF - MI) * SA + 1. The first point corresponds to the mass MI and the other (MF-MI)*SA are from scanning to MF with SA measurements (steps) per amu. Each point transmitted represents an ion current and as such corresponds to 4 bytes being received by the host computer. The AP query is used to verify that the RGA and the host computer agree on the number of bytes that will be exchanged over RS232 during the analog scan. The total number of bytes sent out to the host computer during an analog scan is obtained multiplying by four the number returned by the AP query. Parameters: This command is a query, and can only have one parameter format: AP? Error checking: The only acceptable parameter is a question mark. The absence of a parameter (i. e. AP) is treated as an error. HP? Description: Histogram Scan Points Query. Echo: Query Response Query the number of ion currents that will be measured and transmitted during a histogram scan under the current scan conditions. Important: The query response does not include the extra current (4 bytes) corresponding to the total pressure measurement performed at the end of all histogram scans. (Please see HS command for details). SRS Residual Gas Analyzer Scan and Measurement Commands 6-45 The number of points (ion currents) retuned over RS232 is calculated based on the MI and MF parameter values. Number of points = MF - MI + 1. Each point transmitted represents an ion current and as such corresponds to 4 bytes being received by the host computer. The HP query is used to verify that the RGA and the host computer agree on the number of bytes that will be exchanged over RS232 during the histogram scan. The total number of bytes sent out to the host computer during an histogram scan is obtained multiplying by four the number returned by the HP query. Parameters: This command is a query, and can only have one parameter format: HP? Error checking: The only acceptable parameter is a question mark. The absence of a parameter (i. e. HP) is treated as a Bad-Parameter error. HSparam, param:0 - 255,* Description: Histogram Scan Trigger. Echo: Ion Currents. Excecute one or multiple Histogram Scans under the present scan conditions. The scan parameter can be set for single, multiple and continuous scanning operation. A Histogram Scan consists of as a succession of individual mass measurements (see MR command) over a pre-specified mass range. The mass range for the scan is set in advance with the commands MI (Initial Mass) and MF (Final Mass). The type of detector and noise-floor settings to be used during the scan must be selected in advance with the NF and HV commands. A current value is transmitted for each integer mass value between MI and MF for a total of (MF-MI +1) measurements (See HP command). For maximum data throughput, ion currents are represented as integers in units of 10-16 Amps, and transmitted directly in hex format (four byte integers, 2’s complement format, Least Significant Byte first). Important: x Any command received by the RGA in the middle of a scan will immediately stop the scan, halt transmission and clear the RGA’s transmit buffer. x The detector’s zero and the internal scan parameters are checked and corrected at the beginning of each scan resulting in a slight delay before the scan actually starts. SRS Residual Gas Analyzer 6-46 Scan and Measurement Commands x A Total Pressure measurement is performed at the end of each scan and transmitted out to the host computer (Please see HP and TP Commands). x The measurements are performed with the detector that is active at the time the scan is triggered. Parameters: HS: Continuous scanning mode. The RGA produces a continuous string of histogram scans. A new command must be sent to the RGA in order to stop the scanning activity. Once the command is received, the scan is immediately stopped, all transmission is halted and the transmit buffer is flushed (all remaining data is lost). The new command which stopped the scan is executed after the buffer is flushed HS0: Do nothing command. Commonly used to interrupt continuous scanning mode. HSparam, param:1-255: Multiple scans.The number of scans specified by the parameter is executed. Scanning is immediately stopped when a new command is received as in the case of continuous scanning. HS*: The default parameter value is used for multiple scan excecution. Default parameter value: 1 (single scan) Error checking: Number parameters must be within the specified range, and be integers. No query format is allowed Programming Tips: x Any command received by the RGA while scanning will immediately stop the scanning process and clear the RGA’s transmit buffer. Remember to also clear the computer’s receive buffer to reset the communications. The new command which stopped the scan is executed after the RGA Head buffer is flushed. x It is good practice to perform an analog scan before triggering a large set of histograms to assure the correct tuning (i.e. correct peak locations and widths) of the quadrupole mass spectrometer. Perform a complete Peak Tuning Procedure as described in the RGA Tuning chapter of this manual if shifts in the peak locations are observed. x The RGA has the ability to store a complete scan in its output buffer. The scan remains in memory until all the data is transmitted out to the host computer over RS232. As a result of the high acquisition rate of the RGA there might be a delay between the time at which the data is collected and the time at which a complete spectrum is displayed by the host computer. The SRS Residual Gas Analyzer Scan and Measurement Commands 6-47 time lag between data acquisition and display depends on a large number of factors including the scan rate (NF setting) of the RGA, the host computer’s processing speed, and the amount of handshaking activity over the RS232 lines. x Before a new scan starts the RGA checks its internal memory to make sure that no data from any previous scan is pending to be transmitted. If data is still pending, the RGA must finish transmitting it before the new scan can start. This process may result in a delay from the time the scan trigger is received to the time it actually starts. Using the HS1 command and waiting until the whole scan data stream is transmitted back to the host computer will minimize the problems that are associated to this feature. MFparam, param: 1 - M_MAX, *, ? Description: Final Mass (amu) of mass spectra (Analog and Histogram). Echo: Query Response Set the Final Mass value (in amu) for Analog and Histogram scans. The last ion current transmitted during an Analog or Histogram scan corresponds the mass-to-charge ratio specified by the MF parameter. Important: Note that the final mass setting is shared by both histogram and analog scans, and must be an integer number. Parameters: Three possibilities : MFparam, param: 1 - M_MAX: The parameter represents the final scan mass in amu units. The upper mass limit depends on the RGA model number: The upper mass limit depends on the SRS RGA model number: M_MAX=100 for RGA100, 200 for RGA200 and 300 for the RGA300 units. MF*: The final mass value is set to its default value. Default value: M_MAX=100 for RGA100, 200 for RGA200 and 300 for the RGA300. MF?: Query the value of final mass to be measured during scans. Error checking: Number parameters must be within the specified range, and be integers. The mass value set by MF must always be greater than or equal to the initial mass setting of MI or else a parameter-conflict communications error is generated. The absence of a parameter (i.e. MF) is treated as a bad-parameter error. MIparam, param: 1 - M_MAX, *, ? Description: Initial Mass (amu) of mass spectra (Analog and Histogram). SRS Residual Gas Analyzer 6-48 Scan and Measurement Commands Echo: Query Response. Set the Initial Mass value (in amu) for Analog and Histogram scans. The first ion current transmitted during an analog or histogram scan corresponds the mass-to-charge ratio specified by the MI parameter. Note that the initial mass setting is shared by both Histogram and Analog scans, and must be an integer number. Parameters: MIparam, param: 1-M_MAX: The parameter represents the initial scan mass in amu units. The upper mass limit depends on the SRS RGA model number: M_MAX=100 for RGA100, 200 for RGA200 and 300 for the RGA300. MI*: The initial mass value is set to its default value. Default value: 1. MI?: Returns the value of initial mass to be measured during scans. Error checking: Number parameters must be within the specified range, and be integers. The mass value set by MI must always be less than or equal to the final mass setting MF or else a parameter-conflict communications error is generated. The absence of a param (i.e. MI) generates a bad parameter error . MRparam, param:0 - M_MAX Description: Single Mass Measurement Echo: Ion Current Excecute a single ion current measurement at a specified mass setting. The parameter is the integer mass number (mass-to-charge ratio in amu units) at which the measurement is performed. The type of detector and noise-floor settings to be used by the measurement must be selected in advance with the NF and HV commands. The precision and duration of the measurement are totally determined by the NF parameter value. The scan rates and signal-to-noise ratios for the different NF settings of the electrometer are listed in a table in the Electrometer section of the “RGA Electronic Control Unit” chapter. The command execution time includes some initial time spent waiting for the Quadrupole Mass Filter and the electrometer response to settle. As usual, a compromise must be made between signal-to-noise and measurement time. SRS Residual Gas Analyzer Scan and Measurement Commands 6-49 The ion current is expressed in the usual format: 4 byte long, 2's complement integer in units of 10-16 A, with Least Significant Byte transmitted first. Important: x During a Single Mass Measurement the RGA performs a “Miniscan” around the mass requested, and the maximum current value measured is sent out over RS232. The scanning procedure, referred to as Peak-Locking, is designed to measure peak currents for individual masses in a mass spectrum without being affected by drifts in the mass-axis calibration. The Miniscan covers a 0.6 amu range centered at the mass requested, and selects the maximum current from 7 individual measurements performed at 0.1 amu mass increments. x The detector settings (i.e. type of detector and noise-floor setting) to be used during the measurement must be selected in advance with the NF and HV commands, otherwise, the measurements are performed with the detector settings at the time the scan is triggered. x The ion detector can be zeroed, prior to the measurements, performing an analog or histogram scan or using the CA command, under the same detector settings. (An offset-correction factor is calculated and stored in memory that it is then automatically used by the Miniscan procedure to correct all ion currents measured). The CA command will also update the internal scan parameters to assure that the correct RF levels (i.e. as specified by the last Peak Tuning procedure) are programmed on the RF rods as a function of mass during the Miniscan. Parameters: MR0: The RF/DC voltages are completely shut down and no measurement is performed (no ion current is transmitted back to the host computer). Use this command format at the end of a set of single mass measurements to make sure the RF/DC are completely turned off. MRparam, param:1 - M_MAX : A Miniscan is performed around the mass number selected by the parameter and the maximum ion current is sent out over RS232. The upper mass limit depends on the SRS RGA model number: M_MAX=100 for RGA100, 200 for RGA200 and 300 for the RGA300. Error Checking: The command does not accept query or default parameters. Programming tips: x Single mass measurements are commonly performed in sets where several different masses are monitored sequencially and in a merry-go-round fashion. For best accuracy of results, it is best to perform the consecutive SRS Residual Gas Analyzer 6-50 Scan and Measurement Commands mass measurements in a set with the same type of detector and at the same noise floor (NF) setting. Fixed detector settings eliminate settling time problems in the electrometer and in the CDEM’s HV power supply. x It is good practice to perform an analog scan before triggering a long set of measurements to assure the correct tuning (i.e. correct peak locations and widths) of the quadrupole mass filter. Perform a complete Peak Tuning Procedure as described in the RGA Tuning chapter of this manual if shifts in the peak locations are observed. x The RF/DC voltages are left on at the end of a single mass measurement. Use the MR0 command at the end of a set of measurements and before quitting a program to make sure the RF/DC voltages are turned off. SAparam, param: 10 - 25, *, ? Description: Steps per amu of analog scan. Echo: Query Response. Set the number of steps excecuted per amu of analog scan. The parameter specifies the number of steps-per-amu. During an analog scan the quadrupole mass filter is stepped at fixed mass increments through the mass range specified by the MI and MF commands. An ion current is measured after each step and transmitted to the host computer over RS232. SA programs the number of steps excecuted by the RGA per amu of analog scan. The fixed mass-increment corresponding to each analog scan step is equal to the inverse of the SA parameter value. Since the RGA is usually operated at unit mass resolution throughout its available mass range, the parameter value can also be interpreted as the approximate number of ion currents to be collected for each mass peak in the spectrum. Parameters: SAparam, param: 10-25: The parameter specifies the number of steps-peramu desired during analog scans. SA*: The number of points per amu value is set to its default value. Default: 10 SA?: Query. Returns the SA parameter value currently in use by the analog scans. Error checking: Number parameters must be integers and within the specified range. The absence of a parameter (i. e. SA) is treated as an error. SRS Residual Gas Analyzer Scan and Measurement Commands 6-51 SC[param], param: 0 - 255, * Description: Analog Scan Trigger. Echo: Ion Currents Excecute one or multiple analog scans under the present scan conditions. The scan parameter can be set for single, multiple and continuous scanning operation. Analog scanning is the most basic operation of the RGA as a quadrupole mass spectrometer. During analog scanning the quadrupole mass spectrometer is stepped at fixed mass increments through a pre-specified mass-range. The ion current is measured after each mass-increment step and transmitted to the host computer over RS232. The mass range for the scan is set in advance with the commands MI (Initial Mass) and MF (Final Mass) and the mass-increments are fixed with the command SA. Scan rate and detection limits are pre-programmed by the NF (Noise Floor) setting. A current value is transmitted for MI and after each mass increment through MF for a total of (MF-MI )*SA+1 measurements (See AP query command). The ion currents are represented as integers in units of 0.1 fA, and transmitted directly in Hex format ( four byte integers with 2's complement format and Least significant byte first). The type of detector and noise-floor settings to be used during the scans must be selected in advance with the NF and HV commands. Important: x Any command received by the RGA in the middle of a scan will immediately stop the scan, halt transmission and clear the RGA’s transmit buffer. x The detector’s zero and the internal scan parameters are checked and corrected at the beginning of each scan resulting in a slight delay before the scan actually starts. x A Total Pressure measurement is performed at the end of each scan and transmitted out to the host computer (Please see AP and TP Commands). x Unless otherwise specified, the measurements are performed with the detector settings that are present at the time the scan is triggered. Parameters: SC: Continuous scanning mode. The RGA produces a continuous string of analog scans. A new command must be sent to the RGA in order to stop the scanning activity. Once the command is received, the scan is immediately stopped, all transmission SRS Residual Gas Analyzer 6-52 Scan and Measurement Commands is halted and the transmit buffer is flushed (all remaining data is lost). The stopping command is executed after the scan is stopped. SC0: Commonly used to interrupt continuous scanning mode. SCparam, param: 1 - 255: Multiple scans.The number of scans specified by the parameter is executed. Scanning is immediately stopped when a new command is received as in the case of continuous scanning. SC*: The default parameter value is used for multiple scan excecution. Default parameter value: 1 (single scan) Error checking: Number parameters must be integers and within the specified range. No query format is allowed for the parameter. Programming Tips: x Any command received by the RGA while scanning will immediately stop the scan process and clear the RGA’s transmit buffer. Remember to also clear the computer’s receive buffer to reset the communications. The new command which stopped the scan will be excecuted. x The RGA has the ability to store a complete scan in its output buffer. The scan remains in memory until all the data is transmitted out to the host computer over RS232. As a result of the high acquisition rate of the RGA there might be a delay between the time at which the data is collected and the time at which a complete spectrum is displayed by the host computer. The time lag between data acquisition and display depends on a large number of factors including the scan rate (NF setting) of the RGA, the host computer’s processing speed, and the amount of handshaking activity over the RS232 lines. x Before a new scan starts the RGA checks its internal memory to make sure that no data from any previous scan is pending to be transmitted. If data is still pending, the RGA must finish transmitting it before the new scan can start. This process may result in a delay from the time the scan trigger is received to the time it actually starts. Using the SC1 command and waiting until the whole scan data stream is transmitted back to the host computer will minimize the problems that are associated to this feature. x Perform a complete Peak Tuning procedure on the RGA Head if the peaks in the spectrum do not appear at their correct mass values (See Peak Tuning section in the RGA Tuning chapter). TP?, TP0, TP1 Description: Total Pressure Measurement . Echo: Measured Ion Current. SRS Residual Gas Analyzer Scan and Measurement Commands 6-53 Perform a Total Pressure measurement or toggle the TP_Flag on/off. Total pressure measurements are automatically requested at the end of each analog and histogram scan, and can also be triggered directly by the user with the TP? command. The response of the RGA to a Total Pressure measurement request depends on the status of TP_Flag at the time the measurement is requested: TP_Flag : 1 The measurement is performed and the total ion current is transmitted. TP_Flag : 0 No actual measurement is performed but a null current is still sent out over RS232. TP_Flag is set upon a power-on reset and cleared when the CDEM is activated. It can also be toggled on/off by the user with the TP command. The total ion current measured by the elctrometer is transmitted in the standard format : Integer in units of 10-16 A, 4 Bytes long, 2's complement format, with the Least significant byte transmitted first. Notes: x While performing a total pressure measurement the RF in the quadrupole mass filter is set to 1 amu and the DC bias is zeroed. All ionic species have stable trajectories down the filter under those conditions and reach the ion current detector with different efficiencies. x TP_Flag is cleared whenever the CDEM is turned on to protect the multiplier from large ion currents. TP1 can be used to reset TP_Flag to one after making sure the total pressure is in a “safe” range for the CDEM. x The sensitivity of the RGA for total pressure measurements will usually be affected after mass axis recalibrations. Check the sensitivity calibration after any peak tuning procedure. Important: The sensitivity factor for the TP measurements is highly mass dependent. The additional mass discrimination that takes place in the filter results in the mass dependence of the RGA readings being very different from that of the Bayard Alpert gauge readings. Expect to see deviations between the two gauges as the composition of a residual gas changes. Parameters: TP0: TP_Flag is cleared. Total Pressure measurement is disallowed and a null current value is returned as a response to a total Pressure Measurement request (note that this includes the total pressure measurement requests at the end of scans!). TP1: TP_Flag is set. Total pressure measurement is fully enabled. SRS Residual Gas Analyzer 6-54 Scan and Measurement Commands TP?: Total Pressure query. A total pressure measurement is triggered and a total ion current value is returned over RS232. The actual response to the command depends on the status of TP_Flag as described above. Error Checking: The absence of a parameter is considered an error. SRS Residual Gas Analyzer Parameter Storage Commands 6-55 Parameter Storage Commands MGparam, param: 0.0000 - 2000.0000,? Description: Electron Multiplier Gain Storage. Echo: Query Response. Store a value of electron multiplier (CDEM) Gain, expressed in units of thousands, in the non-volatile memory of the RGA head. The command is typically used together with the MV instruction to store calibrated sets of [High Voltage and gain] for the Electron Multiplier. Important: The gain is not used internally by the RGA to correct the ion currents measured with the Electron Multiplier, it is simply stored so it can be read and used by any host computer connected to the instrument. As expected, this command is only available in heads with a CDEM option (Option 01) installed (See MO command for details). Parameters: MGparam, param: 0.0000-2000.0000: The parameter, interpreted as a CDEM gain in units of thousands, is stored in the non-volatile memory of the head. MG?: Electron Multiplier Gain parameter query. Error checking: The absence of a parameter (i. e. MG) is treated as an error. No default value is available. A bad-command communications error is reported when this command is invoked in a unit with no CDEM option installed (See MO command). MVparam, param: 0 - 2490,? Description: Electron Multiplier Bias Voltage Storage. Echo: Query Response Store a value of Electron Multiplier (CDEM) Bias Voltage, in units of Volts, in the non-volatile memory of the RGA head. The command is typically used together with the MG instruction to store calibrated sets of [Bias Voltage and gain] for the Electron Multiplier. Important: The voltage value is not used internally by the SRS RGA to set the bias voltage of the Electron Multiplier, it is simply stored so it can be read and used by a host computer. As expected, this command is only available in heads with a CDEM option installed (See MO command for details). SRS Residual Gas Analyzer 6-56 Parameter Storage Commands Parameters: MVparam, param: 0-2490: The parameter, interpreted as a CDEM bias voltage in units of Volts, is stored in the non-volatile memory of the head. MV?: CDEM Bias voltage query. Error checking: The absence of a parameter (i. e. MV) is treated as an error. No default value is available. A bad-command communications error is reported when this command is invoked in a unit with no CDEM option installed. SPparam, param:0.0000 - 10.0000, ? Description: Partial Pressure Sensitivity Factor storage and query. Echo: Query Response Store a value of Partial Pressure Sensitivity, expressed in units of mA/Torr, in the non-volatile memory of the SRS RGA head. Important: The sensitivity factor is not used internally by the RGA to turn ion currents into partial pressures, it is simply stored in memory so it can be read and used by any host computer connected to the instrument (See HV command.) Partial Pressure Sensitivity factors are gas specific, probe specific, and highly dependent on the ionizer and quadrupole mass filter conditions and on aging of the probe. Note: The parameter value loaded at the factory is the partial pressure sensitivity factor for N2 under default ionizer conditions. Parameters: SPparam, param:0.0000 - 10.0000: The parameter, interpreted as a partial pressure senstivity factor in units of mA/Torr, is stored in non-volatile memory of the head. . Typical value is 0.1 under default ionizer settings. SP?: Partial Pressure Sensitivity factor query. Error checking: Parameter must be within specified range. No default value is available. STparam, param:0.0000 - 100.0000, ? Description: Total Pressure Sensitivity Factor storage. Echo: Query Response Store a value of Total Pressure Sensitivity, expressed in units of mA/Torr, in the non-volatile memory of the SRS RGA head. SRS Residual Gas Analyzer Parameter Storage Commands 6-57 Important: The sensitivity factor is not used internally by the RGA to turn ion currents into total pressures, it is simply stored so it can be read and used by any host computer connected to the instrument. Total Pressure Sensitivity factors are gas specific, probe specific, and highly dependent on the ionizer conditions and on aging of the probe. Note: The parameter loaded at the factory is the total pressure sensitivity factor for N2 under default ionizer conditions. Parameters: STparam, param:0.0000 - 100.0000: The parameter, interpreted as a total pressure senstivity factor in units of mA/Torr, is stored in non-volatile memory of the head. Typical value is 0.01 under default ionizer settings. ST?: Total Pressure Sensitivity factor query. Error Checking: Parameter must be within specified range. No default value is available. SRS Residual Gas Analyzer 6-58 Mass Filter Control Commands Mass Filter Control Commands MLparam, param: 0.0000 - M_MAX Description: Mass Lock Echo: none Activate the quadrupole mass filter (QMF) and center its pass-band at the mass value specified by the parameter. The QMF is parked at the mass requested but no ion current measurements take place. The parameter is a real number and the mass increments are limited to a minimum value of 1/256 amu. The command excecution involves two steps: 1. The RF/DC levels corresponding to the mass requested are calculated and set on the QMF rods based on the mass axis calibration parameter values specified by the last Peak Tuning procedure. 2. The firmware stabilizes the voltage output of the RF Driver’s controller against temperature fluctuations. The result is very stable RF/DC levels that are highly insensitive to the operating conditions of the RGA Head. Important: The RF/DC stabilization algorithm (Step 2 above) remains active as long as no new commands are detected by the RGA Head. Once a new command is received, stabilization stops, and the new command is executed. Use the ML0 command to turn off the RF/DC bias when finished performing measurements and before quitting the program controlling the RGA. Parameters: ML0.0000: The RF/DC voltages are completely turned off. MLparam, param: 0.0040 - M_MAX: The parameter represents the mass setting for the QMF in amu units. The minimum mass increment value is 1/256 amu. The upper mass limit depends on the RGA model number: M_MAX=100 for RGA100, 200 for RGA200 and 300 for RGA300. Error checking: Parameters must be numbers within the specified range. The absence of a parameter (i.e. ML ) generates a bad parameter error . SRS Residual Gas Analyzer Error Reporting Commands 6-59 Error Reporting Commands EC? Description: RS232_ERR Byte Query Echo: RS232_ERR Byte. Query the value of the RS232_ERR byte. The value of the RS232_ERR byte is sent to the computer in ASCII format and with a <LF><CR> terminator. RS232_ERR and bit 0 of STATUS are then cleared to provide a clean error reporting slate. Important: See “Troubleshooting the RGA Communications” in the RGA Programming chapter for more details on the use of this query. Parameters: This command is a query, and can only have one parameter format: EC? Error checking: The only acceptable parameter is a question mark. The absence of a parameter (i. e. EC) is treated as a bad-parameter error. ED? Description: DET_ERR Byte Query Echo: DET_ERR Byte. Query the value of DET_ERR and update its value after running a fresh check on the Electrometer (Bit5 of STATUS and the DET_ERR byte are updated based on the tests results). The DET_ERR byte value is returned to the computer in ASCII format and with a <LF><CR> terminator. No errors are present as long as the byte value is zero. Consult the Error Byte Definitions section in this chapter for detatils on the different error bytes of the RGA. Consult the RGA Troubleshooting chapter of this manual for possible causes and solutions to any problems reported. Always try the query a second time before declaring a hardware problem. Important: The electrometer is not affected by this test, and the detector is restored to its pre-test configuration once the command excecution is over. Parameters: This command is a query, and can only have one parameter format: ED? SRS Residual Gas Analyzer 6-60 Error Reporting Commands Error checking: The only acceptable parameter is a question mark. The absence of a parameter (i. e. ED) is treated as a bad-parameter error. EF? Description: FIL_ERR Byte Query Echo: FIL_ERR Byte. Query the value of FIL_ERR. The FIL_ERR byte value is returned to the computer in ASCII format and with a <LF> terminator. FIL_ERR can only be modified by the “Filament Protection Mode” which constantly monitors the filament while it is emitting electrons. No errors are present as long as the byte value is zero. A non-zero FIL_ERR byte is only cleared after the filament’s heater succesfully (i.e. no detected errors) establishes a finite electron emission current. Consult the Error Byte Definitions section of this chapter for detatils on the different error bytes of the RGA. Consult the RGA Troubleshooting chapter of this manual for possible causes and solutions to any problems reported. Parameters: This command is a query, and can only have one parameter format: EF? Error checking: The only acceptable parameter is a question mark. The absence of a parameter (i. e. EF) is treated as a bad-parameter error. EM? Description: CEM_ERR byte Query Echo: CEM_ERR Byte. Query the value of CEM_ERR. If no electron multiplier (CDEM) is available, the absence of the CDEM is reported setting bit 7 of CEM_ERR before the byte value is transmitted. In all cases, the CEM_ERR byte value is sent to the computer in ASCII format with a <LF><CR> terminator. CEM_ERR and Bit 3 of STATUS are then cleared. This query command can be used to determine whether the CDEM option is installed in the RGA unit being programmed: A CDEM option is available if Bit 7 of CEM_ERR is cleared when the byte is queried (See also MO command). SRS Residual Gas Analyzer Error Reporting Commands 6-61 Parameters: This command is a query, and can only have one parameter format: EM? Error checking: The only acceptable parameter is a question mark. The absence of a parameter (i. e. EM) is treated as a bad-parameter error. EP? Description: PS_ERR Byte Query. Echo: PS_ERR Byte. Query the value of PS_ERR and update its value after running a fresh check on the 24V External Power Supply (Bit6 of STATUS and the PS_ERR byte are updated based on the tests results). The PS_ERR byte value is returned to the computer in ASCII format and with a <LF><CR> terminator. No errors are present as long as the byte value is zero. Consult the Error Byte Definitions section of this chapter for detatils on the different error bytes of the RGA. Consult the RGA Troubleshooting chapter of this manual for possible causes and solutions to any problems reported. Always try the query a second time before declaring a hardware problem. Parameters: This command is a query, and can only have one parameter format: EP? Error checking: The only acceptable parameter is a question mark. The absence of a parameter (i. e. EP) is treated as a bad-parameter error. EQ? Description: QMF_ERR Byte Query. Echo: QMF_ERROR Byte. Query the value of QMF_ERR and update its value after running a fresh check on the Quadrupole Mass Filter’s RF Power Supply (Bit4 of STATUS and the QMF_ERR byte are updated based on the tests results). The QMF_ERR byte value is returned to the computer in ASCII format and with a <LF><CR> terminator. No errors are present as long as the byte value is zero. Consult the Error Byte Definitions section of this chapter for detatils on the different error bytes of the RGA. Consult the RGA Troubleshooting chapter of this manual for possible causes and solutions to any problems reported. SRS Residual Gas Analyzer 6-62 Error Reporting Commands Always try the query a second time before declaring a hardware problem. Parameters: This command is a query, and can only have one parameter format: EQ? Error checking: The only acceptable parameter is a question mark. The absence of a parameter (i. e. EQ) is treated as a bad-parameter error. ER? Description: STATUS Byte Query. Echo: STATUS Byte. Query the value of the STATUS Error byte. The STATUS byte value is returned to the computer in ASCII format and with a <LF> terminator. No errors are present as long as the byte value is zero. If one or more bits of the STATUS byte are found set, the specific error bytes (PS_ERR, DET_ERR, QMF_ERR, CEM_ERR, FIL_ERR, and RS232_ERR) must be queried individually to diagnose the problem. Consult the Error Byte Definitions section of this chapter for detatils on the different error bytes of the RGA. Consult the RGA Troubleshooting chapter of this manual for possible causes and solutions to any problems reported. Important: Since internal checks are constantly being performed within the RGA Head, the STATUS Byte should be queried regularly by the programming software to detect any possible problems. Parameters: This command is a query, and can only have one parameter format: ER? Error checking: The only acceptable parameter is a question mark. The absence of a parameter (i. e. ER) is treated as a bad-parameter error. SRS Residual Gas Analyzer Tuning Commands 6-63 Tuning Commands CE? Description: Calibration Enable Query. Echo: JP100 setting. Query the Calibration Enable/Disable jumper (JP100) status. An internal jumper (JP100) on the digital (i.e. top) electronics board of the RGA’s ECU box can be configured by the end-user to enable/disable the modification of the peak tuning parameters. The CE query command returns the JP100 setting in ASCII format with a <LF><CR> terminator. The two options for the query response are: 0. JP100 jumper is in the Calibration Disabled position. Peak Tuning Parameters protected by the JP100 jumper. 1. JP100 jumper is in the Calibration Enabled position. Peak Tuning Parameters not protected by the JP100 jumper. Parameters: Only one possible command format is allowed CE? Error Checking: The only acceptable parameter is a question mark. The absence of a parameter (i. e. EC) is treated as a bad-parameter error. DIparam, param: 0 - 255, *, ? Description: DI Parameter adjust (Peak Width Tuning command). JP100 Jumper protected. Echo: Query Response. Program the value of DI during the Peak Width Tuning Procedure. The parameter (one of four peak tuning parameters) represents the DI value, in bit units. Warning: Please read the Peak Tuning Section of the RGA Tuning Chapter before using this command. The RGA Head adjusts the DC levels of the quadrupole filter during measurements so that constant mass resolution is automatically available throughout the entire mass range of the spectrometer. The bulk of the DC voltage is supplied by a DC power supply whose output is linearly related to the RF amplitude. The rest of the DC voltage (DC_Tweek) is provided by the output of an 8 bit digital-to-analog converter (DAC). The firmware uses two Peak Tuning Parameters : DI (Intercept) and DS (Slope), stored in the non-volatile memory of the RGA, to calculate the 8 bit settings of the DAC according to the linear equation: DAC8 (m) = DS . m + DI SRS Residual Gas Analyzer 6-64 Tuning Commands where m is the mass in amu, and DAC8(m) is the 8 bit setting at that mass. The purpose of the Peak Width Tuning Procedure is to determine the values of DI and DS so that all the peaks in an analog spectrum have the desired peak width (typically 1 amu). The DI command is used to program the value of the DI peak tuning parameter during the Peak Width Tuning Procedure. The value is saved in the non-volatile memory of the RGA Head and used by the firmware to generate DAC8(m) during measurements. Note to Supervisors: A calibration disable jumper (JP100) available on the circuit board can be used by a supervisor to block any attempt to modify the value of the DI parameter. Supervisors may use this feature to prevent accidental changes in the calibration parameters by inexperienced operators. Setting JP100 will disable peak tuning of the Head. Parameters: DIparam, param: 0 - 255: If Calibration is enabled by the jumper JP100 (See CE Command) the value of DI in non-volatile memory is updated and the internal scan parameters used to program the DC during scans and single mass measurements are updated accordingly. DI*: Use this format to replace the peak tuning parameter with the original factory setting for DI. The factory value is retrieved from memory, and used as the new parameter value to excecute the command as above DI?: Query. Returns over RS232 the value of DI currently stored in memory. Error checking: The absence of a parameter (i. e. DI) is treated as an error in the parameter. This parameter is protected by an internal jumper (JP100) and a Protection-Violation error will result if the jumper is in the Calibration Disable mode (See CE command). DSparam, param: -0.8500 - +0.8500, *, ? Description: DS Parameter adjust (Peak Width Tuning command). JP100 Jumper protected. Echo: Query Response. Important: RGA200 DS range: -1.2750 - +1.2750 RGA100 DS range: -2.5500 - +2.5500 Program the value of DS during the Peak Width Tuning Procedure. The parameter (one of four peak tuning parameters) represents the DS value, in units of bits/amu. Warning: Please read the Peak Tuning Section of the RGA Tuning Chapter before using this command. SRS Residual Gas Analyzer Tuning Commands 6-65 The RGA Head adjusts the DC levels of the quadrupole filter during measurements so that constant mass resolution is automatically available throughout the entire mass range of the spectrometer. The bulk of the DC voltage is supplied by a DC power supply whose output is linearly related to the RF amplitude. The rest of the DC voltage (DC_Tweek) is provided by the output of an 8 bit digital-to-analog converter (DAC). The firmware uses two Peak Tuning Parameters : DI (Intercept) and DS (Slope), stored in the non-volatile memory of the RGA, to calculate the 8 bit settings of the DAC according to the linear equation: DAC8 (m) = DS . m + DI where m is the mass in amu, and DAC8(m) is the 8 bit setting at that mass. The purpose of the Peak Width Tuning Procedure is to determine the values of DI and DS so that all the peaks in an analog spectrum have the desired peak width (typically 1 amu). The DS command is used to program the value of the DS peak tuning parameter during the Peak Width Tuning Procedure. The value is saved in the non-volatile memory of the RGA Head and used by the firmware to generate DAC8(m) during measurements. Note to Supervisors: A calibration disable jumper (JP100) available on the circuit board can be used by a supervisor to block any attempt to modify the value of the DI parameter. Supervisors may use this feature to prevent accidental changes in the calibration parameters by inexperienced operators. Setting JP100 will disable peak tuning of the Head. Parameters: DSparam, param: -0.8500 - +0.8500: If Calibration is enabled by the jumper JP100 (See CE Command) the value of DS in non-volatile memory is updated and the internal scan parameters used to program the DC during scans and single mass measurements are updated accordingly. RGA100 DS range: -2.5500 - +2.5500 DS*: Use this format to replace the peak tuning parameter with the original factory setting for DS. The factory value is retrieved from memory, and used as the new parameter value to excecute the command as above. DS?: Query. Returns over RS232 the parameter value currently saved in memory. Error checking: The absence of a parameter (i. e. DS) is treated as an error in the parameter. This parameter is protected by an internal jumper (JP100) and a Protection-Violation error will result if the jumper is in the Calibration Disabled mode (See CE command). RIparam, param: -86.0000 - +86.0000, *, ?, none Description: RF_Driver output @ 0 amu (Peak Position Tuning command). JP100 Jumper protected. Echo: Query Response. SRS Residual Gas Analyzer 6-66 Tuning Commands Warning: Please read the Peak Tuning Section of the RGA Tuning Chapter before using this command. Program the output of the RF_Driver @ 0 amu during a Peak Posion Tuning Procedure. The parameter (one of four peak tuning parameters) represents the voltage output selected for the RF_Driver @ 0 amu, in mV. The magnitude of the RF determines the mass-to-charge ratio of the ions that can pass through a quadrupole mass filter without striking the rods (i.e with stable oscillations). A linear relationship between mass and RF amplitude is one of the most attractive features of these type of filters. The regulated output of the RF source that powers the RGA’s quadrupole rods is controlled by, and linearly related to, the voltage output of an RF_Driver circuit. A linear relation exists between the output of the RF_Driver, the RF amplitude on the rods, and the mass setting of the filter. The purpose of a Peak Position Tuning Procedure is to determine the voltages that the RF Driver must output at 0 and 128 amu so that all the peaks in an analog spectrum appear in the right position. The RI command is used to program the voltage output of the RF_Driver @ 0 amu during the Peak Position Tuning Procedure. The value is saved in the non-volatile memory of the RGA Head and used by the firmware to generate the internal scan parameters used to step the RF during scans and single mass measurements . Note to Supervisors: A calibration disable jumper (JP100) available on the circuit board can be used by a supervisor to block any attempt to modify the value of the DI parameter. Supervisors may use this feature to prevent accidental changes in the calibration parameters by inexperienced operators. Setting JP100 will disable peak tuning of the Head. Parameters: RIparam, param: -86.0000 - +86.0000: If Calibration is enabled by the JP100 jumper (See CE Command), the parameter is saved into the non-volatile memory of the RGA Head and the internal scan parameters used to step the RF during scans and single mass measurements are updated accordingly. RI*: Use this format to replace the peak tuning parameter with the original factory setting for the RF_Driver output @ 0 amu. The factory value is retrieved from memory, and used as the new parameter value to excecute the command as above. RI?: Query. Returns over RS232 the parameter value currently saved in memory. RI: Uses the current parameter value to recalculate the internal scan parameters used to step the RF during scans and single mass measurements. This is often used to compensate against small temperature drifts in the mass scale, caused by drifts in the output of the RF_Driver. Error checking: The absence of a parameter (i. e. RI) is treated as an error in the parameter. SRS Residual Gas Analyzer Tuning Commands 6-67 This parameter is protected by an internal calibration jumper (JP100) and a Protectionviolation error will result if the jumper is in the Calibration Disabled mode (see CE command). RSparam, param: 600.0000 - 1600.0000, *, ?, none Description: RF_Driver output @ 128 amu (Peak Position Tuning command). JP100 Jumper protected. Echo: Query Response. Warning: Please read the Peak Tuning Section of the RGA Tuning Chapter before using this command. Program the output of the RF_Driver @ 128 amu during a Peak Posion Tuning Procedure. The parameter (one of four peak tuning parameters) represents the voltage output selected for the RF_Driver @ 128 amu, in mV. The magnitude of the RF determines the mass-to-charge ratio of the ions that can pass through a quadrupole mass filter without striking the rods (i.e with stable oscillations). A linear relationship between mass and RF amplitude is one of the most attractive features of these type of filters. The regulated output of the RF source that powers the RGA’s quadrupole rods is controlled by, and linearly related to, the voltage output of an RF_Driver circuit. Clearly, a linear relation exists between the output of the RF_Driver, the RF amplitude on the rods, and the mass setting of the filter. The purpose of a Peak Position Tuning Procedure is to determine the voltages that the RF Driver must output at 0 and 128 amu so that all the peaks in an analog spectrum appear in the right position. The RS command is used to program the voltage output of the RF_Driver @ 128 amu during the Peak Position Tuning Procedure. The value is saved in the non-volatile memory of the RGA Head and used by the firmware to generate the internal scan parameters used to step the RF during scans and single mass measurements . Note to Supervisors: A calibration disable jumper (JP100) available on the circuit board can be used by a supervisor to block any attempt to modify the value of the DI parameter. Supervisors may use this feature to prevent accidental changes in the calibration parameters by inexperienced operators. Setting JP100 will disable peak tuning of the Head. Parameters: RSparam, param: 600.0000 - 1600.0000: If Calibration is enabled by the JP100 jumper (See CE Command), the parameter is saved into the non-volatile memory of the RGA Head and the internal scan parameters used to step the RF during scans and single mass measurements are updated accordingly. RS*: Use this format to replace the peak tuning parameter with the original factory setting for the RF_Driver output @ 128 amu. The factory value is retrieved from memory, and used as the new parameter value to excecute the command as above. RS?: Query. Returns over RS232 the parameter value currently saved in memory. SRS Residual Gas Analyzer 6-68 Tuning Commands RS: Uses the current parameter value to recalculate the internal scan parameters used to step the RF during scans and single mass measurements. This is often used to compensate against small temperature drifts in the mass scale, caused by drifts in the output of the RF_Driver. Error checking: The absence of a parameter (i. e. RS) is treated as an error in the parameter. This parameter is protected by an internal calibration jumper (JP100) and a Protectionviolation error will result if the jumper is in the Calibration Disabled mode (see CE command). SRS Residual Gas Analyzer Error Byte Definitions 6-69 Error Byte Definitions The Error Bytes described in this section store the results of the firmware-driven checks built into the RGA Head. Use the Error Reporting commands to query the value of the bytes. Important: No errors are present as long as all bits in the Error Bytes are cleared. The RGA Windows software supports all the Error Reporting commands and reports the errors detected based on their Error Codes. The RGA Troubleshooting chapter identifies the different problems based on their Error Codes and suggests possible causes and solutions. Internal Check(a) ERROR Byte Query (d) 7 not used N.A. N.A. 6 24V External P/S(b) PS_ERR EP? 5 Electrometer(b) DET_ERR ED? 4 Quadrupole Mass Filter(b) QMF_ERR EQ? 3 Electron Multiplier CEM_ERR EM? 2 not used N.A. N.A. 1 Filament FIL_ERR EF? 0 Communications RS232_ERR EC? Bit (c) (a) RGA component checked. Each check involves several tests on the component. (b) Checks automatically performed upon a power-on-reset (c) Error bytes that store the results of the tests for each type of internal check. (d) Error Reporting command that queries the error byte. STATUS Error Byte: General Status byte. Each bit corresponds to a different type of internal check. SRS Residual Gas Analyzer 6-70 Error Byte Definitions Bit Description Error Code 7 External 24V P/S error: Voltage >26V. PS7 6 External 24V P/S error: Voltage <22V. PS6 5 Not used 4 Not Used 3 Not Used 2 Not Used 1 Not Used 0 Not Used PS_ERR Error Byte: 24V P/S Error Byte. Bit Description Error Code 7 ADC16 Test failure. DET7 6 DETECT fails to read +5nA input current DET6 5 DETECT fails to read -5 nA input current DET5 4 COMPENSATE fails to read +5nA input current DET4 3 COMPENSATE fails to read -5nA input current DET3 2 Not Used 1 OP-AMP Input Offset Voltage out of range 0 Not Used DET1 DET_ERR Error Byte: Electrometer Error Byte. SRS Residual Gas Analyzer Error Byte Definitions Bit Description Error Code 7 RF_CT exceeds (V_EXT- 2V) at M_MAX RF7 6 Primary current exceeds 2.0A RF6 5 Not used 4 Power supply in current limited mode. 3 Not Used 2 Not Used 1 Not Used 0 Not Used 6-71 RF4 QMF_ERR Error Byte: Quadrupole Mass Filter RF P/S Error Byte. Bit Description Error Code 7 No Electron Multiplier Option installed EM7. 6 Not Used 5 Not Used 4 Not Used 3 Not Used 2 Not Used 1 Not Used 0 Not Used CEM_ERR Error Byte: Electron Multiplier Error Byte. SRS Residual Gas Analyzer 6-72 Error Byte Definitions Bit Description Error Code 7 No filament detected. FL7 6 Unable to set the requested emission current. FL6 5 Vacuum Chamber pressure too high. FL5 4 Not used 3 Not used 2 Not used 1 Not used 0 Single filament operation. FIL_ERR Error Byte: Filament Error Byte. Bit Description 7 Not used 6 Parameter conflict 5 Jumper protection violation 4 Transmit buffer overwrite 3 OVERWRITE in receiving 2 Command-too-long. 1 Bad Parameter received 0 Bad command received RS232_ERR Error Byte: Communications Error Byte SRS Residual Gas Analyzer FL0 7-1 Chapter 7 RGA Tuning This chapter describes the tuning procedures needed to calibrate the RGA head and assure accurate qualitative and quantitative measurements. WARNING! The Tuning procedures described in this chapter should be performed by qualified personnel only. A mistuned RGA Head could give Erroneous Readings until it is retuned properly. In This Chapter Introduction ............................................................................................................................................. 7-2 Tuning Options ....................................................................................................................................... 7-3 Peak Tuning Procedure.......................................................................................................................... 7-4 Introduction ................................................................................................................................. 7-4 General Procedure...................................................................................................................... 7-5 Peak Position Tuning Algorithms ............................................................................................. 7-6 Peak Width Tuning Algorithms: ................................................................................................ 7-8 Temperature effects on the mass scale calibration:............................................................... 7-9 Sensitivity Tuning Procedure .............................................................................................................. 7-11 Electron Multiplier Tuning Procedure................................................................................................. 7-14 SRS Residual Gas Analyzer 7-2 Introduction Introduction Accurate qualitative and quantitative partial pressure measurements can only be assured by proper tuning of the RGA Head. Correct calibration of the mass scale is essential during qualitative analysis for the correct assignment of mass numbers to the different peaks. The mass resolution of the quadrupole mass filter, 'm10%, must be kept at or under 1 amu to avoid severe overlap between adjacent peaks. Changes in 'm10% during the measurements (caused by aging, severe contamination and large temperature changes) will cause variations in the sensitivity of the instrument and the shapes of the fragmentation patterns of the molecules, seriously affecting all quantitative measurements. For careful quantitative analysis, it is important that the sensitivity of the RGA be determined for every gas which may be a component of the system and under the same operating parameters used during the actual measurements. Sensitivity factors change as a factor of time due to aging and periodic recalibration is necessary. The gain of the electron multiplier is mass dependent and needs to be determined prior to performing measurements with the device. The gain characteristics of the multiplier change with time and periodic recalibrations are very important. The following sections of this chapter describe several tuning procedures designed to assure that all the calibration conditions described above are satisfied prior to a set of partial pressure measurements. All tuning procedures can be executed from RGA Windows using a set of Tuning Commands built into the program. The RGA On-line Help files provide all the information necessary to set up and execute the tuning commands. Users writing their own programs can implement the procedures themselves, using the RGA Command Set and the instructions of this chapter. All the tuning procedures require the ability to introduce pure gases (or a mixture of gases of known composition) into the vacuum system, and a way to measure or calculate pressures. Bayard-Albert gauges are often used to measure the pressure of the calibration gases. Hot cathode gauge displays are usually calibrated for a single gas (N2 or Ar) and a table of conversion factors will be needed to convert the readings for other gases. When only a few choices of calibration gases are available choose those that are most likely to be encountered during measurements (i.e. usual major components of the residual gas environment of the chamber) and try to sample as much of the RGA’s mass range as possible. Obviously, the correct gases will be needed for sensitivity factor and fragmentation factor determinations. Important: Tuning should only be attempted after the unit has been warmed up (with the filament on and under typical operating conditions) for at least one complete hour. SRS Residual Gas Analyzer Tuning Options 7-3 Tuning Options The different tuning procedures, including the corresponding RGA Windows commands, are listed in the following table: Tuning Procedure Peak Tuning RGA Windows Cmd. (a) Peak Tuning Sensitivity Tuning Sensitivity Tuning Electron Multiplier Tuning Channel Electron Multiplier Options Peak Position Peak Width Partial Pressure Total Pressure Gain adjustment (a) Head menu command options. Consult the RGA Windows chapter of this manual and the RGA On-line Help files included in the program disks for information on the execution of the Tuning Commands built into the program. SRS Residual Gas Analyzer 7-4 Peak Tuning Procedure Peak Tuning Procedure Introduction When analyzing a sample, you expect the peaks of the different gases to be displayed at their correct mass-to-charge ratio values and the peak widths to be less or equal than 1 amu at 10% of peak height. The correct location of the peaks is essential for accurate qualitative analysis, and unity resolution ('m10%=1 amu) minimizes the overlap between adjacent peaks. Both the calibration of the mass scale and the widths of the peaks can vary with time due to aging of the head. Changes in resolution are particularly serious since they affect the sensitivity of the RGA and introduce errors in the partial pressure measurements. The Peak Tuning procedures described in this section allow the user to calibrate the mass scale and the resolution, 'm10%, of the mass spectrometer. The SRS RGA has a very solid design and this type of tuning procedures should rarely be needed. WARNINGS The peak tuning procedures should be performed by qualified personnel only. A mistuned RGA Head will give Erroneous Readings until it is retuned properly. Peak Tuning should only be attempted after the unit has been warmed up (with the filament on and under typical operating conditions) for at least a one hour. Peak Tuning requires a mixture of gases whose mass spectra is well known. In general, a two gas mixture, one with low mass peaks and one with high mass peaks, is sufficient. The sample is introduced into the vacuum, and the quadrupole mass filter parameters, referred to as Peak Tuning parameters, are adjusted based on the sample analog spectra. The mass scale is adjusted so that all peaks are displayed at their correct mass-to-charge values, and the peak widths,'m10%, are adjusted to unity (or smaller) values. The two tuning procedures are referred to as Peak Position and Peak Width Tuning, respectively. Note: A mixture of He, Ar, Kr and Xe inert gases is used at SRS to Peak Tune the RGA’s. The resolution is adjusted to 1 amu and peak tuning parameters are saved into the RGA Head before shipping. The inert gases cover a broad spectral range, and being inert they do not interact with the RGA probe and do not contribute to its aging. Peak tuning can be easily performed with RGA Windows using the Peak Tuning command of the Head Menu. The program provides password protection for locking out the Peak Tuning Parameters so that casual users cannot alter the mass scale calibration or the spectrometer’s resolution. An extra copy of the tuning parameters determined at the factory for the mass filter is saved in the RGA Head before shipping, and those values can be retrieved at any time in case they are necessary. Consult the RGA Windows chapter of this manual or the RGA SRS Residual Gas Analyzer Peak Tuning Procedure 7-5 On-line Help Files included with the program for details. Note to Supervisors: A calibration disable jumper (JP100) can be configured to block any attempt to change the value of the mass filter settings in the RGA Head. The jumper is located on the top electronics board of the ECU box, next to the microprocessor chip (i.e. biggest component on the board), and its two settings are clearly indicated as CAL DIS and CAL EN. Supervisors may use this feature to prevent accidental changes in the calibration parameters by inexperienced operators. Peak tuning is completely disabled when the jumper is configured to the CAL DIS setting. Tip: Virtually every vacuum system will have detectable amounts of hydrogen (2 amu), water (18 amu), carbon monoxide (28 amu) and carbon dioxide (44 amu). Become familiar with these species and their fragmentation patterns, and use their peaks to quickly verify the correct performance of the instrument (i.e. mass scale calibration and mass resolution) while operating the RGA. General Procedure Peak tuning is a simple procedure that requires the introduction of two known gases into the vacuum system. A low mass gas (1-20 amu recommended) is used to adjust the low end of the mass axis, a high mass gas, with a mass-to-charge ratio close to the upper limit of the instrument’s mass range, is used to adjust the high end of the mass scale. Several analog scans are performed on the sample and the peak positions and widths are checked and adjusted as necessary. Changes in resolution affect the sensitivity of the RGA, and a Sensistivity tuning procedure should always be performed at the end of the peak tuning process. The entire procedure can be carried out with the help of the Peak Tuning command (Head Menu) of RGA Windows. The program guides you through the calibration procedure and automatically updates the Peak Tuning Parameters in the RGA Head based on the results of the calibration. The overall adjustment procedure is very simple and must follow the order described below: 1. Low mass peak position adjustment 2. High mass peak position adjustment 3. Repeat 1 & 2 in that order one or two more times until no more changes in peak positions are observed. 4. Low mass resolution adjustment 5. High mass resolution adjustment 6. Repeat 4 &5 in that order until no more changes in peak width are observed. 7. Repeat 1 & 2 in that order one or two more times in the case steps 4 & 5 caused changes in peak positions. Important: Collect a fresh analog scan for each step. The peak positions are adjusted such that all peaks throughout the scanning range of the RGA fall within +/- 0.25 amu of SRS Residual Gas Analyzer 7-6 Peak Tuning Procedure their known mass-to-charge ratio (This is needed to make sure the Peak-locking algorithm used for single mass measurements always finds the mass peak within its search window). The peak width, 'm10%, must be a constant, and less than 1 amu throughout the whole scan range. Example: The following figure shows the result of peak tuning the RGA based on the H2O+ (low mass= 18 amu) and 86Kr+ (high mass=86 amu) calibration peaks. All peaks are at their correct mass settings and show absolute resolution values of about 0.9 amu amu. Also note a 20 amu peak in the low mass spectrum corresponding to 40Ar++ at 20 (i.e. 40/2) amu. 18 Low Mass High Mass 1 Ar 0.9 ++ 0.8 0.5 0.8 0.7 0.7 0.6 0.9 0.6 H20 + 0.5 0.4 0.4 86 Kr + 0.3 0.3 0.2 0.2 0.1 0.1 0 0 15 16 17 18 19 20 21 22 23 24 25 amu/e 80 81 82 83 84 85 86 87 88 89 90 amu/e Users writing their own computer code can write Peak Tuning Commands for their own programs using the Tuning Commands of the RGA Command Set and the instructions of the following two sections. Peak Position Tuning Algorithms The magnitude of the RF determines the mass-to-charge ratio of the ions that can pass through a quadrupole mass filter without striking the rods (i.e. with stable oscillations). A linear relationship between mass and RF amplitude is one of the most attractive features of these type of filters. The regulated output of the RF source that powers the RGA’s quadruple rods is controlled by, and linearly related to, the voltage output of an RF Driver circuit. The RF Driver uses an 18 bit digital-to-analog converter and some additional electronics to program its output voltages. The purpose of the Peak Position Tuning Procedure is to determine the voltages that the RF Driver must output at 0 and 128 amu so that all the peaks in an analog spectrum appear in the right place in the mass axis. The calibrated voltage settings, in mV, are saved in the non-volatile memory of the RGA Head (RI and RS commands respectively) and used by the firmware to generate the internal scan parameters used to step the RF during scans and single mass measurements. SRS Residual Gas Analyzer Peak Tuning Procedure 7-7 Please consult the Tuning Commands List in the RGA Programming chapter of this manual for details on the RS and RI commands. As described above, the peak position tuning procedure requires the introduction of two known gases into the vacuum system. A low mass gas (1-20 amu recommended) is used to adjust the low mass end of the mass axis, a high mass gas, with a mass-to-charge ratio close to the upper limit of the scanning range of the RGA, is used to adjust the high mass end of the mass scale. Several analog scans are performed, and the values of RI (RF Driver output @ 0 amu) and RS (RF Driver output @ 128 amu) are adjusted until all mass peaks appear at the correct position in the mass scale. An increase in RI causes the low end of the analog spectrum to displace towards lower masses (A small effect is seen at the high masses). An increase in RS results in the spacing between peaks in a scan to decrease (with the largest effect seen at the high mass end). The formulae used to correct the calibration parameters during peak position adjustment are presented next: Low Mass Peak Position Adjustment: To displace a low mass peak by a distance 'm amu in the mass axis the value of RI must be modified from its original value RI0 according to: RI = RI0 - 'm . (RS / 128) Notes: x The new RI value must fall within the acceptable parameter range of the RI command. x This change mostly affects the position of the peaks at the low end of the spectrum. x A decrease in RI shifts the low mass peaks to the right (peaks show up at higher masses) , an increase in RI shifts the same peaks to the left (peaks show up at lower masses). High Mass Peak Position Adjustment: To displace a high mass peak, m0, by a distance 'm amu in the mass axis modify the value of RS from its original value RS0 to: RS = RS0 . [ m0/(m0+'m)] Notes: x The new RS value must fall within the acceptable parameter range of the RS command. x Modifying RS affects the spacing between peaks in the spectrum. An increase in RS results in the peaks getting closer together, and a decrease in RS results in the peaks getting further apart from each other. x The effect is more significant at the higher masses and should have very little effect on the position of the low mass peaks (that is why you do this adjustment second). x The lower the mass-to-charge ratio of the low mass gas the less this adjustment will effect the position of its peak. x See that a decrease in RS results in the high mass peaks moving to higher masses (right shift), and vice versa. SRS Residual Gas Analyzer 7-8 Peak Tuning Procedure Iterations: In most cases it will be necessary to repeat the two position adjustments one or two more times until both low and high mass peaks show up at their known positions. Peak Width Tuning Algorithms: Constant absolute resolution ('m10%) in a quadrupole mass filter requires DC voltages linearly related to the mass, with a slight negative offset at low masses (i.e. negative intercept). The RGA Head adjusts the DC levels of the quadrupole filter during measurements so that constant mass resolution is automatically available throughout the entire mass range of the spectrometer. The bulk of the DC voltage is supplied by a DC power supply whose output is linearly related to the RF amplitude. The rest of the DC voltage (DC_Tweek) is provided by the output of an 8 bit digital-to-analog converter (DAC). The firmware uses two Peak Tuning Parameters : DI (Intercept) and DS (Slope), stored in the non-volatile memory of the RGA, to calculate the 8 bit settings of the DAC according to the linear equation: DAC8 (m) = DS . m + DI (DC_Tweek (m) = (DAC8(m) - 128) . 19.6 mV) where m is the mass in amu, and DAC8(m) is the 8 bit setting at that mass. The purpose of the Peak Width Tuning Procedure is to determine the values of DI and DS so that all the peaks in an analog spectrum have the desired peak width (typically 'm10%=1 amu). The calibrated parameters are saved in the non-volatile memory of the RGA Head (DI and DS commands, respectively) and used by the firmware to generate the internal scan parameters used to adjust DC_Tweek during scans and single mass measurements. Please consult the Tuning Commands List in the RGA Programming chapter of this manual for details on the DS and DI commands. Note: The sensitivity of the peak widths to the DC_TWEEK voltage can accurately be approximated to: -1 amu per 550mV (28 bits). In other words, a 550 mV increase in DC_Tweek voltage causes a 1 amu decrease in the width of any peak. The DC_Tweek voltages span from -2.5 to +2.5 V with increments of 19.6 mV per bit (255 total bits). This corresponds to a peak width adjustment range of +/- 4.5 amu and minimum increments of 0.036 amu per bit. As described above, the peak width tuning procedure requires the introduction of two known gases into the vacuum system. A low mass gas (1-20 amu recommended) is used to adjust peak widths at the low end of the mass scale, a high mass gas, with a mass-tocharge ratio close to the upper limit of the scanning range of the RGA, is used to adjust the widths at the high end of the mass scale. Several analog scans are performed on the sample and the values of DI ( nominally 128) and DS (nominally 0) are adjusted until all peaks appear at their correct setting. The formulae used to correct the calibration parameters during peak position adjustment are described next: Low Mass Peak Width Adjustment: To increase the low mass peak width by an amount 'm amus modify the value of DI from its original value, DI0 , to: SRS Residual Gas Analyzer Peak Tuning Procedure 7-9 DI = DI0 - 'm * 28 Notes: x The new DI value must fall within the acceptable parameter range of the DI command. x A change in DI affects the width of all the peaks in the spectrum. x A decrease in DI results in broader peaks at a rate of 0.036 amu per bit removed. High Mass Peak Width Adjustment: To modify the high mass peak width by an amount 'm amus, modify the value of DS from its original value DS0 to: DS = DS0 - 28 * ('m) / m0 Notes: x The new DS value must fall within the acceptable parameter range of the DS command. x Modifying DS affects the width of peaks at the higher end of the spectrum. An increase in DS results in the peaks getting sharper, and a decrease in DS results in the peaks getting broader x The effect is more significant at the higher masses and that is why we do this adjustment second after the width has already been modified by the change in DI. x If the mass-to-charge ratio of the low mass gas is real low this adjustment will have a small effect on the width of its peak. Iterations: In most cases it will be necessary to repeat the two width adjustments one or two more times until both low and high mass peaks show the desired widths. Note: Changes in the peak positions will also be observed, at a rate of -0.40 amu per amu of increase in peak width, and a Peak Position Tuning procedure will be needed to put the peak positions back where they belong. Important: The Peak Width Tuning Procedure can be used to adjust the resolution of the RGA to the ultimate theoretical limit of the mass filter. See the Quadrupole Mass Filter section of the RGA Probe chapter of this manual for details on that limit. Temperature effects on the mass scale calibration: As the temperature of the RGA Head changes two different effects affect the calibration of the mass scale: x For small temperature changes: Drift in the voltage output of the RF Driver that controls the RF power supply can cause the mass peaks to shift their position in the mass spectrum. In order to correct against this effect, the RF driver output is checked at the beginning of each analog and histogram scan at 0 and 128 amu. The internal calibration parameters, used by the firmware to step the RF during scans, are updated so that the control levels specified by the RI (0 amu) and RS (128 amu) parameter values are correctly set at the present temperature. SRS Residual Gas Analyzer 7-10 Peak Tuning Procedure x For large temperature changes: The sensitivity of the RF power supply to its controlling voltages might be affected or, more fundamentally, the relationship between mass and RF levels in the filter might change ( for example, if the QMF changes its physical dimensions). In this case a Peak Tuning procedure will be necessary to reestablish the mass axis scale. SRS Residual Gas Analyzer Sensitivity Tuning Procedure 7-11 Sensitivity Tuning Procedure All quantitative calculations performed with the SRS RGA rely on the assumption that there is a linear relation between the partial pressure and the corresponding RGA signals of the gases. Each gas ionizes differently, and its ions make it through the mass filter with different efficiencies. As a result the proportionality constant relating the ion current of a gas to its partial pressure is very dependent on the specific gas. The partial pressure sensitivity of the RGA to a gas g, Sg, is defined as the ratio of the change (H-H0) in principal mass peak height to the corresponding change (P-P0) in total pressure due to a change in partial pressure of the particular gas species. H0 and P0 are background values. Sg = (H-H0) / (P-P0) The units of Sg are of ion current per unit pressure (amp/Torr, for example). The sensitivity of the RGA changes with time due to aging of the head, and is a strong function of the operating conditions of the instrument. Careful quantitative analysis requires that the sensitivity factor, Sg, be determined for every gas which may be a component gas in the system being analyzed. The sensitivity factors must be obtained under the same operating conditions that will be used during general partial pressure analysis since they depend on many instrumental parameters, including: ionization energy, emission current, mass filter setting, type of detector, etc. Important: In order to separate the gain of the electron multiplier from the intrinsic sensitivity of the RGA head, the sensitivity factors of the SRS RGA are defined for Faraday Cup detection. A separate Electron Multiplier Gain Factor, is used to correct the ion signals when the electron multiplier is used. See the Electron Multiplier Tuning section for details. The partial pressure sensitivity of the RGA to a particular gas is determined following the steps listed below. 1. Refresh the calibration of the electrometer using the Calibrate Detector command (Head Menu) of the RGA Windows program or the CL command of the RGA command set. 2. Start with the vacuum system at base pressure (preferably under 10-7 Torr). 3. Select Faraday cup detection and choose the desired operational parameters for the instrument (See note at the end). 4. Perform a few analog scans on the chamber to assure that the contributions from all other gases to your measurements can be neglected. Check the quality of the analog spectra, and peak tune the instrument if needed. 5. Introduce the pure gas into the vacuum system, at a known or calculable pressure (typically around 10-6 Torr). SRS Residual Gas Analyzer 7-12 Sensitivity Tuning Procedure 6. Run a few analog or histogram scans on the sample gas to assure the purity and levels of the calibration gas. 7. Measure the output signal from the RGA for the principal mass peak of the calibration gas (i.e. usually the parent molecule peak) using the Faraday cup detector. Extract the peak value from spectral scans or measure it directly using the single mass measurement mode of the SRS RGA 8. The ratio of this output signal to the pressure of the gas is the partial pressure sensitivity factor. 9. The sensitivity factor, in units of mA/Torr, can be saved into the non-volatile memory of the RGA Head using the SP command. The parameter value saved is automatically used by RGA Windows as a conversion factor between the ion currents received form the head and the partial pressure units selected by the user. See the RGA Command Set listing for details. Important: The sensitivity factors calculated in this fashion can only be applied to situations where the RGA is used with the same operating parameters. Change the instrument parameter settings to those of your measurements prior to the calibration if necessary. A total pressure sensitivity factor is also needed by the SRS RGA to convert the ion currents obtained during total pressure measurements into total pressures. Total pressure sensitivity factors vary with different gases and share many of the properties of the partial pressure factors. They are determined by a procedure identical to the one described above, but with the partial pressure measurements replaced by total pressure measurements. The total pressure sensitivity factor, in units of mA/Torr, can be saved into the non-volatile memory of the RGA Head using the ST command. The parameter value saved is automatically used by RGA Windows as a conversion factor between the total ion currents received form the head and the pressure units selected by the user. See the RGA Command Set listing for details. Note: The underlying assumption when using sensitivity factors in quantitative calculations is that there is a linear relation between the pressure and the corresponding RGA signals of the gases. This assumption is only strictly correct as long as the pressures in the RGA Head are kept below 10-5 Torr. Deviations from linearity are to be expected above that pressure value due to space charge effects in the ionizer and ion-neutral scattering interactions in the filter. A more thorough check of the RGA’s sensitivity involves measuring the RGA signals over several orders of magnitude of partial pressure to determine the range over which a linear relationship exists. The sensitivity factor for the gas is calculated as the slope of the “signal vs. pressure” response over the linear range. RGA Windows uses the partial pressure and total pressure sensitivity factors stored in the non-volatile memory of the RGA Head as conversion factors between the ion currents received from the head and the pressure units selected by the user. A Sensitivity Tuning command in the Head menu automates the sensitivity tuning procedure described above and allows the user to recalibrate or change the sensitivity factors very easily. Consult the RGA Windows Chapter of this manual and the On-line Help Files for details on the tuning commands of the program. SRS Residual Gas Analyzer Sensitivity Tuning Procedure 7-13 The sensitivity factors used by SRS RGA are all for Faraday Cup detection. A separate Electron Multiplier Gain Factor, stored in the non-volatile memory of the RGA Head, is used by the RGA Windows program to correct the ion signals when the electron multiplier is turned on (i.e. all data acquired while the electron multiplier is on gets divided by the gain automatically before it is displayed by the program). See the Electron Multiplier Tuning section of this chapter for details. SRS Residual Gas Analyzer 7-14 Electron Multiplier Tuning Procedure Electron Multiplier Tuning Procedure Accurate quantitative measurements with the electron multiplier detector require the determination of the CDEM gain for all the ion peaks being measured. Frequent recalibrations are recommended to correct against aging of the device. The gain of the electron multiplier (CDEM) in the SRS RGA is defined relative to the Faraday Cup output (which is assumed to be mass independent). It can be programmed anywhere from 1 to 107 adjusting the high voltage applied across the device, is highly mass dependent, and changes with time due to aging. The electron multiplier gain is easily calibrated in the SRS RGA since it is possible to measure the same ion current with and without the CDEM. The common method of calibrating the electron multiplier gain for a given mass peak is to measure the peak intensity with the Faraday cup, and then repeat the same measurement with the electron multiplier without changing anything else. The gain of the multiplier is the ratio of the multiplier output current to the Faraday cup output current. (Note that there is no need to change the sign of the electron multiplier signal prior to the division since the firmware automatically reverses its sign before transmitting the value.) The RGA Head can store a single set of [High Voltage, Gain] values for the electron multiplier in its non-volatile memory. RGA Windows uses the voltage value to bias the CDEM and the gain value to divide the ion currents when the CDEM is turned on. See the HV, MV and MG commands in the RGA Command set for details on the commandlevel implementation of this procedure. RGA Windows can automatically program the gain of the electron multiplier for any mass using the automatic Electron Multiplier Gain Adjustment function of the Electron Multiplier command (Head Menu). Select a gain value between 10 and 1,000,000, choose a mass value for partial pressure measurements , and the RGA program automatically calculates the required high voltage setting when the Adjust button of the Electron Multiplier Window is pressed. The HV and gain settings are saved into the RGA Head and used every time the CDEM is turned on. All data acquired while the CDEM is on gets divided by the gain automatically before it is displayed. SRS Residual Gas Analyzer 8-1 Chapter 8 RGA Maintenance This chapter describes how to maintain the components of the quadrupole probe. The ECU does not have any serviceable parts and should not require any routine maintenance. In This Chapter Warnings! ................................................................................................................................................ 8-3 Probe Bakeout......................................................................................................................................... 8-5 Procedure .................................................................................................................................... 8-6 Ionizer Degas........................................................................................................................................... 8-7 Ionizer Replacement ............................................................................................................................... 8-8 Equipment ................................................................................................................................... 8-8 Procedure .................................................................................................................................... 8-8 Filament Replacement.......................................................................................................................... 8-11 Handling and care of the filament ........................................................................................... 8-11 Equipment ................................................................................................................................. 8-11 Procedure .................................................................................................................................. 8-11 CDEM Handling and Care .................................................................................................................... 8-14 Handling and mounting............................................................................................................ 8-14 Operating pressure................................................................................................................... 8-14 Operating temperature ............................................................................................................. 8-14 Bakeout temperature................................................................................................................ 8-14 Operating voltage ..................................................................................................................... 8-14 Initial pump-down ..................................................................................................................... 8-14 Contamination........................................................................................................................... 8-14 Storage....................................................................................................................................... 8-15 CDEM Pre-conditioning........................................................................................................................ 8-16 CDEM Refreshment .............................................................................................................................. 8-17 Materials .................................................................................................................................... 8-17 Procedure .................................................................................................................................. 8-17 CDEM Replacement .............................................................................................................................. 8-18 SRS Residual Gas Analyzer 8-2 Equipment..................................................................................................................................8-18 Procedure...................................................................................................................................8-18 Quadrupole filter cleaning....................................................................................................................8-21 Equipment..................................................................................................................................8-21 Procedure...................................................................................................................................8-22 SRS Probe Refurbishing Service.........................................................................................................8-25 SRS Residual Gas Analyzer Warnings 8-3 Warnings! x The service information in this chapter is for the use of Qualified Service Personnel. To avoid shock, do not perform any procedures in this chapter unless you are qualified to do so. x Read and follow all “Safety and Precaution” warnings before servicing the product. x Dangerous voltages, capable of causing injury or death, are present in this instrument. Use extreme caution whenever servicing any of its parts. x Carefully follow the instructions in this chapter. Failure to do so might result in serious personal injury and damage to the instrument. x Do not substitute parts or modify the instrument. Because of the danger of introducing additional hazards, do not install substitute parts or perform any unauthorized modification to the product. Do not use the product if it has unauthorized modifications. Return the product to SRS for service and repair to ensure that safety features are maintained. x Use only SRS supplied replacement parts. x Disconnect the ECU box from the probe before servicing any of the probe components. x Turn off the emission and wait for at least 30 minutes before removing a probe from a vacuum chamber. Serious burns can occur if the probe components are handled too soon. x Use proper vacuum procedures when handling the probe. x Avoid contaminating the probe: x x x x x x Protect the integrity of the vacuum seals: x x x Work in a clean, dust free area. A clean room compatible environment is best. Do not talk or breath on any of the parts. Wear gloves! Use clean tools during service procedures! Wear face masks, hair covers and no facial make-up. Avoid scratching the metal seals. Do not use nonmetal seals. Verify that the vacuum port is electrically grounded before attempting installation of the RGA Head to the vacuum system. SRS Residual Gas Analyzer 8-4 Warnings x Stanford Research Systems does not guarantee that the cleaning procedures described in this chapter will completely remove contamination from the probe. In some cases (i.e. depending on the vacuum composition) replacement of the parts might be the only solution to a contamination problem. SRS Residual Gas Analyzer Probe Bakeout 8-5 Probe Bakeout Bakeout of the RGA probe is recommended in the following cases: 1. After installation of the probe in the vacuum chamber. 2. After prolonged exposure of the probe assembly to open air. 2. When background contamination is present in the mass spectra. 3. When the performance of the RGA is degraded due to excessive contamination. When a new component is introduced into a high vacuum system or after the vacuum chamber has been vented up to air, outgassing of molecules (particularly H2O) from the walls usually determines the time it takes the pumping station to establish the desired base pressure. A bakeout accelerates the outgassing rates and results in reduced pumpdown times. In many cases a bakeout is needed to efficiently remove low-vapor pressure impurities from the walls. A thorough bakeout helps clean the entire probe and usually results in reduced contribution of the RGA sensor to the background signals. As the RGA is used, deposits form on the ionizer parts and on the filter components. The performance of the spectrometer is affected by the build-up of electrostatic charge on the contaminated surfaces. The symptoms of the problem are: decreased sensitivity, decreased resolution and, in severe cases, unusual peak shapes. A periodic bakeout helps keep the quadrupole probe clean and minimizes this problem. A thorough bakeout affects the entire probe. It is a better alternative than a “Filament Degas” process which acts only on the ionizer and compromises the lifetime of the filament. Warnings i To avoid fire risk use a good quality heater with a built-in temperature limit switch. i The O100HJR 200 °C self regulating heater jacket is recommended for use with the standard RGA nipple. i To avoid overheating the components use a reliable temperature controller to regulate the bakeout temperature. i Do not leave the system unattended for long periods of time. i To avoid damage to the electronic components detach the ECU from the probe during bakeout. i Do not operate the RGA during bakeouts. i To avoid burns cover the heater with heavy insulation during bakeout, and do not touch the probe until it cools down after bakeout is over. i Use only metal gasket seals during bakeout since rubber gaskets might melt! SRS Residual Gas Analyzer 8-6 Probe Bakeout Procedure 1. The quadrupole probe must be mounted on the vacuum system and at a base pressure under 10-6 Torr. 2. Turn off the RGA and disconnect the ECU from the probe. 3. Wrap a heating tape or heating jacket around the entire probe and cover with fiberglass insulation if necessary. Make sure the entire probe, including flanges, is evenly covered. 4. Bake the probe to at least 200qC for several hours (i.e. overnight). 5. After bakeout wait for the probe to cool down to room temperature before mounting the ECU back on its flange. 6. Run the peak tuning procedure. SRS Residual Gas Analyzer Ionizer Degas 8-7 Ionizer Degas An Ionizer Degas program is built into the RGA head to clean up the filament and the ionizer by Electron Impact Desorption. Degassing provides a fast way to clean up the ion source, however, it compromises the lifetime of the thoria coating of the filaments and it is no substitute for a complete bakeout of the probe. Its use is only recommended when contamination of the probe is suspected and a long bakeout is not a practical option. During the degas process the anode grid and the filament are bombarded by a 20 mA current of 400 eV electrons. The complete process takes three minutes and can be triggered directly from the RGA Windows software (Head Menu). The emission current is ramped slowly during the first minute to eliminate sudden bursts of gases into the vacuum system. The electron multiplier is turned off at the beginning of the cycle. The emission current is turned back to its pre-degas setting at the end of the degas cycle, but the electron multiplier is always left off for additional protection. Overpressure protection is built into the degas procedure and the filament will immediately shut down if a leak is detected. For users developing their own software, the Degas process can be triggered with the DG command described in the RGA Command Set List, and Degas times as large as 20 minutes long can be selected. SRS Residual Gas Analyzer 8-8 Ionizer Replacement Ionizer Replacement As the RGA is used, deposits form on the ionizer parts and the sensitivity of the sensor is degraded. Once the sensitivity of the spectrometer is significantly affected by this buildup it is necessary to completely replace the ionizer. All components of the ionizer should be replaced together at once. The replacement procedure is simple and should only take a few minutes. It is recommended that the filament be replaced as well during this procedure since some damage to its Thoria coating is inevitable during handling. Equipment x Ionizer Replacement kit (O100RI): consisting of repeller cage, anode grid, focus plate, and spare screws and e-clips. x One standard OFHC copper gasket for 2 3/4” CF Flange. New and Clean! x Precision flat-head screw driver: 2.5 mm head. x Needle nose pliers. x Latex gloves/powder free. x Clean, dust-free work area. Procedure 1. Read all warnings at the beginning of this chapter before attempting to service the probe. 2. Set up in advance a clean dust-free working area where to carry out this procedure. 3. Turn off the RGA and disconnect the ECU from the probe. 4. Wait for the probe to cool down for at least 30 minutes after the emission is turned off. Severe burns can result if the probe is handled too soon. 5. Without disconnecting the RGA Cover Nipple from the vacuum port, remove the six bolts from the feedthru flange at the end of the probe and slide the entire probe assembly out of the vacuum system (Note the rotational orientation of the Feedthru Flange before removing the probe assembly from the vacuum system so that the probe can be reassembled in the exact same way at the end of the procedure. Mark the side of the flanges with a permanent marker if necessary.) The ionizer, the filter, and the detector are now fully exposed and easily accessible. SRS Residual Gas Analyzer Ionizer Replacement 8-9 Feedthru Flange Vacuum Chamber RGA Cover Nipple Ionizer Vacuum Port Probe Assembly Figure 1 Probe Removal for Ionizer Replacement 6. Carry the probe to a clean, dust free area immediately. Avoid contamination using handling procedures compatible with high vacuum requirements. 7. Hold the probe in a upright position and do a thorough visual inspection of the unit. Check for loose, damaged, misaligned and contaminated components. 8. Using the clean, flat-head screwdriver remove the screw that connects the repeller to the longest filament rod and pull out the cage exposing the filament and the anode grid. Be careful not to damage the delicate filament if you plan to use it again! 9. Remove the filament following the steps and precautions described in the “Filament Replacement” section of this chapter. 10. Next, pull out the anode grid after removing the two screws that fasten its bottom plate to the alignment rods. The two rods do not need to be replaced and should not be moved during this procedure! 11. Finally, remove the two screws that hold the focus plate against the top alumina spacer and pull out the plate. The short alignment rod will also need to be removed during this step, but it does not need to be replaced (Save it!). 12. Use the new parts from the “Ionizer Replacement Kit” to replace the ionizer components. The new components are clean and vacuum compatible. Avoid contamination! Replace all components at once! Discard the old ones! 13. Use two fresh screws from the ionizer replacement kit to mount the new focus plate on the alumina spacer. Make sure the short alignment rod is put back in place and the screws are tight. 14. Install the new anode grid. Use the new screws to fasten its bottom plate to the alignment rods. Caution: The anode cage is fairly strong but it should still be handled very carefully since its correct alignment is essential for optimum performance of the RGA. 15. Once the anode grid is secured in place, replace the filament following the steps described in the “Filament Replacement” section of this chapter. It is highly recommended that a new filament be used for this step since damage to the delicate thoria coating is unavoidable during removal. SRS Residual Gas Analyzer 8-10 Ionizer Replacement 16. Attach the new repeller to the longer filament rod using a fresh screw. Align the cage and tighten the screw (Correct alignment is best assured when the two small holes on the side of the repeller cage line up with the filament screws.) 17. Inspect visually the entire ionizer assembly to assure the correct alignment of its parts, and, if satisfied, mount the probe back on the vacuum system. Check the correct rotational orientation of the feedtrhu flange (i.e. same as it was before disassembly) before tightening the flange bolts. 18. A bakeout of the probe is highly recommended before operating the RGA again. 19. Retune the sensitivity of the RGA, following the instructions in the RGA Tuning chapter, before using the unit for quantitative measurements. SRS Residual Gas Analyzer Filament Replacement 8-11 Filament Replacement The filament eventually wears out and needs to be replaced. There is no need to send the RGA unit back to the factory for this service. The replacement procedure is simple and can be completed in a few minutes by qualified personnel. The filament is very delicate and should be handled with extreme care. The thoria coating is very delicate and can easily be damaged if the filament is mishandled. Please read the following handling recommendations before opening the filament’s box: Handling and care of the filament x Do not bend, or twist the filament . x Do not scratch the filament’s Thoria coating. x Do not handle the filament directly with your fingers, use fine tweezers, and hold it by the platinum tabs only. x Do not attempt to clean the filament. x Use only SRS provided filaments as replacement. Equipment x Filament Replacement kit: consisting of new filament, and spare screws and nuts. x One standard OFHC copper gasket for 2 3/4” CF Flange. New and Clean! x Precision flat-head screw driver: 2.5 mm head. x Needle nose pliers. x Latex gloves/powder free. x Clean, dust-free work area. Procedure 1. Read all warnings at the beginning of this chapter before attempting to service the probe. 2. Set up in advance a clean, dust-free working area where to carry out this procedure. 3. Turn off the RGA and disconnect the ECU from the probe. 4. Wait for the probe to cool down for at least 30 minutes after the emission is turned off. Severe burns can result if the probe is handled too soon. 5. Unscrew the six bolts from the RGA’s mounting flange and remove the entire probe from the vacuum system (Note the rotational orientation of the RGA Mounting Flange before removing the probe from the vacuum system so that it can be placed in the exact same orientation at the end of the procedure. Mark the side of the flanges with a permanent marker if necessary.). The ionizer is now fully exposed and easily accessible. SRS Residual Gas Analyzer 8-12 Filament Replacement RGA Mounting Flange Vacuum Chamber RGA Cover Nipple Vacuum Port Ionizer Probe Assembly Figure 2 Probe Removal for Filament Replacement 6. Immediately carry the probe to a clean, dust-free area and secure it in an upright position. Avoid contamination using handling procedures compatible with high vacuum requirements. 7. Using the clean, flat-head screwdriver remove the single screw that connects the repeller to the longer filament rod and pull out the cage exposing the filament and the anode grid. 8. Before replacing the filament, visually inspect the entire ionizer. Check for loose, damaged, misaligned and contaminated components. Some discoloration of the ionizer parts is common, but heavy buildup on the grids and plates is a sign of severe contamination. If problems are detected, a complete “Ionizer Replacement” procedure should be carried out at this time. Otherwise, continue with the filament replacement procedure. 9. Inspect the filament, and become acquainted with the way in which it is mounted on the filament rods: The SRS RGA filament is of a circular shape and made out of very thin, thoria-coated iridium wire. Two platinum tabs, spot-welded at opposite ends of its circumference, provide electrical connection to the rods that deliver the power during emission. Precision machined slots define the exact placement of the filament tabs along the two rods and a small “screw and nut” set secure each tab in place. 10. Without removing the nuts, loosen the two screws that hold the filament in place enough to pull the filament out the ionizer assembly. Discard the old filament. 11. Leave enough clearance between each nut and the top of its corresponding alignment slot to slide the platinum tabs of the new filament during installation. 12. Open the filament box and pick up the filament by one of its platinum tabs with the clean tweezers. 13. Very carefully slide the filament into position, until the platinum tabs fall into the slots. Do not bend or twist the filament. Do not scratch the Thoria coating! 14. Tighten the screws while pressing the nuts against the rods with the tweezers, making sure the tabs are centered in the slots. SRS Residual Gas Analyzer Filament Replacement 8-13 15. Visually inspect the filament alignment and do any adjustments that might be necessary. The filament should form a circle around the anode grid. Slight bends in the filament are common, and do not compromise its performance. Severe bends might result in electrical-shorts to the repeller and anode grid and need to be corrected. Use gentle pressure on the filament wire to bend it back into its correct shape if needed (Note: use a clean cotton swab for this procedure). 16. Attach the repeller to the longer filament rod using a fresh screw. Align the cage and tighten the screw (Correct alignment is best assured when the two small holes on the side of the repeller cage line up with the filament screws.) 17. Inspect visually the entire ionizer assembly to assure its correct alignment, and, if satisfied, mount the probe back on the vacuum system. Check the correct rotational orientation of the probe (i.e. same as it was before disassembly) before tightening the flange bolts. 18. A bakeout of the probe is recommended before operating the RGA again. SRS Residual Gas Analyzer 8-14 CDEM Handling and Care CDEM Handling and Care Continuous Dynode Electron Multipliers (CDEM) have a history of high performance and dependability in mass spectrometry applications. By following the simple recommendations described below the user should achieve a long useful lifetime from these detectors. Handling and mounting Handling and mounting of the CDEM should only be performed in a clean vacuum fashion: x x x Work on a clean dust-free area. Avoid dust, lint and any kind of particulate matter. Wear talc-free rubber gloves or finger cots. Use properly degreased tools. Avoid excessive shock, such as from dropping onto a hard surface (Remember that CDEM’s are made out of glass). Operating pressure The recommended operating pressure is 5.10-6 or less. The lower the pressure during any operation, the longer the lifetime of the CDEM. Never apply voltage to a CDEM at pressures above 10-4 Torr. Operating temperature The safe operating temperature of a CDEM is less than 100qC. Bakeout temperature The bakeout temperature must be less than 300qC with no voltage applied across the unit. Operating voltage The maximum voltage applied to any CDEM should never exceed 3500V. The SRS RGA High Voltage power supply is limited to a 2500V output. Typical operating range is 1100-2500V. In general, the lower the average signal current drawn from the detector and the lower the operating voltage, the longer the lifetime that will be realized. Initial pump-down To best maintain the high gain and low dark current properties of electron multipliers it is very important to follow the steps described in the CDEM Pre-conditioning section of this chapter during the initial pump-down of the electron multiplier. The procedure serves to degas the detector and stabilize the gain. Failure to follow the recommended steps before powering up the multiplier might result in gain degradation by as much as a factor of ten. Contamination The active surface of the CDEM can be repeatedly exposed to air without degradation; however, it should not be contaminated with dust, lint or other particles. Organic substances present in the vacuum system tend to accumulate on the active surface of the SRS Residual Gas Analyzer CDEM Handling and Care 8-15 multiplier and lead to slow performance degradation (due to reduced secondary emission efficiency). Oil contamination is a serious problem, and can result in catastrophic destruction of the multiplier: use liquid nitrogen traps with diffusion pumps (particularly for slicone oil based pumps) , and molecular sieves traps with mechanical roughing pumps whenever possible. If the multiplier becomes contaminated it must be cleaned immediately! (See CDEM Refreshment procedure in this chapter) Storage CDEM’s can be stored indefinitely in a clean dry container such as an air or dry nitrogenfilled “dry box”. Double bagging with clean, dust-free zip locked bags also works well as a temporary alternative SRS Residual Gas Analyzer 8-16 CDEM Pre-conditioning CDEM Pre-conditioning The following preconditioning procedure is recommended for the first pump-down and initial operation of a new CDEM: 1. Pump overnight prior to initial application of voltage. 2. Begin operation at the lowest voltage possible, working up to the voltage required to produce observable peaks. 3. Limit the initial operation to trace peaks with gradual increase in abundance levels over the first two hours of operation of a new CDEM. All CDEM’s undergo an initial cleanup phase during which absorbed gases are removed from the active surface. If during this time the detector is exposed to high input currents permanent gain degradation by as much as a factor of ten may result. The steps described above help to control initial outgassing and are performed in order to precondition the CDEM. Optimum sensitivity and longer lifetime will result if the recommendations are followed. SRS Residual Gas Analyzer CDEM Refreshment 8-17 CDEM Refreshment A CDEM contaminated with organic impurities (i.e. pump oil) can sometimes be refreshed following the cleaning procedure described in this section. The CDEM should show a gain improvement after the cleaning. Warning Stanford Research Systems does not guarantee that this procedure will remove contamination from a detector. Use this method as a last resort only. Materials x Ultrasonic cleaner x Isopropyl alcohol, Electronic grade or better. x 1000 mL beaker x Oil-free, dry nitrogen x Petri dish. x Clean oven ( higher than 100qC setting). Warning: The fumes from isopropyl alcohol can be dangerous to health if inhaled and are highly flammable. Work in well ventilated areas and away from flames. Warning: Read and follow all directions and warnings of the ultrasonic cleaner regarding the use of organic solvents for cleaning. Procedure 1. Fill the 1000 mL beaker with isopropyl alcohol. 2. Gently place the CDEM into the alcohol. 3. Insert the beaker containing the CDEM into the ultrasonic cleaner for 10 minutes 4. Remove the CDEM from the isopropyl alcohol and allow it to drain for a few minutes 5. Depending on the contamination level, repeat steps 1-4 as needed. 6. Blow dry the CDEM with oil-free dry nitrogen. 7. Place the CDEM in a clean Petri dish and dry at 100qC for about one hour. SRS Residual Gas Analyzer 8-18 CDEM Refreshment CDEM Replacement There is no need to send the RGA unit back to the factory for this service. The replacement procedure is very simple and can be completed in a few minutes by qualified personnel. Gain degradation limits the lifetime of all electron multipliers. Eventually the gain drops to unacceptable values and the multiplier needs to be replaced. As a rule of thumb, the CDEM should be replaced when the required gains can no longer be achieved by increasing the bias voltage. Warnings: The CDEM is very delicate and should be handled with extreme care. Handling and mounting of the CDEM should only be performed in a clean vacuum fashion: Work on a clean dust-free area. Avoid dust, lint and any kind of particulate matter. Wear talc-free rubber gloves or finger cots. Use properly degreased tools. Avoid excessive shock, such as from dropping onto a hard surface (Remember that the CDEM is made out of glass). Use only SRS supplied electron multipliers for replacement. Equipment x Multiplier Replacement kit: consisting of new CDEM with mounting clamp in place and spare screws and nuts. x One standard OFHC copper gasket for 2 3/4” CF Flange. New and Clean! x Precision flat-head screw driver: 2.5 mm head. x Needle nose pliers. x Latex gloves/powder free. x Clean, dust-free work area. Procedure 1. Read all warnings at the beginning of this chapter before attempting to service the probe. 2. Set up in advance a clean dust-free working area where to carry out this procedure. 3. Turn off the RGA and disconnect the ECU from the probe. 4. Wait for the probe to cool down for at least 30 minutes after the emission is turned off. Severe burns can result if the probe is handled too soon. SRS Residual Gas Analyzer CDEM Replacement 8-19 5. Without disconnecting the cover nipple from the vacuum port, remove the six bolts from the feedthru flange at the end of the probe and slide the entire probe assembly out of the vacuum system (Note the rotational orientation of the Feedthru Flange before removing the probe assembly from the vacuum system so that the probe can be reassembled in the exact same way at the end of the replacement procedure. Mark the side of the flanges with a permanent marker if necessary.) The ionizer, the filter, and the detector are now fully exposed and easily accessible. Feedthru Flange Vacuum Chamber CDEM RGA Cover Nipple Vacuum Port Probe Assembly Figure 3 Probe Removal for CDEM Replacement 6. Carry the probe to a clean, dust free area immediately. Avoid contamination using handling procedures compatible with high vacuum/clean room requirements. 7. Hold the probe in a secure upright position and do a thorough visual inspection of the unit. Check for loose, damaged, misaligned and severely contaminated components. Carefully inspect the ionizer and, if any problems are detected, perform a filament and/or ionizer replacement following the procedures described earlier in this chapter. Inspect the CDEM for signs of arcing and contamination. A blue tinge is an indication of an electrical arc while brown indicates contamination. A “burned” black color may indicate both arcing and contamination have occurred. If excessive contamination is evident take the necessary steps to identify and reduce contamination sources in the vacuum system. 8. CDEM Removal: Note the position of all parts and their orientation before disassembly! The CDEM consists of a straight, four-channel tube made out of glass, with a cone of the same material attached to the front end. It is held upright, next to the FC, and away from the axis of the analyzer, by a clamp and a clip. The clamp wraps around the multiplier tube, and is connected to a neighboring rod. It assures proper alignment of the cone and provides the electrical connection to the High Voltage power supply. A hole on the side of the FC Shield allows space for mounting the cone very close to the FC top. The clip is spot welded to the side of the FC shield and holds the lower end of the multiplier’s tube at ground. Chrome electrical coatings, deposited at both ends of the multiplier provide the necessary electrical contacts. A plate (CDEM Anode) mounted at the exit of the CDEM collects the secondary electrons. The whole assembly is self aligning. SRS Residual Gas Analyzer 8-20 CDEM Refreshment CDEM Clip Remove this screw only! Faraday Cup Shield CDEM Anode CDEM CDEM Clamp Figure 4 CDEM Replacement 9. Using the clean flat head screwdriver, remove the small screw that fastens the clamp to the HV rod and rotate the entire multiplier about its axis until the clamp’s end points away from the FC Shield. 10. Holding on to the clamp’s end, pull the multiplier out of the clip. 11. Unpack the new multiplier. Notice that the multiplier has a mounting clamp already in place so there is no need to keep the old one. Avoid contamination. 12. Install the new multiplier in place reversing the removal steps. Clip it in place, rotate it about its axis so the clamp fits into the slot in the HV rod, and fasten the clamp with a small screw. 13. Visually inspect the assembly and do any adjustments that might be necessary. The CDEM should be standing straight up, centered between its two neighboring rods, and with its cone facing straight into the FC shield’s hole. The CDEM anode should be |1 mm away from the multiplier’s exit, and it can easily be pushed up or down with pliers for correct placement. There should be no electrical contact between the cone (HV) and any part of the probe. If necessary loosen the clamp’s screws to do adjustments. 14. Once satisfied with the alignment, mount the probe back on the vacuum system and pump it down. Check the correct rotational orientation of the feedtrhu flange (i.e. same as it was before disassembly) before tightening the flange bolts. 15. Perform the CDEM Preconditioning steps described in this chapter before using the multiplier for actual measurements. 16. Calibrate the gain of the new electron multiplier before using the device for quantitative measurements. See instructions in RGA Tuning chapter. SRS Residual Gas Analyzer Quadrupole filter cleaning 8-21 Quadrupole filter cleaning The quadrupole mass filter is the heart of the RGA. The sensitivity and resolution of the instrument are ultimately limited by the quality of the quadrupole field between its rods. Deposits on the rods accumulate electrostatic charge and distort the field, resulting in degraded performance. The deposits typically form at the entrance to the mass filter, when the RGA is operated at high pressures or over long periods of time. They are often seen as a discoloration of the metal but in some cases (i.e. depending on the vacuum composition) they are invisible. If contamination of the rods is suspected, the first step to take is a one- or two-day long “Probe Bakeout”. If bakeout is not successful, the quadrupole filter will need to be cleaned. Note that in order to clean the rods, the entire quadrupole head assembly must be taken apart, and unless the exact nature of the deposits is known, the only sure way to remove them will be with a very fine abrasive. Warnings x The exact alignment of the rods in the quadrupole is essential to the optimum performance of the RGA. x Do not scratch the surface of the rods. x Do not remove excessive amounts of surface material with the abrasives. x Use clean tools and procedures. Equipment x Clean, dust-free work area. x Latex gloves/powder free. x One standard OFHC copper gasket for 2 3/4” CF Flange. New and Clean! x Replacement bowed e-clips (SRS Part# 0-00579-000, 12 count) x Phillips head screw driver: P1 head (clean.) x Precision flat-head screw driver: 2.5 mm head (clean.) x Needle nose pliers. x Micro-Mesh abrasive sheets: 3200 to 12000 grit. x Ultrasonic cleaner. x Ultrasonic cleaning solution (high quality, no-rinsing residue). x 1000 mL beaker. x Oil-free, dry nitrogen. x Distilled or de-ionized water. x Petri dish. x Clean oven ( higher than 100qC setting). SRS Residual Gas Analyzer 8-22 Quadrupole filter cleaning Procedure 1. Read all warnings at the beginning of this chapter before attempting to service the probe. 2. Set up in advance a clean dust-free working area where to carry out this procedure. 3. Turn off the RGA and disconnect the ECU from the probe. 4. Wait for the probe to cool down for at least 30 minutes after the emission is turned off. Severe burns can result if the probe is handled too soon. 5. Without disconnecting the cover nipple from the vacuum port, remove the six bolts from the feedthru flange at the end of the probe and carefully slide the entire probe assembly out of the vacuum system. The ionizer, the filter, and the detector are now fully exposed and easily accessible. Feedthru Flange Vacuum Chamber RGA Cover Nipple Ionizer Vacuum Port Probe Assembly Figure 5 Probe Removal for Quadrupole Filter Cleaning 6. Carry the probe to a clean, dust free area immediately. Avoid contamination using handling procedures compatible with high vacuum requirements. 7. Hold the probe in a secure upright position and do a thorough visual inspection of the unit. Check for loose, damaged, misaligned and severely contaminated components. If excessive contamination is evident take the necessary steps to identify and eliminate the contamination sources in the vacuum system. Carefully inspect the ionizer and, if any problems are detected, replace the filament and/or the ionizer as part of this maintenance procedure. Inspect the CDEM for signs of arcing and contamination. If necessary replace the CDEM as part of this maintenance procedure. 8. Head disassembly: Only a rough outline of the complete disassembly of the probe is presented here. Use the RGA Assembly Drawing of Chapter 9 as a visual aid during the process. Note the placement of all parts and their orientation before disassembly! Begin by removing the filament following the necessary steps from the “Filament Replacement” procedure described in this chapter. Be very careful not to damage the thoria coating if you intend to use the same filament during reassembly. Next, remove the CDEM following steps from the “CDEM Replacement” procedure. Store the multiplier in a dry box or desiccator. Loosen the seven screws that fasten the 1/8” diameter rods to the feedthru connectors, and remove the bowed e-clip from the exit plate align rod that is located right above the CDEM. You can now separate SRS Residual Gas Analyzer Quadrupole filter cleaning 8-23 the entire quadrupole assembly from the detector/feedthru assembly. There are no serviceable parts in the flange. Set it apart in a safe, clean area. Next, separate the ionizer from the quadrupole filter by removing the e-clips that hold the 1/8” diameter rods in place. Store the ionizer electrodes in a safe clean area. Disassemble the quadrupole and set apart the precision ground rods for cleaning. This is a good time to carefully inspect all the components of the probe for damage and contamination. Replace or clean any parts that are suspect. Note: We do not recommend cleaning the alumina spacers, but if signs of severe contamination are evident, ultrasound clean the two rings for 15 minutes with diluted cleaning solution, and bake them out for 2 hours at 180q C after a thorough rinsing. 9. Rods cleaning: Use the Micro-Mesh abrasives to clean the rods. Begin by using the finest abrasive which will remove the residue, normally 3200 grit. Then consecutively use the next finer grit down to 12000 until the metal surface has a fine polished appearance. Warning: Do not remove excessive material from the surface of the precision-ground rods. After all metal surfaces have been polished, they must be cleaned to remove all the abrasive compound from their surface. Begin by placing the rods in a beaker with the ultrasonic cleaner solution (Note: Any good quality cleaning compound that leaves no residue after rinsing is good for this job.) Place the beaker in the ultrasound cleaner and agitate for 30 minutes. Decant off the cleaning solution, and repeat the above agitation with 4 to 5 consecutive washes with distilled water to remove the cleaning solvent. Following the rinses, blow dry the rods with filtered dry nitrogen and then bake them out in an oven at 180qC for fifteen minutes. Warning: After the parts have been cleaned and baked out, they should only be handled wearing powderfree latex gloves. 10. Head Reassembly: Only a rough outline of the complete reassembly of the probe is presented here. Use the RGA Assembly Drawing of Chapter 9 and your own notes as a visual aid during this process. Begin by assembling the quadrupole mass filter. Loosely attach the cleaned rods to the alumina spacers with the spring-loaded, perforated screws. Tighten the screws following the systematic procedure described next. Work on one spacer at a time, using a single, small turn of the screwdriver on each screw. After a single round of eight screws, hold a spacer in each hand, and slightly torque the assembly back and forth about its axis to make sure the rods are comfortably seated on their alignment grooves. Repeat this tightening procedure, one spacer at a time, constantly checking the alignment, until the spring washers are completely compressed. Once the quadrupole assembly is completed, mount the focus plate and the anode grid on it. Use new e-clips to hold the two ionizer plates against the top alumina spacer, but do not install any e-clips on the bottom grooves of the connection rods at this time. Next, mount the quadrupole assembly on the exit plate of the feedthru flange and secure it in place tightening the two connector screws and inserting an e-clip in the exit plate align rod groove. Insert the rest of the rods in their correct locations and, while checking for the correct alignment of their grooves and slots, tighten the rest of the feedthru connector screws. Once the rods are in place, attach the two RF ribbon connectors to complete the quadrupole filter assembly. SRS Residual Gas Analyzer 8-24 Quadrupole filter cleaning If the RGA probe has a CDEM, mount the multiplier at this time. Adjust the HV connect rod as needed, and tighten all the necessary screws (The threaded hole on the side slot of the rod lines up with the CDEM Clamp hole, and the top groove should be correctly lined up with the edge of the alumina spacer’s alignment hole.) Install new bowed e-clips in all the grooves located above the alignment holes of the bottom alumina spacer. The clips hold the filter tightly against the exit plate. Finally, install the filament and the repeller cage. 11. Visually inspect the probe to make sure all the parts are in place and correctly aligned. Use an ohmmeter to make sure the electrodes are electrically isolated from each other and from the body of the flange (ground). 12. Once satisfied, install the probe back in the vacuum system and perform a complete “Probe Bakeout” before using the RGA for measurements. 13. Perform a peak tuning procedure on the unit. SRS Residual Gas Analyzer SRS Probe Refurbishing Service 8-25 SRS Probe Refurbishing Service The procedures described in this chapter are designed to guide the user through the various steps needed to maintain and/or repair the different components of the RGA probe. These procedures should only be carried out by qualified personnel who fully understand the critical alignment aspects of the instrument. Users who do not feel comfortable or simply do not have the time to go through the different maintenance steps can choose to send the RGA unit back to the factory for a complete Probe Refurbishing Service. Please contact SRS to obtain information on this very fast and convenient service. All refurbished probes are fully tested and calibrated before being returned. Important: All users returning an RGA Probe back to the factory for repair and/or service must submit a correctly completed “Declaration of Contamination of Vacuum Equipment” form along with the instrument. The SRS personnel carrying out the repair and service of vacuum equipment must be informed of the condition of the components before any work is done on the parts. A copy of the form is attached at the end of this manual. SRS Residual Gas Analyzer 8-26 Quadrupole filter cleaning SRS Residual Gas Analyzer 9-1 Chapter 9 RGA Troubleshooting This chapter describes basic troubleshooting procedures for the SRS RGA. In This Chapter Warnings.................................................................................................................................................. 9-2 Internal Error Detection in the SRS RGA ............................................................................................. 9-3 Basic Troubleshooting ........................................................................................................................... 9-5 Built-in Hardware Checks .................................................................................................................... 9-10 24V DC Power Supply .............................................................................................................. 9-10 Electrometer .............................................................................................................................. 9-10 Quadrupole Mass Filter RF P/S ............................................................................................... 9-11 Filament’s Background Protection mode .............................................................................. 9-12 SRS Residual Gas Analyzer 9-2 Warnings Warnings x The service information in this chapter is for the use of Qualified Service Personnel. To avoid shock, do not perform any procedures in this chapter unless you are qualified to do so. x Read and follow all “Safety and Precaution” warnings before servicing the product. x Dangerous voltages, capable of causing injury or death, are present in this instrument. Use extreme caution whenever servicing any of its parts. x Do not substitute parts or modify the instrument. Because of the danger of introducing additional hazards, do not install substitute parts or perform any unauthorized modification to the product. Do not use the product if it has unauthorized modifications. Return the product to SRS for service and repair to ensure that safety features are maintained. x Use only SRS supplied replacement parts. x Disconnect the ECU box from the probe before servicing any of the probe components. x Turn off the emission and wait for at least 30 minutes before removing a probe from a vacuum chamber. Serious burns can occur if the probe components are handled too soon. x Use proper vacuum procedures when handling the probe. x Avoid contaminating the probe: x Work in a clean, dust free area. A clean room compatible environment is best. Do not talk or breath on any of the parts. Wear gloves! Use clean tools during service procedures! Wear face masks, hair covers and no facial make-up. Protect the integrity of the Vacuum seals: Avoid scratching the metal seals. Do not use nonmetal seals. x Verify that the vacuum port is electrically grounded before attempting installation of the RGA Head to the vacuum system. x The ECU box does not have any serviceable parts and does not require any routine maintenance. x Contact the factory for instructions on how to return the instrument for authorized service and adjustment. SRS Residual Gas Analyzer Internal Error Detection in the SRS RGA 9-3 Internal Error Detection in the SRS RGA Several firmware-driven checks automatically test the RGA when the instrument is turned on, and continuously monitor the internal workings of the unit. A “Background Filament Protection Mode” is activated, when the filament is turned on to protect the delicate filament (and CDEM) from accidental overpressures. Several commands can be used to trigger hardware tests on the ECU. Any one of the internal checks just described can detect and report errors, but it is the responsibility of the user to monitor the RGA Head for error reports. Note: Refer to the last section of this chapter for a listing of the built-in hardware checks available in the RGA Head. Important: Even though the hardware tests built into the RGA Head can check the instrument for a large variety of problems, they cannot detect all possible error conditions. There are two ways to detect the presence of errors in the RGA: 1. Visually: Inspecting the red LED’s on the rear panel of the ECU. The Error LED is turned on whenever a hardware problem is detected, and it flashes twice if a communications error is generated during programming. The Burnt and Leak LED’s indicate specific filament problems and are turned on, in addition to the Error LED, whenever the ionizer’s emission is internally shut down or not established as requested. 2. Error Queries: Querying the Error Bytes with the Error Reporting commands. The “Error Byte Definitions” section of the RGA Programming chapter describes the different error bytes used to store the results of the internal checks. The “Error Reporting Commands” query the error bytes and can be used to quickly diagnose problems. RGA Windows supports all the Error Reporting commands and constantly monitors the value of the Error Bytes. “Error Report” Windows immediately announce all detected errors and identify the different problems based on unique Error Codes. Refer to the next section of this chapter for Troubleshooting information specific to each Error Code. Users developing their own RGA control software should integrate the Error Reporting commands into their software, and use them periodically. Consult “Error Checking the RGA”, in the RGA Programming chapter of this manual, for details. Use the Error Byte Definitions listing to obtain the Error Codes for the detected errors. Error Checking Tips: x Keep an eye on all three red (i.e. error reporting) LED’s while operating the RGA. x Diagnose and troubleshoot problems as soon as they are detected. x RGA Windows users: Use the Retry button of the Error Report Window to trigger one or two fresh error checks on the hardware, before declaring a problem. SRS Residual Gas Analyzer 9-4 Internal Error Detection in the SRS RGA RGA Programmers: Repeat the query command, if a problem was detected after the last query. Note that the values of the Error Bytes often change after an Error Byte query command is executed. Some query commands update the byte value after performing a fresh test on the hardware, while others clear error bits, after they are read, to provide a clean error-reporting slate. Please see the Error Reporting Commands list for details. x Communications errors are different from hardware errors in that the Error LED only flashes two or three times when the problem is detected. RGA Windows reports communications errors very explicitly as soon as they are detected. RGA programmers will need to use the EC? command to diagnose the problems. x RGA Programmers should consider having their programs automatically report the Error Code for each problem detected. x Use the Get Head Info... command in the Head Menu of RGA Windows to get a complete listing of all the Error Bytes at any time. SRS Residual Gas Analyzer Basic Troubleshooting 9-5 Basic Troubleshooting A unique Error Code has been assigned to each one of the fault conditions that can be internally detected by the RGA Head. The Error Codes are used only by the RGA Windows program to report all internally detected errors. This section lists causes and troubleshooting procedures for all the possible Error Code values available in the SRS RGA. Error Code: DET1 Type of Error: Electrometer Error Message: Electrometer Error: OP-AMP Input Offset Voltage out of range. Error Cause: A large offset input voltage is present in one or both of the I-V converter opamps. This problem results in electrometer calibration errors, and will cause erroneous ion current readings. Troubleshooting: Contact SRS. Error Code: DET3 Type of Error: Electrometer Error Message: Electrometer Error: COMPENSATE fails to read -5nA input current. Error Cause: The logarithmic output of the temperature-compensating picoammeter is not within the levels expected for a -5 nA input current. Troubleshooting: Contact SRS. Error Code: DET4 Type of Error: Electrometer Error Message: Electrometer Error: COMPENSATE fails to read +5nA input current. Error Cause: The logarithmic output of the temperature-compensating picoammeter is not within the levels expected for a +5 nA input current. Troubleshooting: Contact SRS. Error Code: DET5 Type of Error: Electrometer Error Message: Electrometer Error: DETECT fails to read -5nA input current. Error Cause: The logarithmic output of the picoammeter is not within the levels expected for a -5 nA input current. Troubleshooting: Contact SRS. SRS Residual Gas Analyzer 9-6 Basic Troubleshooting Error Code: DET6 Type of Error: Electrometer Error Message: Electrometer Error: DETECT fails to read +5nA input current. Error Cause: The logarithmic output of the picoammeter is not within the levels expected for a +5 nA input current. Troubleshooting: Contact SRS. Error Code: DET7 Type of Error: Electrometer Error Message: Electrometer Error: ADC16 Test Failure. Error Cause: The 16 bit analog-to-digital converter used to digitize the logarithmic output of the picoammeter reports an output greater than 15 mV when its input is grounded. Troubleshooting: Contact SRS. Error Code: EM7 Type of Error: Electron Multiplier Error Message: Electron Multiplier Error: No Electron Multiplier Option available in this head. Error Cause: A function involving the electron multiplier was invoked in a unit that does not include the CDEM option (Option 01.) Troubleshooting: Do not use any of the CDEM related commands in this unit. Upgrade the RGA to an Electron Multiplier option (Option 01). Error Code: FL6 Type of Error: Filament “Background Protection Mode”. Error Message: Filament Error: Unable to set the requested emission current. Error Cause: The filament heater was unable to establish the requested emission current. The most common reason for this problem is a serious leak in the vacuum system. In the event of an overpressure detection, the filament emission and the electron multiplier are immediately turned off, and the Error and Leak LED’s are turned on to indicate the problem. Important: The Leak LED will also be turned on if the Thoria coating of the filament is excessively worn down or damaged. However, this is a more rare event due to the long life of the thoriated iridium filaments. Troubleshooting: The following troubleshooting steps are recommended: Note: Retry turning on the filament after each step. The RGA Head must be installed in a vacuum system and pumped down to pressures under 10-4 Torr for the instrument to operate correctly. Check the pressure in the vacuum system. Check for leaks, open valves or large sources of contamination that might be SRS Residual Gas Analyzer Basic Troubleshooting 9-7 causing severe overpressures. If the pressure is OK ( i.e. <10-4 Torr), check for shorts in the ionizer assembly. Using an ohmmeter check the conductance between the ionizer’s connectors and the vacuum system. (The ionizer feedthrus can be easily identified using the drawings in the RGA Assembly Chapter). If a short is detected, remove the probe from the vacuum system , inspect the ionizer and fix any shorts. Note: Use the information in the RGA Maintenance chapter to remove the repeller and/or service the ionizer. If the short is still present after that, remove the RGA Cover Nipple and inspect the rest of the probe for other sources of shorts (i.e. misalignments, loose screws, etc.). If no short is detected, the Thoria coating of the filament might be damaged. Inspect the filament (best with a magnifying glass) and look for large sections of Thoria coating missing. If a problem is suspected replace the filament using the procedure in the RGA Maintenance chapter. If the filament still does not turn on, contact SRS. Error Code: FL7 Type of Error: Filament “Background Protection Mode”. Error Message: Filament Error: No filament detected. Error Cause: No filament was detected after an attempt was made to establish emission current in the ionizer. The Error and Burnt LED’s are turned on by this error. Troubleshooting: A probe must be connected to the ECU. The probe must have a filament. The filament must have at least one intact (i.e. conductive) side. Use an ohmmeter to check continuity across the filament (The two filament feedthrus can be easily identified using the drawings in the RGA Assembly Chapter). The probe must be correctly connected to the ECU. Tighten the locking screws of the box Error Code: PS6 Type of Error: 24VDC P/S. Error Message: External 24V P/S error: voltage <22V. Error Cause: Voltage output of 24VDC Power Supply is under the acceptable 22-26V DC range. The Power LED is turned off and the Error LED is turned on instead. Troubleshooting: Check the voltage output of the external power supply with a voltmeter. Adjust the voltage to 24 V in adjustable external supplies or replace the power supply altogether if necessary. Contact SRS if your unit has a built-in power supply (Option 02). SRS Residual Gas Analyzer 9-8 Basic Troubleshooting Error Code: PS7 Type of Error: 24VDC P/S. Error Message: External 24V P/S error: Voltage >26V. Error Cause: Voltage output of 24VDC Power Supply exceeds the acceptable 22-26V DC range. The Power LED is turned off and the Error LED is turned on instead. Troubleshooting: Check the voltage output of the external power supply with a voltmeter. Adjust the voltage to 24 V in adjustable external supplies or replace the power supply altogether if necessary. Contact SRS for units with a built-in power supply (Option 02). Error Code: RF4 Type of Error: Quadrupole Mass Filter RF P/S. Error Message: RF P/S Error: Power Supply in current limited mode. Error Cause: The circuit that drives the primary of the RF Transformer is in current limited mode. Troubleshooting: Check for a short in the quadrupole connections. Error Code: RF6 Type of Error: Quadrupole Mass Filter RF P/S. Error Message: RF P/S Error: Primary Current exceeds 2.0 Amps. Error Cause: The circuit that drives the primary of the RF Transformer is delivering an unusually large current. Troubleshooting: Check for a short in the quadrupole connections. Error Code: RF7 Type of Error: Quadrupole Mass Filter RF P/S. Error Message: RF P/S Error. RF_CT exceeds (V_EXT-2V) at M_MAX. (M_MAX=100 for the RGA100, 200 for RGA200 and 300 for RGA300) Error Cause: The RF P/S goes out of regulation when the quadrupole mass filter is set to M_MAX amu. Note: When RGA Windows detects an RF7 error, it automatically tests the RGA Head and quickly determines the maximum mass value at which the RGA mass filter can be operated reliably (i.e. without the RF P/S going out of regulation). If the available mass range is smaller than the user’s selected scanning range, a warning is immediately displayed on the PC screen. The user can then choose to proceed (i.e. ignore the problem at own risk) or can get information on how to Troubleshoot the problem by pressing the Help button. This problem should not be ignored since it can be associated to erroneous SRS Residual Gas Analyzer Basic Troubleshooting 9-9 readings at high masses. Troubleshooting: x Is the quadrupole probe connected to the ECU box? The ECU’s RF P/S does not operate properly in the absence of a probe. x Is the RGA Cover Nipple in place? The SRS RGA will not operate without the RGA Cover Nipple in place.Consult Hardware Modifications in the RGA Probe chapter of the manual for details. x Are the electronics warmed up? The RF P/S is optimized at the factory in a completely warmed up ECU box. Cold operation reduces the efficiency of the RF P/S and can, in some cases, lead to an RF P/S error. To completely warm up the RGA electronics (and match the factory conditions) turn on the filament to the desired emission current and let the electronics warm up for at least 15 minutes. Once the warm-up time has elapsed, try to operate the RGA to see if the problem has disappeared (for example, trigger a scan over a large mass range.) If the problem is still present, warm up the unit further by performing one or more Degas cycles or setting the quadrupole mass filter to t50 amu for 15 minutes (see Programming the Quadrupole Mass Filter in Chapter 6 of the manual). It is good practice to keep the filament on as long as the RGA is turned on. Operating the filament keeps the electronics and the probe completely warmed up and assures reproducible readings at all times. The filament is burn-out resistant and will operate continuously for a long time. Note: During the warm-up period, RGA Windows users should see that the mass range over which the RGA can be operated reliably increases with time until it goes beyond the user’s requested scan range. No more warnings are posted beyond that point. If no improvement in the mass range is seen as the unit warms up then go on with the troubleshooting procedure. x Is the probe correctly connected to the ECU box? Try disconnecting and reconnecting the ECU box to the probe. Securely tighten the thumb screws to make sure good contact is made between the RF P/S and the quadrupole rod pairs. SRS Residual Gas Analyzer 9-10 Built-in Hardware Checks Built-in Hardware Checks Several firmware driven hardware checks are built into the RGA Head. Some checks are automatically performed as soon as the unit is powered up (i.e. Power-on checks), and others are activated when the emission from the ionizer is turned on (i.e. filament’s Background Protection Mode). Most of the checks can be triggered by query commands (i.e. Error Reporting Commands) at any time. This section describes the internal checks, based on the hardware components they test. The information presented includes: x The type of check performed. x The bit of Status affected. x The specific Error Byte affected (See Error Byte Definitions). x The query command that can be used to trigger the check (see Error Reporting Commands.) x The prefix of the Error Codes associated to the check. x Is this a Power-on check? 24V DC Power Supply STATUS Bit affected: 6 Error Byte affected: PS_ERR Error Reporting Command: EP? Error Codes prefix: PS Power-on check?: Yes The output of the external 24 V DC Power Supply must be between 22 and 26 Volts at all times while the RGA is in operation. Its voltage level is automatically tested when the instrument is turned on and can be checked at any time with the query command: EP?. The same test is performed in units with built-in power modules (Option 02) to check the voltage output of the internal switching power supply. If a voltage out of the allowable range is found, the POWER LED is turned off, , the red Error LED is turned on, Bit 6 of STATUS is set, and PS_ERR is updated to indicate the specific problem. Electrometer STATUS Bit affected: 5 Error Byte affected: DET_ERR Error Reporting Command: ED? Error Codes prefix: DET SRS Residual Gas Analyzer Built-in Hardware Checks Power-on check?: 9-11 Yes Ion currents from the Faraday Cup or the electron multiplier are measured with a very sensitive logarithmic electrometer. The voltage levels are digitized with a 16 bit analogto-digital converter (ADC16) and turned into current values using a digital logarithmic interpolation algorithm that calculate the currents from an internal calibration curve. The Electrometer/ADC16 system is automatically tested by the firmware on power-on and can be checked at any time with the query command: ED?. Several tests are performed during the check: 1. The ADC16 input is grounded and its digital output is measured to make sure it corresponds to less than 15 mV. 2. A current of +5nA is injected into the electrometer and the output is read and compared to expected values. 3. The same test is repeated with -5 nA of input current. If an error is detected: Bit 5 of STATUS is set, DET_ERR is updated, and the Error LED is turned on. The detector is reconfigured to its pre-check configuration once the tests are over. Quadrupole Mass Filter RF P/S STATUS Bit affected: 4 Error Byte affected: QMF_ERR Error Reporting Command: EQ? Error Codes prefix: RF Power-on check?: Yes The RF power supply that biases the rods of the Quadrupole Mass Filter is thoroughly checked upon a power-on reset and can be tested at any time using the query command: EQ?. The RF amplitude is set at the level corresponding to the maximum mass value for the head (100 amu for RGA100, 200 amu for RGA200 and 300 amu for RGA300) and the following tests are done: x The voltage on the primary of the RF transformer is checked to make sure it is at least 2V lower than the DC voltage used to power the instrument. x The amount of current flowing through the primary of the transformer is checked to make sure it is less than 2.0 Amps. x RF_PRI is also checked (against RF_SET) to make sure the driver is not in current limiting mode. SRS Residual Gas Analyzer 9-12 Built-in Hardware Checks If a problem is detected in any of these checks Bit 4 of STATUS is set, QMF_ERR is updated, and the Error LED is turned on. Filament’s Background Protection mode STATUS Bit affected: 1 Error Byte affected: FIL_ERR Error Reporting Command: EF? Error Codes prefix: FL Power-on check?: No The filament is by far the most carefully protected component of the RGA. When a electron emission current is requested, the RGA biases the ionizer and activates the filament’s heater until the desired electron current is achieved. The Filament LED is turned on to indicate the presence of emission and the filament’s “Background Protection Mode” is automatically enabled to continuously (675Hz) monitor the operation of the filament. The conditions detected during Background Filament Protection are: x Filament not present (burnt or not installed) x Unable to set the requested emission current. If any of these two error conditions is detected while the filament is on, the heater is immediately shut down and the specific problem is reported as follows: 1. 2. 3. 4. 5. Bit 1 of STATUS is set. FIL_ERR is updated Filament LED is turned off. Error LED is turned on. The Leak and Burnt LED’s are updated according to the specific problem encountered. 6. The Electron Multiplier is also turned off. Once detected, a filament error can only be cleared by successfully turning on the filament to a finite electron emission current. It is always good practice trying again, if the first attempt to get emission failed. Please refer to the FL command in the “RGA Command Set” to get more details on the operation of the filament. Important: Background Filament Protection is also automatically enabled while the ionizer is in the Degas Mode. SRS Residual Gas Analyzer 10-1 Chapter 10 RGA Circuit Description This chapter describes the electronics circuits located inside the Electronics Control Unit of the RGA. There are no electronics components inside the RGA Probe. The information in this chapter is provided for the use by qualified technical personnel during service and repairs. Warnings x The ECU is to be serviced by qualified technical personnel only. There are no user serviceable parts inside. x Dangerous voltages, capable of causing injury or death, are present in this instrument. Use extreme caution whenever the ECU covers are removed. Do not remove the covers while the unit is plugged in. x Always disconnect the power before removing the covers of the ECU. In This Chapter Overview of the RGA ............................................................................................................................ 10-3 Circuit Description................................................................................................................................ 10-4 General Description.................................................................................................................. 10-4 Circuit Boards ........................................................................................................................... 10-5 Description of Schematics................................................................................................................... 10-6 Schematic name: QMSE_T1 .................................................................................................... 10-6 Microprocessor ....................................................................................................................... 10-6 Digital I/O Ports...................................................................................................................... 10-6 The LED port.......................................................................................................................... 10-7 The MPX port ......................................................................................................................... 10-7 The MISC port........................................................................................................................ 10-7 Clocks ..................................................................................................................................... 10-7 RS232 Interface ...................................................................................................................... 10-8 Schematic name: QMSE_T2 .................................................................................................... 10-8 I/V calibration ......................................................................................................................... 10-8 SRS Residual Gas Analyzer 10-2 A/D Conversion ......................................................................................................................10-8 Power-up Conditioning ...........................................................................................................10-9 Schematic name: QMSE_T3)....................................................................................................10-9 DC Control Voltages...............................................................................................................10-9 RF Amplitude Detection .........................................................................................................10-9 RF Amplitude Control...........................................................................................................10-10 Foldback Current Limiting....................................................................................................10-10 Schematic name: QMSE_B1. .................................................................................................10-11 Mass filter RF Supply ...........................................................................................................10-11 DC Potentials ........................................................................................................................10-12 Schematic name: QMSE_B2. .................................................................................................10-12 Filament Heater Supply.........................................................................................................10-12 Bias Regulators .....................................................................................................................10-13 Schematic name: QMSE_B3 ..................................................................................................10-14 Power Supplies......................................................................................................................10-14 Schematic name: QMSE_V1...................................................................................................10-14 Signal Conditioning ..............................................................................................................10-14 Schematic name: QMSE_V2...................................................................................................10-15 Electron Multiplier High Voltage Power Supply ..................................................................10-15 SRS Residual Gas Analyzer Overview of the RGA 10-3 Overview of the RGA The SRS RGA is a mass spectrometer consisting of a quadrupole probe, and an Electronics Control Unit (ECU) which mounts directly on the probe’s flange. The quadrupole probe is a mass spectrometer sensor consisting of an ion source, a quadrupole mass filter, a Faraday cup and an optional electron multiplier (Option 01). Ions are created from the residual gas of a vacuum system by electron impact ionization. Ions of a particular mass-to-charge ratio have stable trajectories through the mass filter, depending on the DC and RF voltages applied to the quadrupole rods. The selected ions are collected in a Faraday cup or multiplied in an electron multiplier. The ECU box (3” x 4” x9”) contains all the electronics necessary to operate the RGA. It connects directly to the probe’s feedthru flange, and also to a host computer. Its regulated power supplies set the ionizer voltages, the filament’s electron emission current, the high voltage across the electron multiplier and the RF/DC levels on the quadrupole filter. A logarithmic transconductance amplifier converts ion currents into voltages that are read by an A/D converter. A microprocessor and control firmware direct the operations of the spectrometer, the data acquisition, and the communications through the RS232 serial link. The electronics operate from a single 24 +/-2 V DC power supply. The peak current requirement is about 2A. A universal input (90-264VAC, 47-63Hz) switching power supply is provided as an option (Option 02) so that the system may be operated directly from a line cord. SRS Residual Gas Analyzer 10-4 Circuit Description Circuit Description General Description The specifications and features of the many circuits that drive the RGA are determined by characteristics of the quadrupole mass spectrometer such as: x the ionizer settings available to the user, x the characteristics of the quadrupole mass filter, x the magnitude of the ion current levels detected during measurements, x an optional electron multiplier. The ionizer consists of a dual thoriated iridium filament heated by a current of about 3A at 1.7V. The filament and the associated repeller shield are held at a negative potential between -13 and -97V, determined by the electron and ion energy settings (Vrepeller = ion energy - electron energy). Electrons from the filament are accelerated toward the anode grid cage, which is held at a positive potential of +8 (low) or +12V (high). The 25105 eV electrons ionize residual gas molecules in the grid cage. The ions are then injected into the mass filter, aided by the focus plate, which is held at a negative potential of about -90VDC (adjustable from 0 to -150V) to optimize the throughput of the mass filter and to deflect electrons. The mass filter requires two potentials be applied to two pairs of rods. The potentials are given by: Vx/y(t) = +/- [ U + V0 cos(Zt) ], where U is a DC potential amplitude and V0 is an RF potential amplitude. The physics of the quadrupole mass filter show that the resolution of the instrument improves with the frequency Z Sf( the ions interact with the RF field for more cycles ), however the required RF amplitude increases with the square of the frequency. An operating frequency f=2.7648 MHz requires an RF amplitude, V0, of 1284 V (2568 Vpp) to measure ions with mass of 300 amu (8.56 Vpp/amu.). The ratio of DC to RF amplitude, U/V0, controls the fractional mass resolution, M/'M. For f= 2.7648 MHz, the DC potential, U, will +215VDC on one rod pair, and -215 VDC on the other, for masses of 300 amu. The rod structures are primarily capacitive, so to reduce the circuit drive requirements, the rod reactance is resonated with an inductance. The advantages of this resonant drive circuit is the primary reason for operation at a fixed frequency. Ions with the selected mass are collected in a Faraday cup. The ion currents can be very low, a few femtoamps, and have a very large dynamic range, up to about 100 nA. A log I/V converter capable of simultaneously measuring ion signals over several orders of magnitude is a natural choice. Low Pass filtering of the signal is essential in the presence of the large rod potentials. To improve the detection limit, by overcoming the noise floor imposed by the I/V converter, an electron multiplier may be used. The electron multiplier needs to be biased with as much as -2500VDC to provide gains as large as 107. SRS Residual Gas Analyzer Circuit Description 10-5 Circuit Boards There are two main PCBs inside the ECU package. The top PCB has the CPU, RS232, digital ports, the analog electronics for A/Ds and D/As, and the RF amplitude detection circuit. A small vertical PCB which holds the log I/V converter connects to the top PCB. A second small vertical PCB holds the electron multiplier’s HV supply. A third small vertical PCB is used to pass signals and power between the two main PCBs. The bottom PCB holds all of the power electronics for the RF, filament heater, ionizer bias, and system power supplies. Four PCB’s between the two main boards are used: 1. To connect to the probe. 2. For the I/V converter. 3. To pass signals between the main boards. 4. To supply High Voltage to the CDEM. SRS Residual Gas Analyzer 10-6 Description of Schematics Description of Schematics Schematic name: QMSE_T1 Microprocessor An MC68HC11E9 microcontroller is used to control the system and to communicate with the host computer. This central processing unit (CPU) also has RAM, ROM, EEPROM, UART, octal 8-bit A/D converter, counter timers, and a multiplexed address/data bus to accommodate an external 32Kx8 RAM. The ROM is used for program storage, the RAM for data storage, the EEPROM contains calibration values for the particular unit. The power-up reset and power-fail interrupts are provided to the CPU by U100, a MAX705. Digital I/O Ports The microprocessor’s I/O ports are assigned as follows: PA0 PA1 PA2 PA3 PA4 PA5 PA6 PA7 -RTS -BUSY CAL_EN LE_DAC18 -CS_DAC8 LD_LEDS LD_MPX LD_MISC Low indicates that the host computer is ready for RS232 data. Low indicates that the 16-bit signal A/D converter is busy. High enables modification of EEPROM calibration data. Set high to latch SPI data into 18-bit (RF control) D/A converter. Strobe low to assert CS to octal 8-bit DAC. Strobe high to load LED data into output register. Strobe high to load multiplexer data into output register. Strobe high to load miscellaneous data into output register. PB 0-7 A8-15 High address bits for external RAM PC 0-7 A0-7 & D0-7 Multiplexed address and data bits for external RAM PD0 PD1 PD2 PD3 PD4 PD5 RXD TXD SPI_IN SPI_OUT SPI_CLK -CTS RS232 data received from host computer. RS232 data transmitted to host computer. Serial peripheral interface data from 16-bit A/D converter. Serial peripheral interface data to 8 and 18-bit D/A converters. Serial peripheral interface data clock. Low to allow host computer to send RS232 data. PE0 PE1 PE2 PE3 PE4 PE5 PE6 PE7 +24/6 RF_CT/5 RF_PRI GND GND FOCUS_I FIL_DUTY FIL_PRI A/D input: +24VDC supply divided by 6. A/D input: RF primary voltage divided by 5. A/D input: RF primary current: 1V/400mA A/D input: 0 VDC A/D input: 0 VDC A/D input: focus plate ion current: 1V/5PA A/D input: filament heater duty cycle: 1V/20% A/D input: filament heater primary current: 3V/A SRS Residual Gas Analyzer Description of Schematics 10-7 In addition to the I/O port on the microcontroller, there are three 8-bit digital shift registers which are loaded via the SPI, then strobed by a LD bit to transfer data to the parts’ output registers. The three digital output ports are assigned as follows: The LED port Q0 Q1 Q2 Q3 Q4 Q5 Q6 Q7 Set high to light an LED to indicate that the +24V power supply is “okay”. Set high to light an LED to indicate that the filament is “on”. Set high to light an LED to indicate that the unit is degassing. Set high to light an LED to indicate that the CDEM high voltage is “on”. Strobe high to set I/V converter to LOG mode Set high to light an LED to indicate that there has been an error. Set high to light an LED to indicate that the pressure is too high. Set high to light an LED to indicate that the filament is burnt-out. The MPX port Q0 Q1 Q2 Q3 Q4 Q5 Q6 Q7 CAL_0 CAL_1 CAL_2 MPX_0 MPX_1 MPX_2 EMIT_CTL GRID_SEL LSB of current detector calibration attenuator multiplexer. Middle bit of current detector calibration attenuator multiplexer. MSB of current detector calibration attenuator multiplexer. LSB of 16-bit A/D converter's input multiplexer. Middle bit of 16-bit A/D converter's input multiplexer. MSB of 16-bit A/D converter's input multiplexer. Filament heater duty cycle control: 0=direct, 1=regulate Low for low grid potential, high for high grid potential. The MISC port Q0 Q1 RF_ON IONS_OFF Low to turn-off RF, high to turn on. Pulse high for 50 ms to reset relay and ground FC Q2 Q3 Q4 Q5 Q6 Q6 IONS_ON MULT_OFF MULT_ON LINEAR R/-C CS_VETO Pulse high to set latching relay so FC signal enters I/V. Pulse high to ground e-multiplier anode. Pulse high to connect e-multiplier to I/V. Pulse high for linear I/V converter (offset calibration). Set high to read 16-bit A/D, low to initiate conversion. Set high to prevent (or release) -CS to 16-bit A/D converter. Clocks The master clock of the system is an 11.0592 MHz crystal oscillator. This frequency was selected for the following reasons: 1. It is close to the maximum operating frequency for the 68HC11 (12 MHz). 2. When divided by four it provides a usable RF frequency (2.7648 MHz). 3. When divided by 128 it provides a clock for switching power supplies (86.4 kHz). 4. When divided by 256 it provides a clock for the high voltage DC-DC converter. 5. When divided by 384 it provides an exact PC baud rate (28.8 kbaud). 6. When divided by 214 it provides a A/D convert rate (675 Hz). SRS Residual Gas Analyzer 10-8 Description of Schematics Since the A/D convert rate is a sub-multiple of all the other system clocks, crosstalk from the clocks will be synchronous, and will generate a fixed offset to the signal (which may be measured and subtracted) instead of noise. The clock division for the 28.8 kBaud rate is done by the microcontroller; the rest of the clock division is done by U108, a 74HC4020 14-stage ripple divider. The 172.8 kHz square wave is formed into a 100 ns wide pulse to be used as a switching power supply sync pulse, which is divided by two by the power supply controller. U109, a 74HC74 dual D-type flip-flop, provides the complimentary drive required for the RF and highvoltage inverter circuits. Either of these drives may be turned off (both Q and -Q outputs set high) by setting the control bits RF_ON or HV_ON low. RS232 Interface The microcontroller communicates with a host computer via the RS232 interface. The RS232 interface is configured as a DCE (data communications equipment) at a fixed baud rate of 28.8k, with hardware handshaking via CTS (clear-to-send) and RTS (request-to-send), and uses a PC compatible female DB9 connector. So, the quadrupole will transmit data on pin 2, receive data on pin 3, assert CTS on pin 8, and look for RTS on pin 7. Pin 5 is the signal and chassis ground. Schematic name: QMSE_T2 I/V calibration The current signal from the Faraday cup or electron multiplier is converted to a voltage by the logarithmic I/V converter (see schematic QMSE_V1). This converter requires careful calibration and bias in order to assure accurate readings over its 8 decade range. A programmable voltage source (U209 and associated components) can provide voltages from microvolts to volts, which are applied to the I/V converter via a 1G: resistor to generate calibration currents from femtoamps to nanoamps. The calibration source is also used to bias the I/V converter during scans to establish the bandwidth/noise floor tradeoff. A second I/V converter channel is biased by the calibration source to allow for temperature compensation of the detection channel. Both I/V converters are biased by equal currents from the calibration source, so that their output voltages are nearly the same when there is no ion current being detected. The outputs of each I/V converter may be read via the 16-bit A/D for calibration and offset nulling. The outputs of the I/V converters are subtracted in a differential amplifier (U211A) with a gain of 5.23 and a bandwidth of 1 kHz. The differential amplifier is followed by a Butterworth filter (U211B) with a gain of 1.59, a -3 dB point of 300 Hz, and a roll-off of -12 dB/octave. The filter is used to reduce the noise on the signal which is above the Nyquist bandwidth for a 675 Hz sampling rate. (In low bias current cases, the bandwidth of the signal is much lower, per the diode time constant.) R233 insures that the output of the filter cannot exceed the +/-5V range of the 1:8 multiplexer at the input to the 16-bit A/D converter. A/D Conversion Several different signals and a ground reference may be multiplexed to a 16-bit A/D converter by U201, a 74HC4051. The control bits MPX_0-2 are used to select one of the 8 inputs. The selected input is amplified by U202A by 2x to scale the input for the +/10V range of the A/D converter, U203. SRS Residual Gas Analyzer Description of Schematics 10-9 The CPU can measure the offset of the input multiplexer, op-amp, and A/D converter by selecting input X7 (the circuit ground). The measured offset is subtracted from readings taken for the other inputs. A conversion is initiated by -CS_ADC16 going low while R/-C is low. -CS_ADC16 is asserted when the 675 Hz convert clock from the 74HC4020 (U108) goes low provided that CS_VETO (MISC port bit 7) is low. The 675 Hz convert clock going low also initiates an -IRQ to the CPU. In response to the -IRQ, the CPU sets CS_VETO high (which sets -CS_ADC16 high) and sets R/-C high to allow the data to be read. The BUSY output will remain low for up to 20Ps during a conversion. When -BUSY goes high, the CPU returns CS_VETO low, which again asserts the -CS_ADC16 (this time with R/-C high), and reads the data from the ADC via the SPI. Since the ADC shifts its data on the rising edge of the data clock (i.e. data should be read on the falling edge of the data clock) the inverted SPI clock is used as the data clock to the ADC. This will also permit simultaneous transmission of data to the 18-bit RF amplitude control D/A. The CPU sets R/-C low after the data is read to prepare the A/D for the next conversion cycle. Power-up Conditioning The A/D reference output (+2.50VDC) is amplified, buffered, and inverted by U302A&B to provide system references of +/-5.00VDC. These references are set to zero volts when the system is reset so that other analog signals (such as the HV and filament control signals) will stay at zero until set by the microcontroller. The triple 2:1 analog switch U301, a 74HC4053, is used to make certain that various circuits remain off when the system is reset, until the CPU can establish the system environment. Upon reset the dual flip-flop U300 is reset. The output of the second flipflop, which controls all three channels of the analog switch, will return high with the second port strobe from the CPU to the MISC bits port. Immediately following a reset, EMIT_CTL will be low (to multiplex EMIT_SET to control the duty cycle of the filament heater circuit directly), the r5.00REFs will be set to zero (so that all the analog control signals will be zero), and the output current from the 18-bit DAC which controls the RF amplitude will be shunted to ground. Schematic name: QMSE_T3) DC Control Voltages U307, a MAX528 octal 8-bit DAC, provides DC voltages to control various parameters in the system. Each output has a range from 0 to 4.98V with a step size of about 19.5 mV. The eight outputs and their functions are listed here: 0 1 4 3 7 5 5 6 RES_CTL EMIT_SET RPL_SET FOC_SET HV_SET +OFFSET -OFFSET CAL This output (-2.5V and times 1) increases the rods' DC. This output (times 1 or 10mA/V) sets the emission current. This output (times -20) sets the repeller and filament bias. This output (times -30) sets the focus plate bias. This output (times -500) sets the electron multiplier bias. This output (-2.5 & times .001) fixes the detector offset. This output (-2.5 & times .001) fixes the reference offset. This output (-2.5V then times -2) is the calibration source. RF Amplitude Detection The amplitude of the RF is detected by a full-wave charge pump detector. In order to provide a symmetrical load to the generator, the amplitude on both rods is detected and SRS Residual Gas Analyzer 10-10 Description of Schematics summed. The charge pump works as follows: as the potential on the rod reaches a peak, the 0.5 pF capacitor (C750 on the PCB which holds the flange socket) is charged to the maximum voltage, Vp + Vdc - Vdiode with current flowing to ground via D303, a Schottky diode. During the next half cycle, C750 is charged to -Vp + VDC + Vdiode with current flowing through D302 from the virtual ground at the inverting input of U305. The total charge transfer to the op-amp is C x dV = C x (Vpp-2Vdiode). This charge is pumped every cycle from two charge pumps, so the current is I = 2fC(Vpp2Vdiode). For C=0.5pF and f=2.7648 MHz, and ignoring Vdiode, the current is 2.76PA/Vpp. This current flows through the 698: feedback resistor, R312 in parallel with R322, which is selected to calibrate the detector’s sensitivity. The output of the charge pump’s I/V converter (U305) is filtered and attenuated by the 3rd order elliptic filter (C303-305 and L300) which has a characteristic impedance of 200: and a notch at 5.6MHz, which corresponds to the second harmonic of the detected RF signal. The potentiometer at the output of the filter (P300) is adjusted to provide a voltage of Vpp/1000. This signal is used as the feedback signal to control the RF amplitude. The adjustment of P300, the RF amplitude detection gain potentiometer, is very important in order to maintain constant resolution and sensitivity throughout a scan. P300 should be adjusted so that He and Kr have the same resolution with RES_CTL at a fixed nominal level of +2.50VDC. From here, empirical adjustments to RES_CTL vs. amu may be made to optimize the instrument's performance, but to first order, RES_CTL will be a constant. (Factory cal only with DS=0.) RF Amplitude Control The detected RF amplitude signal, VPP/1000, is compared to the RF level control (RF_SET) from the 18-bit DAC U303. If the detected level is below the set level then the output of U306 slews upward, increasing the primary drive, increasing the RF level, until the RF level reaches the set level. U306 is configured as a differential amplifier with a gain of 5, which uses the ground reference from the bottom PCB, so as to reduce the effects of noise and ground offsets between the PCBs. The CPU may scan the mass filter by ramping the 18-bit DAC output between 8.56mV (for 1 amu) and 2.56V (for 300 amu). Foldback Current Limiting The RF output is approximately linear in the RF primary drive current. The scale factors for the detected RF_SET and the measured RF primary drive current (RF_PRI = 1.5V/A) were chosen so that RF_SET should always be larger than RF_PRI if the system is operating properly. In the case of a failure which causes excessive primary drive current, the output of the difference amplifier, U304B, goes positive as RF_PRI goes above RF_SET. The output of U304 will limit the primary drive current as the current through D304 increases. In this case, which is detected by the CPU as RF_PRI>RF_SET, the RF level will be less than the level set by the 18-bit DAC. The 18-bit DAC output is also used to set the DC potentials applied to the mass filter. RF_SET is multiplied by 4 by the differential amplifier U304A, which uses the bottom PCB for its ground reference. The output of U304A is passed to the bottom PCB via JP301 to control the DC bias sources. SRS Residual Gas Analyzer Description of Schematics 10-11 Schematic name: QMSE_B1. Mass filter RF Supply The Toroid: The design approach was dominated by the characteristics of the RF transformer. This iron-powder toroid provides a step-up of 39:1 for the RF. The secondaries have a self-inductance of about 16 µH so as to resonate at 2.7648 MHz with the capacitive load presented by the rods in the mass filter together with the parasitic capacitance of the secondaries. The primary of the transformer is a single turn driven by a square wave voltage at 2.7648MHz through a series inductor (T401) of 0.5PH. The step-up transformer is driven slightly off resonance, so that its input has a capacitive reactance, which resonates with the 0.5PH inductor at the drive frequency. This approach is used to reduce power losses in the drive circuit (the FETs are switched when the current is nearly zero), and to reduce the distortion in the RF output (as the drive current is very nearly sinusoidal). Due to variations in the core material used in the step-up transformer, each unit must be tuned by adding capacitors across the primary. This is done by programming the unit to operate at 100 amu, and by finding the combination of capacitors (connected between J401 and J403) which minimize the drive voltage as measured at J400 (which is RF_CT/5). Polypropylene capacitors with a voltage rating of 50V are used to tune the primary reactance for minimum power loss. The 39 turn secondaries are wound in a very special fashion: the two windings are placed side-by-side so that the magnetic flux seen by the two windings is very nearly identical. Measurements on these transformers show a difference in self-inductance between the two secondaries of less than 0.1%. This is important to assure that the magnitude of the RF for the two secondaries will be very nearly equal. Silver plated, Teflon coated wire is used for the secondaries to reduce skin effect losses and to minimize interwinding capacitance, and to reduce the loss tangent in the dielectric. Primary Drive: The square wave voltage drive is provided by a pair of IRF510 MOSFETS, Q402 and Q403. Theses FETs have delay and transition times on the order of 25 ns, and are operated as switches. The gates of the FET’s are driven by complimentary square waves at 2.7648MHz with 50% duty cycles from U401, an SN75372. Each FET is on for about 180 ns. The amplitude of the square wave drive is controlled by the DC supplied by Q401, a D44VH10 high speed npn power transistor. The op-amp U400 integrates the error signal from U306 on the top PCB to maintain the detected RF equal to the signal “RF_SET” from the 18-bit D/A. The primary current is passed through the FET's 0.25: source resistor. The voltage across this resistor is amplified by U402B and may be read by the CPU. Approximately 1.5A is required to generate 2568Vpp required at 300 amu. At low drive levels, the charge injected via the gate-source and gate-drain capacitances of Q402/403 are a significant source of error. To compensate, the network of R413, R414 and C406 couple a signal with the correct amplitude and phase into the primary drive inductor, T401, to cancel the charge injected via the FET gates. SRS Residual Gas Analyzer 10-12 Description of Schematics DC Potentials In addition to the RF, DC potentials of about r1/12th the RF peak-to-peak value is required for the two rod pairs. The op-amp U403A is the error amplifier which maintains the negative potential equal to a fraction of the set RF level. When DC_SET goes up, the output of the op-amp goes up, increasing the current in Q406, increasing the current in Q407, bringing down the collector of Q407, which is the output of the negative potential voltage regulator. The op-amp U403B is the error amplifier for the positive potential. The positive potential is compared to the negative potential by R431 and R432. When the negative potential increases, the non-inverting input to U403B will go down, lowering the op-amp output, increasing the current in Q405, increasing the current in Q404, thereby increasing the positive potential until it matches the magnitude of the negative potential. Schematic name: QMSE_B2. Filament Heater Supply The sensitivity of the quadrupole depends on the filament emission current, which depends on the filament temperature and bias with respect to the grid. As the grid to filament bias is fixed to optimize the electron impact ionization cross section, the filament emission current is controlled by controlling the filament temperature via the filament heater current’s duty cycle. A switching power supply, which is synchronized to a sub-multiple of the master clock at 172.8 kHz, is used to provide heater power to the filament. (Note that two clocks are required for each cycle, so the primary drive current is at 86.4 kHz.) The switcher’s transformer has a 6:1 turns ratio, reducing the +24V input to a 4V output, which leaves about 3.5V after rectification in the dual Schottky diode, D501. The primary of the transformer is operated from the +24VDC supply, and is driven differentially by a pair of IRF530 MOSFET’s. An LT3525 switching controller, U501, is used to drive the FET gates. The duty cycle of the gate drive depends on the voltage at the COMP pin (pin 9). A voltage of about 0.9V or below will set the duty cycle to zero. The duty cycle increases to a maximum near 50% (for each gate) as the voltage on this input is increased to about 3.3V. The analog switch, U500, controls the source of the signal to the COMP pin. If EMIT_CTL is low (as it is after a reset) then the DAC signal EMIT_SET is connected directly to the COMP pin allowing for direct control of the filament heater’s duty cycle by the CPU. This mode is used when the filament is first turned “on” to verify that the pressure is low enough to allow the filament to remain “on”. When EMIT_CTL is set high, the COMP pin is connected to the compensation capacitor C500, which will be charged and discharged by the transconductance error amplifier in U501. The error amplifier will compare the EMIT_SET voltage (or the attenuated EMIT_SET voltage, depending on the state of the DE_GAS bit) to the voltage seen on the 100: emission current shunt resistor, R522. (The current sensed by this resistor is actually composed of three components: the filament emission current, the repeller voltage/100k:, and Vref (+5V)/30k:. All of these components sum. With a repeller voltage of -60V, the two non-emission sources sum to 0.60 + 0.166 = 0.766 mA. So, to set an emission current of 2 mA, EMIT_SET, which provides 1 mA/V, is set to SRS Residual Gas Analyzer Description of Schematics 10-13 2.766VDC.) The emission current may be set to values as high as 50 mA during the degas procedure. The primary side current drive may be sensed in the 0.5: FET source resistor. The voltage across this resistor is filtered and amplified by 6X, and may be measured by the CPU. The duty cycle of the FET switches may also be measured by the CPU via the voltage labeled "FIL_DUTY". A drop of about 40% in the primary side current for a particular duty cycle value indicates that one of the two parallel filaments has burnt out. A drop of 90% indicates that both filaments are missing. If the source sense resistor voltage reaches 1V (when the primary side current reaches an instantaneous value of 2A) the LT3525 will terminate the gate drive to FET for the remainder of the cycle. This feature protects the circuit in the case of a short circuit or other severe fault. Bias Regulators The regulated repeller and focus plate biases are controlled by the CPU. The set voltages, RPL_SET and FOC_SET are multiplied by -20 and -30, respectively, by the bias regulators. If the control signal RPL_SET is increased, the non-inverting input (and so the output) of the op-amp U502B will go up, increasing the current in the opto-isolator’s LED, increasing Q502’s collector current, increasing the magnitude of the (negative) repeller bias. If the control signal FOC_SET is increased, current is injected via the 61.9k: resistors R538 and R539 directly into the emitter of Q506 and away from the emitter of Q505 which are biased at ground. These currents are mirrored by Q503/504 and Q507/508 to the output node, which has a 1M: resistance to ground via R531, providing an overall gain of -30. Imbalances in currents due to focus plate currents or current mirror mismatches are made up by the op-amp U504A. If the output is smaller (less negative) than it should be, the non-inverting input to U504A will be positive, causing its output to ramp up. This increases the current into the emitter of Q506 and decreases the current into Q505. These currents are mirrored to the output, increasing the current in Q508 and decreasing the current in Q504, pulling the output more negative. The output of U504A will go up by 1V for each 1PA of ion current collected by the focus plate. The output may be digitized by the CPU to monitor the ion current in order to watch for excessive operating pressure. Since the focus plate may collect ions when set to any potential below the grid potential, and since it may collect electrons when set to any potential above the repeller voltage, the focus plate regulator is designed to sink or source current. The grid voltage is supplied by the op-amp U502A. This op-amp is operated with a gain of six to amplify the voltage selected by the analog switch U500. The op-amp is protected from possible discharges, which would connect the grid to the repeller potential, by R517 and D500. For a high power de-gas, a DPDT relay is used to by-pass the bias regulators, connecting the grid and repeller directly to the un-regulated +250Vdc and -150Vdc supplies. During SRS Residual Gas Analyzer 10-14 Description of Schematics de-gas, the filament emission current is set to 20 mA, which will provide about 8W of power to heat the grid, in addition to 15W of filament heater power. Schematic name: QMSE_B3 Power Supplies The unit is operated from +24VDC, and requires up to 2.0A. (The current draw will be the highest when the unit is scanning at the high end of the mass range, or during de-gas.) The unit is protected against power supply reversal by D610. A 5A circuit board mounted fuse limits damage in the case of a severe circuit failure. The DC input is filtered by C615, L601 and C616, which also reduce conducted emissions from the unit. A DC-DC inverter is operated from the +24V supply to provide -140V for the repeller, r250V for the mass filter bias sources, and -20V for the negative linear voltage regulators. The primaries to the inverter are driven by FET’s. A switching power supply regulator, U601, provides 12V square wave drive voltages to the FET’s which are sync’d to a sub-multiple of the master clock. Overcurrent protection is provided by U601 on a cycle by cycle basis. U601 does not regulate the outputs of the inverter, rather, its COMP pin is tied high to provide the maximum duty cycle. The first of three secondaries is full wave rectified by D611-D614. This output is used only to bias the repeller, which allows the filament emission current to be monitored and controlled with high precision. The next secondary has a pair of half-wave doublers (C635, C636, and D615-D618) to provide r250V. The third secondary has a full wave rectifier (D619-D622) to provide -20VDC, which is filtered by C622,C623 and L603. All three secondaries are balanced so that no DC current is drawn in order to avoid saturation in the un-gapped transformer core of T601. The positive power supplies (+15 for the op-amps, +12 for the RS232 and MOSFET drivers, +5_CLEAN for the signal multiplexers and A/D converter, and +5 for the logic circuits) are derived via linear three terminal regulators (U602-605) from the +24V supply. The negative supplies (-15 for the op-amps, -12 for the RS232, and -5 for the A/D and analog multiplexers) are provided by the linear regulators U606-608 from the -20V generated by the main inverter. Schematic name: QMSE_V1 Signal Conditioning The output from the mass filter is a very small ion current which is proportional to the pressure of the selected mass. The lowest pressure which may be measured by the instrument is proportional to the lowest current which may be detected. Extreme care is required to achieve low drift and low noise current measurements at these very low current levels. In addition, the instrument needs to measure a wide range of pressures, which requires current measurements over a wide range. The sensitivity of the ionizer and mass filter is about 100PA/Torr, and is nearly constant from 0 to 5x10⁻⁵ Torr, so we expect ion currents from 0 to 5 nA. To accommodate this large dynamic range, a log I/V converter is used, whose output is amplified, filtered, and digitized by a 16-bit A/D converter. (The high resolution A/D is required to assure that SRS Residual Gas Analyzer Description of Schematics 10-15 the quantization noise of the A/D is smaller than the shot noise of the I/V converter's bias source, and to provide sufficient resolution.) At the core of the detection system is the log I/V converter. A standard arrangement is used, where the current is applied to the inverting input of a very low bias current op-amp (U700) and a diode is used between the output and the inverting input of the op-amp. Small signal JFETs transistors (Q700/701) are used as diodes, as they have well characterized (and very low) reverse gate leakage currents. A programmable current source is also applied to the inverting input of the op-amp. This source serves two purposes: it is used to calibrate the gain of the I/V converter (which changes with temperature), and it provides a bias current to the diodes during data collection. As a calibrator, the current source can output currents from 0 to 5 nA. As a bias source, it is programmed to provide 500 fA to 64 pA depending on the speed and sensitivity required for a scan. (High speed scans require high bias currents which reduce the time-constant though the diode, and high sensitivity scans require low bias currents to reduce the shot noise of the bias current source.) At 500 fA bias current, the Johnson noise current of the 1G: current source resistor (about 4 fA/Hz) establishes the noise floor for ion current measurements. At higher bias currents, the shot noise of the bias current establishes the noise floor. For example, shot noise associated with a 500 pA bias current is about 12.7 fA/Hz. In addition, the bandwidth of the detector increases with bias current, increasing the noise. Back-to-back diodes are used to allow either ion currents (Faraday cup case) or electron currents (electron multiplier case) to be measured. During calibration procedures, the ion current is shunted to ground by a latching relay, U701. A latching relay is used so that the relay coil will not be active during either calibrations or measurements. The input offset voltage of the I/V converter's op-amp is nulled prior to calibrating the converter's gain. This is done by strobing the MISC port bit (LINEAR) high, which activates the relay U702, configuring the op-amp to a linear amplifier with a gain of 1001 for it's own input offset voltage. The CPU then adjusts +OFFSET to null the output of the op-amp, nulling it's input offset voltage. The I/V converter is returned to the log mode by strobing the LOG bit high. A second and identical I/V converter resides next to the I/V converter described above. The second I/V converter is operated and calibrated in the exact same manner, however, collected ion currents are not applied to its input. The primary purpose of the second channel is to correct the output of the first I/V converter against temperature effects. Schematic name: QMSE_V2 Electron Multiplier High Voltage Power Supply The electron multiplier option extends the operation of the RGA to much lower pressures. By multiplying the ion current before detection in the I/V converter, the signal to noise ratio is not affected by the bias current noise of the I/V converter. Since the gain of the electron multiplier varies rapidly with applied bias, well regulated negative high voltage supply is required. A switching power supply, synchronized to a sub-multiple of the master clock at 43.2 kHz, followed by a voltage multiplier, is used to generate a negative high voltage. The SRS Residual Gas Analyzer 10-16 Description of Schematics multiplier output is compared to the set level (HV_SET) by an error amplifier (U800A) which controls the voltage on the center tap of the primary via Q800. The primary current in the HV inverter is sensed by R814, a 2.2: resistor. If the primary drive exceeds 230 mA, the output of the difference amplifier U800B will go positive, reducing down the primary drive level. The HV power supply piggy-backs off the vertical interconnect PCB in between the top and bottom PCBs. The HV power supply will only be installed in units which are ordered with the channel electron multiplier option. SRS Residual Gas Analyzer 11-1 Chapter 11 RGA Probe Assembly This chapter contains two RGA probe assembly drawings. In This Chapter RGA Probe Assembly Schematic......................................................................................................... 11-3 Feedthru Flange Connectors Schematic............................................................................................. 11-4 O100MAX Maximum Insertion Nipple Drawing................................................................................... 11-5 SRS Residual Gas Analyzer 11-2 SRS Residual Gas Analyzer Appendix A 1 Appendix A Vacuum Diagnosis with SRS RGA’s Introduction Residual Gas Analyzer (RGA) is the term for a class of mass spectrometers. They are all quadrupole mass spectrometers and typically cover mass ranges from 1 to 100 or 200 amu (atomic mass units). The RGA’s resolution is sufficient to clearly distinguish peaks that are 1 amu apart. They are designed for the analysis of the gases present in high and ultra high vacuum systems. The specifications of the RGA are a perfect match for vacuum diagnosis. Not many materials with a mass greater than 200 amu will be volatile, and so a small mass range is suitable. The high resolution of a research grade mass spectrometer is not necessary for the analysis of low molecular weight species. Overall, RGA’s are affordable instruments that can be permanently attached to a vacuum system. Experiments and processes are performed under vacuum for two main purposes: to lower the total pressure to a suitable level and to provide an extremely clean environment. An ion gauge addresses the first purpose, but only an RGA can address the second. The high sensitivity of some processes to specific impurities makes the goal of cleanness more difficult to achieve than the required total pressure. A typical method of making a system cleaner is to lower the total pressure. The assumption being that the partial pressure of the impurities is directly related to the total pressure. This assumption fails in two ways. First, it is simply not true; a total pressure measurement cannot tell the user tell the user the level of impurities. As an example, a system operating at a total pressure of 1.1 u 10-8 mbar might consist of 1.0 u 10-8 mbar of water due to outgassing and 0.1 u 10-8 mbar of air due to a leak. An overnight bake out of the vacuum system reduces the total pressure to 0.2 u 10-8 mbar; 0.1 u 10-8 mbar is water and 0.1 u 10-8 mbar is air. Is the vacuum system cleaner than before the bakeout? If the process or experiment is sensitive to oxygen, the system is no cleaner than before the bakeout. Second, the assumption fails because total pressure measurement is not very precise; measurements more precise than 10% are difficult and expensive. If a system is operating at a standard pressure of 1.0 u 10-7 mbar and the next day the pressure is 1.1 u 10-7 mbar would there be cause for concern? The vacuum system could be filled with 10% oil vapor or the pressure gauge sensitivity could have changed 10%. The RGA is designed to address exactly these types of questions, by immediately showing the user what is in their vacuum system. The primary application of the RGA is to analyze the composition of a vacuum system. The composition can be used to detect impurities, monitor gas fills, or analyze ongoing chemistry. Another application of the RGA is as a leak detector. It serves this use very well and in many ways is superior to a portable helium leak tester. In the remainder of this application note we will illustrate the usefulness of an RGA. The data shown are real results from experiments designed to illustrate certain points. SRS Residual Gas Analyzer 2 Appendix A Composition Analysis The SRS RGA software allows the composition of the vacuum system to be analyzed by two methods. The most common is to measure the mass spectrum of the vacuum. This provides a “fingerprint” of the residual gases in the vacuum system. A second method is to track specific species or peaks of the mass spectrum. The first method, analog scan mode, is most useful when the user does not know what is present in the chamber. Once the identities of the species have been determined, individual peaks can be tracked using either pressure vs. time, table or annunciator mode. The Mass Spectrum The fundamental operation of the RGA is as a mass spectrometer. Figure 1 shows a graph of partial pressure versus mass, which was measured with an RGA with an electron multiplier detector. Ultimate Vacuum Torr 1.0x10 1.0x10 1.0x10 1.0x10 1.0x10 1.0x10 -7 -8 -9 -10 -11 -12 1.0x10⁻¹³ 1 3 5 7 9 11 13 15 17 19 21 23 25 27 29 31 33 35 37 39 41 43 45 47 49 m/z Figure 1: Partial Pressure vs. Mass The scan was taken of a vacuum system near its ultimate vacuum. The pressure axis is plotted on a logarithmic scale so that a large range can be seen. The log scale makes the peaks appear wider than when plotted on a linear scale. This scan from 1 to 75 amu shows some gases commonly present in vacuum chambers. There are many peaks, but they are caused mainly by 7 species: Hydrogen is at 2 and helium at 4. Water gives primary peaks at 16,17, and 18 due to the species O+, HO+, and H2O+ . The smaller peaks at 19 and 20 are due to 18O which is naturally present at 0.2%. Nitrogen is at 28 and also causes the peaks at 14 by atomic N+ and the doubly ionized N2+. Molecular oxygen shows a peak at 32 and an isotope peak at 34. Argon shows a peak at 40. Carbon SRS Residual Gas Analyzer Appendix A 3 dioxide shows a peak at 44 and a peaks for CO2++ and C+ at 22 and 12. The other peaks are caused by fragments of these species and contaminants. The presence of air components in the spectra might lead us to believe that the system is leaking, but this is untrue. The hybrid turbomolecular pump has simply reached its compression limit. The foreline of the pump was operating at a total pressure of 0.5 Torr; thereby the compression ratio is in the 108 range (as the pump specifications indicate). Nitrogen, oxygen and argon are all present in the same ratios as standard atmosphere. The presence of helium is interesting, because it is present in the atmosphere at about 7 ppm. Its peak might be expected 6 decades smaller than the nitrogen peak. The low compression ratio of the turbo pump for helium (105) explains why the peak is only three decades smaller. The ability to detect these common species and many others is the essence of the RGA. The fragmentation of molecules in the ionizer of the RGA gives each molecule a distinct fingerprint. The fragmentation patterns for many molecules is available from the library in the SRS RGA program. Keeping a historical record of the typical spectrum of a vacuum system allows the appearance of peaks to be instantly detected. For instance, the peak at 48 in Figure 1 is SO from SO2 (a matching peak at 64, not shown on the figure confirmed this). On occasion this peak is seen in our chambers. If SO2 appeared in your vacuum system would you want to know? In addition to these simple gases, we are interested in molecules with higher weights. The next two examples show how oil and solvents can be detected. Oil Contamination Figure 2 contains a mass spectrum of a common contaminant of vacuum systems, oil. The top pane is the measured spectrum and the bottom pane is the library data. SRS Residual Gas Analyzer 4 Appendix A Vacuum Diagnosis Torr 1.2x10 -8 1.1x10 -8 9.6x10 -9 8.4x10 -9 7.2x10 -9 6.0x10 -9 4.8x10 -9 3.6x10 -9 2.4x10 -9 1.2x10 -9 0 1 4 7 10 13 16 19 22 25 28 31 34 37 40 43 46 49 52 55 58 61 64 Atomic Mass Units Figure 2a: Pump Oil Contamination Torr 1.0x10 -5 9.0x10 -6 8.0x10 -6 7.0x10 -6 6.0x10 -6 5.0x10 -6 4.0x10 -6 3.0x10 -6 2.0x10 Mechanical Pump Oil MP OIL -6 1.0x10 -6 0 1 4 7 10 13 16 19 22 25 28 31 34 37 40 amu Figure 2b: Library Pump Oil Data SRS Residual Gas Analyzer 43 46 49 52 55 58 61 64 Appendix A 5 The presence of mechanical pump oil is immediately obvious. The peaks at masses 39, 41, 43, 55, and 57 are caused by mechanical pump oil backstreaming into the vacuum chamber during a load lock sequence. The total pressure in the chamber was dominated by water and was less than 2 u 10-8 Torr. In this case, the total pressure might satisfy operating conditions but the spectra reveals that the system is heavily contaminated with oil. This could have been caused by improper valve sequencing or a saturated oil trap. Without an RGA, only operating procedures for valves and a maintenance schedule for traps can ensure that the cleanliness of a vacuum system is maintained. With the RGA, the cleanliness can be guaranteed before a process or experiment begins. Solvent Contamination Oil contamination is common in vacuum systems. Cleaning parts with solvents is a common approach to removing this contamination. We have observed that organic solvents such as acetone and 1,1,1-trichloroethane (TCE) are more tenacious contaminants than the oil they are designed to remove. Figure 3 shows the spectrum of a vacuum system contaminated with TCE as evidenced by the major peaks at 97 and 99, and the minor peaks at 61, 63, 117 and 119. The paired peaks are caused by the natural isotopic occurrence of 35Cl and 37Cl (75% and 25%). This spectrum was measured one week after the initial contact with the solvent. The TCE permeated into the o-rings in the system during a cleaning step. The TCE continued to outgas from the o-rings for two weeks and showed no signs of stopping. At that time they were removed and baked in an oven, which eventually removed the TCE. TCE Contaminated System Torr 1.0x10 -7 1.0x10 -8 1.0x10 -9 1.0x10 -10 1.0x10⁻¹¹ 1 7 13 19 25 31 37 43 49 55 61 67 73 79 85 91 97 103 109 115 121 amu Figure 3: TCE Contaminated System Data like this is invaluable to the development of cleaning procedures. While the TCE successfully removed the oil, the vacuum chamber was left more contaminated than it SRS Residual Gas Analyzer 6 Appendix A would have been without the cleaning. The mass spectrum provides a more accurate evaluation of cleaning procedures than pump down time and base pressure. Just because a system pumps down quickly does not guarantee that undesirable contaminants have been eliminated. The large dynamic range of the RGA also allows evaluations to be made more quickly. After a vacuum system has been brought up to atmospheric pressure, it will require an extended period to pump back down to its ultimate vacuum. If the vacuum system does not quickly reach its ultimate vacuum, the next step is commonly a high temperature bakeout. If the vacuum system has still not reached its ultimate vacuum, problems are suspected and typically a leak tester would be attached to the system. With the RGA, the user does not have to wait several hours for the water to pump down or perform a bakeout before determining if a system is contaminated. The RGA can make measurements as soon as the total pressure reaches 10-5 mbar. The large dynamic range will allow impurities to be seen at 10-10 mbar or leak testing to be performed in the presence of a this high total pressure. Thereby, the RGA allows a great reduction in turnaround time after a vacuum system has been brought up to atmosphere. SRS Residual Gas Analyzer Appendix A 7 Single Mass Measurement For vacuum systems that only need to be clean, the mass spectrum is the most useful measurement. During experiments and processes the partial pressure of certain species is of more interest. The RGA software provides three modes that are used to measure selected peaks. The selection of which mass is associated with which species is usually straightforward, i.e. the mass of the molecule is chosen. When two species have overlapping peak patterns, the user chooses the strongest peak that does not interfere. For example N2 and CO both have a mass of 28. In a system with a large CO interference, N2 could be measured at mass 14. Because the peak at 14 is smaller than the major peak, a scaling factor is required. The set of peaks of interest are entered into the RGA software by the user. During measurements, the RGA measures only each peak. Because the whole spectrum is not measured, data is acquired much faster. The two examples that follow show an interesting pressure vs. time experiment and a method of increasing the dynamic range of measurements. Pressure vs. time Figure 4 shows the use of the P vs. t Mode to monitor an air lock sequence. The process is to open an air lock, place the sample in it, and move the sample into the main vacuum chamber. The air lock is pumped from atmospheric to rough vacuum using the same mechanical pump as the main vacuum chamber. This requires isolating the foreline of the turbo pump during the time the sample is in the air lock. To keep oxygen out of the main vacuum chamber, the air lock is flushed with dry nitrogen then pumped to rough vacuum. The flush is repeated two additional times before the sample is finally transferred. If this procedure is successful, the main vacuum chamber should not be disturbed. SRS Residual Gas Analyzer 8 Appendix A Airlock Sequence mBar 1.0x10 -4 Hydrogen Water 1.0x10 -5 Nitrogen Oxygen 1.0x10 -6 Oil Floor 1.0x10 1.0x10 1.0x10 1.0x10 -7 -8 -9 -10 00:00:00 00:00:37 00:01:15 00:01:53 00:02:31 00:03:09 00:03:46 00:04:24 00:05:02 00:05:40 00:06:18 Time (hh:mm:ss) Figure 4: Airlock Sequence To make these measurements, the electron multiplier detector has been used with a gain of 100, which allows all six channels to be recorded every three seconds. The standard Faraday cup detector is able to detect these partial pressures, but not at this rate. The “floor” channel is set to mass 21. There is rarely anything present at this mass, which allows it to be used as an indicator of the minimum detectable partial pressure. The sequence starts with the main vacuum chamber at its base pressure of 2 u 10-8 mbar. The chamber is pumped by a turbomolecular pump that is backed by a rotary vane pump. A small load lock is attached to the chamber, which can be rough pumped by the same mechanical pump and purged with nitrogen. At 0:30, the isolation valve between the turbo pump exit and mechanical pump is shut so that the mechanical pump can be used to rough pump the load lock. During this time, the load lock is repeatedly filled with nitrogen and pumped down. Of interest in the data is the rise in the hydrogen partial pressure during this step of the sequence. The partial pressure of hydrogen increases by a factor of 100 while the partial pressure of the other gasses barely increase. This difference is caused by the low compression ratio that turbo pumps have for light gasses. The heavier gasses are being compressed into the dead volume between the turbo pump exit and isolation valve. But, the turbo pump has insufficient compression ratio to store hydrogen in this manner, causing the partial pressure of hydrogen to rise. At 2:30, the load lock has been roughed and the turbo pump foreline isolation valve is opened. The pressures of H2 immediately drops back to the base pressure values. SRS Residual Gas Analyzer Appendix A 9 At 2:40, the load lock is opened to the main chamber causing a jump in pressure. The rise in oxygen and oil pressure indicates that the procedure is operating poorly. Even though the load lock was purged three times with 99.999% nitrogen, oxygen was still introduced into the chamber. This was either caused by a small air leak into the load lock, or permeation of oxygen out of the elastomer seals on the load lock. The rise in oil partial pressure indicates that the trap on the mechanical pump is exhausted and has allowed oil to backstream into the load lock. At 3:09, the valve between the load lock and main chamber is closed, and the pressures begins to return towards their base values. Oxygen is pumped out of the chamber. Hydrogen, water, and nitrogen recover their original values, but slowly. The oil is alarming because it persists at a higher concentration. If this sequence occurred several more times, the oil would continue to increase. The RGA allows it to be detected before reaching undesirable levels. Table Mode The noise floor of the Faraday cup detector is about 10-10 mbar. Since the maximum operating pressure is 10-4 mbar, the dynamic range of the RGA is 6 decades or 1 ppm. The noise floor of the channel electron multiplier (CEM) is lower, but its maximum operating pressure also decreases with the noise floor. The two pressure limits change such that the dynamic range of the CEM is still 6 decades. By switching between the two detectors, measurements covering more than 6 decades can be made. The table mode of the SRS RGA software allows such a measurement to be made. The CEM status can be set independently for each mass being monitored. Figure 5 shows a configuration where the prevalent gases are detected with the FC and the low pressure gases are detected with the CEM. A comparison of the value for nitrogen and “floor” show that the apparent dynamic range is 8 decades or 10 ppb. The program will automatically sort the channels so that all the measurements requiring the CEM are made as a group, which minimizes the switching on and off of the detector. Without the ability to choose between FC and CEM detector for each channel, the CEM would have to be used for all channels so that the low pressure gases could be detected. Operation like this would cause the CEM detector to saturate at the high pressure peaks. Saturation of the detector makes the value useless, and also increases the physical wear on the CEM. SRS Residual Gas Analyzer 10 Appendix A RGA Table Scan Ch# Name Mass Value Alarm Speed Cal CEM 1 Hydrogen 2 3.8E-07 NORMAL 1 1.00 OFF 2 Water 18 7.1E-08 HIGH 1 1.00 OFF 3 Nitrogen 28 1.4E-05 HIGH 1 1.00 OFF 4 Oxygen 32 4.6E-10 NORMAL 3 1.00 ON 5 CO2 44 3.4E-11 NORMAL 3 1.00 ON 6 Oil 55 1.6E-12 NORMAL 3 1.00 ON 10 Floor 21 1.5E-13 NORMAL 1 1.00 ON Figure 5: SRS RGA Table Display Leak Testing In addition to the diagnosis of vacuum systems, the RGA is invaluable as an intrinsic leak detector. It is always available and does not require perturbing the system. The user does not have to roll up a large leak detector and attach it to the vacuum system. The system does not have to be brought up to atmospheric pressure. The RGA can operate in leak detection mode using any gas, so it does not require helium. For moderate leaks, argon or tetrafluoroethane (a typical gas in cans of “dust off”) can be used. Helium is necessary for only the smallest leaks. Having a built-in leak detector makes working with vacuum systems much easier and faster, and the SRS RGA is far less expensive than a standard helium leak detector. The process of leak detection with an RGA is the same as with a traditional helium leak detector. Place the software in leak detection mode, indicate the mass of the test gas and watch the partial pressure as various joints in the vacuum system are sprayed with the test gas. When the leak is sprayed with the test gas, the partial pressure will rise. The response is immediate if the leak is in a direct path from the outside to the inside of the system. Figure 6 contains the result of a leak test with helium on a vacuum chamber. The tester moves the helium probe towards and then past the leak, causing the first peak. Once the location of the leak is bounded, the tester tries to precisely locate the leak. For most situations leak testing is straightforward and no different than traditional methods. In the following sections, we discuss a few situations where traditional methods fail and how the RGA provides a better method. SRS Residual Gas Analyzer Appendix A 11 Chamber Leak Test Helium Torr 1.9E-10 6.0x10 -9 5.4x10 -9 4.8x10 -9 4.2x10 -9 3.6x10 -9 3.0x10 -9 2.4x10 -9 1.8x10 -9 1.2x10 -9 LOW 6.0x10 -10 0 00:00:00 00:00:48 00:01:36 00:02:24 00:03:12 00:04:01 00:04:49 00:05:37 00:06:25 00:07:14 00:08:02 Time (hh:mm:ss) Figure 6: Helium Leak Test Data The partial pressure of the test gas is directly related to the leak rate into the chamber. Assuming that the vacuum pump is not operating near its compression limit, the throughput of the test gas is equal to the product of the partial pressure and the effective speed of the pump at the RGA ionizer (Q = S P). In Figure 5, the partial pressure was measured in Torr. The effective speed of the turbo pump for helium was approximately 50 liter s-1. The largest peak in this data at 4 u 10-9 Torr represents a leak of 1.5 u 10-7 scc sec-1. (0.76 scc sec-1 = 1 Torr liter s-1). From this figure we can estimate a minimum detectable leak of 1 u 10-8 scc sec-1, which is measured with a FC detector. To measure smaller leaks, a CEM detector can be used, or the turbo pump can be throttled to decrease the pumping speed. Supply Gas Valve Seats Leaks across valves that supply gasses to a vacuum system cannot be detected with conventional helium leak testers (unless the valve supplies helium). To test a suspect valve would require removing it and attaching it to the leak tester. Because the RGA can monitor any gas, this is unnecessary; the valves on gas supply lines can be tested in situ. The procedure is simple: monitor the composition of the vacuum system with a high pressure and then a low pressure behind the valve seat in question. If the partial pressure of the gas in question changes, the valve seat is leaking. Supply Gas Manifolds Leak testing supply gas lines can be a very trying experience. The difficulty is mostly because compression type fittings do not have a leak test port. Another difficulty is that supply manifolds commonly have a large number of connections in close proximity. Because the leak in a compression fitting is inside the fitting, transporting the test gas to SRS Residual Gas Analyzer 12 Appendix A the leak requires a large flowrate and waiting for an extended time for the gas to diffuse into the fitting. Because of the flowrate and time, it is possible that the test gas can travel to adjacent tube fittings and cause a misleading indication of a leak. Often times “fugitive” leaks appear and disappear at a specific fitting. What is happening is that the test gas is inadvertently flowing to another fitting, which has a real leak. Whether this inadvertent gas flow occurs depends on exactly how the test gas is applied to the fitting with the “fugitive” leak. Small air currents caused by equipment fans or ventilation systems can move the test gas in unpredictable ways. Confining the test gas to the fitting under question can help, but the RGA provides a easier solution: use a gas other than helium. Helium will spread in air quickly and diffuse into many fittings. A heavy gas like argon or tetraflouroethane is far easier to confine to a specific fitting. Once the moderate leaks have been located and eliminated, a follow up with helium to check for tiny leaks is warranted. Bellow Valves Bellow valves can be difficult to leak test due to the large volume of gas contained between the bellow and the valve body. To perform a quick leak test it is required to change the composition of the gas in this trapped volume quickly. Unfortunately, for some valves, this volume of gas is not highly accessible. This greatly reduces the response time of a leak test. For a leak causing a base pressure of 10-7 mbar in a vacuum system with a 70 l s-1 pump, the volumetric flowrate of gas entering from the atmospheric side of the leak is 7 nanoliters per second. For a bellow with a trapped volume of 1 ml trapped, the response time constant would be over 40 hours. This emphasizes the importance of leak test ports on vacuum hardware. In such situation it is common to place a bag over the body of the valve and fill the bag with helium. The RGA allows us to consider using gases other than helium. The permeability of helium through elastomeric seals can give a false leak reading. And as in manifolds, unless the helium can be strictly confined to the valve body, it may spread to adjacent connections. Given the amount of work and lost time required to remove and repair large valves, false leak readings are expensive. A second test with another gas, such as argon, can confirm that a suspect valve is leaking before starting out on the repair. SRS Residual Gas Analyzer Appendix A 13 Conclusion An RGA is a real eye opener for users of vacuum systems. With an RGA the process of working with vacuum systems is elevated from an empirical trial and error approach to a systematic approach. The status of the vacuum system can be constantly assessed. When an experiment or process is having problems, the possibility of contamination or leaks in the vacuum system can be immediately ascertained. The RGA provides not only troubleshooting but also historical data. Slow trends in a vacuum system can be noticed and acted on before they become serious problems. Hard to correlate cause-effect relations are much easier to establish with the wealth of statistical data that can be obtained with a daily spectrum analysis. Good procedure and strict adherence to them allows a user to infer the integrity of a vacuum system. An RGA allows users to prove the integrity of a vacuum system with hard data. Further Reading Dawson, P.H., Quadrupole Mass Spectrometry and its Applications, American Institute of Physics, 1995. Drinkwine, M.J., and Lichtman, D., Partial Pressure Analyzers and Analysis, American Vacuum Society, New York. Wilson, N.G., Beavis, L.C., Handbook of Vacuum Leak Detection, American Vacuum Society, New York, 1979. SRS Residual Gas Analyzer Appendix B 1 Appendix B Using SRS RGA’s to Sample High Pressure Gasses Introduction The types of analysis performed by an RGA are useful in many applications other than vacuum systems. But, the RGA is intrinsically a vacuum instrument that operates best under 10-5 mbar. The instruments response becomes non-linear above 10-5 mbar. To sample gases at higher pressures, a pressure reduction system is needed. These systems are basically a restriction and a vacuum pump package. Common restrictions are pinholes and capillaries, which can provide pressure reductions of more than 6 decades of pressure. The vacuum pump package consists of a turbomolecular pump and a backing pump. In addition to achieving the desired pressure reduction, the design of a system should provide for a fast response and high signal to background ratio. At pressures common to vacuum processes, a simple aperture based pressure reduction system is suitable. At atmospheric and higher pressures, a two stage reduction based on a capillary and aperture is used. These two systems will be used to illustrate the design of pressure reduction systems for RGA’s. Vacuum Process Sampling (10 to 10-5 mbar) Figure 1 shows a schematic of a basic pressure reduction system. The system has two paths to the RGA: a high conductance path and an aperture path. The high conductance path (through Valve Hi-C) is provided so that the RGA can monitor the ultimate vacuum of systems before a process begins. The Hi-C path is also used when leak testing the vacuum system with the RGA Software’s leak test mode. The aperture path provides the pressure reduction for when the vacuum process is operating at pressures up to 10 mbar. The design of the aperture path is straightforward. First, the RGA operating pressure is chosen, for example 10-6 mbar. The pressure, P, and the pumping speed, S, determine the throughput of the aperture, Q, by the equation Q = P S. To keep the system cost low, a small turbo pump is chosen. For a 70 liter s-1 pump, the required throughput is 7 u 10-5 mbar liter s-1. The throughput of the aperture is related to its conductivity, C, and the pressure drop, 'P, by the equation Q = C 'P. The process pressure determines the pressure drop thereby determining the required conductivity. Formulas for conductivity of various geometries, e.g. capillaries, and pinholes, are available in many references (some are listed at the end of this note). SRS Residual Gas Analyzer 2 Appendix B Hi-C Valve Process RGA Aperature Hybrid Turbo Pump Sample Valve Diaphragm Pump Figure 1: Schematic of a mid-vacuum pressure reduction system Apertures can be readily designed for process pressures in the range from 10-3 mbar to 10 mbar. If the process always operates within a small range, the aperture can be optimized to deliver gas to the RGA at about 10-6 to 10-5 mbar. By operating the RGA at its optimum pressure the data acquisition time is kept to a minimum and the full dynamic range in partial pressure is available. For many applications, the process is operated at one pressure and the aperture can be optimized. If the process pressure varies over a range of 2 decades or more, the aperture size must be compromised to tolerate the pressure range. For example, consider a process pressure that varies from 10-1 to 10 mbar. The aperture would be designed to drop the pressure from 10 mbar to 10-5 mbar. When the process pressure was at 10-1 mbar, the pressure at the RGA would be 10-7 mbar. The minimum detectable partial pressure (MDPP) of the RGA does not depend on the operating pressure; for a Faraday cup detector it is about 10-10 mbar. Therefore the dynamic range of the measurement varies from 5 decades at high process pressure to only 3 decades at the low pressures. For applications where the full dynamic range is not needed, operating the RGA at low pressure may be acceptable. If the full dynamic range is required over a variety of process pressures, a variable reduction is required. Suitable variable leak valves are available, but are significantly more expensive than a fixed aperture. Another method of increasing the dynamic range and data acquisition rate is to use an RGA with an electron multiplier. The electron multiplier provides gains up to 106 and lowers the MDPP to under 10-13 mbar. This lower MDPP allows the RGA to provide large dynamic range even at low operating pressures. A high operating pressure (or throughput of the aperture) at the RGA also improves the signal to background ratio. In this context, signal is the gas that is drawn through the aperture and background is outgassing from the system plus backstreaming through the turbo pump. The ultimate vacuum of many turbo pump packages is about 10-9 mbar. The outgassing background will be mostly hydrogen, water, and nitrogen. The backstreaming background will be air. If measurements are being made near these SRS Residual Gas Analyzer Appendix B 3 background peaks, the operating pressure should be kept as high as possible. The background can be minimized by designing the tubing such that the effective pumping speed at the RGA ionizer is as high as possible. Figure 2 shows two layouts that both have the same “signal” level. The layout with the RGA at the end of a small tube has a small effective pumping speed and will show a larger background level. Signal GOOD Background RGA Ionizer Turbo Pump Signal BAD Background RGA Ionizer Turbo Pump SRS Residual Gas Analyzer 4 Appendix B Figure 2: Two Layouts of Post-Aperture Vacuum System. The system shown in Figure 1 can be assembled as a simple package. Using a small (70 liter s-1 or less) hybrid turbo pump and a diaphragm backing pump will eliminate any concern of oil. The use of this pump pair also eliminates foreline traps and isolation valves. The operation of the system should be simple: open the Hi-C valve at low pressures, or open the sample valve at high pressures. High Pressure Sampling (>100mbar) At high pressure the aperture assembly is insufficient to reduce the pressure, while maintaining response time. Consider an aperture that reduces the pressure from 10 mbar to 10-6 mbar when used with a 70 liter s-1 turbo pump. The volumetric flowrate on the high pressure side of the aperture would be 7 microliter s-1. Any dead volume on the high pressure side of the aperture (Figure 3) would cause a large response time constant (tc = volume / flowrate). If the aperture had a small dead volume of 1/2 inch of 0.250 OD tube (0.028 wall), the time constant would be 35 seconds. This is not an acceptable response time. 10 mbar dead volume 10 -6mbar Figure 3: Small Dead Volume Slows Process Response time. To achieve a fast response time, a capillary inlet is used with bypass pumping as shown in Figure 4. The system reduces the pressure in two stages. Most of the sampled gas is drawn through the capillary and directly to the diaphragm pump, i.e. bypasses the RGA. The pressure at the exit of the capillary is about 1 mbar. A small amount of the sampled gas is diverted to the RGA through an aperture. This configuration improves the response time by two methods. First, the pressure on the high side of the aperture is held to about 1 mbar. But even this pressure would give a time constant of 3.5 seconds in the 1/2 inch dead volume example mentioned above. The second method to decrease the time constant is to ensure that any dead volume is well mixed. After the capillary, the gas is traveling at significant velocity (several meters per second). Proper layout of the inlet SRS Residual Gas Analyzer Appendix B 5 tubing will use the kinetic energy of the sampled gas to mix the dead volume (in a sense keeping the volume alive). Figure 5 shows the response to bursts of gas at the inlet of an atmospheric sampler designed with the above considerations. The sub-second response and cleanup are almost as fast as the RGA can acquire data. 1000 mbar Inlet 10 -6 mbar 1-5 mbar Capillary RGA Aperature Sample Valve Hybrid Turbo Pump Bypass Valve Diaphragm Pump Figure 4: High Pressure Sampling Using Bypass Pumping 5.00e-7 4.00e-7 pressure 3.00e-7 2.00e-7 1.00e-7 0.00e+0 0 1 2 3 4 5 time (s) Figure 5: Response of Bypass Pumped System to Gas Bursts. SRS Residual Gas Analyzer 6 Appendix B Glass capillaries are available with small enough bores to reduce pressure from 1000 mbar to 10-6 mbar without bypass pumping. While it is possible to build a atmospheric sampling system based on a 1/4 meter 50 Pm glass capillary, there are considerable reasons to use a bypass pump configuration. Bypass pumping improves the operation of a system by increasing the flowrate of gas through the capillary about 3-4 orders of magnitude. The higher flowrates and smaller pressure drop allow a wider selection of capillaries to be practical. Stainless steel and PEEK capillaries are more affordable and flexible than glass capillaries. A large flowrate means that the volumetric flowrate at the inlet of the capillary is more reasonable. For a system with 70 liter s-1 pumping speed, operating at 10-6 mbar, the volumetric flowrate at the inlet would be 70 nanoliter s-1. Any dead volume at the inlet of the capillary would result in an unreasonable response time. With such small flowrates, inlet devices such as filters, valves, or connecting hardware cannot be used. Overall, the bypass pumped capillary system is more flexible and only requires a minor addition of hardware (one valve and some tube). The configuration seen in Figure 4 is made possible by the recent advances in hybrid turbomolecular/drag pumps and diaphragm pumps. Traditional designs would have relied on a two rotary vane pumps and standard turbomolecular pump. The high compression ratios of the hybrid turbo pumps allow the two streams (bypass and sample) to be combined. The low ultimate vacuum of contemporary diaphragm pumps makes them suitable as a foreline pump. The combination of these modern technologies means that an atmospheric sampling system can be constructed into a very small packages (less than 8 inch high in a 19 inch rack mount chassis), which is portable and easy to operate. Conclusion Although the RGA is intrinsically a vacuum instrument, inlet systems are easily designed that allow it to sample gasses at any pressure. A more descriptive name for such systems would be “online quadrupole mass spectrometer”. Mass spectrometry is a well proven analytical technique, but traditionally used an expensive large machine. Reduction in cost of quadrupoles and vacuum pumps, along with the development of easy to use software interfaces makes process analysis with mass spectrometry an attractive technique. Further Reading Lewin, O., An Elementary Introduction to Vacuum Technique, American Vacuum Society, New York, 1987. Moore, J.H., Davis, C.C., and Coplan, M.A., Building Scientific Apparatus, 2nd ed., Addison-Wesley, New York, 1989. SRS Residual Gas Analyzer Appendix B 7 SRS Residual Gas Analyzer Appendix C 1 Appendix C Do I need a PPM100 Partial Pressure Monitor for my SRS RGA? Introduction 2 What is the PPM100 controller? 3 How does the PPM100 interface to the SRS RGA? 4 What does the PPM100 controller do? 5 Partial Pressure Monitor and Control ...................................................... Leak Test Analysis.................................................................................. Mass Spec Display ................................................................................. RGA Control........................................................................................... Analog I/O Ports...................................................................................... Capacitance Manometer readings (CM1-4) ............................................ Data Logging (Charts and Tables).......................................................... Vacuum Process Control ........................................................................ Computer Interfaces (RS-232, GPIB and USB) ...................................... Internet Access ....................................................................................... 5 5 6 7 7 8 8 10 10 11 Who should consider the PPM100? 13 Do I still need RGA Windows? 16 PPM100 Specifications 17 SRS Residual Gas Analyzer 2 Appendix C Introduction If you are planning to purchase an SRS RGA, or even if you already own one, you might want to consider the addition of a PPM100 Partial Pressure Monitor to your vacuum setup. The PPM100 was designed based on recommendations from vacuum users with a broad range of partial pressure measurement requirements. The PPM100 is most suitable for RGA users who … … require analog I/O capabilities. … require process control capabilities. … perform repetitive vacuum processes. … demand high reliability (i.e. mission-critical applications.) … need access to RGA data over the world wide web … operate in process environments incompatible with PCs … require uninterrupted 24/7 access to partial pressure data … require a compact and mobile partial pressure measurement setup. … prefer a traditional standalone RGA controller box over a PC. … do not wish to deal with computers, software upgrades and system crashes If any of the above requirements applies to you, please read the rest of this application note to familiarize yourself with: (1) the main features and specifications of the PPM100 controller, (2) the advantages of operating any SRS RGA with a stand-alone PPM100 controller (i.e. as compared to a PC/RGA Windows interface), and (3) the cases in which RGA Windows is still recommended. SRS Residual Gas Analyzer Appendix C 3 What is the PPM100 controller? Figure 1. Front panel of the PPM100 controller with its touchscreen/LCD display and RGA control buttons. The PPM100 Partial Pressure Monitor is a standalone, fully-programmable, microprocessor-based vacuum system controller that when connected to any SRS RGA100/200/300 residual gas analyzer can continuously monitor and display partial pressures of up to eight individual gas components. It includes a touchscreen/LCD front-panel display, pressure vs. time and analog-scan graphing, built-in relays for vacuum system control and several multipurpose (analog and digital) I/O ports. RS-232, USB and GPIB computer interfaces are standard in all controllers. An Embedded Web Server (EWS), with a standard Ethernet connector, connects the PPM100 to the World Wide Web. SRS Residual Gas Analyzer 4 Appendix C How does the PPM100 interface to the SRS RGA? A very important feature of the PPM100 controller is that it eliminates the requirement to connect the SRS RGA to a host PC computer. The RGA is instead connected directly to the PPM100 controller through its standard RGA-RS232 serial interface port and all data is displayed on the front panel of the controller. Warning! PPM100 is not compatible with third-party residual gas analyzers A menu-driven user-interface allows the PPM100 operator to easily program all required RGA Setup parameters from the controller’s front panel- i.e. no RGA Windows software interface is required. Note that the PPM100 is a standalone instrument - there is no need to connect the controller itself to an external computer to access its full performance and functionality. Figure 2. Back panel of the PPM100 controller. Connect the SRS RGA to the RGA RS-232 (DB-9) connector using a standard serial communication cable. SRS Residual Gas Analyzer Appendix C 5 What does the PPM100 controller do? Partial Pressure Monitor and Control PPM100 can monitor and display up to eight independent RGA partial pressures on its front panel LCD. Each partial pressure reading has its own (1) mass, (2) detector , (3) scan rate and (4) alarm settings. The Partial Pressure Display mode of operation is primarily used to generate single gas data for leak testing applications, and to track changes in the concentrations of up to eight independent components of a gas mixture as a function of time. The partial pressure readings can also be linked to alarms, process control relays and both digital and analog output signals. Figure 3. The partial pressure Monitor Display mode of the PPM100 shows partial pressure readings, and alarm status, for up to eight individual gas species. Leak Test Analysis The PPM100 can be used to leak test components attached to the vacuum system. Use leak trend graphs to detect leaks as partial pressure transients while spraying the vacuum system components with a tracer gas such as helium or argon. A stamp-sized 'Signal vs. time' plot of the most recent partial pressures for the selected mass is displayed on the front panel. A small instantaneous partial pressure reading is also included next to the plot. When 'Audio Leak Trend' is selected, a repetitive audio signal whose frequency is proportional to the partial pressure readings provides a means to “hear” pressure transients, eliminating the need to look at the front panel display while searching for leaks. In order to provide optimum data acquisition rates at the mass of interest, all other partial pressure readings and displays are disabled while in this display mode. SRS Residual Gas Analyzer 6 Appendix C Figure 4. Leak trend Display Mode. Use this graphical mode to Leak test components of your vacuum system. PP2 data bar is set to Leak trend, and three display modes are available on the same screen to visualize leak rates during testing. Mass Spec Display A Scan Display mode is available to graph RGA Mass Spectra directly on the front panel of the controller. During analog scanning the quadrupole mass spectrometer is stepped at fixed mass increments (i.e. 0.1 amu) through a user-specified mass range. The ion current is measured after each mass-increment step and transmitted to the PPM100 for display. Analog scanning simplifies the detection of mass peaks for component gas identification, and provides a direct measure of the mass resolution of the quadrupole mass spectrometer. SRS Residual Gas Analyzer Appendix C 7 Figure 5. The Mass Spec Display mode of the PPM100 shows complete RGA Mass spectra and includes a cursor for fast peak identification. RGA Control The PPM100 includes a FILAMENT button on its front panel for manual activation of filament emission as required for partial pressure measurements. Press the E. MULTIPLIER button at any time to activate the electron multiplier detector during analog scans. All RGA ionizer settings are easily configured from the touchscreen/LCD user interface. Figure 6. RGA Setup parameters are easily set from the front panel. Analog I/O Ports The PPM100 controller has four analog input/output ports. Their range is ±12 V with 14 bit input resolution and 12-bit output resolution. The update rate is 2 Hz. Each port is individually configurable as an input or an output for complete I/O flexibility. SRS Residual Gas Analyzer 8 Appendix C Figure 7. The AnalogIO Display mode of the PPM100 (w/CM readings disabled) shows the voltage levels at the analog I/O ports. Use analog I/O ports as inputs to read voltages from vacuum system instruments such as capacitance manometers, analog output third-party gauges, mass flow controllers, turbo pump controllers, etc. Analog output levels can be programmed manually from the front panel, remotely through the computer interface, or they can be linked to partial pressure readings for closed-loop control of gas composition. Use analog I/O ports as outputs to control auxiliary vacuum equipment such as heaters, actuators, ion sources, programmable logic controllers, dosing valves and throttle controllers. Capacitance Manometer readings (CM1-4) The PPM100 controller can display pressure as measured by standard capacitance manometers (CMs). Up to four independent CM readings can be monitored simultaneously. Pressure readings are updated at 2 Hz. The PPM100 precisely measures the 0 to 10 VDC linear output signal from the CM to determine pressure. Full-scale ranges up to 1000 Torr are supported by the controller. For added convenience, the PPM100 also supplies an auxiliary (AUX) ±15 V, 100 mA power output. This is usually sufficient to power up a couple of standard (i.e. non-heated) capacitance manometers. Tip! The CM pressure display mode can also be applied to display pressures from third-party vacuum gauges with analog outputs linked to the log of the total pressure. Data Logging (Charts and Tables) All PPM100 controllers include Data Logging capabilities. When Data Logging is enabled, data from all partial pressure measurements and all analog inputs are stored in a circular memory buffer at the rate specified by a user-programmable logging interval. SRS Residual Gas Analyzer Appendix C 9 Figure 8. Data Logging (Chart) Display mode of the PPM100. Both Graph and Table display modes are shown side-to-side. The signal-vs-time display allows you to monitor pump-down and venting cycles and follow the time behavior of your system. The logged data can be accessed through the touchscreen LCD. Both table and chart (P vs. Time) displays are available. The chart display includes convenient graphical tools such as (1) cursor, (2) zoom, (3) (x, y)-axis scaling (manual and auto), and (4) cursor readings. Users can switch rapidly between current and logged readings for the pressures or analog signals of interest. The data log can also be accessed remotely through the computer interface, or through the world wide web when using the embedded web server. Typical applications of the Data Logging capabilities include capturing pump-down or venting curves for vacuum system characterization, monitoring mass-flow controller signals during deposition processes, and tracking temperatures and other time dependent variables during bakeouts or heat treatments. SRS Residual Gas Analyzer 10 Appendix C Vacuum Process Control Eight channels of process control are standard in the PPM100 controller. Figure 9. Process Control Display mode of the PPM100. Eight process control channels bring additional power and versatility to the PPM100. Each channel has a relay closure output and corresponding opto-isolated TTL output signal, that may be linked to a variety of input sources with intuitive user-programmable rules. Each individual channel can be linked to any partial pressure or analog input, the system clock, gauge status or a TTL input trigger signal. The Process Control module also includes several opto-isolated TTL level inputs, used to remotely control filament on/off, degas on/off, E. MULT. On/Off, keypad lockout, datalogging reset and touchscreen enable/disable functions. Manual override is available for all process control channels, making it possible to manually control channel relays and TTL output levels directly from the front panel. Manual relay control makes it possible to use the PPM100 as a standalone controller capable of manually or automatically managing the operation of any standard vacuum system. All process control events are automatically time-stamped and recorded in memory (Event Logging) so they can be reviewed at any time. Use the History button on the Process Control panel to access the Process Control Event Log at any time. Computer Interfaces (RS-232, GPIB and USB) PPM100 includes standard RS-232, GPIB and USB communication ports. A host computer connected to the instrument can easily configure, diagnose and operate the PPM100 controller using simple ASCII commands. An intuitive and complete Remote Command Set facilitates integration of all controller functions into any processing or diagnostic software. The same command set is shared by the RS232, USB and GPIB interfaces. SRS Residual Gas Analyzer Appendix C 11 Figure 10. Back panel of PPM100. Computer interface ports on the back panel of the PPM100 include: (1) HOST RS232, (2) GPIB, (3) USB, and (4) 10 BASET Ethernet port (for embedded web server) Tip! Computer interfacing is only required for: (1) Computer monitor/control of the PPM100 and vacuum system, (2) Remote access to data-logs and history lists, (3) calibration data uploads, and (4) firmware upgrades (for controller and web server). The PPM100 itself is a standalone instrument - there is no need to connect the controller to an external computer to access its full performance and functionality. All instrument functions and parameters are manually accessible and easily modified through its menu-driven user interface. Internet Access An Embedded Web Server (EWS) connects the PPM100 to the World Wide Web. The EWS is a TCP/IP compatible web server that resides inside the PPM100 box, continuously gathering data from the instrument. When connected to an ethernet network with an Internet gateway, the EWS can deliver PPM100 data to a user anywhere on the world wide web using a standard browser. Users can monitor their vacuum system gas composition from anywhere in the world. E-mail notification can notify a client list of potential or real system problems. SRS Residual Gas Analyzer 12 Appendix C Figure 11. Sample of the PPM100 web page. The EWS provides the most convenient way to access PPM100 data from a computer without writing custom serial or GPIB based software. Display modes supported include: analog-scans, pressure-versustime, tables, etc. The EWS can also be configured to allow access to process control functions, so that any vacuum system can be monitored and controlled from anywhere in the world. Tip! Use the web interface to track your vacuum system from your office or from home without having to pay periodic visits to your lab. Use the control capabilities to turn heating jackets on/off or activate/deactivate valves, pumps and gauges from the comfort of your office. SRS Residual Gas Analyzer Appendix C 13 Who should consider the PPM100? i RGA users who require auxiliary Analog I/O capabilities. Process vacuum applications often require monitoring analog signals from multiple electronic sources such as capacitance manometers, third-party gauges with analog outputs, mass flow controllers, turbo pump controllers, thermometers, etc. The PPM100 analog input ports provide the simplest way to collect and log data from up to four auxiliary vacuum instruments in parallel with its RGA partial pressure readings. PPM100 can also provide Analog OUT signals linked to partial pressures of individual gases for applications requiring feedback-loop control of gas composition. Use analog OUT signals to control auxiliary vacuum equipment such as heaters, actuators, ion sources, programmable logic controllers and dosing valves and throttles. Note! Analog I/O is not supported by the RGA Windows software provided with the SRS RGA. A good example of a vacuum application requiring multiple inputs is the Temperature Programmed Desorption (TPD) procedures that are common during surface science experiments. The only viable alternative to the Analog I/O capabilities of the PPM100 would be to interface the RGA directly to a personal computer, fitted with an “A/D and D/A” board and to write specialized software to integrate the RGA readings with the analog I/O signals of interest. i RGA users who need Process Control Capabilities. PPM100 provides one of the simplest and most reliable ways to build process control and interlocking capabilities into a vacuum system setup. Use the 8 channels of process control to make mission-critical decisions based on (1) logic levels, (2) analog signal levels, (3) time, (4) system status, and/or (5) partial pressure readings during your process. All this without any need for computer programming/interfacing or additional hardware. The only viable alternative to the Process Control capabilities of the PPM100 would be to interface the RGA directly to a computer, fitted with a “Logic I/O and Relay” board and to write specialized software to link the RGA and analog readings to the Logic and Relay ports. i RGA Users who perform repetitive vacuum processes. PPM100 is ideally suited for repetitive processes where the partial pressure limits and intelocking requirements during execution of the vacuum procedure are well understood. Fast response, reliability and standalone operation make the PPM100 an ideal alternative to the PC/RGA Windows interface. Alarms can immediately announce out-of-range conditions for critical gas components of a gas mixture, while process control channels and rules can be used to protect the system from catastrophic events without any need for human intervention. i RGA Users with high reliability requirements The reliability of the PPM100 as a partial pressure monitor/controller far exceeds any PC Computer/RGA Windows based setup. As a standalone instrument, PPM100 continues to collect data day-in and day-out without interruption, without sharing CPU time with any other software applications and without being susceptible to PC operating system crashes. SRS Residual Gas Analyzer 14 Appendix C If uninterrupted datalogging is a requirement in your process, you should seriously consider the PPM100 as an upgrade for the PC/RGA Windows setup. i RGA users who require access to RGA data over the World Wide Web The Embedded Web Server (EWS) available for the PPM100 provides the most convenient way to access RGA data through the Internet. The EWS can also be configured to allow access to process control functions, so that any vacuum system can be monitored and controlled from anywhere in the world. Use the web interface to monitor your vacuum system from your office or from home without having to pay periodic visits to your lab and while waiting for your system to pump down. Use the control capabilities to turn heating jackets on/off or activate/deactivate valves or pumps and gauges from the comfort of your office. Note! Web access is not supported by the RGA Windows software package provided with the SRS RGA. As an added convenience, the PPM100 includes an e-mail notification system, that can be easily programmed to notify RGA/PPM100 users of important vacuum system events by sending email messages to a user-specified address. i RGA users in process environments incompatible with PCs PC computers are often incompatible with process environments, and alternative solutions such as remote interfacing or industrial PCs are often technically incompatible or prohibitively expensive. Desktops are often too large, and laptops are generally considered too delicate for the process floor. The standalone PPM100 solves all of the above problems with a small, rugged, reliable and rack mountable package. i RGA users who require 24/7 access to partial pressure data PPM100 provides 24/7 access to your RGA data. If your application requires uninterrupted access to gas composition information from your vacuum system, carefully consider a PPM100 for your RGA setup. For example, surface scientists are used to keeping a watchful eye on their vacuum system’s RGA spectra throughout system pumpdowns and during sample handling. Displaying the RGA data with a standalone PPM100, frees the experiment’s computer(s) for critical (i.e. experiment related) data acquisition functions and minimizes the possibility of missing important “vacuum events” while RGA data is not being displayed on the computer’s screen. i RGA users who require a compact and mobile measurement setup PPM100 offers a very compact, rugged and rack mountable package. Its size can only be compared to a much more delicate laptop PC. Vacuum engineers and technicians, requiring mobile, RGA-based, diagnostic systems should seriously consider the PPM100 as a compact and rugged substitute for the PC/RGA Windows setup. For example, a PPM100/RGA system provides an excellent portable “leak detection” setup. i RGA users who have PC interfacing requirements beyond RS232 The SRS RGA offers only one interface option- RS232 at 28.8 Kbaud rate. If your interfacing requirements involve GPIB, USB or ethernet , or you simply need a more flexible RS232 setup, consider a PPM100 as a bridge between your RGA and your process computers. SRS Residual Gas Analyzer Appendix C 15 i RGA users who demand a traditional standalone controller box Standalone partial pressure display units, which connect directly to RGA mass spectrometers, have been available since the early days of mass spectrometry and are still the preferred display option for many vacuum users. i RGA users who do not wish to deal with computers, software upgrades and system crashes. There is a modern trend to dedicate a PC to every new instrument or sensor in the lab. However, PCs cannot generally be regarded as friendly or reliable in process environments. If you are not interested in dealing with: (1) system crashes, (2) software incompatibilities, (3) hardware incompatibilities, (4) bootup times, (5) software upgrades, (6) operating system upgrades, (7) software development, (8) computer interfaces, etc, you should consider the PPM100 as an upgrade to your RGA/RGA Windows setup. SRS Residual Gas Analyzer 16 Appendix C Do I still need RGA Windows? i PPM100 is not a complete substitute for RGA Windows. RGA Windows offers several RGA data display options that are not feasible in a standalone, monochrome display unit as the PPM110. Obvious examples include: bigger screen, color-coded gas traces, fast display update, scan logging, deeper data buffers and hard disk data storage. RGA Windows is still sometimes required to perform RGA tuning operations such as: (1) mass axis calibration, (2) sensitivity calibration, and (3) E. MULT. gain adjustment. However, RGA users must keep in mind that these procedures are rarely required during routine vacuum measurements. i PPM100 is not recommended for very fast data acquisition applications RGA users interested in fast data acquisition rates (i.e. such as fast-TPD, or laser desorption experiments) must still rely in the faster PC/RGA Windows setup for data acquisition. Consult the factory for specific details. SRS Residual Gas Analyzer Appendix C 17 PPM100 Specifications Specifications apply after 1 hour of warm-up General Interfaces Weight/Dimensions Warranty RS-232 (std.), USB (std), GPIB (std) or Ethernet interface with embedded web server. 90 to 264 VAC, 47 to 63 Hz, 240 W 0°C to 40°C, non-condensing Less than 90% humidity 15 lbs. / 8.5"x5.25"x16" (WHD) One year parts and labor Display Type Resolution Modes Units Numeric resolution Update rate Back-lit, touchscreen LCD (4.7" diag) 320 x 240 pixels Numeric, bargraph, P vs. T Torr, mbar, bar, Pa and micron 3 digit mantissa plus exponent 2 samples per second Power Operating temperature Electrical (20°C to 30°C) Analog I/O Ports Range Resolution Update rate Connector 4 configurable analog ports ±12 Vdc 14-bit (In), 12-bit (Out) 2 Hz BNC Gauges (Total Pressure) Capacitance Manometer Number of gauges Simultaneous readout of up to four capacitance manometers using the auxiliary inputs. Auxiliary power output ±15 Vdc, 100 mA (for CM power) Process Control Number of channels Input signals Output signals Relays TTL outputs Manual control Remote TTL control 8 channels with programmable setpoint, polarity, hysteresis, delay, audio signal and text messages. Total pressure (CM gauge), partial pressure (RGA), voltage (I/O ports), time (internal clock), TTL and gauge status. Relay and TTL level SPDT, form C, 5A/250VAC/30VDC, resistive load Active low, opto-isolated All channels can be operated from front panel. 7 opto-isolated TTL channels (Fil on/off, Degas on/off, Fil lockout, Control keypad lockout, data logging time reset, touchscreen enable/disable, remote enable/disable) SRS Residual Gas Analyzer Appendix D 1 Appendix D SRS RGA LabVIEW Development Kit Important! x The drivers in the development kit are provided free of charge and AS IS. Support of any modification is solely the responsibility of the end user. x This kit was developed and tested under LabVIEW version 5.1. It was also tested for compatibility with LabVIEW version 6.0 (also known as LabVIEW 6i). At the time of writing, LabVIEW 6i is not fully backward compatible with LabVIEW 5.1, and two versions of the development kit are available. See the SRS website (http://www.thinksrs.com) and below for more details. x While the drivers were thoroughly tested, SRS makes no warranty (express or implied) on this software and assumes no responsibility for damage caused through using it. x SRS does not provide training in the use of LabVIEW, nor does SRS provide support for LabVIEW. Contact National Instruments, Incorporated (telephone 1-800-433-3488 or on the internet at http://www.ni.com) for training and support of LabVIEW. x This appendix assumes familiarity with the LabVIEW programming environment. It also assumes familiarity with the implementation of Virtual Instrument Software Architecture (VISA) used by National Instruments. There are numerous resources on LabVIEW; two are listed here : National Instruments, Incorporated on the web at : http://www.ni.com or via telephone at 1-800-433-3488 “LabVIEW Graphical Programming: Practical Applications in Instrumentation and Control”, 2nd Edition, 1997, Gary W. Johnson Introduction What is the SRS RGA LabVIEW Development Kit? The SRS RGA LabVIEW Development Kit is a set of LabVIEW drivers that were designed for and tested with an SRS RGA. The virtual instruments (VIs) included in the kit encapsulate all the low-level commands and data manipulation required to work with the SRS RGA. These VIs let you get up and running with an SRS RGA in the LabVIEW environment very quickly. The kit is completely free and is available for download at the SRS web site: www.thinksrs.com. Note that using the kit effectively requires knowledge of LabVIEW; some resources on this subject are listed above. SRS Residual Gas Analyzer 2 Appendix D What does the kit include? The VIs in the kit are divided into three layers. The lowest layer, termed a “communications layer”, simply encapsulates the RS232 interface commands. The next layer, an “operations layer” draws on several of the communications layer VIs and adds some data manipulation to allow rapid development of custom LabVIEW experiments that incorporate the SRS RGA. The last layer, an “applications layer”, is provided as an example of what can be created using the operations layer. A stand-alone application is included in this layer which allows analog, histogram and table scans. The source code for this application, as well as simplified examples of each of the scan types is included. What goals can the kit help me accomplish? The kit was designed to let you quickly : i Develop new custom applications using the SRS RGA i Incorporate the SRS RGA into your existing LabVIEW applications i Integrate data from other sources (temperature, flow rate, etc.) with RGA data i Publish your RGA data on the world wide web (using LabVIEW 6i) The kit was developed in part to accommodate users who asked for more features in our RGA Windows software. While many users asked for similar features, each had their own special requirements beyond those common features. The development kit allows users to customize the software to fit their own individual needs. Groups that had input into this kit (and who should benefit from it) include : Analytical Chemists Industrial Refrigerant Engineers Scientists performing “hyphenated measurements” (e.g. Temperature Programmed Desorption) Surface Scientists Scientists performing ion counting measurements What is required to use the kit? In order to develop custom applications, you will need to have LabVIEW version 5.1 or 6i. The software is available from National Instruments Corporation; see their web site at www.ni.com. The kit was developed under LabVIEW 5.1. In LabVIEW 6i, National Instruments dropped the use of data range coercion, which causes warnings when you load the VIs in 6i. If you are using 6i, disregard any warnings about data range coercion; the VIs should function normally. The requirements for running LabVIEW are : Windows 9x,ME, NT or 2000 (for Windows NT, Service Pack 3 or later) 32 MB RAM minimum, 64 MB recommended 170 MB disk space for full LabVIEW installation SRS Residual Gas Analyzer Appendix D 3 (Contact National Instruments for the most up-to-date information regarding the requirements for running their LabVIEW software) If you wish to use the kit in order to easily put your data on the web, LabVIEW version 6i includes a built-in web-publishing tool. The kit was tested with this web-publishing tool, and this document discusses how to use it. Note that if you would like to try out the SRS RGA stand-alone application, it is available from the SRS web site (www.thinksrs.com) as a stand-alone executable file. LabVIEW is not required to run the application. A run-time engine and VISA drivers must be installed to use the application on a system without LabVIEW. These software components are included in the download, and will automatically be installed with the SRS RGA LabVIEW application. Browsing the kit After you download the free kit, you can install it under any directory you choose. However, it may make things easier to install the kit under the LabVIEW instrument drivers directory, (for example, C:\Program Files\National Instruments\LabVIEW 6\instr.lib) so it can quickly be accessed from within LabVIEW. The easiest way to get a feel for what is in the kit is to browse the VI named “VI Tree” (see figure below). VI Tree is a documentation VI. It only shows each VI used in the three hierarchical levels of the kit, and performs no other function. Attempting to run this VI will result in an error since it is merely a collection of unconnected VIs. SRS Residual Gas Analyzer 4 Appendix D A good way to get familiar with what each of the sub-VIs of a given VI do is to invoke LabVIEW’s help feature (press Control-H) and simply move your mouse over each of the VIs. The help will list the input and outputs of each VI as well as any general remarks about the VI. The built-in documentation features of LabVIEW will allow you to quickly print out detailed information about every VI used in the kit, including inputs and outputs for each VI. To print documentation under LabVIEW 5.1, go to File | Print Documentation. Under LabVIEW 6i, go to Print. In both cases, follow the prompts to print the level of detail in the documentation that you desire. Another instructive way to learn how the VIs work is to view their execution while the program is running. LabVIEW allows you to do this by simply clicking on the “highlight execution” speed button from within the view of the block diagram. After clicking this button, LabVIEW will show you the data and the pathways used in handling that data from within individual VIs. This can help you understand the SRS Residual Gas Analyzer Appendix D 5 program flow much more quickly than by simply looking at the code. Bear in mind that performance of the program slows drastically as it creates this “movie” of what goes on during execution. Layers in the SRS RGA Development Kit Communications Layer VIs What are the communications layer VIs? The VIs in the communications layer encapsulate the low-level serial communication commands as well as doing some communications housekeeping. They allow the maximum in flexibility when creating custom LabVIEW programs. When should I use this layer? The communications layer is only required when your application requires something not addressed by the operations layer. These VIs are what many people get when they download “LabVIEW drivers” from an instrument manufacturer’s web site. The SRS RGA LabVIEW Development Kit goes far beyond this primitive layer. Most users should work at the operations layer first, only using the communications layer when strictly necessary. An oversimplified example CommExamplec.vi will run a single scan over a user-specified mass range. Note that a waveform chart is used, and the abscissa units are not mass but rather simply the number of data points. Furthermore, the ordinate is not in units of pressure, but is in the raw ampere reading returned from the RGA. This example is simply meant to introduce you to some concepts used in the operations layer and to verify the communications are functioning correctly under the LabVIEW environment. It is not meant as an example to emulate or as a starting point for development. Try the example: Open LabVIEW Select the RGA LabVIEW Library Open the Communications example, CommExampleC From the front panel, set the mass range for the scan Make sure the virtual LED labeled “Scan Enabled” is lit Set the COM port to be the same as the COM port the RGA is using Run the VI SRS Residual Gas Analyzer 6 Appendix D The VI takes a few moments before the scan begins in order to perform some initialization tasks on the RGA. After this time, you should see a trace corresponding to the ion currents detected by the RGA as its mass filter is swept. If the trace doesn’t appear after thirty seconds or you get an error, use the RGA COM program supplied with your RGA to verify communications are set up correctly. Make sure the power to the RGA is on (check the power LED), verify the COM port setting is correct, and test the cabling. Concepts from the example: Within LabVIEW, view the block diagram of CommExampleC (press Control-E if you are already looking at the front panel of the VI). The figure below shows this block diagram. Please note that this example is not meant to be a “starting point” to develop your own programs. Rather it simply demonstrates some concepts used in the development kit. SRS Residual Gas Analyzer Appendix D 7 Note that at the far left side of the block diagram, a COM port is specified and an SRS RGA “session” is established. The user specifies the COM port in use from the front panel of the VI. A sub-VI, SRSRGAC Connect, handles setting the baud rate, parity and other serial line parameters appropriate for the RGA. It uses National Instrument’s implementation of the Virtual Instrument Software Architecture (VISA) standard for communications. This VISA session is propagated to each of the communications VIs in turn, along with the error status. If you are familiar with the SRS RGA command set (for example, see page 6-17 of this manual) you will recognize the two-letter designations on the VIs that set the initial mass (MI), final mass (MF), noise floor (NF), filament current (FL), and so forth. Within the while loop, two VIs handle the RGA output and format it as an array of data values. These VIs take care of reading the 4 byte binary string, changing the byte order, and converting the ASCII bytes into floating point numbers. Unless there is an error or the user changes the status of the scan enable button on the front panel, these commands repeat in the while loop until an entire scan is generated. After a scan is acquired, the RGA is set to stop scanning, its filament is turned off, the VISA session is closed and any errors are reported. Operations Layer VIs What are the operations layer VIs? The operations layer encapsulates many of the communications layer functions. This layer is oriented towards common tasks the RGA will need to perform in any application. Rather than explicitly addressing the individual serial commands that are required to perform these tasks, these commands are used implicitly by the operations layer. In order to illustrate the use of the operations layer VIs, we created three separate applications (Simple Analog, Simple Table, and Simple Histogram) from these VIs. These examples are excellent starting points for your own custom applications. When should I use this layer? The operations layer is the right starting point for most LabVIEW programmers. It is task (rather than command) oriented, and yet is still on a low enough level to provide a great deal of flexibility in the development of custom applications. SRS Residual Gas Analyzer 8 Appendix D Examples The development kit provides three examples of how to use the operations layer. Each example is an application that performs a common RGA scanning mode (table, analog, and histogram). It is likely that your custom application can be created simply modifying one of these examples. Simple Table Try the example: Open LabVIEW Select the RGA LabVIEW Library Open the Simple Table example, SRSRGAa Simple Table From the front panel of the VI, set the COM port that the RGA is using For each channel, set the noise floor , mass, and electron multiplier state Run the VI SRS Residual Gas Analyzer Appendix D 9 The VI takes a few moments before the scan begins in order to perform some initialization tasks on the RGA. After this time, you should see traces corresponding to the partial pressures detected by the RGA as its mass filter is swept. If the traces do not appear after thirty seconds or you get an error, use the RGA COM program supplied with your RGA to verify communications are set up correctly. Make sure the power to the RGA is on (check the power LED), verify the COM port setting is correct, and test the cabling. Concepts from the example: Within LabVIEW, view the block diagram of SRSRGAa Simple Table (press Control-E if you are already looking at the front panel of the VI). The figure below shows this block diagram. SRS Residual Gas Analyzer 10 Appendix D As shown in the figure, the Simple Table example uses just six VIs. All the VIs in gray are taken from the operations layer, while the only one that is not is the general SRSRGA Error handler VI. Just as in the communications layer example, you can see that an error cluster is propagated through the six VIs. However, rather than propagating the SRSRGA VISA session explicitly, the session is propagated by referring to its reference number (or refnum). By double-clicking on the sub-VIs that appear to the right of the Open VI, you will see that each VI takes the refnum as input, then passes it to SRSRGAo Get Session. This VI accesses the serial communications session referred to by the SRSRGA refnum, and sends commands or receives data from that session. By using the operations level, you don’t have to worry about dealing with the VISA session directly; the VIs in this layer will handle that for you. After taking your input from the specifications cluster and opening an SRS RGA session, the Start Table VI sets the electron emission and calibrates any noise floor / electron multiplier parameters if necessary. Within the while loop, the Measure Table VI sends repeated MR queries to the RGA, and formats the binary data into an array of pressure readings. This array is plotted in the P vs. t graph that is visible on the front panel. The rate at which the data appears is governed by the multiple millisecond delay in the while loop. The user sets the delay from the front panel. The condition for the while loop is simply that the user has not stopped the scan and that no errors are present. If the while loop ends, the mass filtering is turned off, as is the electron multiplier and the filament. Any errors are reported at this time. Simple Analog Try the example: Open LabVIEW Select the RGA LabVIEW Library Open the Simple Analog example, SRSRGAa Simple Analog From the front panel of the VI, set the COM port that the RGA is using Set the noise floor, mass, and electron multiplier state Run the VI SRS Residual Gas Analyzer Appendix D 11 The VI takes a few moments before the scan begins in order to perform some initialization tasks on the RGA. After this time, you should see a trace corresponding to the partial pressures detected by the RGA as its mass filter is swept. If the trace does not appear after thirty seconds or you get an error, use the RGA COM program supplied with your RGA to verify communications are set up correctly. Make sure the power to the RGA is on (check the power LED), verify the COM port setting is correct, and test the cabling. Concepts from the example: Within LabVIEW, view the block diagram of SRSRGAa Simple Analog (press Control-E if you are already looking at the front panel of the VI). The next figure shows this block diagram. SRS Residual Gas Analyzer 12 Appendix D Note that this block diagram is very similar to the Simple Table block diagram. Again, only six VIs are used. All the VIs in gray are taken from the operations layer, while the only one that is not is the general SRSRGA Error handler VI. Just as in the communications layer example, you can see that an error cluster is propagated through the six VIs. However, rather than propagating the SRSRGA VISA session explicitly, the session is propagated by referring to its reference number (or refnum). By double-clicking on the sub-VIs that appear to the right of the Open VI, you will see that each VI takes the refnum as input, then passes it to SRSRGAo Get Session. This VI accesses the serial communications session referred to by the SRSRGA refnum, and sends commands or receives data from that session. By using the operations level, you don’t have to worry about dealing with the VISA session directly; the VIs in this layer will handle that for you. In this VI, an array of all the points in the scan is created beforehand and each point initialized as “not a number”. This is different from the previous example of Simple Table scanning, where the points are simply plotted as they are read in. In Simple Analog (and Histogram) the initialized array changes in the ordinate as new values are read in, but the abscissa (the mass range) always stays the same. Also, rather than using a multiple number of milliseconds in the while loop, a fixed delay of 250 milliseconds is used. Very tight while loops can put unnecessary stress on a multi-threaded application or operating system. This slight delay helps guard against problems stemming from having no delay in the execution of the while loop. After taking your input from the specifications cluster and opening an SRS RGA session, the Start Analog VI sets the RGA parameters you request, performs a calibration, calculates the number of points that will be coming from the RGA, and triggers a scan. Within the while loop, the Measure Pressures VI formats the binary data into an array of pressure readings. This array is plotted in the graph that is visible on the front panel. The condition for the while loop is simply that the user has not stopped the scan and that no errors are present. If the while loop ends, the mass filtering is turned off, as is the electron multiplier and the filament. Any errors are reported at this time. SRS Residual Gas Analyzer Appendix D 13 Simple Histogram Try the example: Open LabVIEW Select the RGA LabVIEW Library Open the Simple Histogram example, SRSRGAa Simple Histogram From the front panel of the VI, set the COM port that the RGA is using Set the noise floor, mass, and electron multiplier state Run the VI The VI takes a few moments before the scan begins in order to perform some initialization tasks on the RGA. After this time, you should see histogram bars corresponding to the partial pressures detected by the RGA as its mass filter is swept. If the trace does not appear after thirty seconds or you get an error, use the RGA COM program supplied with your RGA to verify communications are set up correctly. Make sure the power to the RGA is on (check the power LED), verify the COM port setting is correct, and test the cabling. SRS Residual Gas Analyzer 14 Appendix D Concepts from the example: Within LabVIEW, view the block diagram of SRSRGAa Simple Analog (press Control-E if you are already looking at the front panel of the VI). The next figure shows this block diagram. Note that this block diagram is very similar to the Simple Table block diagram. Again, only six VIs are used. All the VIs in gray are taken from the operations layer, while the only one that is not is the general SRSRGA Error handler VI. Just as in the communications layer example, you can see that an error cluster is propagated through the six VIs. However, rather than propagating the SRSRGA VISA session explicitly, the session is propagated by referring to its reference number (or refnum). By double-clicking on the sub-VIs that appear to the right of the Open VI, you will see that each VI takes the refnum as input, then passes it to SRSRGAo Get Session. This VI accesses the serial communications session referred to by the SRSRGA refnum, and sends commands or receives data from that session. By using the operations level, you don’t have to worry about dealing with the VISA session directly; the VIs in this layer will handle that for you. In this VI, an array of all the points in the scan is created beforehand and each point initialized as “not a number”. This is different from the previous example of Simple Table scanning, where the points are simply plotted as they are read in. In Simple Histogram (and Analog) the initialized array changes in the ordinate (pressure) as new values are read in, but the abscissa (the mass range) always stays the same. Also, rather than using a multiple number of milliseconds in the while loop, a fixed delay of 250 milliseconds is used. Very tight while loops often put stress on a multi-threaded application or operating system. This slight delay helps guard against problems stemming from having no delay in the execution of the while loop. Applications Layer VIs What are the applications layer VIs? The applications layer is built upon the VIs in the operations layer. In the previous section, we discussed the use of several operations layer VIs in three application examples (simple analog, histogram, and table). In this section, we discuss using a fully developed application that encompasses setups for the RGA hardware, scanning parameters, and datalogging. SRS Residual Gas Analyzer Appendix D 15 When should I use this layer? While the simple applications built from the operations layer make great starting points, the fully developed application (SRS RGA LabVIEW) is really for expert LabVIEW programmers. The code is complex, and sparsely documented. It is easy to get stuck with an application that will no longer function correctly. If you feel very confident of your LabVIEW abilities, then modifying SRS RGA LabVIEW might be a good place to start, especially if you need only a small modification. Bear in mind that SRS does not support the development of new applications with the kit. SRS RGA LabVIEW is provided primarily as an example to demonstrate the possibilities of using LabVIEW for custom applications. You may find that SRS RGA LabVIEW lets you do everything you did in RGA Windows. There are also improvements in compatibility in SRS RGA LabVIEW over RGA Windows, because of the inherent compatibility of LabVIEW. SRS RGA LabVIEW also allows datalogging with 100 ms time resolution, an order of magnitude improvement from RGA Windows. The main drawback to SRS RGA LabVIEW as compared with RGA Windows is that there is no detector calibration utility. However, if you are like most users, calibration of the detector is only rarely required, and you can always go back to RGA Windows to perform a calibration. For these reasons, some users may consider using SRS RGA LabVIEW as an alternative to RGA Windows. Using SRS RGA LabVIEW Connecting Open LabVIEW Select the RGA LabVIEW Library Open the main VI, SRSRGAa Main.VI You will notice that the front panel is very small. This window is dynamically sized in order to help enforce the proper use of the RGA. Do not change the size of the window; the dynamic sizing routine makes the assumption that the window dimensions did not change from the default values. Run the VI. At this point, you should see a window similar to the figure below. There should be at least one choice for the Port number. If there is no number next to the “Port” button, the most likely explanation is that the National Instruments VISA drivers were not installed. Above we discussed how VISA is used in the lowest layer of the kit, the communications layer. National Instruments VISA drivers are required, even if your COM ports function without them in other applications. Select the COM port that is connected to the RGA by clicking on the pull-down menu next to the “Port” label. SRS Residual Gas Analyzer 16 Appendix D Press the “Connect” button. At this point, the application sends some queries to determine hardware parameters and to perform initialization tasks. After a few moments, you should see a menu similar to the next figure: Notice that the window has re-sized to show new menu choices once RGA communication is established. Also, you cannot exit the program without first disconnecting from the RGA. Ionizer Setup Dialog Click the button labeled “Ionizer Setup…” This dialog allows you to change parameters relating to the ionizer hardware. Your parameter values may differ from the figure; the dialog simply displays the last values used. If you should accidentally change something and you wish to return all values to what the were when you opened the dialog, click the “Revert” button. If you wish to restore the factory defaults for the ionizer parameters, click the “Factory” button. Exit the ionizer setup dialog by clicking the “Cancel” button. Detector Setup Dialog Click the button labeled “Detector Setup…” SRS Residual Gas Analyzer Appendix D 17 This dialog allows you to change parameters relating to the detector of the RGA. You may wish to change the noise floor value (0 gives the slowest scan with the best signal to noise ratio, 7 is the fastest scan with the poorest signal to noise ratio). For a complete discussion of detection limit vs. scan rate, see page 4-8 of the RGA manual. Note that if your RGA is not equipped with an electron multiplier, parameters pertaining to it should be unavailable. WARNING!! Changing only the gain or only the voltage parameters of the electron multiplier (EM) can ruin your calibration. Changing these parameters requires re-calibration of the electron multiplier. Otherwise, the same partial pressure will produce different readings depending upon whether the multiplier is on or off. You can do a manual calibration of your electron multiplier by following these steps: Raise the high voltage setting of the EM Set the Gain factor to 1 Run an analog scan in both faraday cup and EM detection modes, noting the partial pressure for the same peak in both scans. The ratio of these peaks is the gain under the new high voltage setting. Set the gain parameter to this value. For a complete discussion and instructions on the electron multiplier tuning procedure, see page 7-14 of the RGA manual. Close the Detector Setup Dialog by pressing “Cancel” Applying Power to the Filament To turn the filament on, click the button labeled “ON” next to the label “Filament”. After a few moments, your menu should look something like the following figure. WARNING!! Your vacuum system should be at a pressure less than 1 x 10⁻⁴ torr before turning on the filament. Pressures greater than this threshold will quickly ruin the filament. For complete installation instructions and vacuum safety measures, see Chapter 1 of the RGA manual. SRS Residual Gas Analyzer 18 Appendix D The “virtual led” next to the Filament label should be lit before performing a scan. (Note: If your vacuum chamber is equipped with an external ionization source SRS RGA LabVIEW will let you scan with the filament off.) Scanning & Logging Setup Dialog Click the button labeled “Scan/Log Setup…” The Scanning & Logging dialog allows you to set up a scan for any of the three scanning modes (analog, table, histogram) from within a single screen. If you were setting up an analog scan, you would only need to specify the initial and final mass of the scan range. The default range is 100 AMU. For demonstration, SRS Residual Gas Analyzer Appendix D 19 we will run a table scan of four different masses with a 10 to 50 AMU scan range and we will log all the data the RGA produces. Change your dialog to look like the following figure: To change the mass range you can either click and drag the graphical bar labeled Mass Range, or enter the initial and final masses directly in the spaces provided. To add masses for a table scan, type the mass in the box labeled “AMU” and the noise floor value you wish to use for that mass in the box labeled “NF”. If you have an electron multiplier, you also have the option of turning it on or off by clicking in the box labeled “CEM”. To set the log filename, simply click on “Select log file” and follow the prompts to select the directory and filename you wish to use. Click on the toggle button next to the label “In Table Mode,” so that “record all backlog data” is selected. If you wish to perform leak testing, you must use table mode. Select a particular mass for leak testing by highlighting that mass in the gray background table. In the example above, mass 44 is highlighted. After you click on “Use for leak detect” a black diamond will appear to the left of the mass used for leak detection. Exit the Scanning & Logging dialog by pressing “OK”. Running a Scan Select Table Mode from the main menu using the pull down menu next to the label “Mode”. The main menu should look like the next figure before you are ready to run the scan. SRS Residual Gas Analyzer 20 Appendix D Click the button labeled “Start Scanning”. After a few moments, you should get a window that looks something like the next figure: SRS Residual Gas Analyzer Appendix D 21 If you were doing a leak test, you would change the value in the box labeled “Leak Ref” to a reference value. This is the value you wish to classify as a leak. If the partial pressure of the mass selected for leak testing approaches this value, a tone is generated. The tone goes up in pitch the closer the partial pressure is to the reference value. If you wish to change to a linear scale, click the button labeled “Log”. This toggle switch goes back and forth between logarithmic and linear representations of the ordinate scale. When you are finished with the demo, stop the scan by pressing the button labeled “STOP” Examine the log file by opening the file in your favorite text editor. You should see something that resembles the following figure: The log file is tab delimited, and can be imported into virtually any spreadsheet utility. Using LabVIEW 6i to Broadcast RGA Data Reminder: SRS does not support LabVIEW. What follows is simply provided as a guide that should help you put your SRS RGA data on the web. You may need to make other changes to your computer, LabVIEW, or network environments. Contact National Instruments (http://www.ni.com) for assistance with using the web tools in LabVIEW 6i. SRS Residual Gas Analyzer 22 Appendix D Configure the Web Server Open LabVIEW 6i Start a new VI Under the Tools menu, select Options From the pull-down menu (whose default tab is “Paths”, select Web Server: Configuration Click the checkboxes for “Enable Web Server” and Log File Unless you have reason to use other values, simply use the default values for the root directory and the log filename. Error information will be stored in the web server’s log file and this may be important for troubleshooting with National Instruments technical support. Make sure the log file check box is enabled and that you note the location of the log file for later access. SRS Residual Gas Analyzer Appendix D 23 Open and run SRS RGA LabVIEW by selecting the main VI from the library. Perform the scan you wish to publish on the web, then stop the scan and exit the main program. The front panel for both the main VI and the scanning VI remain open. In this example, we will use an analog scan, and SRSRGAa Analog.VI From the front panel toolbar of SRSRGAa Analog.vi, select Tools, then Web Publishing Tool. The web publishing tool creates a hypertext markup language (HTML) file that will reside on the computer on which the VI is run. The web server within LabVIEW 6i will serve this page and embed a Joint Picture Experts Group (JPEG) format picture of the running VI in this file. If you select an “animated” VI, the server will update this picture repeatedly to give the appearance of a “movie” of your running VI. At the time of writing only Netscape browsers support this kind of automatic updating. Bear in mind that if you only want a snapshot of how your vacuum system is doing, an animated web page is not required, and any web browser supports this kind of static web page. Notice that the button “Start Web Server” is grayed out. This is what you should see if you have been successful in enabling LabVIEW 6i’s web server. (Once enabled, the web server does not need to be started, and that is why the button is grayed out.) Change the Document Title, Text 1, and Text 2 to any label you wish. (If you want to further embellish your web page, you can always edit the file using your favorite web publishing tool once you select “Save to Disk”.) Click the “Save to Disk” button, and select where you wish to save the HTML file. Use the default directory location if possible. SRS Residual Gas Analyzer 24 Appendix D Once the HTML file is saved, you can preview it in your browser, by clicking the “Preview in Browser” button. Once you are satisfied with the HTML file, click “Start Web Server” and then click “Done”. You will get a pop-up notice box that looks something like this: Note that this Universal Resource Locator (URL) address will not work on computers other than the one running the VI. Clicking “Connect” will bring up the above URL within a browser on the computer running the VI, but not other computers. Note the filename you used. In this case it is “analog.htm”. In order to access the HTML page with the embedded picture of your running VI, you must include the Internet Protocol (IP) address of the machine that is running the LabVIEW 6i web server. To find the IP address of a computer under Windows 98, click on the Start menu, then select the “Run…” option. Type in “winipcfg” at the run prompt and you should get a window like this: Under Windows 95, Click “Start”, then “Control Panel”, then double-click “Network” to get something like the following figure: SRS Residual Gas Analyzer Appendix D 25 Select TCP/IP and click the Properties button to find the IP address: SRS Residual Gas Analyzer 26 Appendix D WARNING!! DO NOT CHANGE any network settings! Making changes will cause problems with your network. Use this dialog box simply to get the IP address of the computer running the VI you wish to put on the web. If you are unable to find the IP address of the computer that will run your VI and serve the web page, contact your network administrator. Now you are ready to run your VI and try out the web publishing feature of LabVIEW 6i. Run SRSRGAa Main.vi and run the analog scan (or whichever scan mode you used the web publishing tool with). Go to another computer on your network and type the IP address of the computer running the VI followed by a forward slash and the name of the HTML file. For example, if the computer running the VI has an IP address of 123.123.123.123, and you saved the HTML file under analog.htm, the URL would be http://123.123.123.123/analog.htm. In the example below we used 209.239.167.155 and the filename analog.htm. If everything is set up correctly, you should see your VI running in a browser window as in the figure below. SRS Residual Gas Analyzer Appendix D 27 SRS Residual Gas Analyzer 28 Appendix D SRS Residual Gas Analyzer Glossary of Terms 1 Glossary of Terms The following is a listing of some of the most important terms used throughout the SRS RGA Operations Manual. For a more complete listing of terms relevant to partial pressure analyzers in general, refer to: “A Dictionary of Vacuum Terms used in Vacuum Science and Technology, Surface Science, Thin Film Technology and Vacuum Metalurgy”, edited by M. S. Kaminsky and J. M. Lafferty, published by the American Vacuum Society, 1979. A. Basford et. al., J. Vac. Sci. Technol. A 11(3) (1993) A22-40: “Recommended Practice for the Calibration of Mass Spectrometers for Partial Pressure Analysis. Update to AVS Standard 2.3”. Anode Grid (Ionizer Component): Positively biased grid cage of the ionizer within which the ionization of the gas molecules takes place. Note: In the SRS RGA, the voltage bias of the anode grid, in Volts, sets the ion energy (in eV) for the spectrometer. Atomic mass unit (abbreviation: amu). A unit of mass equal to one twelfth the mass of a neutral carbon atom having six protons and six neutrons (12C); equivalent to 1.660566.10-27 kg. Background signal, H0. Output signal, measured with respect to baseline, which is obtained before the introduction of any gas in the chamber. Base pressure (also Background pressure). Total pressure before introduction of any gases into a vacuum system. Usually, the base pressure is the lowest pressure that is typically achieved in the vacuum chamber. Baseline. The output signal from the RGA when no ions are arriving at the detector. CDEM. Abbreviation for the type of electron multipliers known as: Continuous Dynode Electron Multiplier. CF. Abbreviation for Conflat type flange. CF Nipple. A short section of vacuum pipe terminated with a standard Conflat flange connector at each end. Charge, Q. The electron charge of an ion. Ion charge occurs in multiples of the electron charge, e-. Drift. A change in time in the avearge output signal at constant partial pressure. ECU. Abbreviation for electronics control unit. SRS Residual Gas Analyzer 2 Glossary of Terms Electron emission. The release of electrons from the heated filament in the ionizer. The electrons are accelerated into the anode grid where the ionization of the gas molecules occurs. Electron emission current. The electron current from the filament to the grid in mAmps. Ion current signals scale linearly with the electron emission current. Note: The available emission current range in the SRS RGA is 0 to 3.5 mA. Electron Energy. The kinetic energy of the electrons (in eV) used for electron bombardment in the ionizer. Note: In the SRS RGA the Electron Energy is equal to the voltage difference (in Volts) beween the filament and the anode grid. Electronics Control Unit (abbreviation: ECU). Electronics box that attaches directly to the probes feedtrhu flange and contains all the necessary components to operate the quadrupole mass spectrometer and communicate with a host computer. Faraday Cup. A charged particle detector, consisting of a metal electrode, for the direct collection and detection of charged particles. Note: Typical designs are cup shaped to minimize secondary electron losses. Filament (Ionizer Component). The source of the ionizing electrons. Thin, thoria coated, Iridium wire that operates at a negative potential relative to ground and is resistively heated to incandescence with an electrical current from the emission regulator. The thermionically emitted electrons are accelerated towards the anode grid which is positively charged with reference to the filament and ground. Focus Plate (Ionizer component). Ionizer’s electrode plate that serves the double purpose of drawing the ions away from the anode grid, and containing the ionizing electrons inside the source. Fragment ion. An ion of mass smaller than that of the original parent molecule. Fragmentation factor. The fragmentation factor of gas g at mass M is defined as the ratio of ion signal at mass M to the ion signal at the principal mass peak of gas g. Fragmentation of molecules: The breaking of multi-atomic molecules into units of fewer atoms, some of which are usually electrically charged. Fragmentation (or cracking) pattern. The fragment distribution of ionic species which results from dissociation and ionization of multi-atomic molecules of given species in the ionizer. Head (also RGA Head). The combination of the Probe and the Electronics Control Unit. Inert Gas. A gas that does not normally react chemically with other substances. Example: He, Ar, Kr and Xe. Typically used for calibration purposes in RGA’s. Ion. An atom or molecule which has gained or lost one or more electrons and therefore has a negative or positive charge. Note: Most RGA’s use electron bombardment to ionize molecules and detect only positive ions. SRS Residual Gas Analyzer Glossary of Terms 3 Ion current. The rate of ion flow into the detector. Usually expressed in units of amps. Ion Energy. The kinetic energy of the ions as they move down the quadrupole mass filter, and expressed in eV. Note: In the SRS RGA the Ion Energy is equal to the voltage biasing of the anode grid in Volts and has two possible settings (i.e. Low and High). Ionization. The process that results in the formation of ions from neutral atoms or molecules. During ionization, electrons are added or removed from the molecules to form negative or positive ions respectively. Note: In the SRS RGA the ionization is caused by electron bombardment; outer electrons are removed by the impact of energetic electrons on the molecules. Ionization efficiency. The ionization probability normalized to the probability of ionization of a reference gas. Ionization Potential. The minimum energy per unit charge (often in eV) required to remove an electron from an atom (or molecule) to infinite distance. Note: In the SRS RGA the Electron energy must be set above the ionization potential of the molecules for ionization to occur. Ionization probability. The number s of ion pairs (equal amounts of positive and negative charges appear as ions) produced by an electron traveling a unit ditance (typically 1 cm) through a gas at unit pressure (typically 1 mTorr). It depends on the ionization potential of the electrons used for bombardment. Ionizer (Probe Component). The portion of the mass psectrometer probe that generates the ions and accelerates them as a beam. Note: The components of the SRS RGA ionizer are: anode grid, repeller, focus plate, and filament. Linearity. The extent to which the change in output signal of the RGA is proportional to the corresponding change in partial pressure. Linear response range. The partial pressure range over which linearity in the signal response is observed. See linearity. Mass-to-charge ratio: The mass-to-charge ratio, M/Q, is defined as the ratio of the mass number M of the ion to its charge Q, measured in units of the electron charge e-. For example: doubly charged ions of argon isotope 36 (36Ar2+) and singly charged ions of water, 1H216O1+, have M/Q = 18, and cannot be differentiated from each other with most mass spectrometers. Note: Mass spectrometers do not actually measure the molecular mass directly, but rather the mass-to-charge ratio of the ions. For singly charged ions, the mass to charge ratio is numerically equal to the mass of the ion in atomic mass units (amu). Mass analyzer (Probe component). The portion of the mass spectrometer probe that separates the ion beam into its various mass-to-charge ratio components. Also referred to as Quadrupole mass filter. Mass Number, M. The mass number, M, is the sum of the number of protons and neutrons in an atom or molecule. SRS Residual Gas Analyzer 4 Glossary of Terms Mass peak. The ion current pattern in the vicinity of maximum amplitude by scanning through a small portion of the mass range containing ions of a single mass-to-charge ratio. Very often, the term “mass peak” refers to the signal developed from singly charged ions. For example, nitrogen is said to have a “mass 28 peak”. Mass Range. The range of mass numbers defined by the mass number of the lightest and the heaviest singly charged ions which can be detected by the RGA. Mass spectrometer. An instrument which produces a beam of molecular ions from a sample, separates the resulting mixture of ions according to their mass-to-charge ratios, and provides output signals which are measures of the realtive abundances of the ionic species present. Mass spectrum. A graph of ion abundance vs mass-to-charge ratio. Minimum Detectable Partial Pressure change (MDPP). The partial pressure change corresponding to the smallest signal change which can be distinguished from noise. A common prescription is, 'pmin=V/Sg, where V is the noise and Sg is the partial pressure sensitivity for the gas being measured. Noise. Random fluctuation in the output signal unrelated to a change in the partial pressure of the gas from which the signal is derived. The appropriate measure of noise is the standard deviation VN of N independent determinations of the average output signal obtained at constant partial pressure. Open Ion Source (Also Nude Ion Source). An ionizer with electrodes of high transparency to gases. Outgassing. The evolution of gas molecules from the internal wall surfaces of the vacuum system. Parent ion. An ion of the same mass as that of the original parent molecule. Partial Pressure. The pressure of a designated component of a gaseous mixture within a system as it is exerted on the chamber walls. The sum of the partial pressures of all the kinds of gases gives the total pressure. Partial Pressure Analyzer (abbreviation: PPA). A compact mass spectrometer used to analyze the residual gas composition in a vacuum system. Peak height (also peak intensity). The maximum ion signal developed in the RGA for a given mass-to-charge ratio peak. Peak width ('Mv%). The difference between the mass-to-charge ratio values on either side of a mass peak at which the signal has dropped to v% of the peak height, H. See also Resolution. Principal mass peak. The most intense peak in the fragmentation pattern of any molecule. SRS Residual Gas Analyzer Glossary of Terms 5 Probe (also RGA Probe). Quadrupole mass spectrometer sensor consisting of an ionizer, a mass analyzer and a detector (Farday cup or optional electron multiplier). Repeller (Ionizer Component). The repeller grid cage completely encloses the ionizer, is biased negative relative to the filament, and prevents the loss of electrons from the ion source. Residual Gas Analyzer (abbreviation: RGA). A compact mass spectrometer used to analyze the residual gas composition in a vacuum system (same as Partial Pressure Analyzer). Resolution, or Absolute Resolution, 'M10%. The width 'M of the pass band of the filter, defined as the full width at which the ion current falls down to 10% of the maximum value. In mass-to-charge ratio units. See also Peak width. Resolving Power: R= M/'M10% : Ratio between a particular mass-to-charge ratio M and the resolution, 'M10% , at that mass. Dimensionless ratio. RGA. Abbreviation for Residual Gas Analyzer. RGA Cover Nipple. CF Nipple that covers the RGA Probe. Scan Speed (mass spectrometer). The speed at which the RGA scans through a range of succesive mass numbers. Scanning. The procedure of continuously changing the mass tuning of the quadrupole mass spectrometer to bring successive mass numbers into tune. Sensitivity. Partial Pressure: The partial pressure sensitivity of the RGA to a gas g, Sg, is defined as the ratio of the change (H-H0) in principal mass peak height to the corresponding change (P-P0) in total pressure due to a change in partial pressure of the particular gas species. H0 and P0 are background values. Sg = (H-H0) / (P-P0) The units of Sg are of ion current per unit pressure (amp/Torr, for example). Total Pressure: The total pressure sensitivity of the RGA to a gas g, is defined similarly as the ratio of the change (H-H0) in total ion current to the corresponding change (P-P0) in total pressure due to a change in partial pressure of the particular gas species. H0 and P0 are background values. SRS Residual Gas Analyzer 6 Glossary of Terms Sensitivity calibration. The act of establishing a a correspondence between the change in ion current and the corresponding change in partial pressure of the gas from which the ion is produced. The correspondence might be represented graphically or as a table of values. See also Sensitivity. Space charge. The electrical charge carried by a cloud of free elctrons or ions. Space charge can causes serious changes in the potential distributions of the ionizer, and ultimately limits the pressure operating range of all RGA’s. Total Pressure. The average normal force per unit area exerted by all the gas molecules impacting on the internal surfaces of the vacuum chamber. Units are typically Torr, mbar or Pascal. Note: The SRS RGA is capable of collecting total ion currents that can be turned into total pressure measurements with the help of gas dependent total pressure sensitivity factors. UHV. Abbreviation for Ultra High Vacuum. Pressure < 10-9 Torr. SRS Residual Gas Analyzer Vacuum References TABLE OF CONTENTS VACUUM TECHNOLOGY BOOKS ................................................................................................................................ 2 RESIDUAL GAS ANALYSIS ......................................................................................................................................... 2 APPLICATIONS OF RESIDUAL GAS ANALYZERS TO PROCESS/QUALITY CONTROL ..................................................... 4 SPECIALIZED/UNUSUAL APPLICATIONS OF RGAS ..................................................................................................... 7 HIGH PRESSURE SAMPLING/ DIFFERENTIAL PUMPING ............................................................................................... 9 QUANTITATIVE MEASUREMENTS WITH RESIDUAL GAS ANALYZERS......................................................................... 9 MULTIPLE LINEAR REGRESSION ANALYSIS ALGORITHMS ....................................................................................... 10 VACUUM SYSTEM DESIGN....................................................................................................................................... 10 VACUUM SYSTEM CONTAMINATION ....................................................................................................................... 15 VACUUM PUMPS...................................................................................................................................................... 18 TOTAL PRESSURE MEASUREMENT........................................................................................................................... 22 BAYARD-ALPERT IONIZATION GAUGES .................................................................................................................. 23 PIRANI/THERMOCOUPLE GAUGES ........................................................................................................................... 26 PRESSURE CALIBRATION/SPINNING ROTOR GAUGE ................................................................................................ 26 TEMPERATURE PROGRAMMED DESORPTION ........................................................................................................... 28 MEMBRANE INTRODUCTION MASS SPECTROMETRY (MIMS).................................................................................. 29 VARIABLE LEAK VALVES ........................................................................................................................................ 30 VACUUM AND PROCESS CONTROL PUBLICATIONS .................................................................................................. 30 VACUUM AND PROCESS CONTROL WEBSITES ......................................................................................................... 31 SRS-Vacuum Technology References Vacuum Technology Books 1. J. M. Lafferty , editor, “Foundations of Vacuum Science and Technology”, John Wiley and Sons, Inc., NY, 1998. Note: A great book that every vacuum practitioner should own. 2. J. H. Leck, “Total and Partial Pressure Measurement in Vacuum Systems”, Blackie, Glasgow&London, 1989. Note: Another classic. Great chapters on gauging. 3. Armand Berman, “Total Pressure Measurements in Vacuum Technology”, Academic Press, Orlando, FL, 1985 4. J. F. O’Hanlon, “A user’s guide to Vacuum Technology”, 2nd. Ed. , Wiley, NY, 1989. 5. Gerhard Lewin, “An Elementary Introduction to Vacuum Technique”, AVS Monograph Series, American Institute of Physics, Inc. NY, NY, 1987. Note: Great Little reference book. 6. John H. Moore et. al. , “Building Scientific Apparatus: A Practical Guide to Design and Construction, 2nd edition”, Addison Wesley, Redwood City, CA, 1989. Note: Every science research laboratory must have a copy of this book on its shelfs. The Vacuum Technology chapter (Chapter 3, p. 75) provides one of the best introductions to vacuum technology and vacuum system design we have ever seen! 7. Walter H. Kohl, “Handbook of Materials and Techniques for Vacuum Devices”, American Vacuum Society Classics, AIP Press, New York, 1995. 8. Phil Danielson, “Building a Vacuum Library”, R&D, March 2002, p. 34 9. Special Issue Journal Of Vacuum Science and Technology A, Second Series, Volume 21, Number 5, Supplement. Note: Very useful Vacuum Science and Technology papers by P. A. Redhead, J. P. Hobson, P. A. Redhead , Kimo Welch and H. F. Dylla. Including gauging, pumping and UV technologies. Residual Gas Analysis 1. Dawson, “Quadrupole Mass Spectrometry and Its Applications”, AIP Press, NY, 1995. 2. Drinkwine and D. Lichtman, “Partial Pressure Analyzers and Analysis”, AVS Monograph Series published by the Education Committee of the American Vacuum Society. http://www.avs.org. 3. Anne B. Giordani et. al., “What is Mass Spectrometry?”, 1998, a supplement to the Journal of the American Society of Mass Spectrometry. http://www.asms.org. 4. Basford et. al., J. Vac. Sci. Technol. A 11(3) (1993) A22-40: “Recommended Practice for the Calibration of Mass Spectrometers for Partial Pressure Analysis. Update to AVS Standard 2.3”. http://www.avs.org SRS-Vacuum Technology References Vacuum References 3 5. Batey, Vacuum, 37 (1987) 659-668:” Quadrupole Gas Analyzers” 6. Fu Ming Mao et. al., Vacuum, 37 (1987) 669-675: “ The quadrupole mass spectrometer in practical operation” 7. Dawson, Mass Spectrometry Reviews, 5 (1986) 1-37: “Quadrupole mass analyzers: Performance, design, and some recent applications” 8. Austin et. al., Vacuum 41(1990)2001, “Optimization of the operation of the small quadrupole mass spectrometer to give minimum long-term instability” 9. M. G. Rao and C. Dong, J. Vac. Sci. Technol. A 15(3) (1997) 1312, “Evaluation of low cost residual gas analyzers for ultrahigh vacuum applications”. Note: The RGA models in this paper are: A: MKS PPT 050EM, B: SRS 100 AMU with electron multiplier, C: MKS PPT 200EM, D: Balzers QMS 200 M, E: Leybold Inficon High performance Transpectorr H100M as indicated by the authors. 10. S. Daolio, et. al., “Quadrupole Secondary Ion Mass Spectrometer for Simultaneous Detection of Positive and Negative Ions”, Rapid. Commun. Mass Spectrom. 13 (1999) 782-785 11. Changkung Dong and G. Rao Myneni, “Field emitter based extractor gauges and residual gas analyzers”, J. Vac. Sci. Technol. A17(4) (1999) 2026. Note: An SRS RGA was retrofitted with a Spindt-type field emitter array. Residual gas spectra indicate reduced O, Cl and F electron stimulated desorption. 12. Shue Watanabe, Hitoshi Oyama, Shigeki Kato and Masakazu Aono, “Measurement of partial pressures in extremely high vacuum region using a modified residual gas analyzer”, Rev. Sci. Instr. 70 (1999) 1880 13. T. E. Felter, “Cold cathode emitter array on a quadrupole mass spectrometer: Route to miniaturization”, J. Vac. Sci. Technol. B 17(5), Sept/Oct 1999, p. 1993 14. J. H. Batey, “Thermal Desorption from mass spectrometer filaments”, Vacuum 43(1) (1992) 15 15. J. R. Gibson, S. Taylor and J. H. Leck, “Detailed simulation of mass spectra for quadrupole mass spectrometer systems”, J. Vac. Sci. Technol. A 18(1) (2000) 237 16. Ma’an H. Amad and R. S. Houk, “Mass resolution of 11,000 to 22,000 with a multiple pass Quadrupole mass analyzer”, J. Am. Soc. Mass Spectrom. 11 (2000) 407. Note: Very clever way to get awesome resolution out of a small Quad. 17. J. R. Gibson and Stephen Taylor, “Prediction of quadrupole mass filter performance for hyperbolic and circular cross section electrodes”, Rapid Communications in Mass Spectrometry, 14 (2000) 1669. Note: Improved computational method used to calculate throughput of quadrupole filters with circular and hyperbolic shaped rods. 18. Sharon Lewis, “Simplifying the Residual Gas Analyzer”, R&D Magazine, October 2000, p. 21. SRS-Vacuum Technology References 4 Vacuum References 19. S. Boumsellek and R. J. Ferran, “Trade Offs in Miniature Quadrupole Designs”, J. Am. Soc. Mass Spectrom. 12 (2001) 633. Note: A complete article describing the inherent advantages and limitations of small quadrupole designs. 20. Gerardo A. Brucker, “How to use an RGA”, R&D Magazine, June 2001, p. 13. 21. Bob Langley and Paul LaMarche, “Mass Spectrometer Basics and Operation”, Vacuum Technology and Coating, Oct. 2002. P. 20. 22. Ethan Badman, R. Graham Cooks, “Miniature Mass Analyzers”, J. Mass Spectrom. 35 (2000)659 23. S. Taylor et.al., “A miniature mass spectrometer for chemical and biological sensing”, Proc. SPIE 4036 (2000) 187. 24. B. Wilamowski, et.al., “Enhancing the sensitivity of miniutarized mass spectrometers”, IECON’01, 27th Annual Conference of the IEEE Industrial Electronics Society, p. 147. 25. Phil Danielson, “Will RGAs Replace Ion Gauges?”, R&D Magazine, June 2003, p. 31. Note: Is an Ion Gauge good enough? When is an RGA required? Phil Danielson joins this long-standing debate… 26. Vladimir I. Baranov, “Analytical Approach for Description of Ion Motion in QMS”, J. Am. Soc. Mass Spectrom. 14 (2003) 818. 27. Vladimir I. Baranov, “Analytical approach for description of Ion Motion in Quadrupole Mass Spectrometer”, J. Am. Soc. Mass Spectrom. 14 (2003) 818-82 28. N. Ogiwara, K. Suganuma , Y. Miyo , S. Kobayashi and Y. Saito, “Application of the field emitter array to the vacuum measurements”, Applied Surface Science, 146( 1999)234-238. Note: A Spindt emitter array is interfaced to an RGA. 29. Bob Langley and Paul LaMarche, “Analyzing Spectrometer Hydrocarbon Spectra”, Vac. Technology and Coating, Oct. 2003, p. 22. 30. E. Lanzinger, et. al., “Partial Pressure Measurement by means of infrared laser absorption spectroscopy”, Vacuum 51 (1998) 47-51. Applications of Residual Gas Analyzers to Process/Quality Control 1. O’Hanlon, J. Vac. Sci. Technol. A 12 (4), Jul/Aug 1994: “Ultrahigh vacuum in the semiconductor industry” 2. Vic Comello, R&D Magazine, September 1993, p. 65: “Process Monitoring with “Smart” RGAs” 3. Waits, et. al., Semiconductor International, May 1994, p. 79: “ Controlling your Vacuum Process: Effective Use of a QMA” SRS-Vacuum Technology References Vacuum References 5 4. Rosenberg, Semiconductor International, October 1995, p. 149: “The Advantages of Continuous On-line RGA Monitoring”. 5. Lakeman, Semiconductor International. October 1995, p. 127: “Increase overall Equipment Effectiveness with In Situ Mass Spectrometry”. 6. Semiconductor International Magazine, October 1995, p. 70, “ Researchers Demonstrate Viability of QMS for In Situ Diagnostics” 7. L.L. Tedder, et. al., J. Vac. Sci. Technol. B, 13(4) (1995) 1924, “Real-time process and product diagnostics in rapid thermal chemical vapor deposition using in situ mass spectrometry sampling” 8. C. D’Couto and Sanjay Tripathi, Semiconductor International, July 1996, p. 343, “Residual Gas Analysis Suggests Process Improvement” 9. R. W. Rosenberg, Semiconductor International, October 1995, p. 149, “The Advantages of Continuous On-line RGA Monitoring” 10. Vic Comello, “Using RGAs for Process Monitoring”, R&D Magazine, October 1997, p. 33. (“Back to Basics” article) 11. Vic Comello, “RGAs Provide Real Time Process Control”, Semiconductor International, September 1990. 12. P. Ausloos et. al., “The Critical Evaluation of a Comprehensive Mass Spectral Library”, J. Am. Soc. Mass Spec., 10 (1999) 287-299. 13. Robert Waits, “Semiconductor and thin film applications of a quadrupole mass spectrometer”, J. Vac. Sci. Technol. A 17(4) (1999) 1469. Note: A very good paper on applications of mass spectrometers to semiconductor processes. Highly recommended, probably required, reading! 14. Guangquan Lu, Laura L. Tedder and Gary W. Rubloff, “Process sensing and metrology in gate oxide growth by rapid thermal chemical vapor deposition from SiH4 and N2O”, J. Vac. Sci. Technol. B17(4) (1999) 1417 15. Brian Dickson, et. al., “Vacuum-based Process Toll Diagnostics: How to expose trends and problems that the tolls themselves cannot detect”, Vacuum and ThinFilm, August 1999, p.30 16. T. P. Schneider et. al., “Real-time in situ residual gas monitorring”, FUTURE FAB International, issue 4, volume 1, p.237. 17. A. G. Chakhovskoi, C. E. Hunt, M.E. Malinowski, “Gas Desorption electron stimulated during operation of field emitter-phosphor screen pairs”, Displays, 19 (1999) 179-184 18. Xi Li et. al., “Mass Spectrometric measurements on inductively coupled fluorocarbon plasmas: Positive Ions, Radicals, and Endpoint Detection”, J. Vac. Sci. Technol. A17(5) (1999) 2438 SRS-Vacuum Technology References 6 Vacuum References 19. Jim Snow, Stuart Tison and Walter Plante, “Evolving gas flow, measurement, and control technologies”, Solid State Technology, October 1999, p. 51. 20. Paul Espitalier-Noel, “Integrate gas, chemical, vacuum, and exhaust design”, Solid State Technology, Oct. 1999, p. 65 21. Charles C. Allgood, “Impact and behavior of trace contaminants in high purity plasma process gases”, Solid State Technology, Sept. 1999, p. 63 22. K. C. Lin, “Continuous Gas Monitoring Reduces Losses”, Semiconductor International, May 1999. 23. Babu R. Chalamala, David Uebelhoer and Kenneth A. Dean, “Apparatus for quantitative analysis of residual gases in flat panel vacuum packages”, J. Vac. Sci. Technol. A 18(2) (2000) 1. Note: Uses and SRS RGA300 for quantitative analysis of residual gases in flat panel displays. 24. Robert K. Waits, “Monitoring residual and process gases in PVD processes: The importance of sensitivity”, MICRO Magazine, June 1997, p. 81. Note: A great article including useful information on the effects of contaminants on sputter deposited films. 25. Russ Carr, “Sensor Automates Detection of Photoresist Residues”, R&D Magazine, March 2000, p. 51 26. Robert Waits, “Evolution of integrated-circuit vacuum processes: 1959-1975”, JVST A 18(4) (2000) 1736. 27. C. B. Yarling “History of Industrial and commercial ion implantation: 1906-1978”, JVST A 18 (4) (2000) 1746. 28. Thomas P. Scneider et. al. , “Using partial pressure analysis to monitor wet clean recovery”, Solid State Technology, August 2000, p. 117 29. Donald M. Mattox, “Applications of Vacuum Coating”, Vacuum Technology and Coating, May 2001, p. 16. 30. Surajed Promreuk, “Achieving process understanding and real-time fault detection on a PVD toll”, MICRO Magazine, March 2002, p. 45. 31. Steve Whitten, et. al., “Investigating an integrated approach to etch emissions management”, MICRO, March 2002, p. 83. 32. Peter Rosenthal, “Gas Analysis Solutions for Yield Improvement of Deposition Processes for LEDs and Large Area Coatings Applications”, Vacuum Technology and Coating, July 2003, p. 26. Note: It includes FTIR and Micropole Technology. 33. Xi Li. Et. al.,”Specially resolved mass spectrometric sampling of ICPs using a movable sampling orifice”, J. Vac. Sci. Technol. A21(6) (2003)1971. SRS-Vacuum Technology References Vacuum References 7 34. Xi Li. Et. al.,”Mass Spectrometric measurements on inductively coupled fluorocarbon plasmas: Positive ions, radicals and endpoint detection”, J. Vac. Sci. Technol. A 17(5) (1999) 2438. 35. Mark W.Raynor, et. al., “On-line Impurity Detection in Corrosive Gases Using Quadrupole Mass Spectrometry”, LEOS Newsletter, October 2000, page 9. Specialized/Unusual Applications of RGAs 1. Don Hall, Wells Shentwu, S. Michael Sterner, and Paul D. Wagner, 1997, “Using Fluid Inclusions to Explore for Oil and Gas”, Hart's Petroleum Engineer International, No. 11, p. 29-34. Note: SRS RGAs used to examine fluid inclusions from oil wells. 2. Hadley, Scott W., Don L. Hall, S. Michael Sterner, and Wells Shentwu, 1997, “Hydrocarbon Pay Delineation and Product Characterization with Fluid Inclusions: Examples from East Coast Canada and Western Canada Sedimentary Basin”, in Can. Well Log. Soc. in site, Vol. 1, No. 3, p.2-4. Note: SRS RGA s used to examine fluid inclusions from oil wells. 3. Harmeet Singh, et. al. “Mass spectrometric detection of reactive neutral species: Beam-to-background ratio”, J. Vac. Sci. Technol. A17(5) (1999) 2447 4. Harmeet Singh, J. W. Coburn and David B. Graves, “Appearance potential mass spectrometry: Discrimination of Dissociative ionization products”, J. Vac. Sci. Technol. A18(2) (2000) 299 5. Babu Chalamala, Robert Wallace and Bruce Gnade, “Poisoning of Spindt-type molybdenum field emitter arrays by CO2”, J. Vac. Sci. Technol. B 16(5) (1998) 2866. Note: SRS RGA100 is used in the study of the effect of CO2 on the emission characteristics of Spindt-type molybdenum field emission cathode arrays. 6. O. David Sparkman, “The 12th Sanibel Conference on Mass Spectrometry: FieldPortable and Miniature Mass Spectrometry”, J. Am. Soc. Mass Spectrom. 11 (2000) 468. Note: An interesting review of field portable mass spectrometry. 7. Scott A. Furman et. al., “Improving the detection limit of a quadrupole mass spectrometer”, J. Vac. Sci. Technol. A 19(3) (20001) 1032. 8. D. R. Ermer, et. al. “Intensity Dependence of Cation Kinetic Energies from 2,5dihydroxybenzoic acid near the infrared matrix-assisted laser desorption/ionization threshold”, Journal of Mass Spectrometry, 36 (2001) . Note: An SRS RGA is used in a TOF setup to determine the mechanism of Ionization of MALDI Matrices. Reprint kindly submitted by professor Richard Haglund, Jr. 9. R. T. Short et. al. , “Underwater Mass Spectrometers for in situ Chemical analysis of the Hydrosphere”, J. Am. Soc. Mass Spectrom. 12 (2001) 676. Note: An RGA is used in combination with Membrane Introduction Mass Spectrometry to do underwater analysis of VOCs. SRS-Vacuum Technology References 8 Vacuum References 10. Colin S. Creaser, David Gomez Lamarca, Jeffrey Brum, Christopher Werner, Anthony P. New and Luisa M. Freitas dos Santos,”Reversed-Phase Membrane Inlet Mass Spectrometry Applied to the Real-Time Monitoring of Low Molecular Weight Alcohols in Chloroform”, Anal. Chem. 74(2002) 300-304. NOTE: A SRS QMS300 is used to perform real-time MIMS determinations of alcohols in chloroform. RGAs are rapidly gaining acceptance in this field as their excellent price/performance value is realized by MIMS practitioners 11. N. Takahashi et. al., “Development of the quadrupole mass spectrometer with the Bessel-Box type energy analyzer: Function of the energy analyzer in the partial pressure measurements”, J. Vac. Sci. Technol. A 19(4) (2001) 1688 12. H. G. Buhrer, et.al., “Investigating the curing of amino resins with TGA-MS and TGA-FTIR”, UserCom, 2/2001, p. 13. ; Cyril Darribere, “TGA-FTIR and TGA-MS measurements”, UserCom, 2/2001, p. 21. Note: UserCom is a publication of METTLER TOLEDO (www.mettler.com), specialized in thermal analysis products including Thermal Gravimetric Analysis and Differential Scanning Calorimetry. RGAs have recently been interfaced to TGA analyzers providing confirmation of the nature of the species outgassed by the sample during the heating cycle. 13. C. Richard Arkin, et. al., “Evaluation of Small Mass Spectrometer Systems for Permanent Gas Analysis”, J. Am. Soc. Mass Spec. 13 (2002) 1004. Note: The SRS RGA100 is compared to several commercial (i.e. Leybold XPR-2 and Ferran Micropole) and research mass specs and found to be the best match for the analysis of cryogenic fuels around the Space Shuttle. This paper demonstrates the excellent accuracy, reproducibility and detectability of gas analysis systems based on SRS RGAs. 14. V. A. Shamamian et. al. “Mass Aspectrometric Characterization of Pulsed plasmas for deposition of thin polyethylene Glycol-like Polymer films”, Vacuum Technology and Coating, September 2002, p. 40. 15. Jorge Diaz, Clayton Giese and W. R. Gentry, “Mass Spectrometry for in-situ volcanic gas monitoring”, trends in analytical chemistry, vol. 21, no. 8, 2002. Note: A QMS300 is used to monitor volcanic gases in-situ. Includes cool pictures of a QMS300 on top of the Kilauea Volcano in Hawaii. 16. Paul LaMarche and Bob Langley, “Dial V for Vacuum”, Vacuum Technology and Coating, March 2003, p. 18.Note: This article describes the practical use of RGAs for Leak Testing. 17. Marcus B. Wise, Michael R. Guerin, “Direct Sampling Mass Spectrometry”, Anal. Chem., News and Features, Jan 1, 1997, p. 26A. Note: This is a great paper on all the ways in which mass specs are used to provide real time data for environmental screening. This is very relevant for QMS system users. 18. Gerardo A. Brucker, “What Else Can a RGA Do?, Vacuum Technology and Coating, July 2003, p. 36. 19. C. R. Cole, R. A. Outlaw, “Mass Spectral Resolution of F+ and H3O+ in very high vacuum”, J. Vac. Sci. Technol. A 21(5) (2003) 1796. Note: The infamous 19 amu SRS-Vacuum Technology References Vacuum References 9 peak is seen under a completely new light. Note: The 19 amu peak commonly een in RGAs and other mass sspecs is broken down into its multiple subcomponents and hydronium ions are identified as an important contributor”. Prof. Ron Outlaw uses SRS RGA Application notes 7 and 9 as references. 20. Several Authors, Filed Emission Arrays, J. Vac. Sci. Technol. B, Vol 21, No. 4, July/Aug 2003. Note: a compilation of articles on fiel emitter arrays (FEAs) used for vacuum applications including electron impact ionizers of mass specs. 21. Tom Basalik, “TGA with Evolved Gas Analysis”, American Laboratory, 37, Jan 2005, p. 24. 22. J. Wang and U. Burghaus, “Adsorption dynamics of CO2 on Zn-ZnO(0001): A molecular beam study” J. Chem Phys. 122 (2005)044705. Note: An SRS RGA is used for the measurements. High Pressure Sampling/ Differential Pumping 1. Gilbert R. Smith and Robert R. Gidner, Semiconductor International, “Innovative Gas Handling Technology”, June 1997, p. 125 2. Haripov F., J. Vac. Sci. Technol. A 15(4) (1997) 2434, “Rarefied gas flow through a long tube at arbitrary pressure and temperature drops” 3. Batey J. H. Vacuum 44 (5-7) (1993) 639, “Fractionation in gas inlets for PPA calibration” 4. Toshio Takiya, Fumio Higashino, Y. Terada, and A. Komura, “Pressure Wave propagation by gas expansion in a high vacuum tube”, J. Vac. Sci. Technol. A 17(4) (1999) 2059 5. Felix Shapirov, “Rarefied gas flow through a long rectangular channel”, J. Vac. Sci. Technol. A 17(5) (1999) 3062 6. Seksan Dheandhanoo, et. al., “Atmospheric Pressure Sample Inlet for Mass Spectrometers”, Rev. Sci. Instr.71 (2000) 4655. Note: a very versatile direct sample introduction inlet for atmospheric sampling. 7. I. E. Sodal and D. A. Hanna, “Improved mass spectrometer measurements using a pulsed gas sampling system”, J. Vac. Sci. Technol. A 15(1) (1997) 176. Quantitative Measurements with Residual Gas Analyzers 1. Bley, Vacuum, 38 (1988) 103-109: “Quantitative measurements with quadrupole mass spectrometers: important specifications for reliable measurements” 2. Cowen, et. al., J. Vac. Sci. Technol. A 12(1), Jan/Feb 1994: “ Non-linearities in sensitivity of quadrupole partial pressure analyzers operating at higher pressures” SRS-Vacuum Technology References 10 Vacuum References 3. L. J. Kieffer, et. al., Reviews of Modern Physics, 38(1) (19966) 1, “Electron Impact Ionization cross-section Data for Atoms, Atomic Ions, and Diatomic Molecules: I. Experimental Data” 4. NIST Database: Electron Impact Ionization Cross Sections, Y-K. Kim , et. al. , online version: http://physics.nist.gov/PhysRefData/Ionization/Xsection.html. 5. R. A. Ketola, et. al., Rapid Comm. Mass Spectrom. 13 (1999) 654-662, “A NonLinear Asymmetric Error Function based Least Mean Square Approach for the Analysis of Multicomponent Mass Spectra Measured by Membrane Inlet Mass Spectrometry” 6. P. J. Abbott et. al. JVST A14(3) (1996) 1242 , “Commercial helium permeation leak standards: Their properties and reliability”. 7. Kimo Welch, “Calibrating Partial Pressure Gauges. A learning experience”, Vacuum Technology and Coating, Nov/Dec 2000, p. 40. Note: A typical Kimo paper. Full of down-to-earth, “don’t do what I did”, kind of knowledge. 8. C. Richard Arkin, et. al., “Evaluation of Small Mass Spectrometer Systems for Permanent Gas Analysis”, J. Am. Soc. Mass Spec. 13 (2002) 1004. Note: The SRS RGA100 is compared to several commercial (i.e. Leybold XPR-2 and Ferran Micropole) and research mass specs and found to be the best match for the analysis of cryogenic fuels around the Space Shuttle. This paper demonstrates the excellent accuracy, reproducibility and detectability of gas analysis systems based on SRS RGAs. 9. Andrew K. Ottens, W.W. Harrison, Timothy P. Griffin, and William Helms, “Real time Quantitative Analysis of H2, He, O2 and Ar by Quadrupole Ion Trap Mass Spectrometry”, JASMS 13(2002) 1120. Note: An SRS RGA is used as the standard to check the ion trap results. 10. B. R. F. Kendall, “Pulsed Gas injection for on-line calibration of residual gas analyzers”, J. Vac. Sci. Technol. A 5(1)(1987) 143. Multiple Linear Regression Analysis Algorithms 1. William H. Press, et. al., 1992, Numerical Recipes in C, The Art of Scientific Computing, Second Edition, Cambridge Univ. Press, section 15.4, page 671. 2. Bevington, P.R., 1969, Data Reduction and Error Analysis for the Physical Sciences, New York, McGraw-Hill, Chapters 8-9. Vacuum System Design 1. J. M. Lafferty, “Foundations of Vacuum Science and Technology”, John Wiley &Sons, New York, 1997. Note: this is, by far, the most useful book on vacuum related matters your money can buy! SRS-Vacuum Technology References Vacuum References 11 2. Gerhard Lewin, “An elementary introduction to vacuum technique”, AVS Monograph Series published by the Education Committee of the American Vacuum Society. 3. John T. Yates, “Experimental Innovations in Surface Science. A guide to Practical Laboratory Methods and Instruments”, Springer-Verlag, New York, 1997. Note: This is an excellent book, with lots of great practical ideas! We highly recommend it. 4. Studt, R&D Magazine, October 1991, p. 104: “Design Away Those Tough Vacuum System Riddles”. Note: Read this one! Make a copy and hang it on your wall! 5. Phil Danielson, Vacuum & ThinFilm, Oct. 1998, “Gas Loads in Vacuum Systems”, p. 37, and “The Value of PumpDown Curves”, p. 12. 6. Phil Danielson, Vacuum & ThinFilm, Nov/Dec. 1998, “Rate-of –rise Measurements”, p. 12. 7. Phil Danielson, Vacuum & ThinFilm, March 1999, “Gas Load and Effective Pumping Speed”, p. 12, and “Creating a Vacuum”, p. 34. 8. Vic Comello, “Metal-Sealed Components Are Not Just for UHV Anymore”, R&D Magazine, October 1997, p. 24. 9. Glen Tisdale et. al., Solid State Technology, May 1998, “Next Generation Aluminum Vacuum Systems” 10. P. R. McCabe et. al., J. Vac. Sci. and Technol., A 17 (2) (1999) 673, “A convenient means of securing gaskets during assembly of vertically oriented knife-edge flanges” 11. Hugh Everson, “From Scrap Metal to Vacuum Components”, Vacuum Solutions March/April 1999. 12. Phil Danielson, Vacuum and Thin Film, May 1999, p. 10, “ Gas Flow Rates: Volume Flow and Mass Flow”. 13. Vic Comello, “Taking Vacuum Valves Seriously”, R&D Magazine, March 1998, p. 61. 14. Phil Danielson, Vacuum and Thin Film, June 1999, p. 12, “ Gas Loads from Virtual Leaks”. 15. Phil Danielson, Vacuum and Thin Film, July 1999, p. 18, “ Why Create a Vacuum? How physical and chemical factors affect molecular activity.” 16. V. S. Smentkowski and A. L.Linsebigler, “ Stabilization of long travel-single bellows-horizontal manipulators”, J. Vac. Sci. Technol. A17(4) (1999) 2056 17. H.F. Dylla et. al., “Design and installation of a low particulate, ultrahigh vacuum system for a high power free-electron laser, J. Vac. Sci. Technol. A 17(4) (1999) 2113 SRS-Vacuum Technology References 12 Vacuum References 18. Phil Danielson, “Advances in Vacuum Sealing”, Vacuum & Thin Film, Sept. 1999, p. 8 19. Ian Stevenson et. al., “Choosing a Chamber, Varouos Functions to Consider”, Vacuum & Thin Film, Sept. 1999, p. 23 20. Mike Ackeret, “Manipulators in a Vacuum: The challenge of manipulating samples in a controlled, ultra-clean or vacuum environment”, Vacuum & Thin Film, Sept. 1999, p. 31 21. Vic Comello, “Do’s and Don’ts of Designing UHV Chambers”, R&D Magazine, October 1999, p. 18. 22. Phil Danielson, “The Vacuum Chamber-Volume or Surface Area?, Vacuum&ThinFilm, October 1999, p. 8. 23. S. G. Lee and J. G. Bak, “A vacuum chamber with a radial rotating port”, Rev. Sci. Instr. 70 (1999) 4437 24. A. Noble and M. Kasevich, “UHV optical window seal to conflat knife edge” Rev. Sci. Instrum. 65(9) (1994) 3042 25. E.V.Alonso, et.al. ,”Low Cost, Simple Gate Valve”, Rev. Sci. Instr. 66 (3) (1995) 2738. 26. S. Kurokouchi, “Influence of lubricating conditions of fixing bolts on penetration of Conflat flange knife edge into gasket”, J. Vac. Sci. Technol. A18(1) (2000) 288 27. W. F. Smith , B. G. Stokes and J. F. Crawford, “Cryogenic substrate cooling or substrate heating without vacuum feedthrus”, J. Vac. Sci. Technol. A 18(1) (2000) 290 28. Y. Suetsugu, et. al. “Development of an all-metal vacuum bellows following twist motion”, J. Vac. Sci. Technol. A 17(6) (1999) 3500 29. P. R. McCabe and A. L. Utz, “Low cost alternative to motorized linear and rotary motion feedthroughs”, J. Vac. Sci. Technol. A 17(6) (1999) 3529 30. “What is a vacuum?”, Vacuum Technology & Coating, JAN/FEB 2000, p. 12. A reminder of what vacuum is all about and what it takes to accomplish it. 31. R. Moreh and Y. Finkelstein, “A practical all-metal flange-seal for high and low temperatures”, Rev. Sci. Instr. 71(2) (2000) 591 32. Peter Geng et. al. , “A compact UHV system for the in-situ investigation of III/V semiconductor surfaces”, Rev. Sci. Instr. 71(2) (2000) 504 33. Norbert Pocheim, “Throttle Valve Reduces Cost of Ownership”, R&D Mag. Feb. 2000, p. 65. SRS-Vacuum Technology References Vacuum References 13 34. M. McKeown, “What you should know about traps, valves and gauges”, Semiconductor International, March 1991, p. 109. 35. M. Lenzen and R.E. Collins, “Hermetic indium metal-to-glass tube seal”, J. Vac. Sci. Technol A18(2) (2000) 552. 36. Adam M. Hawkridge et. al. “Cryogenic ultrahigh vacuum manipulator for angle dependent x-ray photelectron spectroscopy studies”, J. Vac. Sci. Technol. A 18(2) (2000)567. 37. William Wuertz, “Welding system Improves Quality Assurance”, R&D Magazine, March 2000, p. 26. Note: Orbital TIG Welders let you weld tubes all by yourself! 38. Rich Combs, “New RF Feedthrus Minimize Coupling Effects”, R&D Magazine, March 2000, p. 47. 39. Kimo M. Welch, “Finger Ponting in the FAB”, Vacuum Technology and Coating, May 2000, p. 12-16. 40. Gerald Murphy and Kathryn Whitenack, “Chilled Water Options Vary for Laboratory Equipment”, R&D Magazine, May 2000, p. 55. 41. Vic Comello, “Viewport Shutter Designs Meet Deposition Requirements”, R&D Mag. June 2000, p. 87. 42. C. Biscardi, et. al. “Application of Porcelain Enamel as an UHV-compatible electrical insulator”, JVST A 18(4) (2000) 1751. 43. Vincenc Nemanic et. al. “Experiments with a thin walled stainless steel vacuum chamber”, JVST A 18(4) (2000) 1789. 44. Phil Danielson, “Improve your vacuum system performance and behavior”, R&D Magazine, August 2000, p.39. 45. Kaveh H. Zarkar, et. al. “Designing High-Performance Vacuum Control Systems”, R&D Magazine, Sept 2000, S-3. 46. Phil Danielson, “Assessing Gas Loads in Vacuum System Design”, R&D Magazine, Oct. 2000, p. 39 47. Dan Goodman et. al., “Etch and CVD process improvements via heated vacuum throttle valves”, Solid State Technology, December 2000, p. 80. 48. Boude C. Moore, “Thin-walled chambers of austenitic steel”, J. Vac. Sci. Technol. A 19(1) (2001) 228. 49. Z. Celinski , “Molecular Beam epitaxy system at an undergraduate institution”, J. Vac. Sci. Technol. A 19(1) (2001) 383. 50. D. L. Miller et. al. , “All metal ultrahigh vacuum optical fiber feedthru”, J. Vac. Sci. Technol. A 19(1) (2001) 386. SRS-Vacuum Technology References 14 Vacuum References 51. Phil Danielson, “How to Use the Q= S P Vacuum Relationship”, R&D Magazine, March 2001, p. 33. 52. Donald Mattox, “Safety Aspects of Vacuum Processing”, Vacuum Technology and Coating, March 2001, p. 22. 53. Gerardo Brucker, “Prevention is Key to Vacuum System Safety”, R&D Magazine, Feb. 2001, p.57. 54. Kimo Welch, “All-Metal Vacuum Seals”, Vacuum Technology and Coating, May 2001, p. 6; also “More on all-metal seals”, Vacuum Technology and Coating, June 2001, p. 12. 55. Donald Mattox, “Steady State and Transient Conductance”, Vacuum Technology and Coating, June 2001, p. 20. 56. Lawrence Lamont Jr., “Thin Film PVD and strategies for optimized UHV-XHV pumping”, Solid State Teghnology, July 2001, p. 81 57. Ray Dubois and James Mayer, “Safety Solutions for High Pressure Gas Cylinders”, Solid State Technology, July 2001, p. 153. 58. M. Mapes. “Summary of Quick Disconnect vacuum flanges”, J. Vac. Sci. Technol. A19(4) (2001) 1693. 59. Phil Danielson, “Molecular Flux Provides Process Understanding”, R&D Mag., August 2001, p.65. 60. Phil Danielson, “Vacuum Envelope Penetration”, R&D Magazine, September 2001, p. 82. 61. John Baxter, “Gas Delivery Systems Undergo Radical Design Modifcations”, R&D Magazine, Oct. 2001, p. 36 62. Ping Li, “Dynamic Sealing Using “Ferrofluidic”, Vacuum Technology and Coating, Novmber 2001, p. 32 63. S. Kurokouchi, et. al., “Characteristics of a Taper seal type gasket for the Conflat Sealing System”, J. Vac. Sci. Technol., A 19(6) (2001) 2963. Note: A novel way to sela Conflats . Worth checking out and keeping in mind. 64. Amara Rozgus, “Vacuum Users Think Outside the Box”, R&D Magazine, Oct. 2002, p. 26. 65. Paul LaMarche and Bob Langley, “Movement in Vacuum”, Vacuum Technology and coating, Nov. 2002, p. 26.Note: Information on vacuum compatible actuated devices. 66. P. LaMarche and Bob Langley, “Vacuum Vessel Fabrication”, Vacuum technology and Coating, Jan 2003, p. 26. SRS-Vacuum Technology References Vacuum References 15 67. Stan Kassela, “Improving fab productivity with predictive vacuum maintenance”, Solid State Technology, Feb 2003, p.77. 68. Phil Danielson, “The Flavor Issue-How to Choose the Right Vacuum Materials”, R&D Magazine, April 2003, p. 39-40. 69. Philip Lessard, “Vacuum Issues in the semiconductor Industry, Ion Implantation”, Vacuum Technology and Coating, June 2003, p. 36. 70. Paul LaMarche and Bob Langley, “Gas Admission Systems”, Vacuum Technology and Coating, July 2003, p. 18. 71. Phil Danielson, “Solving Process Problems at the Molecular Flux Level”, R&D Magazine August 2003, p. 31. 72. Phil Danielson, “Anatomy of a PumpDown”, R&D Magazine, June 2004, p. 33. 73. Bob Langley and Paul LaMarche, “O-Rings: Materials – Part 1”, Vac. Technology and Coating, June 2004, p. 24. 74. Patrick Carlucci and David Durkin, “Selecting Regulators for Specialty Gases: Understanding and configuration software simplify the task”, Gases and technology, July/August 2004, p. 43. 75. Phil Danielson, “Sealing Materials Require a Careful Choice”, R&D Magazine, August 2004, p. 29. 76. Donald M. Mattox, “Safety Aspects of Vacuum Processing”, Vacuum Technology &Coating, January 2005, p. 32. 77. Denise M. McClenathan, et. al., “Directly Digital Flow Controller”, Anal. Chem. 77(3) (2005) 948. Note: A digital flow controller based on the GasDAC concept offers fast resonse, linear response and adjustable range. Check out figure 3 for a schematic of the electronic circuit used to control the solenoid valves. 78. Kimo Welch, “Variants of the Long Tube Formula”, Vac. Tech and Coating, February 2005, p. 22. 79. Donald Mattox, “Deposition Chambers and Vacuum-surface “Conditioning””, Vac. Technology &Coating, February 2005, p.26. Vacuum System Contamination 1. Inkuyu Chun, et. al. , J. Vac. Sci. Technol. A 14(4) (1996) 2636, “Outgassing rate characteristic of a stainless steel extreme high vacuum system” 2. B. B. Dayton, J. Vac. Sci. Technol. A 13(2) (1995) 451, “Outgassing Rate of preconditioned vacuum systems after a short exposure to the atmosphere: Outgassing rate measurements on Viton-A and copper” SRS-Vacuum Technology References 16 Vacuum References 1. Vic Comello, R&D Magazine, March 1993, p. 57, “Cleansing your quadrupole, Cryopumps Enhance Low-Level Contamination Detection” 2. J. Gomez-Goni and A. G. Mathewson, J. Vac. Sci. Technol. A 15(6) (1997) 3093, “Temperature dependence of the electron induced gas desorption yields on stainless steel, copper and aluminum” 3. M. Bernardini, et. al., J. Vac. Sci. Technol. A 16(1) (1998) 188, ”Air bake-out to reduce hydrogen outgassing from stainless steel” 4. Phil Danielson, Vacuum and Thin Film, January 1999, p. 14, “ Gas Loads from elastomer seals”. 5. Vic Comello, R&D Magazine, December 1998, p. 43, ” Oil a Concern with Rotary Vane Pumps” 6. Phil Danielson, Vacuum & Thin Film Magazine, April 1999, p. 12, “Reducing Water Vapor, Problems with Dry Gas” 7. Vincent Nemanic, et. al., J. Vac. Sci. and Technol. A17(3) (1999) 1040, “Outgassing in Thin Wall Stainless Steel Cells” 8. K. Akaishi, “Solution of the outgassing equation for the pump down of an unbaked vacuum system”, J. Vac. Sci. Technol. A17 (1) (1999) 229. 9. Fumio Watanabe and Maki Suemitsu, “Separation of ESD neutrals from outgassing originating from the grid surface of emission controlled gauges: Studies with a heated grid gage”, J. Vac. Sci. Technol. A 17(6) (1999) 3467. 10. Vic Comello, R&D Magazine, July 1999, p. 24,”Controlling Downstream Contamination Can Be Profitable” 11. J. Busath and H.K. Chiu, “Simple Catalytic cell for restoring He leak detector sensitivity on vacuum systems with high D2 backgrounds”, J. Vac. Sci. Technol. A 17(4) (1999) 2015 12. K. L. Holtrop, M. Hansink, and G. Kellman, “Outgassing tests on materials used in the DIII-D magnetic fusion Tokamak”, J. Vac. Sci. Technol. A 17(4) (1999) 2064 13. Phil Danielson, “Backstreaming Traps”, Vacuum & Thin Film, August 199, p. 8 14. David Hucknall, “The vagaries of vacuums”, Vacuum Solutions, September/October 1999, p. 46. Note: Includes several factors that can compromise performance in high vacuum systems based on diffusion pumps. 15. P. A. Redhead, “Modeling the pump-down of reversibly adsorbed phase. I. Monolayer and submonolayer initial coverage”, JVST A13(2) (1995) 467, and “II. Multilayer Coverage” A 13(6) (1995) 2791. 16. Jean-Pierre De Luca, “Calibrating a Leak Detector Easily and Accurately”, R&D Magazine, April 2000, p. 95. SRS-Vacuum Technology References Vacuum References 17 17. Greg A. Pfister, “Eliminating Seal Contamination in Semiconductor Process Equipment”, Vacuum Technology &Coating, June 2000, p. 29. 18. L. Layden and D. Wadlow, “High Velocity carbon dioxide snow for cleaning vacuum system surfaces”, J. Vac. Sci. Technol. A 8(5) (1990) 3881. 19. Phil Danielson, “Reduce Water Vapor in Vacuum Systems”, R&D Magazine, September 2000, S-10. 20. Rita Mohanty, “Use of Getters in Hermetic Packages”, Vacuum Technology and Coating, October 2000, p. 41. 21. Andrew D. Johnson, et.al., “Reducing PFC gas emissions from CVD chamber cleaning”, Solid State Technology, December 2000, p. 103. 22. Mark Higgins, “High Sensitivity Leak Detection, Done Simply”, Vacuum Technology &Coating, January 2001, p. 42. 23. Donald Mattox, “Water and Water Vapor”, Vacuum Technology and Coating, Jan 2001, p. 58. 24. Phil Danielson, “Desorbing Water in Vacuum Systems: Bakeout or UV?”, R&D Magazine, January 2001, p. 57. 25. Dave Laube, “Limitations of CO2 cleaning for Semiconductor Process Tools”, A2C2 Magazine, February 2001, p. 9. (for general info on this article email: [email protected]) 26. Phil Danielson, “Contamination Lurks in Vacuum Systems, Sources”, R&D Magazine, May 2001, p. 45. 27. Phil Danielson, “Fight Humidity in your vacuum system”, R&D Magazine, June 2001, p. 67. 28. Bob Langley and Paul LaMarche, “Cleaning of Parts For Use In Vacuum”, Vacuum Technology and Coating, August 2001, p.6. 29. Phil Danielson, “Using Simple Tools to Avoid Vacuum Performance Problems”, R&D Magazine, Dec 2001, p. 61. Note: This is an excellent explanation of how rateof-rise and pumpdown curves can be used to characterize vacuum systems. IGC100 controllers offer front panel display of such curves, making system characterization very simple. 30. Donald M. Mattox, “Deposition Chambers and Vacuum-surface “Conditioning””, Vac. Techn. & Coating, Sept. 2002, p. 30. 31. P. A. Redhead, “Recommended practices for measuring and reporting outgassing data”, J. Vac. Sci. Technol. A 29(5)(2002)1667. Note: This is another Redhead classic, this time recommending a set of uniform procedures for reporting outgassing data. SRS-Vacuum Technology References 18 Vacuum References 32. Donald Mattox, “Cleaning with CO2”, Vacuum Technology and Coating, March 2003, p.62. 33. Y. Saito, et. al., “Outgassing measurements of stacked laminations for use as electromagnet core”, J. Vac. Sci. Technol. A 22(5)(2004) 2206. 34. Hans H. Funke, Jianlong Yao, and Mark W. Raynora), “Trace moisture emissions from heated metal surfaces in hydrogen service”, J. Vac. Sci. Technol. A 22(2) (2004) 437. Vacuum Pumps 1. M. H. Hablanian, J. Vac. Sci. Technol. A12(4) (1994) 897, “Throughput type pumps and ultrahigh vacuum” 2. Kimo H. Welch, J. Vac. Sci. Technol. A12(4) (1994) 915, “Some important developments in capture pumping technology in the last 40 years” 3. R&D Magazine, February 1995, p. 55, “Dry Mechanical Vacuum Pumps For Almost Any Application” 4. Vic Comello, R&D Magazine, October 1996, p. 41, “Turbodrag Pumps Offer Improved Throughput and Light Gas Compression” 5. Baliga J., Semiconductor International, October 1997, p. 86, “Vacuum Pump Designs Adjust to Harsher Conditions” 6. Vic Comello, R&D Magazine, June 1998, p. 79, “Why Hybrid Turbos Are Often Preferred” 7. Vic Comello, R&D Magazine, February 1999, p. 63, “ Choosing a Diaphragm Pump for a Turbo” 8. Vic Comello, R&D Magazine, February 1998, p. 81, “ Exhausting Process Gases Safely and Efficiently”. 9. Roberto Giannantonio, et. al. , R&D Magazine, February 1998, p. 83, “Better Getters Help Vacuum Pumps Work Faster” 10. Eckhard Bez, Solid State Technology, March 1999, p. S3, “ Advances in Oil Free Vacuum Pumps”. 11. Eckhard Bez, VACUUM and THINFILM, June 1999, p. 30 , “Oil Sealed Vacuum Pumps. Reducing Energy Consumption” 12. Phil Danielson, VACUUM and THINFILM, July 1999, p. 8, “Backstreaming from Oil-sealed Pumps” 13. S. Nesterov, J. Vasiliev, L.C.Wagner and M. Boiarski, “Hydrogen Pumping simulation for cryopumps”, J. Vac. Sci. Technol. A 17(4) (1999) 2099 SRS-Vacuum Technology References Vacuum References 19 14. Gary Ash, “Cryogenic High Vacuum Pumps: An overview of their application and use”, Vacuum&ThinFilm, August 1999, p. 20. 15. Phil Danielson, “Cryopump Crossover”, Vacuum&ThinFilm, November 1999, p. 8 16. Vic Comello, “Tailoring Traps to Specific applications”, R&D Magazine, January 2000, p. 59 17. I. Akutsu and T. Ohmi, “Innovation of thr fore pump and roughing pump for highgas-flow semiconductor processing”, J. Vac. Sci. Technol. A 17(6) (1999) 3505. 18. “Finding a pump just got easier”, R&D Magazine, Feb. 2000. Note: table describing and comparing the pumps from 40 different suppliers. 19. Youfan Gu, “Managing TEOS Effluents”, R&D Magazine, Feb. 2000, p. 67. 20. John Freeman, “Cost Down and performance up!”, Inside Vacuum, Pfeiffer’s Customer Magazine, no. 5. Winter 2000. p. 9. A short article describing Balzer’s Split Flow Turbo Pumps. (Pfeiffer Vacuum is located in Nashua , NH) 21. Vic. Comello, “Turbos Designed for Harsh Environments”, R&D Magazine, March 2000, p. 45. 22. Phillip A. Lessard, “Vacuum Pumping Systems for Chemical Vapor Deposition Tools”, Vacuum Technology & Coating, June 2000, p. 34. 23. J. J. Manura, “Vacuum Pump Exhaust Filters. Part I: A Two Stage Vacuum Pump Exhaust Filter System”, The Mass Spec Source , Summer 2000, p. 4. Note: A newslatter published by Scientific Instrument Services, Inc. Ringoes, NJ. www.sisweb.com. 24. Peter M. Yau and Atul N. Patil, “Chemical Scroll Pumps Are Ideal for Lab Applications”, R&D Magazine, June 2000, p. 80 25. Vic Comello, “Roots Pumps are Versatile Performers”, R&D Magazine, Back to Basics, June 2000, p. 93. 26. Vic Comello, “High Speed Screw Pumps Being Developed for 300-mm Wafers”, R&D Magazine, May 2000, p. 73. 27. Philip Lessard, “Dry Vacuum pumps for semiconductor processes: Guidelines for primary pump selection” , JVST A 18(4) (2000) 1777. 28. R. P. Davis et. al. “Dry Vacuum pumps: A method for the evaluation of the degree of dry”, JVST A 18(4) (2000) 1782. 29. Atul Patil, “Improving High Vacuum Pumping Performance Using a Cryogenic Water Pump Backed by a Turbomolecular Pump”, July 2000, Vacuum Technology & Coating, p. 40. SRS-Vacuum Technology References 20 Vacuum References 30. Vic Comello, “Ion Pumps Provide Clean UHV Environments”, R&D Magazine, July 2000, p. 45 31. Steven Chambreau, et. al. , “Low cost, mechanically refrigerated diffusion pump baffle for ultrahigh vacuum chambers”, J. Vac. Sci. Technol. A 18(5) (2000) 2581 32. Kimo Welch, “Closed-Loop Gaseous Helium Cryopumps”, Vacuum Technology and Coating, Spetember 2000, p. 8 33. M. H. Hablanian, “The Hybrid High Vacuum Turbopump”, Vacuum Technology and Coating, Sept 2000, p. 40. 34. Heinz Barfus, et.al. , “Moving Dry Pumps From the Subfab Floor To the Tool”, R&D Magazine, September 2000, S18. 35. Kimo Welch, “The Cryopump Placebo Effect”, Vacuum Technology and Coating, September 2000, p. 10. 36. “Alloys Update Getter Pumps”, R&D Magazine, November 2000. 37. Phil Danielson, “Diaphragm Pump Designs Determine Results”, R&D Magazine, November 2000. 38. Phil Danielson, “How to Match Pumping Speed to Gas Load”, R&D Magazine, December 2000, p. 30. 39. Phil Danielson, “Careful Consideration Means getting the right pump”, R&D Magazine, April 2001, p. 29. 40. Donald Mattox, “Mechanical Vacuum Pumps”, Vacuum Technology &Coating, April 2001, p. 53. 41. Dale Morton, “The effects of Pumping Speed on the Operation of a Cold Cathode Ion Source”, Vacuum Technology and Coating, June 2001, p. 36. 42. Phil Danielson, “Making the Oil-Sealed vs. Oil Free Decision”, R&D Magazine, July 2001, p. 66. 43. A. Liepert and and P. Lessard, “Design and operation of scroll-type dry primary vacuum pumps”, J. Vac. Sci. Technol. A19(4) (2001) 1708 44. Donald Mattox, “Oil Diffusion Pumps”, Vacuum Technology and Coating, July 2001. P.26 45. P.D. Vibert, “Troubleshooting Vacuum Pumping Systems”, Vacuum Technology and Coating, July 2001, p. 55. 46. C. G. Masi, “Instrumentation Needs Drive Turbopump Development”, R&D Magazine, Oct 2001, p. 16 SRS-Vacuum Technology References Vacuum References 21 47. Phil Danielson, “Matching Vacuum Pump to process”, R&D Magazine, November 2001, p. 53. Note: A quick , concise and useful primer on pump choices. 48. Phil Danielson, “Water Vapor Pumping Produces Unique Problems”, R&D Magazine Feb 2002, p.59. 49. Bob Langley et. al., “Picking the right pump and the Sizing and matching of Pumps”, Vacuum Technology and Coating, May 2002, p.23. 50. Terrence Thompson, “Roughing Pumps, Dry and Oil Filled”, Vacuum Technology and Coating, November 2002, p. 42. 51. Terrence Thompson, “High-Vacuum Pumps”, Vacuum Technology and Coating, Dec 2002, p.52. Note: An up-to date compilation of HV pump technologies and manufacturers. 52. Jurgen Breitenbach, “The Influence of Diaphragm Pumps on the Hydrogen Partial Pressure in High Vacuum Systems”, Vacuum Technology and Coating, Jan. 2003, p.38. 53. Donald Mattox, “Turbomolecular Vacuum Pumps”, Vacuum Technology and Coating, Jan 2003, p.24. 54. Ron Hawranko, “How to Choose a TurboPump”, R&D Magazine, July 2003, p. 46 55. Phil Danielson, “Matching Cryopumping Techniques to Applications”, R&D Magazine, Oct. 2003, p. 36. 56. Kimo Welch, “A century of Capture Pumping Technology- Sputter-Ion pumping”, Vacuum Technology and Coating, June 2004, p. 18. 57. A. D. Chew, et. al., “Considerations for Primary Vacuum Pumping in Mass Spectrometry Systems”, Spectroscopy 20(1) (2005) 44. 58. Bob Langley and Paul LaMarche, “Criteria for Selection of Pumping Fluids for Diffusion Pumps and of Vacuum Greases”, Vacuun Technology and Coating, December 2004, p. 20, 59. Kimo Welch, “Titanium Sublimation Pumps How They Work”, Vac. Technology & Coating, Dec 2004, p. 32. 60. Kimo M. Welch, “Titanium Sublimation Pump Sources”, Vacuum Technology & Coating, January 2005, p. 28. 61. Donald Mattox, “Cryopumps, Sorption Pumps and Cryopanels”, Vacuum Technology & Coating, Jan 2005, p. 36. 62. Robert Langley, “Turbomolecular Pumps”, Vac. Technology & Coating, February 2005, p. 32. SRS-Vacuum Technology References 22 Vacuum References Total Pressure Measurement 1. J. H. Leck, “Total and Partial Pressure Measurement in Vacuum Systems”, edited by Blackie and Son Limited, 1989, Glasgow and London,. 2. Stephen P. Hansen, Vacuum and Thin Film, May 1999, p. 24, “Vacuum Pressure Measurement”. 3. P.A. Redhead, J. Vac. Sci. Technol. A12(4) (1994) 904, “History of Ultrahigh Vacuum Pressure Measurements”. 4. P. A. Redhead, Vacuum 44 (1993) 559, “UHV and XHV Pressure Measurement”. 5. Tilford, C., JVST A1(2) (1983) 152, “Reliability of high vacuum measurements”. 6. W. A. Levinson, Semiconductor International, Oct. 1995, p. 165, “How Good is your gauge?”. 7. Dick Jacobs, Vacuum&ThinFilm, February 1999, p. 30, “Advances in Capacitance Manometers for Pressure Measurement” 8. Tim Studt, “ Reliability, Cost and Size Demands Dominate New Gauge Designs”, R&D Magazine, Vacuum Technology Section, May 1996, p. 54. 9. John Sullivan, “Advances in Vacuum Measurement Almost Mette Past Projections”, R&D Magazine, August 1995, p. 31. 10. Peter Singer, “Trends in Vacuum Gauging”, Semiconductor International, March 1992, p. 78. 11. B. R. Kendall et. al. , J. Vac. Sci. Technol. A15(3) (1997) 740, “Cold Cathode Gauges for ultrahigh vacuum measurements”. 12. Stephen Hansen and Kathryn Whitenack, “Pressure measurement and control in loadlocks”, Solid State Technology, October 1997, p. 151. 13. Eric Bopp, “Pressure measurement in ion implanters”, Solid State Technology, Feb. 2000, p. 51. Note: Includes a comparison between cold and hot cathode gauge performance in ion implant applications. 14. B. R. F. Kendall and E. Drubetsky, “Compact wide range cold cathode gauges”, JVST A18(4) (2000) 1724. 15. C. P. Grudzien and D. J. Lischer, “New Enhanced Performance low pressure Capacitance Manometer”, JVST A 18(4) (2000) 1730. 16. James Lee, “ The future of Web-Enabled Vacuum Instrumentation”, R&D Magazine, Oct. 2000, p. 29. 17. Fiona Redgrave, “How to choose a vacuum gauge”, Vacuum Solutions, November/December 2000, p.50. SRS-Vacuum Technology References Vacuum References 23 18. Emil Drubetsky and Richard Glazewski, “Vacuum Measuremeents using Modern Cold Cathode Technology”, Vacuum Technology and Coating, Oct 2002, p. 54. 19. Donald Mattox, “Vacuum Gauging”, Vacuum Technology & Coating, February 2003, p. 26. 20. Donald Mattox, “Vacuum Gauges for the Plasma Environment”, Vacuum Technology and Coating, June 2003, p. 26 . Note: Capacitance Manometers and Spinning Rotor Gauges are discussed as preferred gauges for PVD applications where plasmas can interfere with ionization sources. 21. Hiroshi Saeki, et. al. “Pressure Measurement errors in cold cathode ionization gauge caused by an external electron source”, J. Vac. Sci. Technol. A22(5) (2004) 2212. Bayard-Alpert Ionization Gauges 1. D. Alpert, Journal of Applied Physics 24 (1953) 860, “New Developments in the production and measurement of UHV”. Note: This is the report on the invention of the B-A Gauge 2. J. H. Singleton, “Practical guide to the use of Bayard-Alpert Ionization Gauges”, J. Vac. Sci. Technol. A19(4) (2001)1712. 3. Gerardo Brucker, “Which Bayard-Alpert Gauge is best for you?”, R&D Magazine, Feb. 2000, p. 69. 4. Peter Nash, “The use of hot filament ionization gauges”, Vacuum 37 (1987) 643 5. P. E. Gear, “The choice of cathode material in a hot cathode ionization gauge”, Vacuum 26(1) (1975) 3 6. George Comsa, “Ion Collection in Bayard-Alpert Gauges”, J. Vac. Sci. Technol. 9 (1971) 117. Note: Great paper on how it all works inside the gauge. 7. P. A. Redhead, JVST 6 (1969) 848, “The sensitivity of Bayard-Alpert Gauges”. 8. Tilford, Charles, JVST A3(3) (1985) 546, “Sensitivity of hot cathode ionization gauges”. Note: Very useful information on gauge-to-gauge reproducibility of commercial B-A gauge sensitivities. 9. T.A. Flaim and P.D. Ownby, J. Vac. Sci. Technol. 8(5) (1971) p 661, “Observations on B-A Ion Gauge Sensitivities To Various Gases” 10. Albert Filippelli et. al., “Search for pressure dependence in the sensitivity of several common types of hot-cathode ionization gauges for total pressures down to 10-7 Pa”, J. Vac. Sci. Technol. A9(5) (1991) 2757 11. Abbott, P.J. et. al. JVST A12(5) (1994) 2911, “Influence of the filament potential wave form on the sensitivity of glass envelope B-A gauges”. SRS-Vacuum Technology References 24 Vacuum References 12. Filipelli AS. R., JVST A14(5) (1996) 2953, “Influence of envelope geometry on the sensitivity of “nude” ionization gauges” 13. Suginuma S. et. al. , “Dependence of sensitivity coefficient of a nude type BayardAlpert Gauge on the diameter of an envelope”, Vacuum 53 (1999) 177-180. 14. Charles Morrison, “Safety Hazard from gas discharge interactions with the Bayardalpert ionization gauge”, J. Vac. Sci. Technol. A 3(5) (1985) 2032 15. N. T. Peacock, “Measurement of x-ray currents in Bayard-Alpert type gauges”, J. Vac. Sci. Technol. A 10(4) (1992) 2674 16. B. R. F. Kendall, “Ionization gauge errors at low pressures”, J. Vac. Sci. Technol. A17(4) (1999) 2041 17. B. R. F. Kendall and E. Drubetsky, “Stable Cancellation of x-ray errors in B-A gauges”, J. Vac. Sci. Technol A 16(3) (1998) 1163 18. Tilford, C. ,JVST A13(2) (1995) 485, “Comments on the stability of Bayard-Alpert ionization Gauges”. Note: Great information on the long-term stability of commercial B-A gauge sensitivities. Useful recommendations on gauge operation. 19. R. N. Peacock and N. T. Peacock, “Sensitivity variation of Bayard-Alpert Gauges with and without closed grids from 10-4 to 1 Pa”, J. Vac. Sci. Technol. A(8) (1990) 3341 20. Bills, D. G., JVST A12(2) (1994) 574, “Causes of nonstability and nonreproducibility in widely used Bayard-Alpert ionization gauges”. 21. S. D. Woods and C. R. Tilford, “Long-term stability of two types of hot cathode ionization gauges”, J. Vac. Sci. Technol. A3 (3) (1985) 542 22. P. C. Arnold et. al. “Non-stable behavior of widely used ionization gauges”, J. Vac. Sci. Technol. A 12(2) (1994) 568 23. Tilford, C. et. al. , JVST 20 (1982) 1140, “Performance characteristics of a broad range ionization gauge tube”. 24. K. Jousten and P. Rohl, “Instability of the spatial electron current distribution in hot cathode ionization gauges as a source of sensitivity changes”, J. Vac. Sci. Technol. A 13(4) (1995) 2266 25. Arnold, P. C. et. al. ,JVST A12(2) (1994) 580, “Stable and reproducible BayardAlpert ionization gauge”.(Note: The birth of Granville Phillip’s Stabil-Ion Gauge) 26. Siska, P. E. Rev. Sci. Instrum. 68(4) (1997) 1902, “Partial Rejuvenation of B-A ionization gauge tubes”. 27. Cox. M. C. et. al., JVST A14(5) (1996) 2963 , “Filament Replacement for nude Bayard Alpert Ionization gauges”. SRS-Vacuum Technology References Vacuum References 25 28. R. Baptist et. al. ,”Bayard-Alpert vacuum Gauge with microtips” J. Vac. Sci. Technol. B14(3) (1996) 2119 29. Peacock, R. N. et. al. , JVST A9(3) (1991) 1977, “Comparison of hot cathode and cold cathode ionization gauges”. 30. Beeck, U. et. al. , JVST 9 (1971) 126 , “Comparison of the pressure indication of a Bayard-Alpert and an Extractor Gauge”. 31. H. Akimichi, K. Takeuchi, and Y. Tuzi and I. Arakawa, “Long term behavior of an axial-symmetric transmission gauge”, J. Vac. Sci. Technol. A17 (1999) 2021. 32. Vic Comello, R&D Magazine, May 1999, p. 57, “Simplify Rough Pumping With a Wide Range Gauge” 33. H. Saeki and T. Momose, “Vacuum gauge self-compensating external environment in the Spring-8 storage ring”, J. Vac. Sci. Technol. A 18(1) (2000) 244 34. Edelmann, Chr.; Iwert, Th.; Kauert, R.; Knapp, W., “ Some studies of the axial emission ionization gauge according to Chen and Suen”, Journal of the Vacuum Society of Japan 37 (1994) 9, 686-691 35. Kieler, O.F.O.; Biehl, St.; Kauert, R.; Knapp, W., Edelmann, Chr. “Theoretical and experimental desorption investigations at ionization gauges”, Vacuum, Vol. 47 (1996), No. 4, 351-355 36. Edelmann, Chr.; Kauert, R.; Kieler, O.F.O., “On some Improvements of Ionization Gauges of the extractor Type for the Measurement of Extreme High Vacuum”, Journal of Vacuum Society of Japan Vol. 39, No. 4 (1996), 149-158 37. Kauert, R.;Kieler, O F O; Biehl, St; Knapp, W, Edelmann, Chr., Wilfert, St. “ Numerical investigations of hot cathode ionization gauges”, Vacuum 51 (1998) 53 38. R. Kauert, S. Wilfert, C. Edelmann, “Bayard-Alpert gauge with additional ion collector for pressure measurements from 10-9-101 mbar”, Vacuum 57(3) (2000) 283293. 39. Gerardo Brucker, “Improvements Coming in Ion Gauge Controllers”, R&D Magazine, July 2000, p.41. Note: Use this article as a guide when trying to choose a new ion gauge controller for your vacuum lab. 40. R&D Magazine, “Gauge Controller Has Many Unexpected Features”, August 2000, p. 45. Note: R&D Magazine product exclusive describing the features of the IGC100 controller. 41. Miertusova J. , “Reliability and accuracy of total and partial pressure measurements in the UHV pressure range under real experimental conditions” , Vacuum 51 (1998) 61. 42. U. Beech and G. Reich, “Comparison of the Pressure Indication of a Bayard-Alpert and an Extractor Gauge”, J. Vac. Sci. Technol. 9(1) (1971) 126. SRS-Vacuum Technology References 26 Vacuum References 43. Hiroshi Saeki, “Vacuum Gauge system with a self-compensator for photoelectrons produced in the Spring-8 storage ring”, J. Vac. Sci. Technol. A 19(1) (2001) 349 44. P. H. LaMarche, et. al.,”Neutral Pressure and gas flow instrumentation for TFTR”, Rev. Sci. Instrum. 56(5) (1985) 981. Note: there is an excellent description of an Ion Gauge setup allowing Bayard-Alpert Gauge measurements in the presence of magnetic fields. 45. Ronald C. Johnson, Randy Tysinger and Paul Arnold, “Pressure Measurement repeatability in high current ion implanters using hot cathode ionization gauge with design and operation optimized for stability”, J. Vac. Sci. Technol. A 22(5)(2004) 2191. Pirani/Thermocouple Gauges 1. Phil Danielson, “The Ins and Outs of Thermal Conductivity Pressure Gauges”, R&D Magazine, Oct. 2004, p. 36. Note: Start from here. This article tells you all the basic and important stuff you need to know. Move on to dig deeper. 2. J. English et. al. J. Sci. Instrum. 42 (1965) 77, “A wide Range constant resistance Pirani Gauge with ambient temperature compensation”. 3. Heijne,L. et. al. , Philips Technical Review, 30(1969) 166, “A Pirani Gauge for pressures up to 1000 Torr and higher”. 4. K. F. Poulter et. al. , J. Vac. Sci. and Technol. 17(2) (1980) 638, “Reproducibility of the performance of Pirani Gauges”. 5. Vic Comello, “When to Choose a Thermocouple Gauge”, R&D Magazine, May 2000, p. 75. 6. T. M. Berlicki, “Heat Dissipation in thin-film vacuum sensor”, J. Vac. Sci. Technol. A 19(1) (2001) 325. 7. E. Zakar et. al. , “Process and fabrication of lead zirconate titanate thin film pressure sensor”, J. Vac. Sci. Technol. A 19(1) (2001) 345. 8. S. N. Wang, “Thermal Micropressure sensor for pressure monitoring in a minute package”, J. Vac. Sci. Technol. A 19(1) (2001) 353 9. Suman Chatterjee, et. al. , “A Vacuum gauge using positive temperature coefficient thermistor as the sensor”, Rev. Sci. Instr., 71(2000) 4670. Pressure Calibration/Spinning Rotor Gauge 1. W. Steckelmacher, Vacuum 37 (1987) 651, “The Calibration of Vacuum Gauges”. SRS-Vacuum Technology References Vacuum References 27 2. Sharrill Dittmann, “High Vacuum Standard and its use”, NIST Special Publication 250-34. U.S. Department of Commerce , National Institute of Standards and Technology, 3. K. E. McCulloh et. al. “Summary Abstract: The national Bureau of standards orificeflow primary high vacuum standard”, J. Vac. Sci. Technol. A4(3) (1986) 362 4. Tilford, C. et. al. , JVST A6(5) (1988) 2853, “The National Bureau of Standards primary high-vacuum standard”. 5. K. E. McCulloh et. al. “Low-range flow-meters for use with vacuum and leak standards”, J. Vac. Sci. Technol. A5(3) (1987) 376 6. P. D. Levine et. al. JVST A14(3) (1996) 1297, “A primary high vacuum calibration station for industrial applications”. 7. P. D. Levine et. al. “Development of a primary standard UHV calibration station”, J. Vac. Sci. Technol. A 12(4) (1994) 1727 8. P. D. Levine et. al. “Precision gas flowmeter for Vacuum calibration”, J. Vac. Sci. Technol. A 15(3) (1997) 747 9. J. K. Fremerey, J. Vac. Sci. Technol. A3 (3) (1985) 1715, “The Spinning Rotor Gauge”. 10. J. Setina, “Two Point calibration scheme for the linearization of the spinning rotor gauge at transition regime pressures”, J. Vac. Sci. Technol. A 17(4) (1999) 2086 11. Sharrill Dittmann et. al. , “The Molecular drag gauge as a calibration Standard”, J. Vac. Sci. Technol. A7(6) (1989) 3356 12. K. Jousten, A.R. Filippelli, C.R. Tilford, and F. J. Redgrave, “Comparison of the standards for high and ultrahigh vacuum at three national standards laboratories”, J. Vac. Sci. Technol. A 15 (4) (1997) 2395 13. J. P. Looney et. al. “PC Based spinning rotor gage controller”, Rev. Sci. Instr. 65(9) (1994) 3012 14. James Basford et. al. “Recommended practice for the calibration of Mass spectrometers for partial pressure analysis”, J. Vac. Sci. Technol. A 11(3) (1993) A22 15. P. Mohan “Vacuum Gauge calibration at the NPL (India) using orifice flow method” Vacuum 51(1998) 69 16. R. E. Ellefson, A. P. Miller, “Recommended practice for calibrating vacuum gauges of the thermal conductivity type”, J. Vac. Sci. Technol. A 18(5) (2000) 2568-2577. 17. Kimo M. Welch, “A Poor-Man’s Traceable High Vacuum Gauge Calibration System”, Vacuum Technology and Coating, Nov/Dec 2000, p. 8. Note: This is a great article on how to make a simple calibration station for HV Gauge calibration. SRS-Vacuum Technology References 28 Vacuum References 18. S. P. Hansen, “ Vacuum Instrument Calibration & Personnel Training Boost Productivity”, Vacuum Technology &Coating, April 2001, p. 46. 19. Kimo Welch, “Verifying a Leak Checker’s Sensitivity to 10-12 TorrL/s (He)”, Vacuum Technology &Coating, April 2001, p.12. Temperature Programmed Desorption 1. P.A. Redhead, Vacuum, 12 (1962) 203, “Thermal Desorption of Gases”. Note: A “Classic” paper with the basics. 2. J. T. Yates, Jr. et. al. , Surface Science 322 (1995) 243, “CO adsorption on stepped Pd (112): studies by thermal and electron stimulated desorption”. Note: Read anything by Yates. 3. J. T. Yates, Methods in Experimental Physics, vol. 22 , Academic Press Orlando 1985, p. 425. 4. John T. Yates, “Experimental Innovations in Surface Science. A guide to Practical Laboratory Methods and Instruments”, Springer-Verlag, New York, 1997. Note: Everything starting at page 366 and above is essential information. 5. J. L. Gland, et. al. J. Phys. Chem. 100 (1996) 11389, “Temperature Programmed Desorption Spectra of Systems with Concentration Gradients in the Solid Lattice” 6. J. L. Gland, et. al. Surface Science 355 (1996) L385, “The effects of exposure time and pressure on the TPD spectra of systems with bulk states” 7. A. M. de Jong et. al. “Thermal Desorption Analysis: Comparative test of ten commonly applied procedures”, Surface Science 233 (1990) 355. Note: You must get this paper if you do not have it yet! 8. J. Gunster et. al., “Mg clusters on MgO surfaces: Characterization with metastable impact electron spectroscopy, ultraviolet photoelectron spectroscopy and temperature programmed desorption, A 17(4) (1999) 1657 9. V. A. Bondzie, S. C. Parker and C. T. Campbell, “Oxygen Adsorption on well defined gold particles on TiO2 (110), J. Vac. Sci. Technol. A 17 (4) (1999) 1717 10. Li Chen and Jeff Kelber, “Polymerized C-Si films on metal substrates: Cu adhesion/diffusion barriers for ultralarge scale integration?, J. Vac. Sci. Technol. A17(4) (1999) 1968 11. J. W. Niemantsverdriet et. al. “The compensation effect in thermal desorption of adsorbate systems with lateral interactions”, J. Vac. Sci. Technol. A 6 (3) (1998) 757 12. J. W. Niemantsverdriet et. al., “Thermal desorption of strained monoatomic Ag and Au layers from Ru(001)”, J. Vac. Sci. Technol. A 5(4) (1987) 875 13. R. M. Hardeveld et. al. “The adsorption of NH3 on Rh(111)”, Surface Science 369(1996) 23-35 SRS-Vacuum Technology References Vacuum References 29 14. R. M. Hardeveld et. al.”Kinetics of elementary surface reactions studied by static secondary ion mass spectrometry and temperature programmed reaction spectroscopy”, J. Mol. Catalysis A: Chem 131 (1998) 199-208 15. Herbert J. Tobias and Paul J. Ziemann, “Compound Identification in Organic Aerosols Using TPD Particle Beam Mass Spectrometry”, Anal Chem. 71 (1999) 3428-3435 16. D. Schleussner, et. al. “Temperature Programmed Desorption from Graphite”, J. Vac. Sci. Technol. A17(5) (1999) 2785 17. St. J. Dixon-Warren, et. al. “Butanethiol on Au{100}-(5X20) using a simple retractable doser”, J. Vac. Sci. Technol. A17(5) (1999) 2982. Note: Uses two SRS RGA’s for TPD measurements in an UHV setup. 18. K. W. Bryant et. al. , “Versatile and economic specimen heater for ultrahigh vacuum applications”, J. Vac. Sci. Technol. A17(5) (1999) 3057 19. St. J. Dixon-Warren, N. Burson, V. Bondzie, L. Zhang, Y. Yu, L. Lucchesi, “A Simple Single Crystal SampleTemperature Controller Based on Commercial Components for UHV Surface Science Application”, Rev. Sci. Instr., 69 (1998) 3006 20. M. J. Weiss, C. J. Hagedorn, and W. H. Weinberg, “Observation of gas-phase atomic oxygen with Ru(001)-p(1x1)-D at 80K, J. Vac. Sci. Technol. A 16(6) (1998) 3521. Note: an SRS RGA200 is used to collect the TPD data. 21. Babu R. Chalamala, David Uebelhoer and Robert H. Reuss, “Apparatus for temperature programmed desorption studies of thin films”, Rev. Sci. Instr. 71 (2000) 320. Note: Uses SRS RGA300 in the TPD setup. 22. C. G. Wiegenstein et. al. , “A virtual approach for automation of temperature programmed desorption”, Rev. Sci. Instrum., 69(10) (1998) 3707. 23. Tyler Watt and Nicholas Materer, “Temperature programmer for surface science studies with application to semiconductor surfaces”, J. Vac. Sci. Technol. A20(2) (2002) 572. 24. Sung-Il Cho, “TPD Study on the decomposition mechanismof Ti(OC3H7)4 on Si(100)”, J. Electrochem. Soc. 148(9) (2001) C599 25. J. T. Yates, Jr., “Design and construction of a semiautomatic temperatue programmed desorption apparatus for ultrahigh vacuum”, J. Vac. Sci. Technol. A 23(1) (2005) 215. Membrane Introduction Mass Spectrometry (MIMS) 1. R. T. Short et. al. , “Underwater Mass Spectrometers for in situ Chemical analysis of the Hydrosphere”, J. Am. Soc. Mass Spectrom. 12 (2001) 676. Note: An RGA is used in combination with Membrane Introduction Mass Spectrometry (MIMS) to do underwater analysis of VOCs. SRS-Vacuum Technology References 30 Vacuum References 2. Colin S. Creaser, David Gomez Lamarca, Jeffrey Brum, Christopher Werner, Anthony P. New and Luisa M. Freitas dos Santos,”Reversed-Phase Membrane Inlet Mass Spectrometry Applied to the Real-Time Monitoring of Low Molecular Weight Alcohols in Chloroform”, Anal. Chem. 74(2002) 300-304. NOTE: A SRS QMS300 is used to perform real-time MIMS determinations of alcohols in chloroform. RGAs are rapidly gaining acceptance in this field as their excellent price/performance value is realized by MIMS practitioners. 3. Raimo Ketola, et. al.,”Environmental applications of MIMS”, Journal of Mass Spectrometry 37 (2002) 457. Note: Excellent review article with tons of references and a list of published experiments sorted by analyte type and technique. Variable Leak Valves 1. Robert A. Langley and Paul LaMarche, “Variable Valves/Leaks”, Vacuum Technology & Coating, April 2003, p.24. 2. R. A. Langley, et.al., ”Gas injection system for the Advanced Toroidal Facility”, JVST A7 (1989) 2423. Note: An elastomer seal, with piezoelectric actuator valve is described. 3. R. A. Langley et.al. , “A calibrated Variable Leak for use in ion Source Operation”, JVST A19 (2001) 673. Note: a pinched tube valve, compatible with H Voltage operation, is described. Vacuum and Process Control Publications 1. The Journal of Vacuum Science & Technology A. Vacuum, Surfaces and Films. Published six times annually by the American Vacuum Society (www.vacuum.org). A consistently good refereed journal with lots of papers on vacuum technology subjects. Available on-line: http://ojps.aip.org/jvsta/. 2. The Journal of Vacuum Science & Technology B. Microelectronics and Nanometer Structures. Published six times annually by the American Vacuum Society (www.vacuum.org). A consistently good journal with lots of refereed papers on semiconductor processing issues. Available on-line: http://ojps.aip.org/jvstb/ 3. Vacuum. The international journal Vacuum publishes high quality papers on latest advances in the many areas which now require the production and control of a working environment at pressure below one atmosphere. Published by Pergamon Press, a division of Elsevier Books and Journals: www.elsevier.nl. 4. Review of Scientific Instruments. A monthly journal from the American Institute of Physics (www.aip.org) devoted to scientific instruments, apparatus and techniques. Available on-line: http://ojps.aip.org/rsio/. Always a very fun journal to read. A must-read for instrument designers and experimental scientists trying to stay up-to-date. SRS-Vacuum Technology References Vacuum References 31 5. Vacuum Technology &Coating. A new magazine that started on JAN 2000. For subscriptions contact www.vactechmag.com. Loaded with vacuum information, high on editorial, low on ads. 6. Semiconductor International. Another monthly Cahners publication dedicated to semiconductor processing subjects. Available on the web: www.semiconductor.net 7. Solid State Technology. A monthly PennWell publication, available on-line: www.solid-state.com 8. Micro. A monthly Cannon Communications Publication that often deals with vacuum contamination issues. Available on-line: www.micromagazine.com.. They have a deep article archive in their website where you can find most of the MICRO papers referenced here. 9. FUTURE FAB International. Published by Technology Publishing, Ltd. in the U. K., e-mail: [email protected]. 10. AVS Monograph Series. The American Vacuum Society (AVS, www.vacuum.org) publishes a whole series of monographs on vacuum technology and processing subjects. They are all very good and worth checking out. Some of the books are required minimum reading for vacuum practitioners. Vacuum and Process Control Websites 1. www.vacuumlab.com: An on-line “Journal of Useful and Practical Vacuum Technology”, published on-line by Phil Danielson. No advertisements, no product selling, just plain old vacuum knowledge. We highly recommend it. It even includes an “Ask Phil” section where you can submit any of those vacuum questions that have puzzled you in the past. We encourage you to challenge Phil! At this point the website is completely free and open to the general public. 2. www.thinkSRS.com: The SRS website is packed with very useful application notes related to vacuum applications and instrumentation. Check it out! We are constantly adding new notes to our list of applications. SRS-Vacuum Technology References Declaration of Contamination of Vacuum Equipment The repair and/or service of vacuum equipment or components can only be carried out if a completed declaration has been submitted. SRS reserves the right to refuse acceptance of vacuum equipment submitted for repair or maintenance work where the declaration has been omitted or has not been fully or correctly completed. SRS also reserves the right to refuse servicing any vacuum equipment which could potentially be harmful to the personnel carrying out the repair and service of the equipment. Contact SRS to request additional copies of this form or if you have any questions regarding the contents of this declaration. Description of equipment Equipment type/model: ____________________________________________________ Serial No: ______________________________________________________________ Reason for return (circle one): • Repair • Maintenance Please describe: ___________________________________________________________ ________________________________________________________________________ ________________________________________________________________________ Equipment condition 1. Has the equipment been used ? (circle one) 2. 1. • Yes • No Describe the operating environment the instrument was exposed to: _______________________________________________________________________ _______________________________________________________________________ _______________________________________________________________________ _______________________________________________________________________ Was any of the equipment exposed to potentially harmful substances? (circle one) • No • Yes. Please attach list of all known harmful substances including chemical name and symbol, precautions associated with the substance and first aid measures in the event of accident. Were any of the harmful substances: i Radioactive? • Yes • No i Toxic? • Yes • No i Corrosive? • Yes • No i Explosive? • Yes • No Was equipment decontaminated/cleaned before being shipped to SRS? • Yes i i • No • Not Applicable SRS will not service any equipment that might potentially be harmful to its service personnel. SRS will not accept any equipment which has been radioactively, or explosively contaminated without written evidence that such equipment has been properly decontaminated. Legally Binding Declaration I hereby declare that the information supplied on this form is complete and accurate. The dispatch of equipment will be in accordance with the appropriate regulations covering Packaging, Transportation and Labeling of Dangerous Substances. Name (print): _________________________________________________________ Job Title: _______________________________________________________________ Organization: ____________________________________________________________ Address: ________________________________________________________________ Telephone: ______________________________ Fax: __________________________ Legally binding signature: ____________________________________________________ Date: ______________ Stanford Research Systems, 1290 D Reamwood Ave., Sunnyvale, CA 94089, Ph. (408) 744-9040, FX. 744-9049 RGA Parts List 1 RGA Parts List Rev E Components Top Board Components Ref. C 100 C 101 C 102 C 103 C 104 C 105 C 106 C 107 C 108 C 109 C 110 C 111 C 112 C 113 C 114 C 200 C 205 C 206 C 207 C 208 C 209 C 211 C 212 C 213 C 214 C 215 C 216 C 217 C 300 C 301 C 302 C 303 C 304 C 305 C 306 D 100 D 101 D 102 D 103 D 104 D 105 D 106 D 107 D 108 SRS p/n 5-00023-529 5-00221-529 5-00221-529 5-00285-562 5-00285-562 5-00285-562 5-00023-529 5-00023-529 5-00023-529 5-00023-529 5-00023-529 5-00023-529 5-00023-529 5-00023-529 5-00023-529 5-00100-517 5-00051-512 5-00051-512 5-00052-512 5-00052-512 5-00285-562 5-00023-529 5-00003-501 5-00219-529 5-00219-529 5-00219-529 5-00219-529 5-00219-529 5-00100-517 5-00023-529 5-00023-529 5-00239-562 5-00233-532 5-00239-562 5-00023-529 3-00010-303 3-00010-303 3-00010-303 3-00010-303 3-00010-303 3-00011-303 3-00011-303 3-00011-303 3-00004-301 Value .1U 330P 330P 100P 100P 100P .1U .1U .1U .1U .1U .1U .1U .1U .1U 2.2U .015U .015U .01U .01U 100P .1U 10P .01U .01U .01U .01U .01U 2.2U .1U .1U 680P 22P 680P .1U GREEN GREEN GREEN GREEN GREEN RED RED RED 1N4148 Description Cap, Monolythic Ceramic, 50V, 20%, Z5U Cap, Monolythic Ceramic, 50V, 20%, Z5U Cap, Monolythic Ceramic, 50V, 20%, Z5U Cap., NPO Monolitic Ceramic, 50v, 5% Ra Cap., NPO Monolitic Ceramic, 50v, 5% Ra Cap., NPO Monolitic Ceramic, 50v, 5% Ra Cap, Monolythic Ceramic, 50V, 20%, Z5U Cap, Monolythic Ceramic, 50V, 20%, Z5U Cap, Monolythic Ceramic, 50V, 20%, Z5U Cap, Monolythic Ceramic, 50V, 20%, Z5U Cap, Monolythic Ceramic, 50V, 20%, Z5U Cap, Monolythic Ceramic, 50V, 20%, Z5U Cap, Monolythic Ceramic, 50V, 20%, Z5U Cap, Monolythic Ceramic, 50V, 20%, Z5U Cap, Monolythic Ceramic, 50V, 20%, Z5U Capacitor, Tantalum, 35V, 20%, Rad Cap, Stacked Metal Film 50V 5% -40/+85c Cap, Stacked Metal Film 50V 5% -40/+85c Cap, Stacked Metal Film 50V 5% -40/+85c Cap, Stacked Metal Film 50V 5% -40/+85c Cap., NPO Monolitic Ceramic, 50v, 5% Ra Cap, Monolythic Ceramic, 50V, 20%, Z5U Capacitor, Ceramic Disc, 50V, 10%, SL Cap, Monolythic Ceramic, 50V, 20%, Z5U Cap, Monolythic Ceramic, 50V, 20%, Z5U Cap, Monolythic Ceramic, 50V, 20%, Z5U Cap, Monolythic Ceramic, 50V, 20%, Z5U Cap, Monolythic Ceramic, 50V, 20%, Z5U Capacitor, Tantalum, 35V, 20%, Rad Cap, Monolythic Ceramic, 50V, 20%, Z5U Cap, Monolythic Ceramic, 50V, 20%, Z5U Cap., NPO Monolitic Ceramic, 50v, 5% Ra Capacitor, Ceramic Disc, 50V, 10% NPO Cap., NPO Monolitic Ceramic, 50v, 5% Ra Cap, Monolythic Ceramic, 50V, 20%, Z5U LED, T1 Package LED, T1 Package LED, T1 Package LED, T1 Package LED, T1 Package LED, T1 Package LED, T1 Package LED, T1 Package Diode SRS Residual Gas Analyzer 2 D 109 D 300 D 301 D 302 D 303 D 304 D 305 J 100 J 101 JP100 JP101 JP102 JP103 JP200 JP300 JP301 L 300 M 104 P 300 PC1 Q 100 Q 101 Q 102 Q 103 Q 104 Q 105 Q 106 R 100 R 101 R 102 R 103 R 104 R 105 R 106 R 107 R 108 R 109 R 110 R 111 R 112 R 113 R 114 R 115 R 116 R 117 R 118 R 119 R 120 R 121 R 122 R 123 R 124 R 125 R 126 R 127 RGA Parts List 3-00004-301 3-00203-301 3-00203-301 3-00203-301 3-00203-301 3-00004-301 3-00203-301 1-00143-101 1-00143-101 1-00086-130 1-00014-160 1-00264-131 1-00086-130 1-00264-131 1-00265-131 1-00264-131 6-00006-602 0-00546-000 4-00486-441 7-00671-701 3-00021-325 3-00021-325 3-00021-325 3-00021-325 3-00021-325 3-00021-325 3-00021-325 4-00192-407 4-00138-407 4-00887-407 4-00138-407 4-00079-401 4-00034-401 4-00031-401 4-00021-401 4-00021-401 4-00021-401 4-00031-401 4-00034-401 4-00034-401 4-00034-401 4-00034-401 4-00034-401 4-00034-401 4-00034-401 4-00034-401 4-00021-401 4-00021-401 4-00021-401 4-00021-401 4-00021-401 4-00021-401 4-00021-401 4-00021-401 4-00021-401 1N4148 1N5711 1N5711 1N5711 1N5711 1N4148 1N5711 TEST JACK TEST JACK 3 PIN SI 9 PIN D 20 PIN DI 3 PIN SI 20 PIN DI 4 PIN SI 20 PIN DI 33U 4-40 BE CU 50 RGA TOP 2N3904 2N3904 2N3904 2N3904 2N3904 2N3904 2N3904 49.9K 10.0K 133K 10.0K 4.7K 10K 100 1.0K 1.0K 1.0K 100 10K 10K 10K 10K 10K 10K 10K 10K 1.0K 1.0K 1.0K 1.0K 1.0K 1.0K 1.0K 1.0K 1.0K SRS Residual Gas Analyzer Diode Diode Diode Diode Diode Diode Diode Vertical Test Jack Vertical Test Jack Connector, Male Connector, D-Sub, Right Angle PC, Female Connector, Female Connector, Male Connector, Female Connector, Female Connector, Female Inductor, Radial Hardware, Misc. Pot, Multi-Turn Trim, 3/8" Square Top Ad Printed Circuit Board Transistor, TO-92 Package Transistor, TO-92 Package Transistor, TO-92 Package Transistor, TO-92 Package Transistor, TO-92 Package Transistor, TO-92 Package Transistor, TO-92 Package Resistor, Metal Film, 1/8W, 1%, 50PPM Resistor, Metal Film, 1/8W, 1%, 50PPM Resistor, Metal Film, 1/8W, 1%, 50PPM Resistor, Metal Film, 1/8W, 1%, 50PPM Resistor, Carbon Film, 1/4W, 5% Resistor, Carbon Film, 1/4W, 5% Resistor, Carbon Film, 1/4W, 5% Resistor, Carbon Film, 1/4W, 5% Resistor, Carbon Film, 1/4W, 5% Resistor, Carbon Film, 1/4W, 5% Resistor, Carbon Film, 1/4W, 5% Resistor, Carbon Film, 1/4W, 5% Resistor, Carbon Film, 1/4W, 5% Resistor, Carbon Film, 1/4W, 5% Resistor, Carbon Film, 1/4W, 5% Resistor, Carbon Film, 1/4W, 5% Resistor, Carbon Film, 1/4W, 5% Resistor, Carbon Film, 1/4W, 5% Resistor, Carbon Film, 1/4W, 5% Resistor, Carbon Film, 1/4W, 5% Resistor, Carbon Film, 1/4W, 5% Resistor, Carbon Film, 1/4W, 5% Resistor, Carbon Film, 1/4W, 5% Resistor, Carbon Film, 1/4W, 5% Resistor, Carbon Film, 1/4W, 5% Resistor, Carbon Film, 1/4W, 5% Resistor, Carbon Film, 1/4W, 5% Resistor, Carbon Film, 1/4W, 5% RGA Parts List R 128 R 202 R 203 R 204 R 205 R 206 R 210 R 211 R 212 R 213 R 214 R 215 R 216 R 217 R 218 R 219 R 220 R 221 R 222 R 223 R 224 R 225 R 226 R 227 R 228 R 229 R 230 R 231 R 232 R 233 R 300 R 301 R 302 R 303 R 304 R 305 R 306 R 309 R 310 R 312 R 313 R 314 R 315 R 316 R 317 R 318 R 319 R 320 R 321 R 322 R 323 SO101 SW100 U 100 U 102 4-00022-401 4-00138-407 4-00138-407 4-00053-401 4-00031-401 4-00479-407 4-00192-407 4-00142-407 4-00142-407 4-00192-407 4-00142-407 4-00138-407 4-00130-407 4-00141-407 4-00892-407 4-00031-401 4-00031-401 4-00398-407 4-00398-407 4-00131-407 4-00131-407 4-00897-408 4-00218-408 4-00897-408 4-00218-408 4-00192-407 4-00192-407 4-00555-407 4-00130-407 4-00376-407 4-00138-407 4-00138-407 4-00164-407 4-00034-401 4-00888-401 4-00034-401 4-00888-401 4-00130-407 4-00188-407 4-00202-407 4-00165-407 4-00154-407 4-00130-407 4-00021-401 4-00188-407 4-00188-407 4-00164-407 4-00188-407 4-00164-407 0-00000-000 4-00079-401 1-00232-150 0-00772-000 3-00637-340 3-00537-340 1.0M 10.0K 10.0K 200 100 66.5K 49.9K 100K 100K 49.9K 100K 10.0K 1.00K 100 11 100 100 499K 499K 1.00M 1.00M 1.910K 10.00K 1.910K 10.00K 49.9K 49.9K 590 1.00K 2.87K 10.0K 10.0K 20.0K 10K 150K 10K 150K 1.00K 4.99K 698 200 150 1.00K 1.0K 4.99K 4.99K 20.0K 4.99K 20.0K UNDECIDED PART 4.7K 52 PLCC TH 1.5" WIRE MAX705CPA 74HC373 3 Resistor, Carbon Film, 1/4W, 5% Resistor, Metal Film, 1/8W, 1%, 50PPM Resistor, Metal Film, 1/8W, 1%, 50PPM Resistor, Carbon Film, 1/4W, 5% Resistor, Carbon Film, 1/4W, 5% Resistor, Metal Film, 1/8W, 1%, 50PPM Resistor, Metal Film, 1/8W, 1%, 50PPM Resistor, Metal Film, 1/8W, 1%, 50PPM Resistor, Metal Film, 1/8W, 1%, 50PPM Resistor, Metal Film, 1/8W, 1%, 50PPM Resistor, Metal Film, 1/8W, 1%, 50PPM Resistor, Metal Film, 1/8W, 1%, 50PPM Resistor, Metal Film, 1/8W, 1%, 50PPM Resistor, Metal Film, 1/8W, 1%, 50PPM Resistor, Metal Film, 1/8W, 1%, 50PPM Resistor, Carbon Film, 1/4W, 5% Resistor, Carbon Film, 1/4W, 5% Resistor, Metal Film, 1/8W, 1%, 50PPM Resistor, Metal Film, 1/8W, 1%, 50PPM Resistor, Metal Film, 1/8W, 1%, 50PPM Resistor, Metal Film, 1/8W, 1%, 50PPM Resistor, Metal Film, 1/8W, 0.1%, 25ppm Resistor, Metal Film, 1/8W, 0.1%, 25ppm Resistor, Metal Film, 1/8W, 0.1%, 25ppm Resistor, Metal Film, 1/8W, 0.1%, 25ppm Resistor, Metal Film, 1/8W, 1%, 50PPM Resistor, Metal Film, 1/8W, 1%, 50PPM Resistor, Metal Film, 1/8W, 1%, 50PPM Resistor, Metal Film, 1/8W, 1%, 50PPM Resistor, Metal Film, 1/8W, 1%, 50PPM Resistor, Metal Film, 1/8W, 1%, 50PPM Resistor, Metal Film, 1/8W, 1%, 50PPM Resistor, Metal Film, 1/8W, 1%, 50PPM Resistor, Carbon Film, 1/4W, 5% Resistor, Carbon Film, 1/4W, 5% Resistor, Carbon Film, 1/4W, 5% Resistor, Carbon Film, 1/4W, 5% Resistor, Metal Film, 1/8W, 1%, 50PPM Resistor, Metal Film, 1/8W, 1%, 50PPM Resistor, Metal Film, 1/8W, 1%, 50PPM Resistor, Metal Film, 1/8W, 1%, 50PPM Resistor, Metal Film, 1/8W, 1%, 50PPM Resistor, Metal Film, 1/8W, 1%, 50PPM Resistor, Carbon Film, 1/4W, 5% Resistor, Metal Film, 1/8W, 1%, 50PPM Resistor, Metal Film, 1/8W, 1%, 50PPM Resistor, Metal Film, 1/8W, 1%, 50PPM Resistor, Metal Film, 1/8W, 1%, 50PPM Resistor, Metal Film, 1/8W, 1%, 50PPM Hardware, Misc. Resistor, Carbon Film, 1/4W, 5% Socket, THRU-HOLE Hardware, Misc. Integrated Circuit (Thru-hole Pkg) Integrated Circuit (Thru-hole Pkg) SRS Residual Gas Analyzer 4 U 103 U 104 U 105 U 106 U 107 U 108 U 109 U 110 U 111 U 112 U 113 U 114 U 200 U 201 U 202 U 203 U 209 U 211 U 300 U 301 U 302 U 303 U 304 U 305 U 306 U 307 Z0 Z0 Z0 RGA Parts List 3-00366-341 3-00109-340 3-00110-340 3-00036-340 6-00185-621 3-00169-340 3-00049-340 3-00039-340 3-00265-340 3-00265-340 3-00265-340 3-00039-340 3-00413-340 3-00270-340 3-00508-340 3-00636-340 3-00270-340 3-00091-340 3-00049-340 3-00385-340 3-00508-340 3-00630-340 3-00220-340 3-00632-340 3-00382-340 3-00633-340 0-00042-010 0-00241-021 1-00087-131 32KX8-35 MC1488 MC1489 74HC00 11.0592 74HC4020 74HC74 74HC14 74HC595 74HC595 74HC595 74HC14 LM34DZ 74HC4051 LM358 ADS7807P 74HC4051 LF412 74HC74 74HC4053 LM358 AD1861N OP297 AD810 OPA37 MAX528CPP 4-40 HEX 4-40X3/16PP 2 PIN JUMPER STATIC RAM, I.C. Integrated Circuit (Thru-hole Pkg) Integrated Circuit (Thru-hole Pkg) Integrated Circuit (Thru-hole Pkg) Crystal Oscillator Integrated Circuit (Thru-hole Pkg) Integrated Circuit (Thru-hole Pkg) Integrated Circuit (Thru-hole Pkg) Integrated Circuit (Thru-hole Pkg) Integrated Circuit (Thru-hole Pkg) Integrated Circuit (Thru-hole Pkg) Integrated Circuit (Thru-hole Pkg) Integrated Circuit (Thru-hole Pkg) Integrated Circuit (Thru-hole Pkg) Integrated Circuit (Thru-hole Pkg) Integrated Circuit (Thru-hole Pkg) Integrated Circuit (Thru-hole Pkg) Integrated Circuit (Thru-hole Pkg) Integrated Circuit (Thru-hole Pkg) Integrated Circuit (Thru-hole Pkg) Integrated Circuit (Thru-hole Pkg) Integrated Circuit (Thru-hole Pkg) Integrated Circuit (Thru-hole Pkg) Integrated Circuit (Thru-hole Pkg) Integrated Circuit (Thru-hole Pkg) Integrated Circuit (Thru-hole Pkg) Nut, Hex Screw, Panhead Phillips Connector, Female Bottom Board Components Ref. C 400 C 401 C 402 C 403 C 404 C 405 C 406 C 407 C 408 C 409 C 412 C 413 C 414 C 415 C 416 C 417 C 418 C 419 C 420 C 421 C 422 SRS p/n 5-00049-566 5-00100-517 5-00051-512 5-00023-529 5-00023-529 5-00062-513 5-00023-529 5-00052-512 5-00161-533 5-00161-533 5-00171-535 5-00171-535 5-00330-533 5-00330-533 5-00003-501 5-00003-501 0-00000-000 0-00000-000 0-00000-000 0-00000-000 5-00285-562 Value .001U 2.2U .015U .1U .1U .0022U .1U .01U .22U .22U .01U .01U .01U 400V 10% .01U 400V 10% 10P 10P UNDECIDED PART UNDECIDED PART UNDECIDED PART UNDECIDED PART 100P SRS Residual Gas Analyzer Description Cap, Polyester Film 50V 5% -40/+85c Rad Capacitor, Tantalum, 35V, 20%, Rad Cap, Stacked Metal Film 50V 5% -40/+85c Cap, Monolythic Ceramic, 50V, 20%, Z5U Cap, Monolythic Ceramic, 50V, 20%, Z5U Capacitor, Mylar/Poly, 50V, 5%, Rad Cap, Monolythic Ceramic, 50V, 20%, Z5U Cap, Stacked Metal Film 50V 5% -40/+85c Capacitor, Metallized Polyester Capacitor, Metallized Polyester Capacitor, Polypropylene Capacitor, Polypropylene Capacitor, Metallized Polyester Capacitor, Metallized Polyester Capacitor, Ceramic Disc, 50V, 10%, SL Capacitor, Ceramic Disc, 50V, 10%, SL Hardware, Misc. Hardware, Misc. Hardware, Misc. Hardware, Misc. Cap., NPO Monolitic Ceramic, 50v, 5% Ra RGA Parts List C 423 C 424 C 425 C 500 C 501 C 502 C 503 C 504 C 505 C 506 C 507 C 508 C 509 C 510 C 511 C 615 C 616 C 617 C 618 C 619 C 620 C 621 C 622 C 623 C 624 C 625 C 626 C 627 C 628 C 629 C 630 C 631 C 632 C 633 C 634 C 635 C 636 CX501 CX601 D 400 D 401 D 402 D 403 D 500 D 502 D 503 D 504 D 505 D 506 D 611 D 612 D 613 D 614 D 615 D 616 5-00121-566 5-00121-566 5-00005-501 5-00034-526 5-00003-501 5-00061-513 5-00023-529 5-00023-529 5-00329-526 5-00264-513 5-00264-513 5-00330-533 5-00330-533 5-00330-533 5-00023-529 5-00329-526 5-00329-526 5-00061-513 5-00329-526 5-00157-533 5-00157-533 5-00157-533 5-00100-517 5-00100-517 5-00100-517 5-00100-517 5-00100-517 5-00100-517 5-00100-517 5-00100-517 5-00100-517 5-00100-517 5-00100-517 5-00100-517 5-00100-517 5-00157-533 5-00157-533 5-00100-517 5-00100-517 3-00004-301 3-00004-301 3-00203-301 3-00203-301 3-00001-301 3-00004-301 3-00004-301 3-00004-301 3-00203-301 3-00004-301 3-00228-301 3-00228-301 3-00228-301 3-00228-301 3-00228-301 3-00228-301 .0047U .0047U 150P 100U 10P .001U .1U .1U 120U .0015U .0015U .01U 400V 10% .01U 400V 10% .01U 400V 10% .1U 120U 120U .001U 120U .1U .1U .1U 2.2U 2.2U 2.2U 2.2U 2.2U 2.2U 2.2U 2.2U 2.2U 2.2U 2.2U 2.2U 2.2U .1U .1U 2.2U 2.2U 1N4148 1N4148 1N5711 1N5711 1N4001 1N4148 1N4148 1N4148 1N5711 1N4148 MUR160 MUR160 MUR160 MUR160 MUR160 MUR160 5 Cap, Polyester Film 50V 5% -40/+85c Rad Cap, Polyester Film 50V 5% -40/+85c Rad Capacitor, Ceramic Disc, 50V, 10%, SL Capacitor, Electrolytic, 35V, 20%, Rad Capacitor, Ceramic Disc, 50V, 10%, SL Capacitor, Mylar/Poly, 50V, 5%, Rad Cap, Monolythic Ceramic, 50V, 20%, Z5U Cap, Monolythic Ceramic, 50V, 20%, Z5U Capacitor, Electrolytic, 35V, 20%, Rad Capacitor, Mylar/Poly, 50V, 5%, Rad Capacitor, Mylar/Poly, 50V, 5%, Rad Capacitor, Metallized Polyester Capacitor, Metallized Polyester Capacitor, Metallized Polyester Cap, Monolythic Ceramic, 50V, 20%, Z5U Capacitor, Electrolytic, 35V, 20%, Rad Capacitor, Electrolytic, 35V, 20%, Rad Capacitor, Mylar/Poly, 50V, 5%, Rad Capacitor, Electrolytic, 35V, 20%, Rad Capacitor, Metallized Polyester Capacitor, Metallized Polyester Capacitor, Metallized Polyester Capacitor, Tantalum, 35V, 20%, Rad Capacitor, Tantalum, 35V, 20%, Rad Capacitor, Tantalum, 35V, 20%, Rad Capacitor, Tantalum, 35V, 20%, Rad Capacitor, Tantalum, 35V, 20%, Rad Capacitor, Tantalum, 35V, 20%, Rad Capacitor, Tantalum, 35V, 20%, Rad Capacitor, Tantalum, 35V, 20%, Rad Capacitor, Tantalum, 35V, 20%, Rad Capacitor, Tantalum, 35V, 20%, Rad Capacitor, Tantalum, 35V, 20%, Rad Capacitor, Tantalum, 35V, 20%, Rad Capacitor, Tantalum, 35V, 20%, Rad Capacitor, Metallized Polyester Capacitor, Metallized Polyester Capacitor, Tantalum, 35V, 20%, Rad Capacitor, Tantalum, 35V, 20%, Rad Diode Diode Diode Diode Diode Diode Diode Diode Diode Diode Diode Diode Diode Diode Diode Diode SRS Residual Gas Analyzer 6 D 617 D 618 D 619 D 620 D 621 D 622 D 623 F 600 JP400 JP500 JP501 JP600 JP601 L 400 L 401 L 500 L 501 L 601 L 602 L 603 LX400 LX401 LX500 LX601 LX602 LX603 M 404 PC1 Q 400 Q 404 Q 405 Q 406 Q 407 Q 502 Q 503 Q 504 Q 505 Q 506 Q 507 Q 508 R 400 R 401 R 402 R 403 R 404 R 405 R 406 R 407 R 408 R 409 R 410 R 411 R 412 R 413 R 414 RGA Parts List 3-00228-301 3-00228-301 3-00228-301 3-00228-301 3-00228-301 3-00228-301 3-00625-302 6-00135-611 1-00264-131 1-00270-130 1-00270-130 1-00269-159 1-00264-131 6-00174-630 6-00174-630 6-00174-630 0-00772-000 6-00174-630 6-00174-630 6-00174-630 0-00772-000 0-00772-000 0-00772-000 0-00772-000 0-00772-000 0-00772-000 0-00546-000 7-00670-701 3-00022-325 3-00627-325 3-00628-325 3-00627-325 3-00628-325 3-00644-329 3-00627-325 3-00627-325 3-00628-325 3-00627-325 3-00628-325 3-00628-325 4-00800-401 4-00022-401 4-00031-401 4-00188-407 4-00889-401 4-00138-407 4-00021-401 4-00021-401 4-00031-401 4-00557-407 4-00138-407 4-00034-401 4-00056-401 4-00043-401 4-00043-401 MUR160 MUR160 MUR160 MUR160 MUR160 MUR160 MBR1535CT 5A 2AG 20 PIN DI 4 PIN SI 4 PIN SI 9 PIN 20 PIN DI 6611 TYPE 43 6611 TYPE 43 6611 TYPE 43 1.5" WIRE 6611 TYPE 43 6611 TYPE 43 6611 TYPE 43 1.5" WIRE 1.5" WIRE 1.5" WIRE 1.5" WIRE 1.5" WIRE 1.5" WIRE 4-40 BE CU RGA BOTTOM 2N3906 MPSA92 MPSA42 MPSA92 MPSA42 TIP48/TIP47 MPSA92 MPSA92 MPSA42 MPSA92 MPSA42 MPSA42 1 1.0M 100 4.99K 110 10.0K 1.0K 1.0K 100 40.2K 10.0K 10K 22 180 180 SRS Residual Gas Analyzer Diode Diode Diode Diode Diode Diode Diode, Dual Schottky Fuse Connector, Female Connector, Male Connector, Male Connector, D-Sub, Right Angle PC, Male Connector, Female Ferrite Beads Ferrite Beads Ferrite Beads Hardware, Misc. Ferrite Beads Ferrite Beads Ferrite Beads Hardware, Misc. Hardware, Misc. Hardware, Misc. Hardware, Misc. Hardware, Misc. Hardware, Misc. Hardware, Misc. Printed Circuit Board Transistor, TO-92 Package Transistor, TO-92 Package Transistor, TO-92 Package Transistor, TO-92 Package Transistor, TO-92 Package Voltage Reg., TO-220 (TAB) Package Transistor, TO-92 Package Transistor, TO-92 Package Transistor, TO-92 Package Transistor, TO-92 Package Transistor, TO-92 Package Transistor, TO-92 Package Resistor, Carbon Film, 1/4W, 5% Resistor, Carbon Film, 1/4W, 5% Resistor, Carbon Film, 1/4W, 5% Resistor, Metal Film, 1/8W, 1%, 50PPM Resistor, Carbon Film, 1/4W, 5% Resistor, Metal Film, 1/8W, 1%, 50PPM Resistor, Carbon Film, 1/4W, 5% Resistor, Carbon Film, 1/4W, 5% Resistor, Carbon Film, 1/4W, 5% Resistor, Metal Film, 1/8W, 1%, 50PPM Resistor, Metal Film, 1/8W, 1%, 50PPM Resistor, Carbon Film, 1/4W, 5% Resistor, Carbon Film, 1/4W, 5% Resistor, Carbon Film, 1/4W, 5% Resistor, Carbon Film, 1/4W, 5% RGA Parts List R 415 R 416 R 417 R 418 R 419 R 420 R 421 R 422 R 423 R 424 R 425 R 426 R 427 R 428 R 429 R 430 R 431 R 432 R 433 R 434 R 435 R 436 R 437 R 438 R 439 R 440 R 441 R 442 R 443 R 444 R 500 R 501 R 502 R 503 R 504 R 505 R 506 R 507 R 508 R 509 R 510 R 511 R 513 R 514 R 515 R 516 R 517 R 518 R 519 R 520 R 521 R 522 R 523 R 524 R 525 4-00800-401 4-00800-401 4-00800-401 4-00800-401 4-00034-401 4-00192-407 4-00138-407 4-00446-407 4-00131-407 4-00405-407 4-00034-401 4-00188-407 4-00074-401 4-00022-401 4-00034-401 4-00083-401 4-00890-408 4-00890-408 4-00022-401 4-00022-401 4-00021-401 4-00021-401 4-00131-407 4-00034-401 4-00074-401 4-00034-401 4-00188-407 4-00079-401 4-00079-401 4-00081-401 4-00168-407 4-00188-407 4-00138-407 4-00142-407 4-00473-407 4-00138-407 4-00164-407 4-00164-407 4-00138-407 4-00303-407 4-00138-407 4-00192-407 4-00034-401 4-00034-401 4-00800-401 4-00800-401 4-00141-407 4-00031-401 4-00034-401 4-00192-407 4-00138-407 4-00141-407 4-00188-407 4-00032-401 4-00034-401 1 1 1 1 10K 49.9K 10.0K 47.5K 1.00M 2.49M 10K 4.99K 33K 1.0M 10K 47K 1.000M 1.000M 1.0M 1.0M 1.0K 1.0K 1.00M 10K 33K 10K 4.99K 4.7K 4.7K 470 22.6K 4.99K 10.0K 100K 11.0K 10.0K 20.0K 20.0K 10.0K 7.87K 10.0K 49.9K 10K 10K 1 1 100 100 10K 49.9K 10.0K 100 4.99K 100K 10K 7 Resistor, Carbon Film, 1/4W, 5% Resistor, Carbon Film, 1/4W, 5% Resistor, Carbon Film, 1/4W, 5% Resistor, Carbon Film, 1/4W, 5% Resistor, Carbon Film, 1/4W, 5% Resistor, Metal Film, 1/8W, 1%, 50PPM Resistor, Metal Film, 1/8W, 1%, 50PPM Resistor, Metal Film, 1/8W, 1%, 50PPM Resistor, Metal Film, 1/8W, 1%, 50PPM Resistor, Metal Film, 1/8W, 1%, 50PPM Resistor, Carbon Film, 1/4W, 5% Resistor, Metal Film, 1/8W, 1%, 50PPM Resistor, Carbon Film, 1/4W, 5% Resistor, Carbon Film, 1/4W, 5% Resistor, Carbon Film, 1/4W, 5% Resistor, Carbon Film, 1/4W, 5% Resistor, Metal Film, 1/8W, 0.1%, 25ppm Resistor, Metal Film, 1/8W, 0.1%, 25ppm Resistor, Carbon Film, 1/4W, 5% Resistor, Carbon Film, 1/4W, 5% Resistor, Carbon Film, 1/4W, 5% Resistor, Carbon Film, 1/4W, 5% Resistor, Metal Film, 1/8W, 1%, 50PPM Resistor, Carbon Film, 1/4W, 5% Resistor, Carbon Film, 1/4W, 5% Resistor, Carbon Film, 1/4W, 5% Resistor, Metal Film, 1/8W, 1%, 50PPM Resistor, Carbon Film, 1/4W, 5% Resistor, Carbon Film, 1/4W, 5% Resistor, Carbon Film, 1/4W, 5% Resistor, Metal Film, 1/8W, 1%, 50PPM Resistor, Metal Film, 1/8W, 1%, 50PPM Resistor, Metal Film, 1/8W, 1%, 50PPM Resistor, Metal Film, 1/8W, 1%, 50PPM Resistor, Metal Film, 1/8W, 1%, 50PPM Resistor, Metal Film, 1/8W, 1%, 50PPM Resistor, Metal Film, 1/8W, 1%, 50PPM Resistor, Metal Film, 1/8W, 1%, 50PPM Resistor, Metal Film, 1/8W, 1%, 50PPM Resistor, Metal Film, 1/8W, 1%, 50PPM Resistor, Metal Film, 1/8W, 1%, 50PPM Resistor, Metal Film, 1/8W, 1%, 50PPM Resistor, Carbon Film, 1/4W, 5% Resistor, Carbon Film, 1/4W, 5% Resistor, Carbon Film, 1/4W, 5% Resistor, Carbon Film, 1/4W, 5% Resistor, Metal Film, 1/8W, 1%, 50PPM Resistor, Carbon Film, 1/4W, 5% Resistor, Carbon Film, 1/4W, 5% Resistor, Metal Film, 1/8W, 1%, 50PPM Resistor, Metal Film, 1/8W, 1%, 50PPM Resistor, Metal Film, 1/8W, 1%, 50PPM Resistor, Metal Film, 1/8W, 1%, 50PPM Resistor, Carbon Film, 1/4W, 5% Resistor, Carbon Film, 1/4W, 5% SRS Residual Gas Analyzer 8 R 526 R 527 R 528 R 529 R 530 R 531 R 532 R 533 R 534 R 535 R 536 R 537 R 538 R 539 R 540 R 541 R 542 R 543 R 544 R 545 R 546 R 547 R 548 R 549 R 550 R 551 R 615 R 616 R 617 R 618 RL500 T 400 T 401 T 500 T 601 U 400 U 401 U 402 U 403 U 500 U 501 U 502 U 503 U 504 U 505 U 601 U 603 U 605 U 606 U 608 Z0 Z0 Z0 Z0 Z0 RGA Parts List 4-00048-401 4-00079-401 4-00021-401 4-00457-407 4-00034-401 4-00131-407 4-00131-407 4-00131-407 4-00294-407 4-00131-407 4-00398-407 4-00131-407 4-00390-407 4-00390-407 4-00294-407 4-00398-407 4-00398-407 4-00021-401 4-00138-407 4-00164-407 4-00138-407 4-00034-401 4-00032-401 4-00032-401 4-00021-401 4-00083-401 4-00303-407 4-00800-401 4-00800-401 4-00058-401 3-00196-335 6-00009-610 6-00197-601 6-00200-610 6-00199-610 3-00090-340 3-00286-340 3-00508-340 3-00220-340 3-00385-340 3-00634-340 3-00508-340 3-00508-340 3-00508-340 3-00410-309 3-00634-340 3-00112-329 3-00346-329 3-00330-329 3-00119-329 0-00042-010 0-00241-021 0-00342-000 1-00006-130 1-00250-116 2.2K 4.7K 1.0K 33.2K 10K 1.00M 1.00M 1.00M 24.9K 1.00M 499K 1.00M 61.9K 61.9K 24.9K 499K 499K 1.0K 10.0K 20.0K 10.0K 10K 100K 100K 1.0K 47K 7.87K 1 1 220K HS-212S-5 T1-1-X65 RF PRIMARY RGA FILAMENT RGA INVERTER LF411 SN75372 LM358 OP297 74HC4053 3525A LM358 LM358 LM358 MOC8204 3525A 7805 7812 7912 7905 4-40 HEX 4-40X3/16PP FUSEHOLDER 2AG 2 PIN DI 2 PIN, WHITE SRS Residual Gas Analyzer Resistor, Carbon Film, 1/4W, 5% Resistor, Carbon Film, 1/4W, 5% Resistor, Carbon Film, 1/4W, 5% Resistor, Metal Film, 1/8W, 1%, 50PPM Resistor, Carbon Film, 1/4W, 5% Resistor, Metal Film, 1/8W, 1%, 50PPM Resistor, Metal Film, 1/8W, 1%, 50PPM Resistor, Metal Film, 1/8W, 1%, 50PPM Resistor, Metal Film, 1/8W, 1%, 50PPM Resistor, Metal Film, 1/8W, 1%, 50PPM Resistor, Metal Film, 1/8W, 1%, 50PPM Resistor, Metal Film, 1/8W, 1%, 50PPM Resistor, Metal Film, 1/8W, 1%, 50PPM Resistor, Metal Film, 1/8W, 1%, 50PPM Resistor, Metal Film, 1/8W, 1%, 50PPM Resistor, Metal Film, 1/8W, 1%, 50PPM Resistor, Metal Film, 1/8W, 1%, 50PPM Resistor, Carbon Film, 1/4W, 5% Resistor, Metal Film, 1/8W, 1%, 50PPM Resistor, Metal Film, 1/8W, 1%, 50PPM Resistor, Metal Film, 1/8W, 1%, 50PPM Resistor, Carbon Film, 1/4W, 5% Resistor, Carbon Film, 1/4W, 5% Resistor, Carbon Film, 1/4W, 5% Resistor, Carbon Film, 1/4W, 5% Resistor, Carbon Film, 1/4W, 5% Resistor, Metal Film, 1/8W, 1%, 50PPM Resistor, Carbon Film, 1/4W, 5% Resistor, Carbon Film, 1/4W, 5% Resistor, Carbon Film, 1/4W, 5% Relay Transformer Inductor Transformer Transformer Integrated Circuit (Thru-hole Pkg) Integrated Circuit (Thru-hole Pkg) Integrated Circuit (Thru-hole Pkg) Integrated Circuit (Thru-hole Pkg) Integrated Circuit (Thru-hole Pkg) Integrated Circuit (Thru-hole Pkg) Integrated Circuit (Thru-hole Pkg) Integrated Circuit (Thru-hole Pkg) Integrated Circuit (Thru-hole Pkg) Optical Switch Integrated Circuit (Thru-hole Pkg) Voltage Reg., TO-220 (TAB) Package Voltage Reg., TO-220 (TAB) Package Voltage Reg., TO-220 (TAB) Package Voltage Reg., TO-220 (TAB) Package Nut, Hex Screw, Panhead Phillips Hardware, Misc. Connector, Male Header, Amp, MTA-156 RGA Parts List 9 Vertical Board Components Ref. C 700 C 701 C 750 C 751 C 800 C 801 C 806 C 807 C 808 C 809 C 810 C 811 C 812 C 813 C 814 C 815 C 816 C 817 C 818 C 819 C 820 D 501 D 610 D 800 D 801 D 802 D 803 D 804 D 805 D 806 D 807 D 808 D 809 D 810 D 811 D 812 J 701 JP700 JP750 JP751 JP752 JP800 JP850 JP852 JP853 JP854 JP855 L 402 L 800 SRS p/n 5-00023-529 5-00023-529 5-00339-574 5-00339-574 5-00060-512 5-00100-517 5-00143-536 5-00143-536 5-00143-536 5-00143-536 5-00143-536 5-00143-536 5-00143-536 5-00143-536 5-00143-536 5-00143-536 5-00331-560 5-00332-560 5-00054-512 5-00023-529 5-00052-512 3-00625-302 3-00625-302 3-00004-301 3-00004-301 3-00626-301 3-00626-301 3-00626-301 3-00626-301 3-00626-301 3-00626-301 3-00626-301 3-00626-301 3-00626-301 3-00626-301 3-00004-301 1-00268-120 1-00266-130 1-00271-131 1-00271-131 1-00267-130 1-00263-130 1-00264-131 1-00266-130 1-00266-130 1-00266-130 1-00266-130 6-00502-601 6-00174-630 Value .1U .1U .5P 500V SMT .5P 500V SMT 1.0U 2.2U 1200P 1200P 1200P 1200P 1200P 1200P 1200P 1200P 1200P 1200P 1000P/.001U 100P .047U .1U .01U MBR1535CT MBR1535CT 1N4148 1N4148 MUR1100E MUR1100E MUR1100E MUR1100E MUR1100E MUR1100E MUR1100E MUR1100E MUR1100E MUR1100E 1N4148 PUSH-ON RG58 20 PIN DI RA 4 PIN SI SIDE 4 PIN SI SIDE 4 PIN SI RA 20 PIN DI 20 PIN DI 20 PIN DI RA 20 PIN DI RA 20 PIN DI RA 20 PIN DI RA RF XFRMR T131-6 6611 TYPE 43 Description Cap, Monolythic Ceramic, 50V, 20%, Z5U Cap, Monolythic Ceramic, 50V, 20%, Z5U SMT, High Voltage Porcelain Cap. SMT, High Voltage Porcelain Cap. Cap, Stacked Metal Film 50V 5% -40/+85c Capacitor, Tantalum, 35V, 20%, Rad Capacitor, Ceramic, 1000 VDCW Capacitor, Ceramic, 1000 VDCW Capacitor, Ceramic, 1000 VDCW Capacitor, Ceramic, 1000 VDCW Capacitor, Ceramic, 1000 VDCW Capacitor, Ceramic, 1000 VDCW Capacitor, Ceramic, 1000 VDCW Capacitor, Ceramic, 1000 VDCW Capacitor, Ceramic, 1000 VDCW Capacitor, Ceramic, 1000 VDCW Capacitor, Ceramic Disc, 3KV Capacitor, Ceramic Disc, 3KV Cap, Stacked Metal Film 50V 5% -40/+85c Cap, Monolythic Ceramic, 50V, 20%, Z5U Cap, Stacked Metal Film 50V 5% -40/+85c Diode, Dual Schottky Diode, Dual Schottky Diode Diode Diode Diode Diode Diode Diode Diode Diode Diode Diode Diode Diode Connector, BNC Connector, Male Connector, Female Connector, Female Connector, Male Connector, Male Connector, Female Connector, Male Connector, Male Connector, Male Connector, Male Inductor Ferrite Beads SRS Residual Gas Analyzer 10 LX800 PC1 Q 401 Q 402 Q 403 Q 500 Q 501 Q 604 Q 605 Q 700 Q 701 Q 702 Q 703 Q 800 Q 801 Q 802 R 700 R 701 R 702 R 703 R 704 R 705 R 706 R 707 R 708 R 709 R 800 R 801 R 802 R 803 R 804 R 805 R 806 R 809 R 810 R 812 R 813 R 814 RL700 RL701 RL702 T 800 U 602 U 604 U 607 U 700 U 701 U 800 Z0 Z0 Z0 Z0 Z0 Z0 Z0 RGA Parts List 0-00772-000 7-00669-701 3-00082-329 3-00629-329 3-00629-329 3-00283-340 3-00283-340 3-00283-340 3-00283-340 3-00635-325 3-00635-325 3-00635-325 3-00635-325 3-00082-329 3-00021-325 3-00021-325 4-00035-401 4-00035-401 4-00857-458 4-00857-458 4-00193-407 4-00193-407 4-00032-401 4-00031-401 4-00031-401 4-00032-401 4-00166-407 4-00034-401 4-00034-401 4-00074-401 4-00031-401 4-00192-407 4-00130-407 4-00891-458 4-00131-407 4-00138-407 4-00142-407 4-00047-401 3-00523-335 3-00523-335 3-00523-335 6-00201-610 3-00114-329 3-00112-329 3-00120-329 3-00631-340 3-00631-340 3-00091-340 0-00043-011 0-00079-031 0-00089-033 0-00096-041 0-00122-053 0-00125-050 0-00187-021 1.5" WIRE RGA VERTICALS D44VH10 IRF510 IRF510 IRF530/IRF532 IRF530/IRF532 IRF530/IRF532 IRF530/IRF532 PN4117A PN4117A PN4117A PN4117A D44VH10 2N3904 2N3904 10M 10M 1.0G .5W 200PPM 1.0G .5W 200PPM 499 499 100K 100 100 100K 200K 10K 10K 33K 100 49.9K 1.00K 100M .5W 1.00M 10.0K 100K 2.2 G6AK-234P-ST-UC G6AK-234P-ST-UC G6AK-234P-ST-UC RGA HIGH VOLTAG 7815 7805 7915 AD549LH AD549LH LF412 4-40 KEP 4-40X3/16 M/F 4" #4 SPLIT 2-1/4" #24 3" #18 4-40X1/4PP SRS Residual Gas Analyzer Hardware, Misc. Printed Circuit Board Voltage Reg., TO-220 (TAB) Package Voltage Reg., TO-220 (TAB) Package Voltage Reg., TO-220 (TAB) Package Integrated Circuit (Thru-hole Pkg) Integrated Circuit (Thru-hole Pkg) Integrated Circuit (Thru-hole Pkg) Integrated Circuit (Thru-hole Pkg) Transistor, TO-92 Package Transistor, TO-92 Package Transistor, TO-92 Package Transistor, TO-92 Package Voltage Reg., TO-220 (TAB) Package Transistor, TO-92 Package Transistor, TO-92 Package Resistor, Carbon Film, 1/4W, 5% Resistor, Carbon Film, 1/4W, 5% Resistor, Metal Oxide Resistor, Metal Oxide Resistor, Metal Film, 1/8W, 1%, 50PPM Resistor, Metal Film, 1/8W, 1%, 50PPM Resistor, Carbon Film, 1/4W, 5% Resistor, Carbon Film, 1/4W, 5% Resistor, Carbon Film, 1/4W, 5% Resistor, Carbon Film, 1/4W, 5% Resistor, Metal Film, 1/8W, 1%, 50PPM Resistor, Carbon Film, 1/4W, 5% Resistor, Carbon Film, 1/4W, 5% Resistor, Carbon Film, 1/4W, 5% Resistor, Carbon Film, 1/4W, 5% Resistor, Metal Film, 1/8W, 1%, 50PPM Resistor, Metal Film, 1/8W, 1%, 50PPM Resistor, Metal Oxide Resistor, Metal Film, 1/8W, 1%, 50PPM Resistor, Metal Film, 1/8W, 1%, 50PPM Resistor, Metal Film, 1/8W, 1%, 50PPM Resistor, Carbon Film, 1/4W, 5% Relay Relay Relay Transformer Voltage Reg., TO-220 (TAB) Package Voltage Reg., TO-220 (TAB) Package Voltage Reg., TO-220 (TAB) Package Integrated Circuit (Thru-hole Pkg) Integrated Circuit (Thru-hole Pkg) Integrated Circuit (Thru-hole Pkg) Nut, Kep Standoff Tie Washer, Split Wire #24 UL1007 Strip 1/4x1/4 Tin Wire #18 UL1007 Stripped 3/8x3/8 No Tin Screw, Panhead Phillips RGA Parts List Z0 Z0 Z0 Z0 Z0 Z0 Z0 Z0 Z0 Z0 Z0 Z0 Z0 Z0 Z0 Z0 Z0 Z0 Z0 Z0 Z0 Z0 Z0 Z0 Z0 0-00231-043 0-00238-026 0-00259-021 0-00308-021 0-00316-003 0-00317-070 0-00551-000 0-00588-030 0-00589-026 0-00614-021 0-00617-031 0-00627-056 0-00638-055 1-00230-100 1-00277-170 1-00279-100 1-00311-165 1-00312-178 7-00664-720 7-00665-720 7-00668-720 7-00710-709 9-00396-907 9-00544-907 9-00569-907 1-32, #4 SHOULD 6-32X1/4PF 4-40X1/2"PP 4-40X7/8PP PLTFM-28 40MM 24V 40MM FAN GUARD #4X5/16" 4-40X5/16"PF 4-40X1-1/4PP 4-40X1-3/16 F/F SOUND/AUDIO 1PR HV - UL3239 1/6/8365 RS232 SER DB9 DB9M-DB25F 9 PIN SOLDR CUP CABLE CLAMP MS-37 MS-38 MS-41 MYLAR INSULATOR 3/8" RED #7 PVC CLEAR #16 TEFLON INS. 11 Washer, nylon Screw, Black, All Types Screw, Panhead Phillips Screw, Panhead Phillips Insulators Fans, & Hardware Hardware, Misc. Spacer Screw, Black, All Types Screw, Panhead Phillips Standoff Cable, Coax & Misc. Wire, Other Connector, Misc. Cable Assembly, Multiconductor Connector, Misc. Connector, D-Sub, Female Connector Housing, Plug Fabricated Part Fabricated Part Fabricated Part Lexan Overlay Shrink Tubing Shrink Tubing Shrink Tubing Option 01 components Ref. Misc Misc Misc Misc Misc Misc Misc Misc Misc Misc Misc Misc Misc Misc Misc Misc Misc SRS p/n 0-00089-033 0-00141-032 0-00222-021 0-00225-052 0-00227-052 0-00491-005 0-00521-048 0-00547-002 0-00548-051 0-00549-051 0-00550-031 0-00594-050 0-00595-050 0-00596-050 6-00005-611 6-00182-615 7-00703-720 Value 4" 22-18GA 6-32X1/4PP 17" #22 BLAC 17" #22 RED #10 SOLDER 3" #18 POWERBLOCK 2.5" BLACK 2.5" WHITE 6-32X1.5" 4-1/2" #18 B 4-1/2" #18 O 6-1/2" #18 B 2A 3AG MAP55-1024 MS-51 Description Tie Termination Screw, Panhead Phillips Wire #22 UL1007 Wire #22 UL1007 Lugs Wire, #18 UL1015 Strip 3/8 x 3/8 No Ti Power_Entry Hardware Wire #20 UL1007 Wire #20 UL1007 Standoff UL1007 Stripped 3/8x3/8 No Ti UL1007 Stripped 3/8x3/8 No Ti UL1007 Stripped 3/8x3/8 No Ti Fuse Power Supply Fabricated Part SRS Residual Gas Analyzer