1
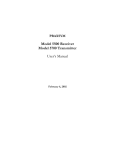
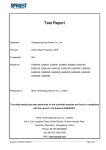
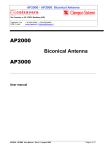
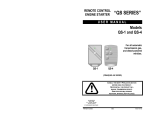
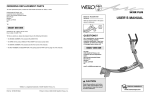
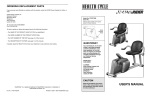
Shielded Room Measurement System
-------------
Model SG1000A
Synthesized Signal Generator
Model PR1000A
Preamplifier
User’s Manual
February 20, 2003
TABLE OF CONTENTS
1.0
System Description
page 3
2.0
Overview of the SG1000A Signal Generator
page 3
3.0
Overview of the PR1000A Preamplifier
page 4
4.0
Shield Measurement Techniques
page 6
5.0
Operating the SG1000A
page 7
6.0
Operating the PR1000A
page 11
7.0
Specifications
page 12
2
1.0
System Description
The SG1000A Signal Generator and PR1000A Preamplifier have been designed to
simplify the measurement of shielding integrity in a shielded enclosure. When coupled
with a high stability spectrum analyzer and an appropriate selection of test antennas, the
SG1000A/PR1000A combination can measure shielding effectiveness at all of the NSA
94-106 (supersedes NSA 65-6) defined test frequencies from 1 kHz to 10 GHz.
The high stability of the SG1000A signal generator is sufficient to allow all measurements
to be made with a companion spectrum analyzer operating at an IF resolution bandwidth as
low as 10 Hz at 10GHz. The narrow bandwidth coupled with a 3.5 dB preamplifier noise
figure and the high signal generator output power, is adequate to achieve measurement
dynamic ranges of 160 dB or more.
2.0
Overview of the SG1000A Signal Generator
The SG1000A generates output signals as outlined in DOD specification NSA 94-106.
These frequencies include 1 kHz, 10 kHz, 100 kHz, 1 MHz, 10 MHz, 100 MHz, 400 MHz,
1 GHz and 10 GHz. Each frequency except 10 GHz can be varied up to +/- 5 percent in
order to avoid interfering signals. The 10 GHz frequency can be varied up to +/- 2 percent.
LOW BAND AMP
10 GHZ SYNTH
MID BAND AMP
100-1000 MHZ SYNTH
RF OUT
STEP ATTEN
0-70dB
1 KHZ-10 MHZ SYNTH
HI BAND AMP
EXTERNAL SYNTH
BY-PASS
SP4T
SWITCH
SP4T
SWITCH
SP4T
SWITCH
Figure 1
SG1000A Conceptual Block Diagram
Figure 1 is a basic block diagram of the SG1000A. The heart of the SG1000A consists of
three synthesizers, one covering the 1kHz through 10 MHz, the second generating 100
MHz through 1 GHz, and the third generating 10 GHz. One of these three synthesizer
outputs, or the external input, is switched to the 70dB step attenuator to generate the 9
target frequency bands. Output levels can be adjusted in 10 dB steps over a 110 dB range
by either routing the signal to the appropriate nominal 30dB gain linear power amplifier or
to the nominal 10dB attenuator by-pass. The output frequency and the attenuator settings
are both indicated via front panel LED displays.
3
Nominal output power levels are 10 watts from 1 kHz to 10 MHz, 1 watt from 100 MHz to
1 GHz, and 1 watt at 10GHz. To ensure operator safety during measurement setup
periods, a front panel switch will disable the power amplifiers without turning off the
synthesizer. The power amplifiers should be disabled whenever disconnecting the antenna
or cables from the RF output connector.
The signal generator can be configured for bench top or rack mount operation. Power
requirement is 230 watts at 110/220 VAC.
3.0
Overview of the PR1000A Preamplifier
The PR1000A amplifies the received signal from the test antenna and masks the high noise
figure of the companion test receiver or spectrum analyzer. The PR1000A, when used
with an Agilent 8562E spectrum analyzer (or equivalent) will ensure that the system noise
figure will be less than 4.5 dB at all test frequencies from 1 kHz to 10 GHz. When used
with a spectrum analyzer measurement bandwidth of 100 Hz, the system exhibits a
sensitivity of –150 dBm at the test antenna output.
A block diagram of the PR1000A is shown in Figure 2. At frequencies from 1 kHz to 1
GHz, the test antenna is connected to the low band preamplifier. The preamp output is
switched by an SPDT electro-mechanical coaxial switch to the test receiver.
38 dB
1 KHZ - 1 GHZ
INPUT
LIMITER
LNA
26 dB
12V
9.8 - 10.2 GHZ
INPUT
RF OUT
(TO SPECTRUM
ANALYZER)
24 dB
BIAS TEE
LNA
LNA
(LOCATED AT
ANTENNA)
SP2T
SWITCH
Figure 2
PR1000A Conceptual Block Diagram
To overcome high cable loss between the test antenna and the PR1000A assembly at 10
GHz, a remote low noise pre-amplifier (Praxsym PN 310-010091-001) is mounted directly
onto the 10 GHz antenna. A bias tee inside the PR1000A chassis powers the remote
preamp through the coax cable interconnecting the PR1000A and the 10 GHz test antenna.
Additional gain at 10 GHz is provided by a second pre-amplifier in the PR1000A chassis.
The 10 GHz amplified signal is routed to the test receiver through the SPDT coaxial
switch. Using this configuration, the PR1000A can be interfaced to the 10 GHz test
antenna with cables having insertion loss as high as 20 dB without significantly degrading
the overall system sensitivity.
4
The PR1000A is supplied in a 19” wide x 1.75” high x 10” deep chassis. The unit can be
configured for bench top or rack mount operation. Power requirement is 15 watts at
110/220 VAC.
System Noise Figure
Several factors need to be considered when calculating the system noise figure of the
receiver. The noise figure of a spectrum analyzer is the difference (in dB) between the
theoretical value of noise power density in a 1 Hz bandwidth given by KTB (Boltzman’s
constant, temperature in degrees Kelvin, and bandwidth) which is –174dBm/Hz at room
temperature and the spectrum analyzer’s displayed average noise level normalized to 1 Hz.
For example if the spectrum analyzer has a specified noise level of –145dBm in a 1 Hz
bandwidth at a specified frequency, the difference between this and –174dBm/Hz is 29dB
and is the noise figure of the spectrum analyzer at that frequency. The displayed average
noise level specification requires that the input RF attenuator be set to 0dB. Every dB that
the input attenuator setting is increased from a setting of zero will add as many dB to the
noise figure of the spectrum analyzer calculated above.
To achieve a 4.5dB system noise figure at 10GHz using a spectrum analyzer with a noise
figure of 29dB, the external LNA provides 26dB of gain with a noise figure of less than
2.5dB, followed by a transmission line with up to 20dB of loss, followed by the PR1000A
with 24dB of gain with a noise figure of 3.5dB.
5
4.0
Shield Measurement Techniques
A typical test setup is shown in Figure 3. The shielding effectiveness measurement is
made with RF substitution techniques.
CALIBRATION SETUP
SG1000A
SPECTRUM
ANALYZER
PR1000A
ATTEN. SETTING 'A1'
dB(AT LEAST 60 dB)
DOOR OPEN
NOTE SIGNAL LEVEL 'L1' dBm
SHIELDED ROOM
MEASUREMENT SETUP
PR1000A
SG1000A
ATTEN. SETTING 'A2'
dB (0 OR 10 dB)
DOOR CLOSED
SPECTRUM
ANALYZER
NOTE SIGNAL LEVEL 'L2' dBm
SHIELDED ROOM
SHIELDING LEVEL = ( (A1 - A2) + (L1 - L2) ) dB
Figure 3
Typical Measurement Setup
The SG1000A is installed inside the enclosure with the appropriate antenna. The
PR1000A, spectrum analyzer, and receive antenna are located outside the enclosure. An
initial measurement is made with the enclosure door in an open position, and the receive
and transmit antennas separated by the prescribed distance. The SG1000A attenuator is set
to “A1” (at least 60 dB of attenuation), and a reference signal level, “L1”, is measured on
the spectrum analyzer and recorded.
With the door closed and the SG1000A attenuator set to “A2” (0 or 10 dB of attenuation),
a new signal level, “L2”, is measured on the spectrum analyzer. The addition of the
change in the SG1000A attenuator setting (A1-A2) and the spectrum analyzer signal level
(L1-L2) yields the shielding level offered by the enclosure between the two antennas. The
antennas can then be relocated to check the shielding level at different locations in the
enclosure.
6
5.0
Operating the SG1000A
Plug the SG1000A into 110/220 VAC 50/60Hz power source. The instrument contains a
universal power supply that automatically adjusts to any power source in this range.
Figure 4 depicts the front panel of the SG1000A.
Figure 4
SG1000A Front Panel
Power-On State
Toggle the AC power switch. The embedded light will illuminate. The DC Status LED will
light indicating that the power supply is operating correctly. The instrument will power-on
in the ‘Internal’ mode, employing the on-board synthesizers. The Output Frequency
readout will display ‘1.0000 GHz,’ the power-on default band. The Attenuation readout
will show ‘110 dB’, maximum attenuation. The Power Amp Enable button is not lit,
indicating that the power amp is not powered.
The absence of any lit LEDS in the ‘EXTERNAL’ sector of the front panel together with a
valid frequency in the Output Frequency readout indicates that one of the internal
synthesizers is selected.
Warm Up Period
The SG1000A contains an oven controlled crystal oscillator (OCXO) that is used as a
reference for the synthesizer circuits. Once the generator is powered on, the user should
wait five minutes to insure that the oven has stabilized. Once stabilized, the output
frequency of the SG1000A will normally drift less than +/-0.2ppm across the temperature
range. This high stability reference is installed in generators starting with serial number
201.
7
Frequency Fine-Tuning
Use the ‘Vernier’ control in the Output Frequency sector to adjust the frequency up or
down. This list indicates the adjustment range and step sizes for the available bands.
Frequency Band
1 kHz
10 kHz
100 kHz
1 MHz
10 MHz
100 MHz
400 MHz
1 GHz
10 GHz
Adjustment Range
.95 to 1.05 kHz (+/-5%)
9.5 to 10.5 kHz (+/-5%)
95 to 105 kHz (+/-5%)
.95 to 1.05 MHz (+/-5%)
9.5 to 10.5 MHz (+/-5%)
95 to 105 MHz (+/-5%)
380 to 420 MHz (+/-5%)
.95 to 1.05 GHz (+/-5%)
9.8 to 10.2 GHz (+/-2%)
Step Size
1 Hz
10 Hz
100 Hz
1 kHz
10 kHz
100 kHz
100 kHz
1 MHz
1 MHz
Pressing the ‘Center’ switch will return the frequency to the center of the selected band.
Switching Bands
Use the ‘Band’ arrow pushbuttons to move from band to band. The last selected target
frequency in each band will be stored and recalled when that band is selected. At poweron the target frequency for each band defaults to the band-center frequency. Each
changing of the band will cause the ‘Power Amp’ to be disabled.
Enabling Power Output
Pressing the ‘Power Amp Enable’ switch will enable one of the three power amplifiers.
The LED in the Enable switch will indicate this state. Depending on the selected
ATTENUATION, signal levels as high as 10 watts are directed to the OUTPUT connector.
A load should always be connected to the OUTPUT connector when the power amplifiers
are enabled. Any change of band will cause the output to be disabled, requiring it to be
manually enabled again.
When the Enable switch is pressed, the RF output will not appear on the connector for
about five seconds, the Enable LED rapidly blinking during this time. After the RF signal
is present and the LED is lit steadily, a depression of the Enable switch will immediately
shut off the signal, extinguishing the LED.
If the Enable switch is pressed during the five seconds while the LED is rapidly blinking,
the turn-on of the Output will be delayed an additional two minutes. During this period the
LED assumes a slower blink rate. If the Enable switch is depressed again during this twominute period, the request for Output will immediately be terminated. Once the OUTPUT
has been enabled via the ‘two minute’ delay mode, the output will remain on for 10
minutes and will then be automatically disabled.
Note: Do not change the state of any front panel control while the
Power Amp Output is in a blinking state. To do so may throw the
frequency or attenuation readouts out of sync with the true state
of the instrument. The request for Output should first be
terminated by pressing the Enable once (in slow blink mode) or
twice (in fast blink mode.)
8
The ‘Overtemp’ LED will illuminate if the low band power amplifier becomes overheated.
This is an abnormal condition. Output will be disabled and will remain disabled and the
LED will remain ON until the instrument is power cycled. It’s a good idea to let the
instrument continue to run for a few minutes in the ‘Overtemp’ condition to give the fans
an opportunity to cool the overheated amplifier. Check the fan inlets for obstructions.
Move the instrument to a cooler environment if the problem persists.
Adjusting the Output Power
Use the ‘Attenuation’ Up or Down switches to control the magnitude of the Output signal.
The output signal can be attenuated up to 110 dB (90 dB for the two bottom bands) from
the rated output of each power amplifier. The maximum output and the allowable
attenuation range for each band are indicated in this table.
Frequency Band
1 kHz
10 kHz
100 kHz
1 MHz
10 MHz
100 MHz
400 MHz
1 GHz
10 GHz
Maximum Power Output
10 W
10 W
10 W
10 W
10 W
1W
1W
1W
1W
Attenuation Range
0 to 90 dB
0 to 90 dB
0 to 110 dB
0 to 110 dB
0 to 110 dB
0 to 110 dB
0 to 110 dB
0 to 110 dB
0 to 110 dB
When switching bands, the attenuation readout will not change as long as the selected
attenuation is within the allowable range for the new target band. For example, when
switching from the 100 kHz band to the 10 kHz band, an attenuation level of 100 dB or
110 dB will automatically change to 90 dB. Then, when switching from the 10 kHz band
to the 100 kHz band, an attenuation level of 90 dB will remain at 90 dB.
At power-on the attenuation level defaults to 110 dB (at 1 GHz.)
When operating at attenuation levels greater than 70dB, the power amplifiers are disabled,
and the signals are routed thru the by-pass channel as shown in Figure 1. The POWER
AMP ENABLE LED will remain lit to indicate to the operator that a valid RF signal is
being applied to the OUTPUT connector.
External Synthesizer Operation
Frequencies other that those provided by the internal synthesizers can be amplified by
connecting an appropriate signal to the EXTERNAL INPUT connector. To operate
correctly and to avoid damage to the SG1000A, the synthesized frequency should be in the
range of 1 kHz - 1 GHz or 9.8-10.2 GHz with a nominal RF level of 0dBm. Application of
signal levels greater then +20dBm will cause permanent damage to the step attenuator.
9
To activate External mode, press the External Enable switch. You will see these
indications:
•
The External Enable LED will illuminate and stay lit.
•
One of the Range Select LEDs will be lit indicating which Power Amp will be
used. (The power-on default is ‘500-1000 MHz.’)
•
The Output Frequency will display ‘ - - - - -.’
•
The Power Amp Enable LED will extinguish if it was previously lit.
Note: In External Mode, the SG1000A’s calibration is not
in effect. Attenuation levels of 0 dB to 70 dB will be
approximately correct, but an attempted setting of 80 dB to
110 dB will be meaningless and erratic.
When External mode is activated, signals applied to the EXTERNAL INPUT connector
are routed thru the 0-70dB step attenuator and then thru the selected amplifier as shown in
Figure 1. The low band amplifier (.001 – 10MHz) has nominal gain of 40dB and an output
power of 10 watts (+40dBm). The maximum power applied to the low band amplifier is
approximately 0dBm before the amplifier will be compressed. The mid band amplifier
(10-1000MHz) has nominal gain of 36dB and an output power of 1 watt (+30dBm). The
maximum power applied to the mid band amplifier is approximately -6dBm before the
amplifier will be compressed. The high band amplifier (9.8-10.2GHz) has nominal gain
of 36dB and an output power of 1 watt (+30dBm).
Calibration and Remote Operation:
The SG1000A has been calibrated at the factory to meet the specifications detailed in
Section 7.0. A DB9 connector located on the instrument’s rear panel allows a PC host or
other equipment to communicate via RS232 with the embedded microcontroller for this
purpose. This facility is documented in Praxsym document 010039ICD and is reserved for
factory test and calibration.
10
6.0
Operating the PR1000A
Plug the PR1000A into 110/220 VAC 50/60Hz power source. The instrument contains a
universal power supply that automatically adjusts to any power source in this range.
Power-On State
Toggle the AC power switch. The embedded light will illuminate. The instrument will
power-on with one of the low noise amplifiers enabled.
Switching Bands
Use the ‘SELECT’ switch to change the input from the 1kHz-1GHz band to the 10GHz
band. The LED will be illuminated next to the RF connector of the selected band.
External Amplifier Bias
The pushbutton switch labeled “BIAS” turns the bias voltage for the external amplifier on
and off. The bias voltage is “on” when the switch is depressed and the embedded LED is
illuminated. A nominal 12V bias voltage is applied to the center conductor of the 10GHz
RF input connector. A 0.5 amp fuse is located on the right side of the “BIAS” switch to
protect the bias tee should the output pin be shorted.
Figure 5
PR1000A Front Panel
11
7.0
Specifications
SG1000A Signal Generator:
Frequency
Band
1 kHz
10 kHz
100 kHz
1 MHz
10 MHz
100 MHz
400 MHz
1 GHz
10 GHz
Tuning Range
Step Size
.95 to 1.05 kHz (+/-5%)
9.5 to 10.5 kHz (+/-5%)
95 to 105 kHz (+/-5%)
.95 to 1.05 MHz (+/-5%)
9.5 to 10.5 MHz (+/-5%)
95 to 105 MHz (+/-5%)
380 to 420 MHz (+/-5%)
.95 to 1.05 GHz (+/-5%)
9.8 to 10.2 GHz (+/-2%)
1 Hz
10 Hz
100 Hz
1 kHz
10 kHz
100 kHz
100 kHz
1 MHz
1 MHz
Attenuator Accuracy:
Harmonic Spurious:
Non-Harmonic Spurious:
Phase Noise:
Front Panel Fault Display:
Power Amplifier Disable:
External Signal Input:
Operating Temperature:
Operating Humidity:
Power Supply:
Size:
Weight:
Maximum
Power Out
40 dBm
40 dBm
40 dBm
40 dBm
40 dBm
30 dBm
30 dBm
30 dBm
30 dBm
Attenuation
Range
0 to 90 dB
0 to 90 dB
0 to 110 dB
0 to 110 dB
0 to 110 dB
0 to 110 dB
0 to 110 dB
0 to 110 dB
0 to 110 dB
+/- 1.2 dB
< - 20 dBc
< - 40 dBc
-90 dBc/Hz at 10kHz offset (1 GHz band) typical
-115 dBc/Hz at 500 kHz (1GHz band) typical
Over-temperature, synthesizer unlock
Front panel illuminated switch
Front panel input, switch-enabled frequency range select
(0 dBm nominal input level)
0 to + 40 degrees Centigrade
95% relative humidity, non-condensing
110/220 VAC (auto-adjusting), 48–63 Hz, 230 watts
19” x 5.25” x 20” (Width x Height x Depth)
33 pounds nominal
12
PR1000A Preamplifier (includes 10 GHz remote amplifier):
Frequency:
Gain:
Noise Figure:
Output Level:
VSWR:
Maximum Safe Input Level:
Internal Bias Tee:
Operating Temperature:
Operating Humidity:
Power Supply:
Size:
Weight:
1 kHz to 1 GHz (low frequency input)
9.8 to 10.2 GHz (high frequency input)
Low frequency input – 38 dB minimum
High frequency input – 45 dB minimum
(including external 10 GHz amplifier)
3.5 dB maximum (1 kHz to 500 MHz)
4.5 dB maximum (500 MHz to 1 GHz)
4.5 dB maximum (9.8 to 10.2 GHz)
(including remote preamp and 10 dB of cable loss
between remote pre-amplifier and PR1000A)
+ 8 dBm minimum at 1 dB gain compression
(output to spectrum analyzer)
2.0:1 maximum all ports
Low frequency input: +20dBm
High frequency input: +20dBm
Provides +12 VDC via high frequency input
Connector to the remote 10 GHz pre-amplifier
(0.5 Ampere fast blow fuse)
0 to +40 degrees Centigrade
95% relative humidity, non-condensing
110/220 VAC (auto-adjusting), 48–63 Hz, 15 watts
(1.0 Ampere fast blow fuse)
19” x 1.75” x 10” (Width x Height x Depth)
6 pounds nominal
13