1
FREET – Program Documentation
User Manual
able bigger response). A high negative correlation coefficient, e.g. -0.8, indicates opposite
strong sensitivity (bigger variable smaller response). Positive and negative sensitivity is
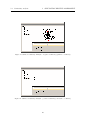
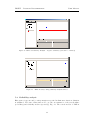
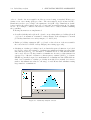
shown in separate columns. There are two ways of graphical representation – cartesian
and parallel coordinates representations. Parallel coordinate representation provides an
insight into analyzed problem. Random variables are ordered with respect of the sensitivity expressed by nonparametric rank-order correlation coefficient. Positive and negative
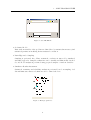
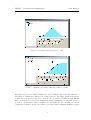
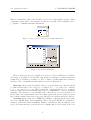
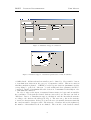
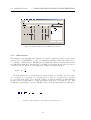
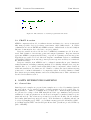
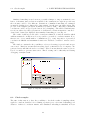
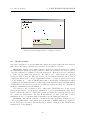
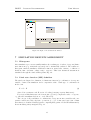
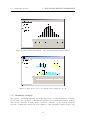
sensitivity is shown in Fig. 22 and Fig. 23 (parallel coordinates) and in Fig. 24 and Fig.
25 (cartesian coordinates).
Note 1: When the user assess this relative measure of sensitivity it is necessary to take into
account the signs of input random variables considered in Stochastic model. Therefore an
option to change the sign of variable (x−1 ) is included here. This option is recommended
to use in case the negative signs are considered for some basic input random variables in
”Stochastic model” for correct understanding of sensitivity results.
Note 2: ”What–if–study” known as deterministic sensitivity analysis can be done easily
by FReET. To study absolute influence of a specific input variable, we can consider it as
random variable with rectangular distribution and to keep other variables as deterministic. Only this one variable is then sampled - consequent model analysis will provide a
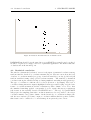
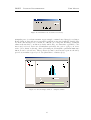
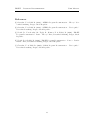
clear influence of this variable. Sensitivity window in cartesian coordinates will provide
just functional relationship between variable, varying between upper and lower limits of
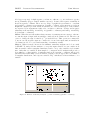
rectangular distribution, and response variable, Fig. 26indicates a linear influence of a
variable.
Figure 22: Window Sensitivity Analysis – positive sensitivity (parallel coordinates)
19