1
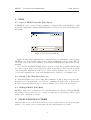
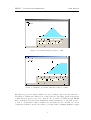
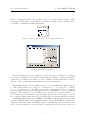
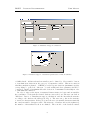
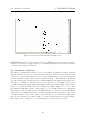
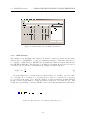
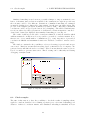
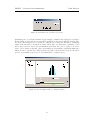
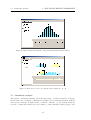
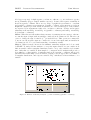
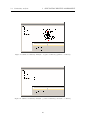
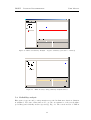
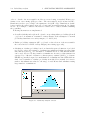
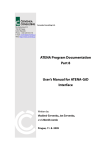
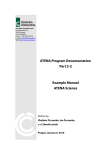
FREET – Program Documentation
User Manual
Figure 25: Window Sensitivity Analysis – negative sensitivity (cartesian coordinates)
Figure 26: ”What–if–study” using sensitivity analysis window
7.4
Reliability analysis
Histogram of response and/or safety margin as specified in limit state function definition
is visualized. The aim of this window is to provide an estimation of theoretical failure
probability (and reliability index respectively), Fig. 27. Theoretical models of PDF in
21