1
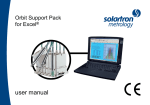
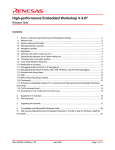
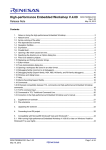
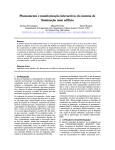
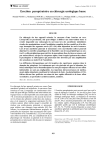
NRC Publications Archive Archives des publications du CNRC User manual for dynamic test batch processor Smith, Nathan; Lau, Michael NRC Publications Record / Notice d'Archives des publications de CNRC: http://nparc.cisti-icist.nrc-cnrc.gc.ca/npsi/ctrl?action=rtdoc&an=19504561&lang=en http://nparc.cisti-icist.nrc-cnrc.gc.ca/npsi/ctrl?action=rtdoc&an=19504561&lang=fr Access and use of this website and the material on it are subject to the Terms and Conditions set forth at http://nparc.cisti-icist.nrc-cnrc.gc.ca/npsi/jsp/nparc_cp.jsp?lang=en READ THESE TERMS AND CONDITIONS CAREFULLY BEFORE USING THIS WEBSITE. L’accès à ce site Web et l’utilisation de son contenu sont assujettis aux conditions présentées dans le site http://nparc.cisti-icist.nrc-cnrc.gc.ca/npsi/jsp/nparc_cp.jsp?lang=fr LISEZ CES CONDITIONS ATTENTIVEMENT AVANT D’UTILISER CE SITE WEB. Contact us / Contactez nous: [email protected]. DOCUMENTATION PAGE REPORT NUMBER NRC REPORT NUMBER DATE LM-2011-01 March 23, 2011 REPORT SECURITY CLASSIFICATION DISTRIBUTION Unclassified Unlimited TITLE USER MANUAL FOR DYNAMIC TEST BATCH PROCESSOR AUTHOR(S) Nathan Smith and Michael Lau CORPORATE AUTHOR(S)/PERFORMING AGENCY(S) Institute for Ocean Technology, National Research Council, St. John’s, NL PUBLICATION SPONSORING AGENCY(S) Transport Canada IOT PROJECT NUMBER NRC FILE NUMBER PJ2409 KEY WORDS PAGES FIGS. TABLES Podded propulsor, Pods, Propulsion, Software, Araon iv, 13, App A 10 8 SUMMARY The analysis of podded propulsion devices generates a large volume of data. The collection of static data covering the entire operational range for a pod is impractical due to time and resource constraints. To improve the efficiency of podded propulsor performance analysis a method has been developed to utilize dynamic test data to achieve an equivalent measure of performance. It is impractical to process this model test data by hand or with conventional spreadsheet based tools. As such, software based tools have been developed in the MATLAB environment to aid the analyst in their task of producing an acceptable performance surface as a function of azimuthing angle and advance coefficient. This report describes one such tool and discusses the current implementation, revisions on previous methods, and the limitations of the software. The graphical user interface for the software is described as well as common troubleshooting methods. These methods proved successful in the analysis of the model test data from the model icebreaker Araon and its podded propulsion system. ADDRESS National Research Council Institute for Ocean Technology Arctic Avenue, P. O. Box 12093 St. John's, NL A1B 3T5 Tel. (709) 772-2479 Fax: (709) 772-2462 National Research Council Canada Conseil national de recherches Canada Institute for Ocean Technology Institut des technologies océaniques USER MANUAL FOR DYNAMIC TEST BATCH PROCESSOR LM-2011-01 Nathan Smith and Michael Lau March 2011 SUMMARY The performance of ships with podded propulsion is studied with models. Model testing of podded propulsors generates a large volume of data, which must be analysed efficiently. The collection of static data covering the entire operational range for a pod is impractical due to time and resource constraints. To improve the efficiency of podded propulsor performance analysis a method has been developed to utilize dynamic test data to achieve an equivalent measure of performance. It is impractical to process this model test data by hand or with conventional spreadsheet based tools. Software-based tools have been developed in the MATLAB environment to aid the analyst in their task of producing an acceptable performance surface as a function of azimuthing angle and advance coefficient. This report describes one such tool and discusses the current implementation, revisions on previous methods and the limitations of the software. The graphical user interface for the software is described as well as common troubleshooting methods. This tool has proved successful in the analysis of the model test data from the model icebreaker Araon and its podded propulsion system. LM-2011-01 i TABLE OF CONTENTS SUMMARY......................................................................................................................... I LIST OF FIGURES .......................................................................................................... III LIST OF TABLES............................................................................................................ IV 1 INTRODUCTION ...................................................................................................... 1 2 DESCRIPTION OF DATA FLOW ............................................................................ 1 3 CO-ORDINATE SYSTEM ........................................................................................ 2 4 DATA COLLECTION ............................................................................................... 4 5 DYNAMIC TEST BATCH PROCESSOR ................................................................ 5 5.1 Required Files ..................................................................................................... 6 5.2 Startup ................................................................................................................. 6 5.3 Setup and Configuration Settings ....................................................................... 7 5.4 File Selection ...................................................................................................... 9 5.5 Plot Settings ........................................................................................................ 9 5.6 Batch Processing............................................................................................... 11 5.7 Issues with Batch Processing ............................................................................ 11 6 CONCLUSIONS AND RECOMENDATIONS....................................................... 12 7 REFERENCES ......................................................................................................... 13 APPENDIX A: CONFIGURATION FILE FORMAT..................................................... 14 LM-2011-01 ii LIST OF FIGURES Figure 1: Test data flow ...................................................................................................... 2 Figure 2: Model and pod coordinate systems (right-hand rule).......................................... 2 Figure 3: Selected model test segments .............................................................................. 4 Figure 4: Dynamic Test Batch Processor graphical user interface ..................................... 6 Figure 5: Channel assignment............................................................................................. 7 Figure 6: Other user inputs ................................................................................................. 8 Figure 7: Saving a configuration......................................................................................... 9 Figure 8: Coefficient plot options ..................................................................................... 10 Figure 9: Raw data plot options ........................................................................................ 10 Figure 10: File selection.................................................................................................... 11 LM-2011-01 iii LIST OF TABLES Table 1: Model and pod coordinate system definitions ...................................................... 3 Table 2: Parameter units ..................................................................................................... 4 Table 3: Minimum parameters collected for dynamic model tests..................................... 5 Table 4: Parameter definitions ............................................................................................ 5 Table 5: Plot settings......................................................................................................... 10 Table 6: GEDAP data file format example....................................................................... 14 Table 7: GEDAP channel example ................................................................................... 15 Table 8: Config File parameters ....................................................................................... 16 LM-2011-01 iv USER MANUAL FOR DYNAMIC TEST BATCH PROCESSOR 1 INTRODUCTION Podded propulsors are becoming common methods for driving ships. The characterization of any podded propulsion system relies on the analysis of model tests to provide performance characteristics of the system. The analysis of podded propulsion model trials requires the processing of vast amounts of collected data. This data includes static trials, dynamic trials, bollard trials and manoeuvring trials. In an effort to aid the analyst in this process tools have been developed which can accomplish this processing efficiently and with the output of a parametric performance surface guiding the procedure for modeling and calculation. The Dynamic Test Batch Processor (DTBP) has been designed to aid the analyst in processing dynamic model test data. This manual will outline the process of using the DTBP software to process data and provide the relevant output. All features of the software will be described including its limitations and possible improvements for future implementation. For a more detailed description of the underlying code the Programmers Manual [1]* may be referenced. 2 DESCRIPTION OF DATA FLOW Many of the trials completed during podded propulsor characterization generate vast amounts of data. Careful data collection and processing is needed to achieve the correct performance parameters. Figure 1 outlines the correct sequence of analysis and provides an overview of the collected model test data. The trials highlighted in yellow show which data sets can be processed using the dynamic processing software. In open water towed propulsion (OWTP) tests, the tow carriage propels the model through the fluid. In pod open-hull (PO) tests, a specialized hull [2] is used to determine the performance of the pods in the absence of a traditional hull. In open water self-propulsion (OWSP) tests, the pods are the primary propulsive force acting on the model. In this way the model propels itself through the fluid (in contrast to the towed tests). * Numbers in square brackets refer to Section 7 References. LM-2011-01 1 Test Setup PMM Opens Boat Free Propulsion Pod Opens (PO) Open Water Self Propulsion (OWSP) Tests Bare Hull Open Water Towed Propulsion (OWTP) Data Resistance OWTPStatic OWTPDynamic POStatic PODynamic OWSPStatic OWSPDynamic Figure 1: Test data flow 3 CO-ORDINATE SYSTEM All model test data must conform to a consistent co-ordinate scheme. The scheme for this analysis is shown in Figure 2. The axes coordinate systems and motions are defined in Table 1. The co-ordinate systems follow the IOT standard convention for seakeeping and manoeuvrability: the axes follow the “right-hand rule” (RHR) with the positive XG-axis pointing towards the bow of the model, the YG-axis towards the starboard side and the ZG-axis downwards. Figure 2: Model and pod coordinate systems (right-hand rule) LM-2011-01 2 Table 1: Model and pod coordinate system definitions Parameter Description Model coordinates origin centre of gravity of the model XG axis parallel to the longitudinal axis. (positive towards the bow) YG axis perpendicular to the longitudinal axis (positive towards the starboard side) ZG axis perpendicular to both XG and YG (positive downwards) ROLL rotation of the model about the XG-axis following the RHR. PITCH rotation of the model about the YG-axis following the RHR. YAW rotation of the model about the ZG-axis following the RHR. Pod coordinates origin centre of rotation about the azimuthing axis XP, XS axis of the (P)ort or (S)tarboard pod parallel with the model’s longitudinal axis (sign convention same as for XG) YP, YS axis of the (P)ort or (S)tarboard pod perpendicular to the longitudinal axis (sign convention same as for YG) ZP, ZS axis of the (P)ort or (S)tarboard pod perpendicular to both the x- and yaxes (sign convention same as for ZG) MXP, MXS moment about the XP- or XS-axis following the RHR MYP, MYS moment about the YP- or YS-axis following the RHR MZP, MZS moment about the ZP- or ZS-axis following the RHR QP/S torque measured at the propeller shaft (positive torque when propeller is pulling away from pod housing) TP/S thrust measured at the propeller shaft (positive torque when propeller is pulling away from pod housing) All forces and moments are measured in metric units as outlined in Table 2. All moments and rotational speeds are measured according to the right-hand rule. For example, when viewed along the positive XG-axis, positive roll is defined clockwise. Likewise, positive azimuthing rotation of the pods is measured positive clockwise when looking along the positive ZP-or ZS-axis. LM-2011-01 3 Table 2: Parameter units 4 Parameter Units Distance metres Time seconds Velocity/Speed metres per second Rotational Speed revolutions per second Force newtons Moment newton-metres Power kilowatts DATA COLLECTION Model test data should be selected and tared as described in the Lau and Akinturk report on open pod model test [2]. This will produce segments of data for each unique operational condition as shown in Figure 3. Figure 3: Selected model test segments The analysis procedures require that data to be imported be prepared in a consistent manner. The structure and format of model test data must be prepared in such a way that it conforms to the following criteria. The files must be in tab-separated format with or LM-2011-01 4 without header rows or columns. The data must be time series data where the first data column must be the time stamp associated with the sample. The required data for processing must be included in the columns of the file. Table 3 lists the minimum table contents. The parameters are defined in Table 4. Table 3: Minimum parameters collected for dynamic model tests Time Vel Azi_P RPS_P Fx_P Fy_P Fz_P T_P Q_P Azi_S RPS_S Fx_S Fy_S Fz_S T_S Q_S Note: Parameters without a subscript are global model values. Parameters with ‘_P’ are for the port pod while ‘_S’ is for the starboard pod. Table 4: Parameter definitions Parameter Description Time time stamp for each sample data (s) Vel velocity of model (m/s) RPS propellor speed (rps) Fx force on pod along x axis (N) Fy force on pod along y axis (N) Fz force on pod along z axis (N) T thrust generated by prop (N) Q torque generated by prop (N-m) Azi azipod The resulting time-series file should be named as given in the open pod report [2]. The file may contain any other data from the model tests, however the analysis tools will only use the columns specified by the user. 5 DYNAMIC TEST BATCH PROCESSOR The dynamic test batch processor (DTBP) allows the user to perform convolution smoothing on a set of dynamic data files [4]. This processing needs to be performed on files with a common operating mode as described above. The DTBP completes the analysis and provides a set of dynamic curves for further screening and processing. The batch processor completes the following operations. LM-2011-01 5 5.1 Required Files The DTBP requires the following MATLAB files in a single folder: DynamicBatchModeGUI.m Dynamic_CoefficientCurves.m getFiles.m importdatafiles.m smooth2.m 5.2 Startup The batch processor can be started in graphical mode by running DynamicBatchModeGUI.m. If the files are run natively in MATLAB, the processor can be started by selecting DebugRun DynamicBatchModeGUI.m or by hitting the F5 key. The user will find the main screen (illustrated in Figure 4) useful for modifying the batch process or reviewing previous settings. Figure 4: Dynamic Test Batch Processor graphical user interface LM-2011-01 6 From this graphical user (GUI) interface the analyst can set up and process a folder of model test results. 5.3 Setup and Configuration Settings The DTBP needs to be set up by the analyst. This requires that the user have some familiarity with the model test to input the required information. The user must provide the channel configuration either in the form of a configuration file or by manually entering the channel assignments in the graphical user interface. These parameters can all be entered into the user interface or loaded from a configuration file. To import a predefined configuration file, the analyst must press the ‘Load Config’ button. Once DTBP is set up, the settings can be saved to a project-specific configuration file for later use. This allows the use of a common project configuration file for all analysis. The configuration files must contain the necessary index labels and must be saved with a ‘.txt’ extension. An example configuration file is included in Appendix A. The channel identification must consist of a single positive integer, which represents the column in which the described parameter is stored. (With the GEDAP assembler (described further in this section), the column reference must not include the time columns.) The channels can also be manually set up in the area indicated in Figure 5 by first pressing the ‘Edit Config’ button. Figure 5: Channel assignment The user must also provide details on the propeller diameter used and the relevant fluid density. These constant parameters can be input as illustrated in Figure 6. LM-2011-01 7 Figure 6: Other user inputs If the data files to be used contain a header row then the appropriate check boxes can be selected. The ‘Use Assembler’ drop down menu can be used to select the different assembler routines to use to create the initial data structures. These routines prepare the data by assembling multiple files together, if necessary, to produce a single data record. This is required, for example, with existing GEDAP processed data, which is currently provided as a collection of 3 independent files. The files all contain the time stamp for an individual sample as the first column of each file. The assembler program concatenates these three files. It also removes the first column of any files appended to the initial data file for a given run. The purpose of the assembler routines is to allow the analyst to use the provided data sets without first pre-processing. Without an assembler, the analyst would need to create new files with a single standard file format. This would double the amount of data stored and in the case of data collected at a high sampling rate this has been found to be less than satisfactory. For files that do not require assembly, the appropriate selection from the drop down box would be ‘NONE’. For GEDAP processed data generating 3 files, the required assembler would be ‘GEDAP’. The user must implement any additional assembler requirements. LM-2011-01 8 Figure 7: Saving a configuration Once a configuration has been decided upon, it may be saved using the ‘Save Config’ button. Likewise if a configuration has already been generated the analyst may recall it by selecting ‘Load Config’ button and browsing to the location of the configuration file. Figure 7 illustrates the required inputs for loading, editing, and saving a configuration. 5.4 File Selection Once the initial configuration has been set the files to be analyzed must be defined. This is completed through the ‘Select Files’ portion of the GUI. The ‘Browse Input Folder’ button enables the analyst to select a folder containing all of the data files that are to be processed. The ‘Browse Output Folder’ button is used to select a location to store the figures, image files, and results file which is generated during the batch process. The user must enter a unique output file name in the provided text box. This should replace the ‘Please enter a file name for batch results’ text. This filename will be used for the generated *.mat file containing the results of the analysis. The ‘Reset Button’ can be used if the user needs to re-initialize the GUI in the event of an error. The ‘Help Button’ will launch the required help file located within the current directory. The user may also manually enter an input folder, output folder or output filename. 5.5 Plot Settings The batch processor can provide multiple outputs for a given data set. The output settings are described in Table 5.and illustrated in Figure 8 and Figure 9. LM-2011-01 9 Table 5: Plot settings Checkbox Required input Description of output Plot Conv. Curve number of points to use for convolution window Mean curve will be calculated using FFT-Convolution procedure [4]. Smooth Raw Data number of points to use to perform moving average The raw data will be averaged. This option is used to filter out artefacts introduced by resampling the original data. Plot Raw Data N/A The processor will produce graphics of the raw input data. Plot Raw Data vs. Time N/A The processor will produce graphics of raw input data vs. time. Plot Raw Data vs. Angle N/A The processor will produce graphics of raw input data vs. azimuthing angle. Figure 8: Coefficient plot options Figure 9: Raw data plot options LM-2011-01 10 5.6 Batch Processing Once the configuration has been completed, the batch processor can be run. This is accomplished by clicking the ‘Start Batch’ button, as illustrated in Figure 10. The batch processor will provide the user with information relevant to the remaining processing to be completed. If a computer with multiple processors is available, then multiple instances of the batch processor may be run. Sampling rate affects the processing time significantly. For purely graphical representations, experience shows that data sampled at 50 Hz is adequate. For further analysis and the creation of end user performance surfaces 1,000 Hz data should be used. The 1,000 Hz data represents a compromise between fidelity of the original data and size limitations imposed by available hard drive space and runtime memory. Figure 10: File selection 5.7 Issues with Batch Processing During the processing of the propulsion test data from the Opens [2] and Araon tests [5] several issues were encountered. In an effort to provide future analysts with the tools to overcome challenges with provided data, the analyst must recognize these issues during run time and attempt these possible fixes in case of error. MATLAB will usually throw exceptions when the data does not conform to the standard. The following potential issues should be investigated: 1. Verification that multiple files, which are to be assembled as a single model test, have the same number of sample points. During the Araon processing, it was observed that the re-sampling procedures would occasionally create sets of files with one more or one less sample than its partner files. 2. Improper sorting of files, which appear to have failed during processing. For example, a segment of a dynamic trial was often used for bollard conditions or a static segment. These segments produced results, which were noted as being errors in the code until further examination of the raw data provided insight into the actual conditions during the time segment in question. LM-2011-01 11 6 CONCLUSIONS AND RECOMENDATIONS Many improvements have been made to the Dynamic Test Batch Processor (DTBP) software. The ability to run multiple files during a single session has been implemented. Multiple input file formats have been allowed for as well. This version has the ability to produce a variety of diagnostic outputs. These outputs can be used to investigate errors during a model test or for data, which do not appear to match the existing trends. Error checking has been built into the batch processor and the unique challenges of the processing of the model test data from the Korean icebreaker Araon have been presented. The surface generation software, capable of creating a performance surface suitable for simulation using the OSIS or Polaris simulation package, can use output of the batch processor. For more information on the processing procedure please see the reports: ‘Tools for Podded Propulsion Analysis’ [3] and ‘Numerical Analysis for Podded Propulsion and Adjustment Factors for a General Pod Model’ [4]. LM-2011-01 12 7 REFERENCES 1. Smith, N and Lau, M.: A Programmer Manual for Podded Propulsion Analyst (PPA) Software, IOT report, Institute for Ocean Technology, National Research Council of Canada St. John’s, NL, 2011. 2. Lau, M. and and Akinturk, A.: Performance of KORDI Icebreaker “Araon” Podded Propulsors, IOT report LM-2011-02, Institute for Ocean Technology, National Research Council of Canada, St. John’s, NL, 2011 3. Lau, M. and Smith, N.: Tools for Podded Propulsion Analysis, IOT report, Institute for Ocean Technology, National Research Council of Canada, St. John’s, NL, 2011. 4. Wongyai, P. and Lau, M.: Numerical Analysis for Podded Propulsion and Adjustment Factors for a General Pod Model, IOT Report SR-2010-28, Institute for Ocean Technology, National Research Council of Canada, St. John’s, NL, 2010 5. Lau, M. and Akinturk, A.: Performance of Podded Propulsors behind the KOPRI Icebreaker "Araon". IOT Report, Institute for Ocean Technology, National Research Council of Canada, St. John’s, NL, 2011 LM-2011-01 13 APPENDIX A: CONFIGURATION FILE FORMAT The configuration file for the dynamic batch processor must be a comma-separated file that has the following format: Time,1 Azi_P,2 RPS_P,5 … The batch processor looks for the channel of the data by first finding the string associated with the channel then taking the next string as the value to use. For example, the time variable is stored in column 1 of the data files. The position of the column is to be taken from the first data entry of the data file. The software makes allowances for text data and blank columns. For GEDAP data, which is provided as three separate part files, each part file has the time stamp in the first column of data. The analyst must omit the time column from all but the first part file when determining the channels. When the three files are appended together, only the timestamp from the first part file is maintained. For example if the three files are constructed as in Table 6, then the channel assignments should be as shown in Table 7. Table 6: GEDAP data file format example File Column 1 Column 2 Column3 Column 4 Column 5 1 Time Azi_P RPS_P Fx_P Fy_P 2 Time Fz_P Azi_S RPS_S Fx_S 3 Time Fy_S Fz_S Azi_S … LM-2011-01 14 Table 7: GEDAP channel example Parameter Channel Time 1 Azi_P 2 RPS_P 3 Fx_P 4 Fy_P 5 Fz_P 6 Azi_S 7 RPS_S 8 Fx_S 9 Fy_S 10 Fz_S 11 The channel assignment continues through the parameters list. The file format has been made to enable standardization of the configuration files across a variety of processors used to evaluate podded propulsor data. The minimum list of channels required for analysis of dynamic model test data are included in Table 8. LM-2011-01 15 Table 8: Config File parameters Parameter LM-2011-01 Description Time Time stamp associated with sample Azi_P Azimuth angle of port pod RPS_P Revolutions per second of port pod Fx_P Force in x axis on port pod Fy_P Force in y axis on port pod Fz_P Force in z axis on port pod Mx_P Moment about x axis on port pod My_P Moment about y axis on port pod Mz_P Moment about z axis on port pod T_P Thrust on port pod prop shaft Q_P Torque on port pod prop shaft Azi_S Azimuth angle of port pod RPS_S Revolutions per second of port pod Fx_S Force in x axis on starboard pod Fy_S Force in y axis on starboard pod Fz_S Force in z axis on starboard pod Mx_S Moment about x axis on starboard pod My_S Moment about y axis on starboard pod Mz_S Moment about z axis on starboard pod T_S Thrust on starboard pod prop shaft Q_S Torque on starboard pod prop shaft 16