1
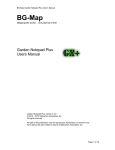
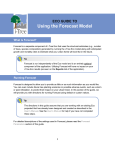
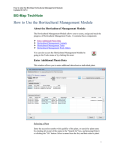
A Step-by-Step Guide
to Taking Urban Forest
Inventory Measurements
This publication provides a step-by-step
guide to conducting measurements for use
in an urban tree inventory. In general, this
guide reflects the measurements included in
the U.S. Forest Service’s i-Tree Eco software
program; however, the measurements are
fairly standard variables used in bottom-up
urban forest inventories.
Urban Tree Inventories, i-Tree,
and Equipment
What is a community tree inventory?
A community tree inventory performs three
primary functions:
1. As a database consisting of information
about individual trees. This information
includes tree location, diameter, height,
canopy width, condition, and hazards.
2. As a maintenance tool, the community
tree inventory enables managers to
identify trees that need to be pruned,
staked, fertilized, cabled, or removed.
Urban forest managers use the inventory to periodically review trees that
have been identified as hazards.
3. As a management tool, the inventory
enables aggregation of individual tree
data to provide information about a
population of trees—also known as the
urban forest. Tree population information includes species distribution
and canopy cover. A tree map enables
community forest managers to identify
and prioritize community canopy goals
(e.g., planting and maintenance), while
accounting for the condition of the community forest (i.e., dead, critical, poor,
fair, good, very good, or excellent).
Creating a visual map of how urban
forest benefits are distributed across the
landscape is known as benefit mapping.
A key aspect of benefit mapping is applying a dollar value to trees based on
their individual characteristics. Using
computer software, economic value
can be assigned to ecosystem service
benefits of urban trees such as pollution
removal (e.g., ozone, sulfur dioxide,
nitrogen dioxide), carbon sequestration,
and energy savings.
What is a bottom-up tree inventory?
A bottom-up inventory generates primary
data from on-the-ground inventory methods as opposed to aerial or satellite imagery
(i.e., top-down inventory). This approach
requires a process of measuring individual
tree characteristics and quality assurance/
control. Field data collection requires extensive planning, management, and time.
Although it can be somewhat costly, the
results can provide more information than
possible through top-down analyses. For
these reasons, it is beneficial to perform a
bottom-up inventory at some stage of the
community tree inventory.
What is the scope of the bottom-up
inventory (or how much is enough)?
The scope, also known as the sample, is
one the most important decisions made in
planning a bottom-up urban forest inventory. Determining the scope of the survey
depends on available resources and goals.
Inventory projects have ranged from parks to small
neighborhoods to cities to counties.
A statistical representation of the urban forest requires
a random sample, whereby plots are placed randomly
across the landscape within the boundaries of the
study area (e.g., the official city limits). A simple random sample is the most basic form of random sample.
A simple random sample, however, may not provide
a true picture of forest cover since the urban forest is
usually not distributed across the landscape randomly.
In a stratified random sample in Tupelo, MS (N=200). The
green areas represent trees. There are more points located in
tree areas than in the simple random sample.
and other public areas. This project scope measures
each tree in the designated area. A full inventory is
usually not a practical alternative for assessing the
urban forest. Because a full inventory is unlikely to
be implemented across the entire community, it does
not usually provide a true representation of the urban
forest.
What is i-Tree?
Simple random sample in Tupelo, MS (N=200). The green
areas represent trees.
Several urban forest inventory software packages are
available. Some are freeware (licensed to use free of
charge), while others can be fairly expensive. Inventory
software should have some basic data entry fields such
as Global Positioning Systems (GPS) coordinates and
tree species. Preferably, additional entry fields would
include tree height, diameter, crown width, crown
missing, dieback, and land use and ground cover attributes. Canopy measurements are needed to assess
canopy attributes.
A stratified random sample offers an alternative statistical representation with plots randomly allocated
according to land use. A stratified random sample
decreases the amount of plots wasted on sites with
little or no trees (e.g., large commercial parking lots
and agriculture fields). However, because such sites are
important characteristics of any populated place, some
plots will still be located there.
Research has found that 200 tenth-acre plots in a given
area provide enough information for statistical inference and benefit mapping while also maintaining an
acceptable level of costs associated with data collection
(Nowak et al. 2008). Fewer points may be appropriate
for a small area, but a greater number of points decreases error in the sample. A statistical sample mitigates the effects of data collection error and landscape
variation. The project facilitator will add 5–10 percent
more plots as “extra plots” in case some of the original
200 are inaccessible. Once the community determines
the scope, the project facilitator will locate the plots on
a map using Geographic Information System technology. Plot center geo-coordinates and the map will then
be distributed to volunteers.
One of the most commonly employed programs is the
USDA Forest Service’s i-Tree, available online at www.
itreetools.org. i-Tree is a software suite produced with
the collaboration of private and public partners. Currently, there are six applications: Eco, Streets, Hydro,
Vue, Design, and Canopy. Each application focuses on
specific objectives. For example, Eco provides a broad
spectrum of data fields that, when combined with air
pollution and meteorological data, quantifies community forest structure and environmental effects and
applies a monetary value to tree benefits. By contrast,
Hydro simulates the effects of changes in tree and
impervious cover characteristics on stream flow and
water quality.
The i-Tree software suite is peer-reviewed, public
domain, easy-to-use software that allows for scalable
Finally, a full inventory (also called a 100 percent
inventory) is often used to measure street trees, parks,
2
analysis. In other words, results can be generalized
from individual trees to neighborhood to city levels
based on a sample inventory. From this information,
users can make management recommendations such as
species selection, address invasive species, and perform storm damage assessment. The remainder of this
article focuses on the data entry variables found within
i-Tree Eco.
How is the data recorded?
Diameter tape
Example data sheets and respective “cheat sheets” for
the plot inventory (Appendices 1 and 2) and the full
inventory (Appendices 3 and 4) can be found in the appendix to this document. The advantage of paper data
input sheets is there is no risk of technological failure,
although they may get wet while in the field. However,
paper data sheets are somewhat cumbersome to use.
Due to the number of variables, the data sheet must
be printed on 8.5 by 11 inch paper. In addition, paper
requires an additional step—entering the data into an
electronic database—after measurements are taken.
To address these deficiencies in paper data sheets,
the MSU Extension Service will soon make available
a smartphone application that includes each variable
found in the paper data sheet. The app will be downloadable to iOS and Android platforms from the MSU
Extension Service app store.
Clinometer
Compass
GPS unit
PowerPoint presentations, literature, and additional
information on procedures.
In addition to groundcover, stem, and canopy measurements, we include at least a basic (yes/no) hazard
observation measure. If desired, a positive response
to this measure on the data sheet indicates the need to
complete the hazard identification sheet (Appendix 5).
Each of the measurements found on these data sheets
will be explained in the following sections.
Plot Information
The first measurements describe the plot where the
tree(s) is found (Appendix 1 and Appendix 2, page 1).
Plots are one-tenth of an acre, or 37.2 feet in radius.
Once plot center is found using a GPS unit, the data
collectors measure a radius of 37.2 feet from plot center
using a diameter tape. Every tree with at least half the
stem falling inside the radius is considered within the
plot and should be measured. The following is replicated from the Sample Plot Cheat Sheet (Appendix 1).
If a plot is located on private property, access must be
granted by the owner (Appendices 6 and 7).
What equipment is needed?
MSU Extension recommends four pieces of equipment
to conduct a basic volunteer inventory:
1. diameter tape
2. compass
PLOT ID: Enter plot ID. As mentioned above, plots are
randomly created within the border of a given area.
The plot ID is assigned
by the Geographic Information System (GIS)
software. The facilitator
describes the location
of the plot using roads
and other geographic
landmarks. A copy
of a large-scale photo
helps the volunteers get
3. clinometer
4. GPS unit
While additional equipment or more expensive equipment could be used, we find this equipment is appropriate for limited budgets and for use with volunteers
who borrow the equipment. If available, smartphone
apps may be used instead of the handheld compass
and GPS.
Procedures
Note: We suggest urban forest inventory facilitators
create an online public folder (e.g., Dropbox, Google
Drive) where volunteers can access maps, documents,
Recording data onto the data
sheet. Always use a pencil.
3
reasonably close to the plot. Then, GPS is used to get
within 30 feet of the plot center.
GPS UNIT: Enter GPS unit ID. Crew ID and GPS unit
ID are used to trace the data back to volunteer collectors as part of quality control. If using the smartphone
app, not applicable (NA) can be entered here.
PLOT WP: Enter GPS waypoint of plot (not trees) (Appendix 8). Typically, a handheld GPS unit is used (if
the MSU Extension urban inventory app is not used),
which incorporates error up to around 30 feet. The volunteer attempts to arrive
as close as possible to the
coordinates indicated by
the GPS. At this point, the
volunteer marks a “center
point” of the plot using
a landscaping flag, stick,
rock, or some other object.
The plot is then measured
using a radius of 37.2 feet
(37 feet and 13/32 inches),
or one-tenth of an acre.
Different-sized plots can
be used, but Nowak et al.
(2008) suggest one-tenth
acre is most effective for
PLOT ADDRESS: If the plot (or any portion) is located
on private property, enter the plot address, including
street number, street, and zip code.
PLOT PHONE: If the plot (or any portion) is located
on private property, enter the telephone number. The
telephone number will be available after the property
owner has consented to the procedure (Appendices 6
and 7). In some cases, special permission will need to
be granted to access public property. In such cases, the
same permission documentation should be used with
access granted by the supervising authority.
OWNER NAME: Record the name of the owner of
property (if public, note government entity).
NOTES: Record anything noteworthy here. Record
lack of access (e.g., property owner refusal or environmental conditions).
ACTUAL LAND USE AND PERCENT IN: The letter
from the list below is recorded along with percent of
each land use that falls within the plot. Proportions
are recorded in increments of 1–5 percent, then every 5
percentage points. As with other qualitative estimates
in the inventory, land use should be discussed and
agreed upon by team members. Up to four land uses
can be recorded. Below are the land uses recognized by
i-Tree.
Making a waypoint using GPS.
i-Tree statistics. Trees are considered within the plot if
at least half the stem at 4½ feet (known as diameter at
breast height or DBH) lies within the radius measure.
Residential (R)
Multi-family residential (M)
Commercial/Industrial (C)
Park (P)
Cemetery (E)
Golf Course (G)
Agriculture (A)
Vacant (V)
Institutional (I)
Utility (U)
Water/wetland (W)
Transportation (T)
Other (O)
PLOT TREE COVER: Record the estimated percent of
tree canopy over the plot. This is another qualitative
estimate that should be discussed among team members.
This one-tenth-acre plot has three trees. Tree number four is
more than halfway out of the plot, while tree number 1 has
more than half the stem inside the plot boundary.
SHRUB COVER: Record the estimated percent of
shrub cover in the plot. The facilitator will inform the
volunteers what is classified as shrub cover.
DATE: Enter date of work.
CREW: Enter crew ID. A unique crew ID is assigned by
the facilitator.
4
Maintained grass (MG)
Unmaintained grass (UG)
Water (W)
This plot has approximately 4% T, 1% W, 95% R.
This plot has approximately 40% tree cover, 0% shrub cover,
2% T, 1% C, 1% W, 1% B, 95% MG.
The number of trees on a plot can range from none to many.
GROUND COVER: Record the percent ground cover
in plot, which must total 100 percent. The crew notes
the percentage of the plot ground area that is covered
by the materials below. Estimation may be facilitated
by dividing the plot in halves or quarters, then summing the proportions of each section.
Ground covers in this plot include tar, maintained
grass, and some mulch around the tree. The land use is
institutional.
The following metrics are for individual trees within
the plot (Appendix 1 and Appendix 2, page 2). Data
collection for living and dead trees starts with the tree
closest to due north and proceeds in a clockwise direction.
Building (B)
Concrete (C)
Tar (T): Blacktop/asphalt
Rock (R): Pervious rock surfaces such as gravel, brick,
or flagstone walkways or patios (without mortar).
This category includes sand in playgrounds or added
as topping to existing soil. Large solid rock outcrops
should be listed as concrete.
PLOT ID: Enter the plot ID from page 1 (Plot Information) so that the individual tree information can be
linked to the correct plot.
PLOT WP: Enter the GPS waypoint for the plot from
page 1.
Bare soil (S)
TREE ID: Record the tree species (U if unknown, and
take a photo and send to the facilitator) using the
UFORE abbreviations (www.itreetools.org/eco/resources/ufore_species_list_apr30_2012.pdf). The MSU
Duff/mulch (D)
Herbs (H): Herbaceous ground cover, other than grass,
including agricultural crops
5
Extension Service currently
offers a smartphone application called Tree Census with
the list of species. A relevant
tree must be greater than or
equal to 1 inch at 4½ feet.
Dripline
The following land uses are used in the i-Tree software.
Using the tree code app to record
the tree ID UFORE abbreviation.
Residential (R)
Multi-family residential (M)
STATUS: The crew should discuss and come to consensus about whether the tree was:
Commercial/Industrial (C)
P: Planted—the tree was planted intentionally (often
characterized by orderly patterns, e.g., rows, and landscaping);
Cemetery (E)
Park (P)
Golf Course (G)
Agriculture (A)
I: Ingrowth—the tree self-seeded;
Vacant (V)
U: Unknown—planted vs. ingrowth cannot be determined.
Institutional (I)
Utility (U)
Record dead trees as -1 and skip to the site variable.
Water/wetland (W)
DR: Record the direction of the tree from
the center of plot using
azimuth in degrees. DR
and DS are used as geographic references in addition to the plot center
waypoint. Geographic
references are important
for future inventory
updates.
Transportation (T)
Other (O)
DBH: Record the tree’s DBH (a relevant tree must be
greater than or equal to 1 inch at 4½ feet) on the uphill
side of the tree to the nearest 0.1 inch/cm. Record up
to six stems (≥1 inch) if the pith union is belowground.
If more than six stems, lower the measurement height
to 1 foot aboveground and record the DBH of the six
largest stems. See Appendix 9 for DBH measuring
procedures.
A smartphone app makes
recording direction easy.
pith
intersection
DS: Record the distance of the tree from plot center to
the edge of the trunk.
LAND USE: The previous land use metric indicated
land use within the entire plot; this metric records land
use under individual tree canopies in the plot. Record
the land use to drip line of the tree crown. The drip line
is the very edge of the crown. Most of the time, this
will be the same as the land use recorded for the plot.
Measuring DBH in multistemmed trees.
6
Height to crown base: Measure the tree height to the
base (the lowest live foliage) of the crown. If the base is
not reachable using the diameter tape, the clinometer
must be used and measured using the same procedure
as measuring total height.
TREE HEIGHT: i-Tree requires three height measurements (Appendix 10).
Total tree height: Measure
the height of the tree to the
highest visible branch (alive
or dead).
Height to live top: Measure
the height to the highest visible live branch. This height
will be the same as total
tree height unless the tree
is alive but the top of the
crown is dead.
Using the diameter tape to measure
DBH. Follow the correct procedure
to hold the tape (Appendix 9).
Measuring height to crown base using a diameter tape.
CROWN
Crown width: Measure the width of each tree’s crown
(to the nearest foot). Two volunteers are needed to
measure the crown width. Making sure the diameter
tape touches the tree stem to approximate the diameter
of a circle encompassing the crown, hold each end of
the tape to the drip line and record the measurement.
This procedure should be repeated in two perpendicular directions: north–south and east–west.
Measuring tree
height using a
clinometer. Follow the correct
procedure to hold
the clinometer
(Appendix 10).
Extent of live top
Measuring crown width east and west.
If the tree does not have any dead branches at
the top, the height to live top is the same as total
height. In the case of this tree, height to live top
is shorter than total height.
7
25%
crown
dieback
This tree has approximately 25% crown dieback.
Crown light exposure (CLE): Record the number of
sides of the tree receiving sunlight. The maximum is
five (four sides and top). As a rule of thumb, include
each side that receives at least 50 percent sunlight.
Measuring crown width north
and south.
Percent canopy missing: This metric estimates the
percent of branches and foliage that is absent due to
pruning, defoliation, uneven crown (i.e., irregular due
to damage or some other negative abiotic or biotic
impact), or dwarf or sparse leaves.
10%
missing
crown
25%
missing
crown
Imagine a box covering the crown to measure CLE. A
tree can have up to five sides exposed to sunlight.
Impervious Surface: Estimate the percent of the
area beneath the dripline of the tree that is impervious
to water. Often, this will reflect the single tree metric
for land use (above). An impervious surface is one that
does not allow water to penetrate into the soil. Greater
areas of imperious surface result in increased runoff.
This tree has approximately 35% of its crown missing.
Crown dieback (DB): Record percent branch dieback
on each side and top of crown area. Dieback is a condition in which a tree or shrub begins to die from the tip
of its leaves or shoots backward, resulting from disease
or an unfavorable environment.
TREES NEAR BLDGS: Identify trees (≥20 feet tall) that
are located within 60 feet of space-conditioned residential or commercial buildings that are three stories or
fewer in height (e.g., two stories and an attic). Record
the direction (D = azimuth in degrees) from the tree to
the closest part of the building and the distance (S = if
>60 ft., just note >60 ft.). These metrics are needed for
calculating energy savings.
SITE: Indicate whether the tree is a street tree (yes =
Y) or not a street tree (no = N). A street tree is any tree
or part of tree, including the canopy and root systems,
that lies on or has grown onto or over public property,
or in public right of way owned by a public entity.
8
Additional Reading
David J. Nowak, Jeffrey T. Walton, Jack C. Stevens,
Daniel E. Crane, and Robert E. Hoehn (2008) Effect
of Plot and Sample Size on Timing and Precision of
Urban Forest Assessments. Arboriculture & Urban
Forestry, 34(6):386–390.
David J. Nowak, Daniel E. Crane, Jack C. Stevens, Robert E. Hoehn, Jeffrey T. Walton, Jerry Bond (2008) A
Ground-Based Method of Assessing Urban Forest
Structure and Ecosystem Services. Arboriculture
and Urban Forestry, 34(6):347–358.
Jason Gordon. Community Forestry: Another Way of
Thinking about Forest Management, IS1958. MSU
Extension Service.
Measuring distance to the closest building using a diameter tape.
Jason Gordon. Conducting a Community Tree Inventory, P2811. MSU Extension Service.
HAZARD: Mark yes or no to indicate whether the
overall tree, foliage, branches/bole show indications of
pest, disease, or if tree/branches could be a hazard. A
hazard is any tree/part of tree that may cause harm to
people or property (e.g., car). It is important to understand that only a certified arborist should conduct a
complete tree risk assessment due to liability concerns.
However, because they are observing many trees, volunteers are invaluable for identifying obvious, major
problems. If a tree is a hazard, complete the additional
hazard identification form (Appendix 5). If a hazard is
indicated, arborists will return to the tree to assess it.
US Forest Service. (n.d.) i-Tree Streets User’s Manual
v5.x.. Retrieved January 19, 2015, from www.itreetools.org/eco
UFORE Methods (n.d.) Retrieved January 19, 2015,
from http://www.itreetools.org/eco/resources/
UFORE%20Methods.pdf
9
Appendix 1. Image of data sheet (page 1, Plot Data) to be used for sample plots inventory.
10
Appendix 1 (continued). Image of data sheet (page 2, Tree Data) to be used for sample plots inventory.
11
Appendix 2: Cheat sheet to be used for sample plots inventory data sheet
PAGE 1 (Plot data)
PLOT ID: Enter plot ID
PLOT WP: Enter GPS waypoint of plot (not trees)
DATE: Enter date of work
CREW: Enter crew ID
GPS UNIT: Enter GPS Unit ID
PLOT ADDRESS: Self explanatory
PLOT PHONE: Self explanatory
OWNER NAME: Owner of property (if public, note government entity)
NOTES: Record anything noteworthy here. Record lack of access (e.g., property owner refusal, poor environmental conditions)
ACTUAL LAND USE AND PERCENT IN: Record land use and percent in plot.
Residential (R)
Golf Course (G)
Water/wetland (W)
Multi-family residential (M)
Agriculture (A)
Transportation (T)
Commercial/Industrial (C)
Vacant (V)
Other (O)
Park (P)
Institutional (I)
Cemetery (E)
Utility (U)
PLOT TREE COVER: Record percent tree cover in plot.
SHRUB COVER: Record percent shrub cover in plot.
GROUND COVER: Record percent ground cover in plot. Must add to 100%.The crew notes the percentage of the
plot ground area that is covered by the following materials:
Building (B)
Bare soil (S)
Concrete (C)
Duff/mulch (D)
Tar (T): Blacktop/asphalt
Herbs (H): Herbaceous ground cover, other than grass,
including agricultural crops
Rock (R): Pervious rock surfaces such as gravel, brick,
or flagstone walkways or patios (without mortar).
This category includes sand in playgrounds or
added as topping to existing soil. Large solid rock
outcrops should be listed as concrete.
Maintained grass (MG)
Unmaintained grass (UG)
Water (W)
12
PAGE 2 (Tree data)
Data collection for living and dead trees starts with the tree farthest to the north and proceeds in a clockwise
direction.
PLOT ID: Enter plot ID from page 1
PLOT WP: Enter GPS waypoint for plot from page 1
TREE ID: abbreviated tree species (U if unknown, and take photo and send to coach)
STATUS: P: Planted—the tree was planted intentionally; I: Ingrowth—the tree self-seeded; U: Unknown—planted
vs. ingrowth cannot be determined. Record dead trees as -1 and skip to Site.
DR: Direction of tree from center of plot (azimuth in degrees)
DS: Distance of tree from plot center to edge of trunk
LAND USE: Record land use to drip line
Residential (R)
Golf Course (G)
Water/wetland (W)
Multi-family residential (M)
Agriculture (A)
Transportation (T)
Commercial/Industrial (C)
Vacant (V)
Other (O)
Park (P)
Institutional (I)
Cemetery (E)
Utility (U)
DBH: Record the tree’s DBH (≥ 1 inch at 4.5 feet) on the uphill side of the tree to the nearest 0.1 inch. Record up
to 6 stems (≥1 in) if the pith union is below ground. If more than 6 stems, lower measurement height to 1 ft above
ground and record DBH of up to the 6 largest stems.
TREE HEIGHT: Total tree height: Measure the height to top (alive or dead) of tree. Height to live top: This height
will be the same as total tree height unless the tree is alive but the top of the crown is dead. Height to crown base:
Measure height to base of live crown.
CROWN
Crown width: Measure crown width (to nearest foot) in two perpendicular directions: north-south and east-west.
Percent canopy missing: Estimate the percent foliage that is absent due to pruning, defoliation, uneven crown, or
dwarf or sparse leaves.
Crown dieback (DB): Percent branch dieback on side(s) and top of crown area.
Crown light exposure (CLE): Number of sides of the tree receiving sunlight from above (maximum of five).
Percent impervious surface under the tree: Estimate the percent of the area beneath the dripline of the tree that is
impervious.
TREES NEAR BLDGS
For trees (≥20 ft. tall) that are located within 60 ft. of space-conditioned residential buildings that are three stories
or fewer in height (two stories and an attic), record the direction (D = azimuth in degrees) from the tree to the
closest part of the building and the distance (S = if >60 ft, just note >60 ft).
SITE
Indicate street tree YES (Y) or NO (N) if tree is located on edge of street.
HAZARD
Mark YES (Y) or NO (N) if overall tree, foliage, branches/bole show indications of pest, disease, or if tree/branches could be a hazard. A hazard is any tree/part of tree that may cause harm to people or property (e.g., car). We
are looking for obvious, major problems here. If tree is a hazard, complete additional hazard identification form.
If a hazard is indicated, arborists will return to the tree to assess it.
13
Appendix 3. Image of data sheet to be used for 100 percent inventory.
Appendix 4: Cheat sheet to be used with 100 percent inventory data sheet
100 Percent Inventory Cheat Sheet
DATE: Enter date of work
CREW: Enter crew ID
GPS UNIT: Enter GPS Unit ID
LOCATION: Enter location – “Miller Park”
LAND USE: Record the predominant (>50%) land use in which the trees are located
Residential (R)
Golf Course (G)
Water/wetland (W)
Multi-family residential (M)
Agriculture (A)
Transportation (T)
Commercial/Industrial (C)
Vacant (V)
Other (O)
Park (P)
Institutional (I)
Cemetery (E)
Utility (U)
WP: Enter GPS waypoint
TREE ID: abbreviated tree species (U if unknown and take photo)
STATUS: P: Planted—the tree was planted intentionally
I: Ingrowth—the tree self-seeded
U: Unknown—planted vs. ingrowth cannot be determined
-1: Dead trees
GROUND COVER: Must add to 100%. The crew notes the percentage of the plot ground area that is covered by
the following materials (up to 4):
Herbs (H)
Concrete (C)
Rock (R): Pervious rock surfaces
such as gravel
Tar (T): Blacktop/asphalt
Bare soil (S)
Unmaintained grass (UG)
Duff/mulch (D)
Water (W)
Building (B)
Grass (MG)
DBH: Record the tree’s DBH (≥ 1 in at 4.5 ft) on the uphill side of the tree to the nearest 0.1 inch/cm.
Record up to 6 stems (≥1 in) if the pith union is below ground. If more than 6 stems, lower measurement height to
1 ft above ground and record DBH of up to the 6 largest stems.
TREE HEIGHT: Total tree height: Measure the height to top (alive or dead) of tree. Height to live top: This height
will be the same as total tree height unless the tree is alive but the top of the crown is dead. Height to crown base:
Measure height to base of live crown.
CROWN
Crown width: Measure crown width (to nearest ft or m) in two perpendicular directions: north-south and eastwest.
Percent canopy missing: Estimate the percent foliage that is absent due to pruning, dieback, defoliation, uneven
crown, or dwarf or sparse leaves. Do not include normal interior crown voids due to leaf shading.
Crown dieback (DB): Percent branch dieback on side(s) and top of crown area.
Crown light exposure (CLE): Number of sides of the tree receiving sunlight from above (maximum of five).
Percent impervious surface under the tree: Estimate the percent of the area beneath the dripline of the tree that is
impervious.
continued
15
TREES NEAR BLDGS
Trees near buildings: Enter the direction (D) and distance (S) to the three closest buildings (if >60 ft, note >60 ft).
SITE
Indicate street tree YES (Y) or NO (N) if tree is located on edge of street.
HAZARD
Mark YES (Y) or NO (N) if overall tree, foliage, branches/bole show indications of pest, disease, or if tree/branches could be a hazard. A hazard is any tree/part of tree that may cause harm to people or property (e.g., car). If tree
is a hazard, complete additional hazard identification form.
16
Appendix 5. Tree hazard data sheet for volunteer-based urban forest inventories.
(Explanation is provided during tree hazard training.)
17
Appendix 6. Property access request form.
Dear Homeowner:
Local volunteers representing [sponsor] will be conducting an urban tree inventory throughout 2014 and 2015.
This project will utilize the i-Tree Eco - Urban Forest Effects (UFORE) Model developed by the US Forest Service
to quantify the composition (tree type, size, health, etc.) and environmental benefits of [city]’s trees. Statewide, urban trees are worth billions of dollars and annually provide millions of dollars’ worth of environmental benefits.
In addition, the volunteers will assess the health condition of the trees so that the City can prioritize pruning and
removals. Altogether, this information is needed to develop a comprehensive urban forest management plan for
[city].
Approximately 200 randomly distributed 1/10 acre sample plots have been identified throughout the City. One
of these plots (or a portion thereof) is located on your property. We are requesting permission to access your
yard to collect information on trees within the sample plot including tree type, size, crown coverage and density,
and overall health. There are no immediate benefits to you; however, if one or more of your trees is determined
to be in poor condition, a certified arborist will contact you to offer a professional opinion.
Measurements will not harm the trees in any way and only trees within the plot will be measured. The volunteers conducting the activity assume full responsibility for any risks of loss or injury to person or property that
may be sustained and waive any and all liability, claims, demands, actions and causes of action, whatsoever
arising out of or related to any loss, damage, or injury while conducting the inventory on your property. If you
agree, please sign the enclosed form indicating your permission or denial for the urban inventory personnel
to enter your property for this specific purpose. Please contact Project Coordinator, Jason Gordon, at (662) 3258851 with any questions or concerns you may have. You can keep this letter for your records.
Thank you very much for your consideration. Don’t miss this opportunity to have your trees represent city]!
Sincerely,
[City] Urban Tree Inventory Team
18
Appendix 7. Property access consent form.
Urban Tree Study
We need your help in gathering data on your city’s trees. Please help by completing the information below and
returning this form to the volunteer. Please contact project coordinator Jason Gordon at (662) 325-8851 with any
questions or concerns you may have.
DATE
NAME
ADDRESS
ZIP CODE
TELEPHONE
Check
Yes, I authorize the urban tree inventory volunteers to access my property today for the purpose of collecting inventory data from trees on or adjoining my property.
No, I do not want my trees included in this important study.
19
Appendix 8: Using GPS for Urban Forest Inventories
The following information is about using GPS during urban forest inventories. Specifically, we focus on marking
waypoints (i.e., geo-coordinates) to record the locations of sample plots and trees. This information was written
using the Garmin eTrex 10 as a model, although most current handheld GPS units are similar.
Main menu
The Power On button is usually on the side of the device. Sometimes it is
labeled light. Press the light button to change screen visibility. Press Back to
return to a previous screen. From the main menu screen, toggle to the satellite
icon and press Enter (Enter is pressing straight down on the toggle button. The
GPS unit must be receiving from at least three satellites.
Marking Current Waypoint
From the menu screen, select Mark Waypoint. Once in the waypoint screen, the
GPS uses a default name for the waypoint. Note the GPS coordinates in the
location window. Toggle to Done and Enter to save waypoint.
Managing Waypoints
Use Waypoint Manager to view waypoints. These points may have been generated by the unit itself or uploaded to the device from an external computer. From
the menu screen, toggle to Waypoint Manager. By default, the most recently created
waypoint is at the top. Note the time and date created. Marker, name, coordinates,
and notes can be modified by toggling to the respective window to highlight,
pressing enter to initiate the keyboard, and toggling to letters and numbers on the
keyboard. After selecting a letter/number, press enter. Because this is a laborious
process, we suggest editing in the office instead of the field whenever possible.
A waypoint can be deleted by selecting the waypoint, pressing Menu, selecting
Delete, and then selecting Yes. To delete all waypoints, in Waypoint Manager, select
Menu, then select Delete all.
20
Setup Compass Heading
Make sure compass is on heading, not bearing. To change to heading, from the
main menu screen, select Compass, press menu, select Setup Heading. A new window appears. In the Go to Line window, select Course. Press Enter.
Navigating to a waypoint
From the menu screen, toggle to Where To and Enter. Select Waypoints. Select specific waypoint. Note distance from current location and direction. Select Go.
Start with an aerial image (e.g., Google Maps) of the general area. Navigate
to within a reasonable walking distance of the known location of the destination. At this point, use the GPS device to walk within 30 feet of the destination.
Modern handheld units can usually navigate to within 30 feet because error in
the GPS system limits accuracy. More advanced, higher-priced devices, such as
those used by civil engineers, have less error.
Using the compass to navigate
To use the compass, first return to the main menu screen. Select compass, then
follow the compass noting the GPS heading, course line (indicates the direction
you are currently heading), course pointer (indicates direction you should head),
and distance to destination.
21
Appendix 9: Measuring Tree Diameter for Urban Tree Inventories
Measuring the diameter (DBH) of a tree is easy when you have a diameter tape. A few points are important to
keep in mind. First, a diameter tape (D-tape) is a breakable instrument. If you are not careful, the spring within
the housing can break, resulting in the tape’s inability to recoil and becoming a tangled web of metal. Second,
the metal strip can be sharp, so be careful when handling the tape. Third, MSU Extension recommends a 100-foot
diameter tape with distance in tenths of inches. One side of the tape can measure distance, while the other side of
the tape is calibrated to pi in order to measure diameter.
Diameter tape: Inches side of measurement.
Diameter tape: Diameter side of measurement.
Measure diameter at about 4½ feet above the
base of the tree.
Cross hands as in the photo so that the zero at the
end of the tape lines up with the diameter metric.
Hold the end of the D-tape with the left hand
while holding the casing with the right hand.
Stand upslope from the base of the tree.
Procedure
Standing up-slope from the base of the tree, use your right hand to hold the casing and your left hand to hold the
end of the tape. Wrap the tape around the tree, remembering to measure at 4½ feet above where the tree meets
the ground and keeping the tape level. Avoid wrapping the tape around vines or deformities. If the tree has a
deformity (such as a burl) at breast height, measure the diameter just above the deformity. Line up the end of the
tape (zero) with the corresponding metric on the diameter side of the tape. The matching metric is the tree’s DBH.
Depending on the measurement’s objective, you may want to record to the nearest tenth or nearest inch.
22
Appendix 10: Measuring Tree Heights for Urban Forest Inventories
Note: These instructions are for SUUNTO clinometers with a topographical scale (feet).
A clinometer is an instrument that measures slope.
The concept of the clinometer is rooted in the trigonometry of a right triangle. The volunteer measures slope (the
hypotenuse, or rise over run) twice. First, measure to the top of the tree. If you stop here, you have only measured
the tree starting at the height of your eye. So you must then measure to the base of the tree (where the tree meets
the ground), creating two right triangles. Add these two measurements together to get height.
Step 1: Use the diameter tape and measure 66 feet from the base of the tree. Be sure to walk up-slope and have a
clear line-of-sight to the top of the tree (if you are down-slope from the tree, a different calculation must be used).
Step 2: Standing 66 feet from the tree, use the clinometer to measure to the topmost green leaf that you can see.
The dot on the clinometer should be on the top side, facing the tree. The brass loop should be on the bottom, facing the user. Keep both eyes open when looking into the peephole. This produces an optical effect that transposes
the cross hair onto the tree you are measuring. If you tilt the clinometer up and down, you will notice the scales
have positive and negative numbers. The scale to the right is the topographical scale in feet. Note the negative
scale (–) appears when you tilt the clinometer down) and the positive scale (+) appears when you tilt the clinometer up. You must always be aware of whether the number is positive or negative.
Dot is barely visible
in this photo.
Tilt the clinometer to
the top of the tree and
measure.
Source: SUUNTO
23
Step 3: Remaining 66 feet from the tree, measure the
base of the tree. This measurement represents the
lower triangle in the graphic above. Add the two measurements, in feet, together. The sum is the total height.
For example, you get 30 feet to the top, and negative 5
feet to the bottom. The total height of the tree is 35 feet.
This YouTube video might be helpful:
https://www.youtube.com/watch?v=5H8s2zNRRv8
Tilt the clinometer to the base of the tree and measure. Add the
two metrics to complete the height measurement.
The information given here is for educational purposes only. References to commercial products, trade
names, or suppliers are made with the understanding that no endorsement is implied and that no discrimination against other products or suppliers is intended.
Copyright 2015 by Mississippi State University. All rights reserved. This publication may be copied and distributed
without alteration for nonprofit educational purposes provided that credit is given to the Mississippi State University Extension Service.
By Jason Gordon, Assistant Extension Professor, Forestry, and Brian Templeton, Extension Associate III,
Landscape Architecture.
We are an equal opportunity employer, and all qualified applicants will receive consideration for employment without regard to race, color, religion, sex, national origin, disability status, protected veteran
status, or any other characteristic protected by law.
Publication 2882
Extension Service of Mississippi State University, cooperating with U.S. Department of Agriculture. Published in furtherance of Acts of Congress, May 8 and June 30, 1914. GARY B. JACKSON, Director
(POD-04-15)