1
OR
HEO/F76/ lal Publication 21
x
AODOOU58OS2
April 1991
2
.4Sp3
:21
c.3
STATE
Planning with PSME: A Growth Model for
Young Douglas-fir and Hardwood Stands in
Southwestern Oregon
Timothy B. Harrington
John C. Tappeiner II
Thomas F. Hughes
Arlene S. Hester
1ORHA,&:2lc.3
-
th PSME
College of Forestry
FOPEIT REIEAPCH LAB
Oregon State University
The Forest Research Laboratory of Oregon State University was established by the
Oregon Legislature to conduct research leading to expanded forest yields, increased use of forest products, and accelerated economic development of the State.
Its scientists conduct this research in laboratories and forests administered by the
University and cooperating agencies and industries throughout Oregon. Research
results are made available to potential users through the University's educational
programs and through Laboratory publications such as this, which are directed as
appropriate to forest landowners and managers, manufacturers and users of forest
products, leaders of government and industry, the scientific community, and the
general public.
The Authors
Timothy B. Harrington is research associate, Department of Forest Science, College
of Forestry, Oregon State University, Corvallis. John C. Tappeiner Ills professor and
Arlene S. Hester is research assistant, Department of Forest Resources, College of
Forestry, Oregon State University. Thomas F. Hughes, now research analyst, Office
of Community College Services, Oregon State Board of Education, Salem, was
research assistant, Department of Forest Science, Oregon State University at the
time this work was completed.
Legal Notice
This document and associated software were prepared as part of a project under the
auspices of Oregon State University. Neither Oregon State University nor any person
acting on behalf of such: a) makes any warranty or representation, express or
implied, with respect to the accuracy, completeness, or usefulness of any information,
product, or process disclosed; b) claims that the use of any information or method
disclosed in this report does not infringe privately owned rights; or c) assumes any
liabilities with respect to the use of, or for damages resulting from the use of, any
information, apparatus, or method disclosed in this report.
Disclaimer
The mention of trade names or commercial products in this publication does
not constitute endorsement or recommendation for use.
Acknowledgment
Financial support for this research was provided by the U.S.D.l. Bureau of Land
Management and U.S.D.A. Forest Service under the auspices of the Southwest
Oregon Forestry Intensified Research (FIR) program (Grant no. PNW-85-422). The
authors appreciate the field assistance of Mr. R.J. Pabst.
To Order Copies
Copies of this and other Forest Research Laboratory publications are available from:
Forestry Publications Office
Oregon State University
Forest Research Laboratory 225
Corvallis, Oregon 97331 -5708
Please indicate author(s), title, and publication number if known.
Planning with PSME: A Growth Model for Young
Douglas-fir and Hardwood Stands in
Southwestern Oregon
Timothy B. Harrington
John C. Tappeiner II
Thomas F. Hughes
Arlene S. Hester
OR HEO/F76/2 .4Sp3 :21 c.3
Planning with PSME
Contents
Introduction
Model Behavior and Guidelines
1
Prediction of Development of Young Stands
3
Description of Growth Equations
3
Hardwood Parameters
4
Herb + Shrub Parameters
4
Douglas-fir Parameters
5 Data Collection
7
5
Pre-Harvest Data
6
Post-Harvest Data
Software Installation
7 Hard Disk
7 Floppy Disk
8 Input Data
8 Hardwood Data
9
Douglas-fir and Herb + Shrub Data
10 Modification: Site Qualities
10 Modification: Hardwood Constants
11
Output Data
11
Stand Growth Predictions
11
Douglas-fir Size Distributions
11
Plots of Stand Development
12 Summary Files
14
Literature Cited
Introduction
In southwestern Oregon, growth of Douglas-fir
[Pseudotsuga menziesii (Mirb.) Franco var. menziesii]
has been shown to be inversely related to the level of
tion (herbs and shrubs). PSME is based on data from
three studies in the Forestry Intensified Research (FIR)
associated hardwood cover (Hughes et al. 1 990,
age in 2-, 3-, or 4-year-old Douglas-fir plantations was
reduced to different levels with herbicides, and subsequent growth responses of the stands from 1983 to
1 989 were monitored (Hughes et al. 1 990,
Harrington et aL, in press). The competitive effects of
Harrington et al., in press). Because the stocking and
size of tanoak [Lithocarpus densiflorus (Hook. and Am.)
Rehd.] or Pacific madrone (Arbutus menziesii Pursh) in
a pre-harvest stand determine their post-harvest rates
of cover development, future levels of hardwood
program in which tanoak or madrone crown cover-
chinkapin cover on Douglas-fir growth were not
competition can be estimated for planted Douglas-fir
(Tappeiner et al. 1 984). Such information may be
used to set priorities and schedules for vegetation
management of Douglas-fir plantations.
evaluated, but because chinkapin is similar to tanoak
in canopy structure and growth form, it is assumed
here to have the same rate of cover growth and same
competitive effect on Douglas-fir growth.
Computerized growth models have proved to
be powerful and flexible tools for forecasting the de-
PSME requires values for either pre-harvest
basal area and stem density or post-harvest (i.e.,
sprout-origin) cover of the dominant hardwood spe-
velopment of young forest stands under different
types of competition. In the Pacific Northwest, simulators of individual-tree growth of young conifers are
being developed (Powers et aL 1989, Opalach et aL
1 990) with the objective of providing stand-table information for input into older stand models such as
DFSIM and ORGANON.
The computer model presented here was developed to provide a simple technique for predicting
and comparing general stand characteristics of plantation-grown Douglas-fir under various levels of hardwood competition. Plantation Simulator-Mixed Evergreen (PSME), Version 1.0, provides estimates of 10year development of stands composed of Douglas-fir
seedlings growing with a hardwood species (tanoak,
Pacific madrone, or chinkapin [Castanopsis
chrysophylla (Dougl.) A. DC.] and understory vegeta-
cies associated with planted Douglas-fir. The model
also requires values for total herb and shrub cover and
for the average height, stem diameter, crown width,
and density of Douglas-fir seedlings. The output is an
estimation of average stand parameters for ages 3 to
10 years and of Douglas-fir height and stem diameter
distributions at 1 0 years, along with graphic displays
of height, cover, and Douglas-fir diameter plotted
against stand age. The model automatically writes parameter predictions to two files: 1) a text file that
provides a visual record of model simulations, and 2)
a computer-readable ASCII file that facilitates using
the model predictions as input for other Douglas-fir
growth simulators.
The BASIC computer code is not included in
this user manual, but model users have access to the
code from the computer disk that is included.
Model Behavior and Guidelines
Appropriate use of PSME to predict development of young stands requires an understanding of
the principles upon which the model is based. This
section discusses basic aspects of the model behavior
and provides general guidelines.
Prediction of Development of
Young Stands
Because current-year growth of Douglas-fir is
inversely related to the amount of hardwood cover in
the previous year (see the section "Douglas-fir Param-
eters," p. 4), the rate at which hardwood cover develops is a principal factor affecting the Douglas-fir
growth trajectory. We recommend that three or more
simulations of PSME be run for each Douglas-fir plantation that is being considered for a vegetation-management treatment. For example, current values for
initial hardwood parameters (i.e., pre-harvest or postharvest variables) could be varied by 0, 50, and 1 00
percent so that differences in the predicted 1 0-year
sizes and size distributions of Douglas-fir can be evaluated. In each series of simulations, the potential for
hardwood recovery should be varied according to the
amount expected 1 year after a given treatment.
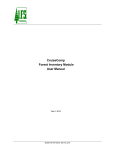
In PSME simulations, high pre-harvest values
for hardwood stem density produce larger values for
3rd-year hardwood cover than do high values for
basal area (Figure 1), although maximum values for
3rd-year hardwood cover occur when both stem density and basal area are high. From a given level of 3rd-
year hardwood cover, PSME predicts that tanoak (or
chinkapin) has more rapid cover development than
madrone (Figure 2), which may explain its greater
competitive effect on Douglas-fir growth (Harrington
Post-harvest height development of hardwood
sprout clumps is directly related to the size of the
parent tree before harvest (Tappeiner et al. 1 984).
However, PSME simulations show that varying the
pre-harvest hardwood basal area (50 or 1 00 ft2/acre)
and stem density (500 or 1,000 stems/acre) results in
only minor differences in average height 1 0 years after harvest (Figure 3). The average height of madrone
is almost 40 percent greater than that predicted for
tanoak or chinkapin.
et al., in press).
25
60
BA (ft2/acre)
BA (ft/acre)
5O1
oo
cc
401
50 100
STEM
DENSITY
500
fl
50 100
I
20
iii
15
-
STEM
DENSITY
500
0
(noJacre) 1000
(no.!'icre) 1000
I
I
30-I
__
I
w
I
20-I
cr1
ii7ilflH
101
TANOAK
MADRONE
CHINKAPIN
F:rfl[flrfl
TANOAK
MADRONE
CHINKAPIN
SPECIES
SPECIES
Figure 1. Cover of 3-year-old stands of tanoak, madrone,
and chinkapin predicted with pre-harvest basal area (BA)
at 50 and 100 ft2 per acre and with stem density at 500
and 1,000 stems per acre.
Figure 3. Height of 10-year-old stands of tanoak, mad-
rone, and chinkapin predicted with pre-haivest basal
area (BA) at SO and 100 ft2 per acre and with stem density at 500 and 1,000 stems per acre.
In PSME, the predicted average growth of
100
TANOAK
MADRONE
80
growth trajectories for stands having different average
sizes will diverge with time.
60
PSME predicts that hardwood cover limits herb
and shrub cover such that they reach maximum de-
cc
w
0
velopment in the model when hardwood cover is
cc
>-
zero. Large increases in Douglas-fir growth are pre-
40-
±
I-
20
In
103050
103050
3RD-YEAR COVER (%)
Figure 2. Cover of 10-year-old stands of tanoak and
madrone predicted with 10-percent, 30-percent, and SOpercent cover in the 3rd year.
2
Douglas-fir in the current year is proportional to the
average size in the previous year; thus the predicted
dicted after the removal of hardwoods, especially
when herbs and shrubs are suppressed. If hardwoods
are not removed, suppression of herbs and shrubs
does not affect the prediction of Douglas-fir growth.
The following are general guidelines to be considered when making estimations of young stand development with PSME:
For rough estimates of the effect of manual cutting of hardwoods or of other treatments on the
growth of associated Douglas-fir, a stand should
be inventoried one growing season after treat-
Hardwood parameters
ment (see the section "Data Collection," p. 5 ).
Effective site preparation and planting of large
Douglas-fir stock can produce larger seedlings at
later stand-age (lverson and Newton 1980,
Howard and Newton 1984) and should be considered when planning with PSME because the
average size of the seedlings strongly influences
their growth trajectory.
Pre-harvest stands with high hardwood stem density or high stem density and basal area will have
rapid development of cover after harvest that will
be highly competitive with associated Douglas-fir
When pre-harvest basal area and stem-density
are entered in PSME, plantation age is initialized at 3
years, and 3rd-year cover is estimated with the following equations.
The mean basal area per single- or multistemmed hardwood tree is calculated as:
AVGBA = BA
AVGBA = average basal area (ft2) at breast
height (4.5 ft) per single- or multistemmed tree,
BA = hardwood stand basal area (ft2/acre),
Because of a more rapid rate of cover develop-
tion management treatment than stands domi-
n = hardwood stem density (no. stems!
acre), and
STEMNOBO1 =
nated by madrone.
Average height development of hardwoods is not
strongly influenced by pre-harvest levels of basal
area and stem density (Figure 3), but height development of individual hardwood sprout clumps
is directly related to parent-tree size (Tappeiner et
a/. 1984); thus, large hardwood trees should be
noted before harvest so that the planting arrangement and subsequent management of individual
Douglas-fir seedlings can be adjusted.
Herb and shrub cover reaches its maximum after
hardwood removal and can have substantial competitive effect on Douglas-fir growth; therefore,
treatments for minimizing hardwood cover
should be accompanied by subsequent control of
herbs and shrub to be most effective.
stem number: the average number of
stems of dbh 1 inch per tree (single
or multi-stemmed) for hardwood species I.
The following values for STEMNOB0 were determined from a random sample of sprout clumps in
which parent-tree stumps were counted only if their
estimated dbh was 1 inch (T.B. Harrington and J.C.
Tappeiner, unpublished data):
tanoak
1.5975
n=236
madrone
1.3263
n= 95
chinkapin
1.2857
n= 35
The crown width of a 3-year-old sprout clump
originating from a hardwood tree having the determined mean basal area is calculated with the model
form (T.B. Harrington and J.C.Tappeiner, unpublished
data):
Suppression of herbs and shrub probably will not
CW3 = b0 * AVGBAbI * AGEb2
increase Douglas-fir growth if a significant
amount of hardwood cover remains.
STEM NOBO,)
where
seedlings.
ment and higher leaf-area index (Harrington et 0/.
1 984), stands dominated by tanoak, and perhaps
chinkapin, should have higher priority for vegeta-
(n
where
CW3 = predicted crown width (ft) of the
mean sprout clump at age 3 years,
Description of Growth
Equations
The following is a brief description of the equa-
tions used for predicting the stand-growth parameters. Derivations for some of the equations and associated values for the regression coefficients are given
in Harrington et a/. (in press).
b0, b1, b2
= regression coefficients, and
AGE = 3 years after parent trees are burned
or cut.
The crown width of the mean sprout clump is
converted to the percentage of cover per acre that it
would represent, and this value is multiplied by the
number of hardwood trees per acre (ri STEM NOBO1)
to produce an estimate of 3rd-year cover.
3
of two types of equations. The first typesee equa-
Hardwood height is predicted as:
HT =
tions [la] and [2a]defines potential growth as a
b0 * AVGBAL7I * AGEb2
constant or gradually declining proportion of previ-
where
ous-year tree size,
HT
= predicted height (ft) of the mean
sprout clump at age
t.
If post-harvest cover is entered in PSME, hardwood height is predicted with these values for AVGBA
(ft2) (T.B. Harrington and J.C. Tappeiner, unpublished
data):
tanoak
0.2452
n=513
madrone
0.4974
n = 341
chin kapin
0.1801
n = 54
[lb]or[2b]= 1.
G = [a *
square of previous-year cover:
- d * HERB)
b
)b]
[2]a
b
HERB)
where
= increment in Douglas-fir size at age
a, b, c, d
(PCOVER,)2] * (100- PCOVER,)
[ha
(SlZE,)]
* exp(c* PCOVER,- d*
PGavg,i
t,
= regression coefficients,
= the average annual rate of growth for
a Douglas-fir parameter in the ab-
where
sence of competing vegetation at site
COVG = increment in hardwood cover at age
I,
t, and
PCOVER
PGavg,j+ b *
G = [a * PG avg,i * (SIZEr
Increment in hardwood cover is predicted with
[b0+ b1 *
competition (hardwood cover 0% and herbs + shrubs
suppressed), models [1] and [2] predict that Douglasfir growth will equal potential growth, i.e., equations
* exp(-c * PCOVER
an equation derived from a monomolecular model
form (Harrington et al., in press). This model assumes
that the intrinsic rate of hardwood cover growth, k =
[b0 + b, * (PCOVER1)1, increases linearly with the
COVG=
Douglas-fir trees are approach-
i.e.,
ing exponential rates of growth. In the absence of
= predicted hardwood cover at age
SlZE7 = Douglas-fir size at age
t-1,
and
t-1.
HERB = the indicator variable for herb + shrub
suppression. (If hardwood cover =
0% and herbs + shrubs are not suppressed, HERB = 1; otherwise, HERB =
0.)
Herb + shrub parameters
Increment in herb and shrub cover is predicted
with a model form similar to that for hardwood cover.
This model assumes that the intrinsic rate of growth
of the herb + shrub cover, k = [b0 b1 * (PCOVER7)],
declines linearly with increasing amounts of previousyear hardwood cover
COVG =
[b0 - b1 *
(PCOVER7)] * (100 PCOVERht,)
where
COVGh,t = increment in herb + shrub cover at
age
t,
and
PCOVERhtI = predicted herb + shrub cover at age
t-1.
Model form [1] was found to be the best descriptor of height growth (Harrington et al., in press).
In the development of diameter-growth and covergrowth models, the potential growth function given
in [2a] was the best descriptor. PSME predicts increment in diameter squared with model form [2], and
then converts cumulative values of diameter squared
to diameter. For predicting Douglas-fir cover development, PSME converts values for density and average
crown width into initial percentage values for cover
per acre.
When the indicator variable, HERB, denotes 0-
percent hardwood cover and no suppression of
herb + shrub vegetation, herb + shrub cover reaches
maximum development and competitive effect
et al. 1990, Harrington et al., in press). Increases in Douglas-fir growth after suppression of
Douglas-fir parameters
(Hughes
Douglas-fir parameters are predicted by means
of a modified exponential function that is the product
herbs and shrubs were detected only in the absence
of hardwoods (Harrington et al., in press).
4
Weibull functions were used to predict the proportion of Douglas-fir saplings represented in each of
six size classes for height and stem diameter. In the
research upon which PSME was based, hardwood
competition was found to cause positive skewing in
size distributions of Douglas-fir (Harrington et al., in
site, perform the following calculations to determine
hardwood basal area:
- =(
COUNT1 )/N
'1
=(
COUNT01,1)/N
BAF <
BA
press).
= BAF x
BA01,
BA%, = 1 00% x BA,/BA01,
Data Collection
where
ii, = average number of stems counted for
Pre-harvest data
Measurements of hardwood basal area and
stem density that are to be used as input for PSME
can be taken during pre-harvest timber cruises or
species
= number of stems of species i counted
at sample point
COUNT,,1
j,
stand examinations. We suggest using either variable-
N = number of sample points,
radius or fixed-area plots for estimating hardwood
basal area and stem density.
nL,,
Since tanoak, Pacific madrone, and chinkapin
are often multi-stemmed, PSME contains for each species the value STEMNOBO (average number of stems
per tree) for estimating hardwood stem density (see
the section "Hardwood Parameters," p. 3). This enables the user to inventory only the number of stems
per plot rather than the number of stems per tree in
= average number of hardwood stems
counted for all species,
COUNT011,1
= number of hardwood stems counted
at sample point 1
BA,
BA01,
each plot. The latter count may be used to make
= basal area (ft2/acre) of species I,
= total basal area (1t2/acre) of hardwoods, and
predictions from pre-harvest variables more site-specific (see the section "Modification: Hardwood Constants," p. 10).
BA%, = percentage of the hardwood basal
area in species 1.
The following instructions are based on the
5) Determine which species occupies more
principles of variable-plot sampling that are described
in detail by Bell and Dilworth (1 989).
than 66 percent of the total hardwood basal area. For
1) Use a wedge prism with a smafi (10-15)
basal-area factor (BAF) to determine which stems are
to be included in the given variable-radius plot. With
the prism located immediately over the sample point.
PSME, assume that BA0,, is the estimated basal area for
the dominant hardwood species.
6) Perform the following calculations to determine stem density for the dominant hardwood species.
sight each surrounding hardwood stem through the
prism at breast height (4.5 if), starting from a northerly direction. Count a given stem if the two images it
=(
STFk
produces overlap or touch.
2)
,., total
with only one hardwood speciestanoak, Pacific
variable-plot (prism) sample by species.
3) Measure the diameter at breast height (4.5
if) of each counted stem to the nearest inch.
4) When a representative number of sample
points have been measured in this way for a given
= BAlI
{it * [k/(2 x 1 2)12)
= nk*STFk
Because PSME simulates stand development
madrone, or chinkapindetermine which species occupies more than 66 percent of the hardwood basal
area in a given stand. Group stem counts from the
COUNT,j)/N
k
where
k
nTk
COUNTk,I
= an integer value for dbh (in.),
= average number of counted stems of
dbh k,
= total number of counted stems of
dbh
STFk
k
at sample point
j,
= stand table factor for a tree of dbh
k,
5
= number of stems per acre of dbh k,
where
and
COy, = average cover (%) for species i,
= stem density (no. stems/acre).
COV1 = cover (%) for species I at sample
point /,
Post-harvest data
C0V011
Data from regeneration surveys can be used
with PSME to estimate subsequent plantation development. We recommend the following procedures
for estimating the post-harvest data required to run
PSME; however, estimates can be obtained by other
plantation-survey methods.
C0V0111
= average cover (%) for hardwoods,
= total cover (%) for hardwoods at
sample point
j,
and
COV%, = percentage of the hardwood cover in
species I.
1) From a given sample point, mark the
9) Determine which species occupies more
than 66 percent of the total hardwood cover. For
boundaries of a circular plot with a radius of 8.33 feet
(1/200 acre).
PSME, assume that COV01, is the estimated cover value
for the dominant hardwood species.
2) Visually estimate the cover (to nearest 5 percent, not to exceed 1 00 percent) for each hardwood
species. Group hardwood cover by species so that the
input values for PSME:
dominant species (cover >66 percent) in a given
COVh = (
10) Calculate the following stand averages for
stand can be determined.
HI = (
3) Visually estimate the total cover for
herb + shrub species to the nearest 5 percent, not to
DIAM
exceed 1 00 percent.
foot.
HT1)/N
DIAM1)/N
CW = (>CW1)/N
4) Locate the Douglas-fir seedling nearest the
plot center; position a height pole at stem base on
the uphill side of the seedling; measure the total
height of the tallest living shoot to the nearest 0.1
(
COVh,/)/N
fir
= 200 X (
COLJNT11r,j)/N
where
COV,, = average cover (%) for herbs + shrubs,
5) With calipers, measure stem diameter 6
inches above the ground to the nearest 0.1 inch. If
stem deformities occur at that point (e.g., swelling
associated with a lateral branch), move the point of
measurement slightly.
COVhJ
= cover (%) for herbs + shrubs at
sample point 1
HT = average Douglas-fir height (ft),
HT1 = Douglas-fir height (ft) at sample point
6) Determine crown width at its maximum
point (i.e., near the base) by averaging two measurements (to the nearest 0.1 ft) taken at right angles to
each other.
I,
DIAM = average Douglas-fir stem diameter
(in.),
7) Count the number of Douglas-fir seedlings
having a mainstem within the plot boundary.
DIAM1 = Douglas-fir stem diameter (in.) at
8) When a representative number of sample
points have been measured for a given site, perform
the following calculations to determine the dominant
CW = average Douglas-fir crown width (ft),
sample point
CW = Douglas-fir crown width (ft)
COV01
=(
(
= average Douglas-fir density (no./
C0V11)/N
acre), and
C0V0111)/N
COV%1 = 100% x
COUNTfir,j
COV,/C0V011
at
sample point],
hardwood species.
COy,
j,
= number of Douglas-fir within the plot
at sample point j.
Software Installation
5) To return to DOS, first terminate the proDesignations used in this publication:
gram as described above. The Computer displays the
BASIC prompt: Ok. Type SYSTEM <Cr>.
<Ctrl>
A computer key labeled "CtrI"
<Cr>
The carriage return or <Enter> key
In-line prompts for user input are in boldface
type.
Floppy Disk
Other prompts and program output are
Iscreenedi.
1) Insert the disk containing the BASIC interpreter into the A: drive. Type A: <ci>. Invoke the BA-
SIC interpreter by typing either GW-BASIC <cr>,
PSME is written in GW-BASIC 3.1. With a BASIC
interpreter, such as GW-BASIC.EXE, BASICA.EXE, or
BASIC.EXE, the program will run on any IBM-compat-
BASICA <Cr>, or BASIC <Cr>, depending on the ver-
sion of BASIC. (Consult your user manual to determine the name of the BASIC interpreter that is resi-
ible microcomputer. A hard disk is not required. All
graphic output in the computer screens is produced
with the extended ASCII character set (see the MS-
dent on your Computer). The Computer loads the BASIC interpreter and responds with the prompt: Ok.
DOS user manual). Information on the screen can be
sent directly to a printer connected to the computer
into the B:drive and type, with the quotation marks,
for hard copy. However, a printer that emulates an
IBM graphics printer is required for exact reproduction of the screens.
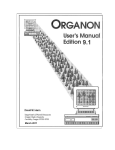
2) Insert the disk Containing the file PSME.BAS
LOAD "B:PSME" <ci>. The computer displays the BASIC system prompt: Ok. Type RUN <Cr>. The Com-
puter should now display the title screen for PSME
(Figure 4).
The steps that follow describe how to install
3) To terminate the program, hold down
and run PSME. Either lower- or upper-case letters can
be used to enter commands or values.
<CtrI> and strike <Break>. To restart the program,
4) To return to DOS, terminate the program as
previously described. The Computer displays the BASIC prompt: Ok. Type SYSTEM <cr>.
Hard Disk
1) At the DOS prompt, make a
subdirectory for PSME by entering the
command MD PSME <Cr>. Change to
this subdirectory by entering CD PSME
Douglas-fir Plantation Simulator for the Mixed Evergreen Type
<Cr>.
pppPpp
pPPpppP
2) Insert the disk containing the
file PSME.BAS into the A: floppy-disk
drive and type COPY A.* C: <cr>. This
PPp
copies the program to the PSME
subdirectory on hard disk C:.
PPP
ppPPppP
ppppp
sSSs
ssssssss
pp
PP
PP
PP
ss
3) To load and execute PSME,
on the name of the BASIC interpreter.
(Consult your user manual to determine
the name of the BASIC interpreter that is
resident on your computer.) The computer should now display the title screen
for PSME (Figure 4).
ss
SS
SS
SS
MM
MM
MMMM
MMMM
SS
MM
MM
SSSS
MM
MMMM
MM
MM
MM
MM
Version 1.0
April 1991
H1
III
MMMM
MMMM
SSSSSSSS
SS
type GWBASIC PSME <Cr>, BASIC PSME
<Cr>, or BASICA PSME <cr>, depending
type RUN <ci>.
MM
MM
MM
MM
MM
MM
MM
MM
EEEEEEEEEEEE
EEEEEEEEEEEE
FE
EE
FEE F FEE
Timothy B. Harrington
John C. Tappeiner, II
Thomas F. Hughes
OSU For. Ed. Dept.
Fundamental FIR Program
Programming by Arlene S. Hester
FE
FE E FE F FE EEEE
EEEEEEEEEEEE
<Cr> to continue...
4) To terminate the program,
hold down <Ctrb. and strike <Break>. To
restart after terminating, type RUN <cr>.
Figure 4. The title screen for PSME.
7
Input Data
Figure 5 is a generalized flowchart of the sequences of operations in PSME. (Techniques for measuring the variables are described in the section "Data
Collection," p. 5.) In a series of prompt statements,
PSME requests the values required to run the pro-
hardwood basal area (B) or post-harvest hardwood cover (C)?
Enter B or C, followed by <Cr>.
gram. Either capital or lower-case letters are accepted.
Each value entered must be followed by <cr>.
The default value is entered by <cr> alone. Default values appear in parentheses at the end of each prompt
you going to enter pre-harvest
Are
If B is selected, values for basal area and stem
density of the pre-harvest hardwood stand are requested, and plantation age is set to 3 years.
statement.
Individual or groups of prompt statements are
followed by the request, Continue (Y)? Answer N to
enter a new value, Y or <Cr> to continue the program.
PRE-HARVEST HARDWOOD BASAL AREA
Enter basal area for ONE species:
tanoak
(30 sq. ft./acre)
madrone
(30 sq. ft./acre)
TITIE SCREEN
chinkapin (30 sq. ft./acre)
4
ENTER B
(PRE-HARVEST)
TYPE OF
HARDWOOD
DATA?
ENTER C
(POST-HARVEST)
Enter the basal area (BA) in square feet per a
for the dominant hardwood species (tanoak, madrone, or chinkapin) in the pie-harvest stand. (See the
ENTER BA
ENTER COVER
section "Data Collection," p. 5 for criteria for
CONTiNUE?
CONTINUE?
ENTER DENSITY
determining the dominant species if more than one is
present.) Use the down arrow key to move the cursor
for input of madrone or chinkapin data. Limits for the
CONTiNUE?
input value are 0 to 200. (Note defaults in
parentheses.)
AGE3
ENTER PLANTA11ON AGE
The next screen asks for stem density. (Tanoak
has been selected in the example.)
3
- ENTER HERB +3SHRUD COVER
HERBS + SHRUBS SUPPRESSED?
PRE-I-LARVEST HARDWOOD DENSITY
ENTER DOUGLAS-FIR HEIGHT
Enter density for tanoak (500 stems/acre)
ENTER DOUGLAS-HR DIAMETER
ENTER DOUGLAS-FIR CROWN WIDTH
Enter number of stems per acre for the domi-
ENTER DOUGLAS-FIR DENSITY
nant hardwood species (tanoak, madrone, or
CON11NUE?
chinkapin) in the pre-harvest stand. Limits are 0 to
3,000.
OUTPUT
DO ANOTHER SIMULATION?
Y
If C is selected, the percentage of cover of the
post-harvest (i.e., sprout-origin) hardwood stand is requested.
Figure S. Flowchart of the sequence of input and output
operations in PSME.
Hardwood Data
The program is initialized by entering values
for either of two types of hardwood competition, preharvest basal area or post-harvest cover. The screen
displays:
POST-HARVEST HARDWOOD COVER
Enter cover (%) for ONE species:
tanoak
(25%)
%
madrone
(25%)
%
chinkapin
(25%)
%
Enter the percentage of cover for the single
hardwood species in the post-harvest (i.e., sprout-ori-
gin) stand. Use the down arrow key to move the
cursor for input of madrone or chinkapin data. Limits
for the in put values are 0 to 100.
Douglas-fir and Herb + Shrub
Data
Because the data upon which PSME is based
were collected one growing season after the various
levels of hardwood cover were established, we recommend that input for Douglas-fir size reflect the 1styear growth response expected after vegetation-management treatment. We observed that 1 year after
complete removal of hardwoods and herbs + shrubs,
stem diameter of Douglas-fir exceeded that for trees
growing among untreated vegetation by 25 percent;
Have herbs & shrubs been suppressed (N)
Enter Y for "yes" if herb and shrub cover has
been reduced significantly as a result of a vegetation
management treatment; otherwise enter N or <cr>.
The response to this question does not affect predictions of Douglas-fir growth unless either pre-harvest
basal area and stem density or post-harvest cover of
hardwoods is zero. (For more explanation, see the
section "Douglas-fir Parameters," p. 4.)
Douglas-fir height (1.5 ft)?
Enter the average height (ft) of Douglas-fir in
the plantation. Limits for the input value are 0.1 to
16.
however, there was no such response in height
growth (Harrington 1989; Hughes et al. 1 990).
For responses to the following requests for input, enter values that are appropriate for the specific
Douglas-fir plantation being considered for vegetation-management treatment. If pre-harvest hardwood
variables have been entered, use values for the Douglas-fir variables that correspond to those for a 3-yearold plantation.
Douglas-fir stem diameter (0.3 in)?
Enter the average stem diameter (inches at 6in. height) of Douglas-fir in the plantation. Limits for
the input value are 0.1 to 4.
Douglas-fir crown width (0.8 ft)?
Enter the average crown width (It) of Douglasfir in the plantation. Limits for the input value are 0.1
to 10.
Enter the number of growing seasons since the
Douglas-fir seedlings were planted. PSME will round
Douglasfir density (436 trees/acre)?
non-integer values for plantation age to the nearest
whole number. Limits for the input value are 3 to 9.
Enter the number of Douglas-fir seedlings per
Douglas-fir plantation age (3 yr>?
Although age is not a driving variable in the
equations for PSME (see the section "Description of
Growth Equations," p. 3), it is important that the
model not be used to make growth predictions beyond plantation-age 10 years. In developing PSME,
we assumed that exponential increases in Douglas-fir
size occur during early stand development. Such
growth accelerations, however, are sustained only
briefly and generally are followed by constant or
gradually declining rates of tree growth.
acre. The default value (in parentheses) corresponds
to a square spacing of 10 ft x 1 0 ft. Limits for the input value are 0.1 to 600.
Statements such as the following then appear,
listing the current input values for Douglas-fir and
herb + shrub parameters. (In this example, default
values were selected.)
Douglas-fir plantation age = 3 yrs
Herb + shrub cover=15 %
Herb & shrubs suppressed? N
Herb + shrub+ cover (15 %)?
Enter the percentage of total cover for herb
and shrub species. Limits for the input value are 0 to
100. (The value entered for herb + shrub cover does
not affect the predicted rate of Douglas-fir growth.)
Douglas-fir height=1.5 ft
Douglas-fir diameter= .3 in
Douglas-fir crown width= .8 ft
Douglas-fir density= 435.6 trees/acre
Modification: Site Qualities
The Douglas-fir parameter, PGaj, is the average annual rate of growth during 1983-1 989 at site i
following complete removal of hardwoods and suppression of herbs and shrubs (see the section "Douglas-fir Parameters," p. 4). This parameter was included
in the Douglas-fir growth models to account for differences in site quality among the three study sites. Its
incorporation allowed potential differences in the
competitive effects of tanoak and madrone to be estimated after adjustments were made for inherent differences in site quality. The following values for PGavg
(averaged across the three sites) are used in PSME.
Height (in./yr)
18.5577
n = 270
Diameter2 (in.2/yr)
1 .2503
n = 270
Cover (%/yr)
4.845 7
n = 270
These values are also given on line 420 in the
BASIC code for PSME.
The following commands can be used to edit
names, such as "PSMEl", by substituting the desired
text within the quotation marks.
Modification: Hardwood
Constants
PSME divides pre-harvest stem density of hardwoods by STEM NOBO, (average no. stems/tree) to
predict the number of hardwood trees per acre (see
the section "Hardwood Parameters," p. 3). Predic-
tions of 3rd-year hardwood cover generated from
pre-harvest data can be improved by estimating sitespecific values for STEMNOBO1 and including these in
the BASIC code for PSME as follows:
1) At each sample point in the pre-harvest in-
ventory (see the section "Data Collection," p. 5),
record, by species, three to five counts of the number
of stems per tree. Count only the stems having a
dbh 1 inch. If both single- and multi-stemmed trees
are present, include both in the sample. Average the
counts of stems per tree for the dominant hardwood
PGavg, making PSME adaptable to different site quali-
species to provide a site-specific estimate of
ties:
STEM NOBO,.
Terminate the program by holding down
striking <Break>. The program responds
with the BASIC prompt, Ok.
Type EDIT 420 <cr>. The program gives a listing of line 420 in the following order: average growth
rate for Douglas-fir height (in./yr), diameter-squared
(in.2/yr), and cover (%/yr).
420 MAXIIRATE1B.5577:MAXDRATE
.2503 :MAXCRATE=4 .8457
Use the arrow keys to move the cursor to the
appropriate location on line 420, change values for
2) While in PSME, terminate the program by
holding down <Ctrl> and striking <Break>. The program responds with the BASIC prompt, Ok.
3) Type EDIT 380 <cr>. The program will give
the following listing of line 380:
380 STEMNOBO(1)=l.5975:STEMNOBO(2)
=1.3263: STEMNOBO (3) =1.2857
4) Change the values to your estimate of
STEMNOBO, by using the arrow keys to move the
cursor to the appropriate location on line 380,
MAXHRATE, MAXDRATE, or MAXCRATE as desired,
and follow changes with <Cr>. Average rates of potential growth for Douglas-fir can be estimated for a
given site from measurements of nearby progeny test
sites or experimental areas in which competing veg-
tanoak
= STEMNOBO(1)
madrone = STEMNOBO(2)
chinkapin = STEMNOBO(3)
etation has been removed.
Run the program with the new values for PGavg
5) Run the program with the new values for
by typing RUN <Cr>. (If you type SYSTEM <cr>, the
program will return you to DOS without saving the
STEMNOBO, by typing RUN <Cr>. (If you type SYSTEM <Cr>, the program will return you to DOS with-
new values for PGaVg.)
out saving the new values for STEMNOBO1.)
If you wish to save a new version of PSME with
the edited values for PGavg, type SAVE "PSME" <cr>,
6) If you wish to save a new version of PSME
with the edited values for STEMNOBO,, type SAVE
"PSME" <ci>, including the quotation marks, after
including quotation marks, after the BASIC prompt,
Ok. The new version of PSME can be given other file
E1Ø]
the BASIC prompt, Ok.
Output Data
After PSME has calculated the table of growth
predictions for a given simulation, the user may start
a new stand simulation or review any screen output.
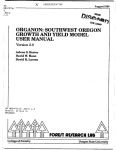
At the bottom of each output screen is a menu for
selecting the kind of output desired (e.g., see Figure
6).
PSME STAND GRC*T}1 PREDICTIONS-STAND NUMBER 1
Age
(yrs)
r Height
fir
(ft)1
tan.
fir
tan,
herbs
fir
1.5
2.3
3.3
4.3
5.4
6.6
7.9
9.2
4.7
5.7
6.6
7.5
8.3
9.1
9.9
0.5
1.4
3.0
5.5
8.9
13.2
18.5
10.6
24.6
25.0
32.4
40.5
49.4
59.0
69.0
78.6
86.7
15.0
22.0
27.0
30.0
31.2
30.6
28.1
23.7
0.3
0.5
0.6
0.8
1.1
1.3
1.6
1.8
3
4
5
6
7
8
9
10
Cover (%)
Dian (in)
DOUGLAS-FIR SIZE DISTRIBUTIONS AT AGE 10 YEARS
Htclass
0-4'
4-8'
8-12'
12-16'
fl
16- 20'
IJI:J_
20+'
% of
Diameter
stand class (in) %of stand
0.8
28.4
52.7
17.3
0.8
0.0
0-1
1-2
2-3
3-4
4-5
5+
If pre-harvest hardwood data have been entered, plantation age is set at 3 years and initial hardwood cover is predicted as described in the section
"Hardwood Parameters," p. 3. To distinguish simulations when repeat runs of PSME are performed, the
program displays a stand number at the top of each
output screen. In the first run, the stand number is 1;
successive runs are numbered consecutively.
Below the table of growth predictions are histograms and percentage values showing the size distributions of Douglas-fir saplings at stand age 10 years
(Figure 6). This information can be used to determine
the percentage of Douglas-fir saplings in a given
stand that have or have not high potential for becoming crop trees. In Figure 6, for example, the percentage of trees in height class 1 (0-4 ft) gives a measure
of the proportion of the stand that has high probability of mortality from stand competition.
In addition, size-distribution data from the output file, PSME.DAT (see the section "Summary Files,"
p. 12), can be read by a computer, and, with additional programming, a list of individual trees can be
created for export to programs such as SYSTUM-I
14.7
60.8
23.5
1.0
0.0 fl
o.oU
Douglas-fir Size Distributions
(Powers et al. 1 989), enabling a user to project stand
U
development after the first 1 0 years. See Harrington
et al. (in press) for details.
[1-H'Ivs.kGE} or [2-COVERvsAGE) or f3-DIAMvsAGE] or (CR-END]I
Figure 6. Output screen showing a table of stand growth
predictions and in formation on Douglas-fir size distributions.
Stand Growth Predictions
The first line in the table of stand-growth predictions (Figure 6) gives the initial values entered for
Douglas-fir, hardwood, and herb + shrub variables at
the initial plantation age. In the example, post-harvest
tanoak cover was initialized at 25 percent, and default
values were selected for the remaining variables.
PSME calculates Douglas-fir cover by multiplying the
density value by the cover value for a tree of average
crown width. Hardwood height, not an input variable, is predicted by the method described in the
section "Hardwood Parameters," p. 3.
As annual increments are predicted for each
variable, cumulative values are displayed in successive
lines of the table until the plantation age is 10 years.
Plots of Stand Development
PSME produces graphic output of the development of stand parameters through plantation age 1 0
years. (As noted previously, screen information from
PSME can be sent directly to a printer by holding
down <Shift> and striking <PrtSc>. A printer that
emulates an IBM graphics printer is required for exact
depictions of the screens.) Because ASCII characters
are used in the display of graphs, resolution is limited
to the width of an individual character. An asterisk (*)
is plotted if two or more observations are located in
the same position on a given graph.
The first graph produced by PSME is a display
of height values for Douglas-fir and the given hardwood species plotted against plantation age (Figure
7A). The maximum height that can be plotted is 20
feet. If predicted height exceeds this, "(values> 20)"
is displayed in the upper right margin of the graph. (If
3rd-year hardwood cover has been set at zero, hardwood height will not be shown.)
11
20
(A)
HEIGHT VS. AGE FOR STAND 1
I
I
F-Douglas-fir
T-Tanoak
I
I
H
16
E
G
H
12
T
I
T
I
T
N
T
8
F
F
T
F
F
T
F
F
T
T
herbs & shrubs
not suppressed
F
'
F
F
F
I
0
4
2
i-TABLES)
(B)
I
AGE
I
I
6
The user may start a new stand
simulation or end the current series of
simulations by striking <ci> to produce
I
I
10
8
or [2-COVER vs AGE) or )3-DIAM vs AGE) or
1CR-END)
COVER VS AGE FOR STAND 1
100
I
I
I
I
I
F-Douglas-fir
I
(Figure 7B). (If 3rd-year hardwood cover
was set at zero, hardwood cover is not
plotted.)
The third graph gives Douglas-fir
stem diameter plotted against plantation
age (Figure 7C). The maximum diameter
that can be plotted is 5 inches; if the predicted diameter exceeds this, "(values >
5)" is displayed in the upper right margin
of the graph.
the following prompt:
T TTanoak
H-Herbs & shrubs
C
T
80
0
v
T
T
60
i
N
Do you want to do another
simulation (N)?
T
Answer Y to return the program to
H
the point for entering the type of hardwood data. Answer N to return to the
BASIC prompt, Ok; then type SYSTEM
F
40
T
T
H
H
H
*
F
20
F
H
F
F
F
I
I
F
I
0
2
H
11
4
AGE
6
<cr> to return to DOS.
F
I
I
8
I
10
i-TABLES) or [2-nT vs ACE) or [3-ClAN vs AGE) or [CR-END)
(C)
Summary Files
DIAMETER VS AGE FOR STAND
1
F-Douglas-fir
As PSME calculates the table of
growth predictions for a given simulation, the model automatically writes or
appends two ASCII files, PSME.OUT and
PSME.DAT, to the floppy- or hard-disk
drive being accessed. As shown in Figure
8, PSME.OUT provides a readable summary of a given series of model simula-
tions, including the input value for each
parameter and the table of growth predictions. Note that information for successive simulations (i.e., stands) is sepa-
[i-TABLES) or [2-HF vs AGE) or [3-COVER vs ACE) or [CR-END)
Figure 7. Output screens showing plots against stand age of the parameters (A) hardwood and Douglas-fir height; (B) hardwood, hen 5 + shrub,
and Douglas-fir cover (asterisk indicates two observations at sc me point;
and (C) Douglas-fir stem diameter.
rated by a blank line.
PSME. DAT contains all of the infor-
mation of PSME.OUT written in com-
puter-readable FORTRAN data formats
(Figure 9). Thus, PSME output can be
read easily by statistical packages such as SAS® or
Also displayed in the right margin of the graph
are the level of herb and shrub suppression and the
pre-harvest basal area and stem density of the hardwood stand. (If post-harvest cover has been entered,
pie-harvest information is not displayed.)
SYSTAT®, facilitating additional analyses. For a given
simulation, size-distribution data for Douglas-fir
height and diameter is provided in PSME.DAT only
when stand age is 1 0 years.
Percentage of crown cover of the given hardwood, herbs and shrubs, and Douglas-fir are plotted
Because terminating and re-invoking PSME
causes the model to write over existing PSME.OUT
and PSME.DAT files, the user must rename or print
against plantation age in the second graph
these files to retain a record of simulation results.
12
1
STAND NUMBER=
tan.
HARDWOOD SPECIES=
PRE-HARVEST BA=
PRE-HARVEST DENSITY=
DOUGLAS-FIR CROWN WIDTH=
.8
435.6
DOUGLAS-FIR DENSITY=
HERBS/SHRUBS NOT SUPPRESSED
PSME STAND GROWTH PREDICTIONS--STAND NUMBER
COVER
HEIGHT
HARDWOOD
FIR
HARDWOOD
FIR
AGE
4.7
25.0
3
1.5
0.5
Variable
Stand number
Hardwood species
1
HERB
DIAMETER
FIR
15.0
0.3
2.3
5.7
1.4
32.4
22.0
0.5
5
3.3
6.6
3.0
40.5
27.0
0.6
6
4.3
7.5
5.5
49.4
30.0
0.8
7
5.4
8.3
8.9
59.0
31.2
1.1
8
6.6
9.1
13.2
69.0
30.6
1.3
9
7.9
9.9
10.6
78.6
86.7
1.6
9.2
18.5
24.6
28.1
10
23.7
1.8
DOUGLAS-FIR SIZE DISTRIBUTIONS AT AGE 10 YEARS
%
%
DIA CLASS
HT CLASS
14.7
0.8
0 - 1"
4 - 8'
28.4
1 - 2"
60.8
8 -12'
52.7
23.5
12-16'
17.3
2 - 3"
3 - 4"
16-20'
0.8
4 - 5"
0.0
20+'
0.0
5+"
0.0
1.0
STAND NUMBER=
HARDWOOD SPECIES=
PRE-HARVEST BA=
PRE-HARVEST DENSITY=
DOUGLAS-FIR CROWN WIDTH=
2
itad.
30
500
.8
435.6
DOUGLAS-FIR DENSITY=
HERBS/SHRUBS NOT SUPPRESSED
PSME STAND GROWTH PREDICTIONS--STAND NUMBER
COVER
HEIGHT
HARDWOOD
FIR
HARDWOOD
FIR
AGE
Format
No.
17
--
A7
ft2
No./acre
ft
No./acre
F7.1
F7.1
F7.1
F7.1
---
A7
(yr)
(fi)
(fi)
(%)
(%)
(%)
(in.)
(%)
(%)
(%)
(%)
(%)
(%)
(%)
(%)
(%)
(%)
(%)
(%)
17/
(ian.", "mad.", or 'chi.")
4
0 - 4'
Jn1I
Pre-harvest hardwood basal area
Pre-harvest hardwood stem density
Douglas-fir crown width
Douglas-fir density
Herb + shrubs suppressed?
("YES' or "NO")
Stand age
Douglas-fir height
Hardwood height
Douglas-fir cover
Hardwood cover
Herb + shrub cover
Douglas-fir diameter
height class 1
height class 2
height class 3
height class 4
height class 5
height class 6
diameter class 1
diameter class 2
diameter class 3
diameter class 4
diameter class 5
diameter class 6
F7.1
F7.1
F7.1
F7.1
F7.1
F7.1
F7.1
F7.1 I
F7.1
F7.1
F7.1
F7.1
F7.1
F7.1
F7.1
F7.1
F7.1
F7.1
/
2
HERB
DIAMETER
FIR
3
1.5
5.7
0.5
17.5
15.0
0.3
4
2.4
7.0
1.5
21.1
23.8
0.5
5
3.5
8.1
3.2
25.2
0.7
6
4.8
9.2
6.0
29.8
30.9
36.6
7
6.3
10.2
10.0
35.0
41.0
1.3
8
8.0
11.2
15.3
40.9
44.3
1.7
9
10.0
12.2
22.0
47.7
46.5
2.1
10
12.2
13.1
30.1
55.2
47.7
2.5
Figure 9. FORTRAN data formats for reading PSME. DAT.
1.0
DOUGLAS-FIR SIZE DISTRIBUTIONS AT AGE 10 YEARS
%
%
DIA CLASS
HT CLASS
0 - 4'
0.0
0 - 1"
4.0
4 - 8'
5.9
1 - 2"
8 -12'
31.0
2 - 3"
33.9
47.8
12-16'
44.5
3 - 4"
13.7
16-20'
17.3
4 - 5"
0.5
20+'
1.3
5+"
0.0
Figure 8. Example of a summary file produced by
PSME. OUT.
13
Literature Cited
timber cruising. Oregon State University Book
growth to productivity of Douglas-fir seedlings
and understory vegetation. Western journal of
Stores, Inc., Corvallis.
Applied Forestry 5:20-24.
BELL, J.F., and J.R. DILWORTH. 1989. Log scaling and
HARRINGTON, T.B. 1 989. Stand development and in-
IVERSON, R.D., and M. NEWTON. 1980. Large Doug-
dividual tree morphology and physiology of
las-fir seedlings perform best on Oregon coastal
sites. Western Forest Research Center, International Paper Co., Lebanon, Oregon. Technical
Note 55. 9 p.
young Douglas-fir (Pseudotsuga menziesil) in association with tanoak (Lithocarpus densiuiorus). Ph.D.
thesis. Oregon State Univ., Corvallis. 185 p.
HARRINGTON, T.B., J.C. TAPPEINER II, and T.F.
HUGHES. In press. Predicting average growth and
size distributions of Douglas-fir saplings in compe-
OPALACH, D., R.G. WAGNER, B.D. MAXWELL, j.H.
tition with sprout clumps of tanoak or Pacific
progress report 2. CRAFTS Technical Report. Department of Forest Science, Oregon State University, Corvallis. 54 p.
madrone. New Forests.
HARRINGTON, T.B., J.C. TAPPEINER, II, and J.D.
WALSTAD. 1 984. Predicting leaf area and biomass
of 1 to 6-year-old tanoak (Lithocarpus densiflorus)
and Pacific madrone (Arbutus menziesii) sprout
clumps in southwestern Oregon. Canadian Journal of Forest Research 14:209-21 3.
HOWARD, K.M., and M. NEWTON. 1984.
Overtopping by successional Coast-Range vegeta-
tion slows Douglas-fir seedlings. Journal of Forestry 82(3):1 78-1 80.
HUGHES, T.F., J.C. TAPPEINER, II, and M. NEWTON.
1990. Relationship of Pacific madrone sprout
14
DUKES, Jr., and S.R. RADOSEVICH. 1990. A
growth model for young Douglas-fir stands:
POWERS, R.F., M.W. RITCHIE, and L.O. TICKNOR.
1 989. SYSTUM-1: simulating the growth of young
conifers under management. P. 101 -115 in A Decade of Forest Vegetation Management. Proceedings, Forest Vegetation Management Conference,
Eureka, CA.
TAPPEINER, J.C., II, T.B. HARRINGTON, and J.D.
WALSTAD. 1984. Predicting recovery of tanoak
(Lithocarpus densiflorus) and Pacific madrone (Ar-
butus menziesii) after cutting or burning. Weed
Science 32:41 3-41 7.
Harrington, T.B., J.C. Tappeiner II, T.F. Hughes, and A.S. Hester. 1991. PLANNING
WITH PSME: A GROWTH MODEL FOR YOUNG DOUGLAS-FIR AND HARDWOOD
STANDS IN SOUTHWESTERN OREGON. Forest Research Laboratory, Oregon State
University, Corvallis. Special Publication 21. 14 p.
PSME (Plantation Simulator-Mixed Evergreen) is a computerized growth model
for predicting development of Douglas-fir plantations under specific initial levels of
competition from tanoak [Lithocarpus densiflorus (Hook. and Am.) Rehd.], Pacific madrone (Arbutus menziesii Pursh), and chinkapin [Castanopsis chrysophylla (Dougl.) A. DC.]
and from herb + shrub vegetation in southwestern Oregon. It uses values for cover of
competing vegetation and average size of Douglas-fir seedlings at stand-age 3 years, or
for pre-harvest stand information on hardwood basal area and stem density, to provide
tabular and graphical output of the development of the Douglas-fir, hardwood, and
herb + shrub components through stand-age 10 years. It also predicts frequency
distributions of Douglas-fir height and stem diameteratl 0 years. PSME can be run on any
IBM-compatible microcomputer (hard disk not necessary) with a copy of a BASIC
interpreter, such as GW-BASIC. This user's manual provides software for PSME, information
on model installation and application, and techniques for collecting input data.
Harrington, T.B., J.C. Tappeiner II, T.F. Hughes, and A.S. Hester. 1991. PLANNING
WITH PSME: A GROWTH MODEL FOR YOUNG DOUGLAS-FIR AND HARDWOOD
STANDS IN SOUTHWESTERN OREGON. Forest Research Laboratory, Oregon State
University, Corvallis. Special Publication 21. 14 p.
PSME (Plantation Simulator-Mixed Evergreen) is a computerized growth model
for predicting development of Douglas-fir plantations under specific initial levels of
competition from tanoak [Lithocarpus densiflorus (Hook. and Am.) Rehd.], Pacific madrone (Arbutus menziesii Pursh), and chinkapin [Castanopsis cinysophylla (Dougl.) A. DC.]
and from herb + shrub vegetation in southwestern Oregon. It uses values for cover of
competing vegetation and average size of Douglas-fir seedlings at stand-age 3 years, or
for pre-harvest stand information on hardwood basal area and stem density, to provide
tabular and graphical output of the development of the Douglas-fir, hardwood, and
herb + shrub components through stand-age 10 years. It also predicts frequency
distributions of Douglas-fir height and stem diameter at 1 0 years. PSM E can be run on any
IBM-compatible microcomputer (hard disk not necessary) with a copy of a BASIC
interpreter, such as GW-BASIC. This user's manual provides software for PSME, information
on model installation and application, and techniques for collecting input data.
As an affirmative action institution that complies with Section 504 of the
Rehabilitation Act of 1 973, Oregon State University supports equal educational
and employment opportunitywithout regard to age, sex, race, creed, national
origin, handicap, marital status, or religion.
OForestry Publications Office
Oregon State University
Forest Research Laboratory 225
Corvallis OR 97331-5708
Address Correction Requested
Non-Profit Org.
U.S. Postage
PAID
Corvallis, OR 97331
Permit No. 200