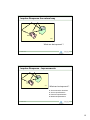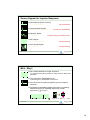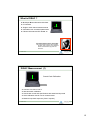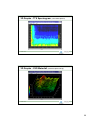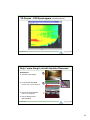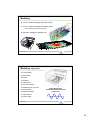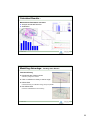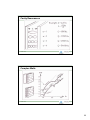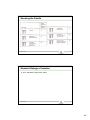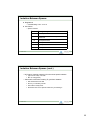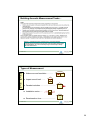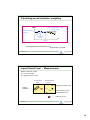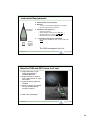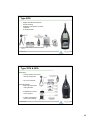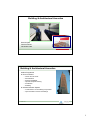
1
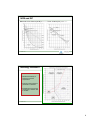
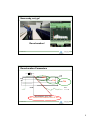
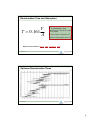
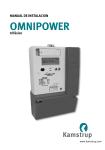
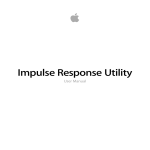
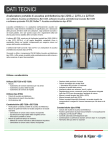
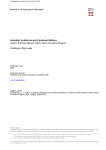
Building & Architectural Acoustics Bruel & Kjaer Seminar Series November 2009 Building & Architectural Acoustics Outline Programme Room Acoustics – – – – – – Interior Sound Levels Reverberation Speech Intelligibility Impulse Response Testing Auralization Modeling Isolation between Spaces – Transmission Loss of Building Components – Impact Isolation of floors and Ceilings www.bksv.com, 2 1 What is Architectural Acoustics Room Acoustics and Building Insulation Room acoustics relate to the place you are – and how sound is perceived Building Insulation is noise control to keep sound out of your room Things we won’t talk about… – – – Machine Diagnostics HVAC and mechanical system design Only a little bit about building design www.bksv.com, 3 Room Acoustics: Measure or Model? www.bksv.com, 4 2 Interior Sound Levels A-weighted Sound Level Octave Band Sound Pressure Level NC, PNC, RC, NCB Figure 2 - Octave Band Sound Pressure Level Spectra Measured at Ortho Open Plan Office Area. Data of 17 Decem ber 2001 . 70 Office S216 Office S214 Office S217 Office S211 NC 35 NC 40 60 50 40 30 20 10 31.5 63 125 250 500 1000 2000 4000 8000 NC Oc t a v e B a n d C e n t e r F r e q u e n c y , H z www.bksv.com, 5 Recommendations for acceptable Room Noise www.bksv.com, 6 3 NCB and RC Balanced Noise Criteria (NCB) SIL 500,1K,2K,4K Room Criteria (RC) PSIL 500,1K,2K www.bksv.com, 7 Building Vibration? Vibration Sensitivity of humans is at lower frequencies Velocity is the measured parameter of vibration Sometimes it’s the sound produced by vibration that is audible. www.bksv.com, 8 4 Now ready, set, go! Reverberation! www.bksv.com, 9 Reverberation Parameters First 10dBEDT level dB Evaluation range 20 dB T20 60dB 0 dB -5 dB or 30dB T30 time s Reverberation Time T60 ALL VALUES ARE NORMALIZED TO T60 www.bksv.com, 10 5 Reverberation Time and Absorption V T 0.161 A T is Reverberation Time - Sound decay in seconds to 1/1000 level (-60dB) V is the Volume of the Room (m3) A is the Total Absorption Area (m2) Wallace Clement Sabine (June 13, 1868 - January 10, 1919) www.bksv.com, 11 Optimum Reverberation Times CNRC www.bksv.com, 12 6 What makes a Good Listening Room S1R1 dB Steep Early Decay Curve 80 – Maintains clarity 60 Early reflections 40 – +/- 60 degree – Horizontal 20 0 Minimize ceiling reflections Side Wall reflections – Discreet – Lateral Eliminate 4k s T2 Average 2k 1 1k 0.9 0.8 500 0.7 250 0 0.6 0.4 0.8 1.2 1.6 2 s 2.4 2.8 3.2 3.6 125 Hz 0.5 – Discrete echoes – Flutter – Standing Waves 0.4 0.3 0.2 0.1 0 125 250 500 1k 2k 4k Hz www.bksv.com, 13 Factors Influencing Speech Intelligibility Word Material and Presentation Character of the Speaker Quality of the Transmission System Character of the Acoustics Character of the Listener www.bksv.com, 14 7 Speech Intelligibility Measures Articulation Index Speech Interference Level (SIL,PSIL,SIL3) Direct to Reverb ration (Weighted C50/C35) Speech Intelligibility Index Speech Transmission Index (STI) Rapid Speech Transmission Index (RASTI) %ALCONS (All consider signal to noise effects, some include reverberation, none explicitly include distortion in transmission system) www.bksv.com, 15 Percentage of words, syllables, phrases Understood Speech Intelligibility Articulation Index www.bksv.com, 16 8 Let’s try a simple measurement with a 2250 www.bksv.com, 17 The model 2250 from Bruel & Kjaer Sound Level Meter Functions Real-Time Frequency Analysis Detailed Noise Level Analysis High Quality Sound Recording Reverberation Time Measurement www.bksv.com, 18 9 Anechoic and Reverberant Enclosures www.bksv.com, 19 860511/1 Typical reverberation times at 500Hz in seconds Speech Music (Average) Churches (Average) Organ music Minimum 0.4 1.0 1.2 1.5 Maximum 1.0 1.6 1.6 2.4 Speech Intelligibility poor in reverberant environment Suitable environment 10 Impulse - Pistol Shot Time www.bksv.com, 21 Speech Clarity Measurement – then and now www.bksv.com, 22 11 Let’s try a simple measurement with a 2250 And a balloon …… www.bksv.com, 23 12 Impulse Response the natural way Processing Unit Receiver Sound Source ROOM What can be improved ? www.bksv.com, 25 Impulse Response - Improvements Processing Unit Receiver Sound Source ROOM What can be improved ? Source/receiver locations Source specifications Receiver specifications Measured parameters www.bksv.com, 26 13 Source Signals for Impulse Response Ideal Impulse (Dirac function) + No postprocessing - Only theoretical Approximated Impulse + Simple, No postprocessing - Directivity, repeatability Random Signal + Simple - Postprocessing, Residual noise MLS Signal + SPL measurement - Postprocessing Sine Sweep Signal + High power - Postprocessing www.bksv.com, 27 MLS - Why? MLS means Maximum Length Sequence It´s a pseudorandom binary sequence, widely used for “white noise” generation The crest factor (Peak/RMS) is low, an advantage for a loudspeaker sound source Convolve with microphone signal to get room impulse response Suppress uncorrelated background noise by increasing sequence length (or repeating sequence) n times Suppression is n in theory Example : n 4 Suppression n 2 6dB www.bksv.com, 28 14 What is DIRAC ? Dual Input Room Acoustics Calculator PC software Single or dual channel measurements Calculates room acoustical parameters Follows ISO 3382 and IEC 60268-16 Paul Adrien Maurice Dirac (1902-1984) The singular delta function was invented by Dirac, and is used in many different areas of mathematics, physics and acoustics. www.bksv.com, 29 DIRAC Measurement (1) Sound Card Calibration Connect Line Out to Line In Start automatic calibration Sound card control and specifications are tested and improved Save calibration data for use in measurements Measure loop-back response (“Dirac” impulse) www.bksv.com, 30 15 DIRAC Measurement (2) www.bksv.com, 31 DIRAC Measurement (3) Measurement Result: Impulse Response .wav file Postprocessing: Parameters are calculated from the .wav file www.bksv.com, 32 16 Room Acoustic Standards Room Parameters ISO 3382 EDT, T20, T30, C80, D50, Ts, LF, LFC, IACC, G Stage Parameters Gade STearly, STlate, STtotal Speech ISO 60268-16 STI, STIPA, STImale, STIfemale, STITEL, RASTI, ALC www.bksv.com, 33 Room Acoustic Parameters - Value examples Recommended values for symphonic music in concert halls Reverberation Time T30 1,7 - 2,3 s Clarity C80 -1 to -3 dB Strength G > 3 dB Early Support STearly > -13 dB Total Support STtotal > -12 dB Limit values for dwellings, public spaces and workspaces Reverberation Time T30 See building regulations Speech Intelligibility RASTI See contract The values are from the ODEON user manual section 7 www.bksv.com, 34 17 Parameters - Speech STI scale STI Value Subjective Scale 1,00 Excellent 0,75 0,60 Good Fair 0,45 Poor 0,30 Bad 0,00 www.bksv.com, 35 Room Acoustic Parameters - Graphs (single) www.bksv.com, 36 18 Room Acoustic Parameters - Graphs (multiple) www.bksv.com, 37 3D Graphs - TSS Waterfall (Time Shifted Spectra) www.bksv.com, 38 19 3D Graphs - TTS Spectrogram (Time Shifted Spectra) www.bksv.com, 39 3D Graphs - CSD Waterfall (Cumulative Spectra Decay) www.bksv.com, 40 20 3D Graphs - CSD Spectrogram (Time Shifted Spectra) www.bksv.com, 41 Only 1 more thing to do with Implulse Response Auralization Anechoic input signal Decay curves is convolved with BRIR 0 -5 -10 -15 0,2 0,25 0,3 0,35 0,4 0,45 0,5 0,55 0,6 time (seconds) Right ear p (%) Binaural Room Impulse Response -20 SPL (dB) p (%) Left ear 60 40 20 0 -20 -40 -60 -80 -25 -30 -35 60 40 20 0 -20 -40 -60 -80 -40 -45 -50 -55 0,2 0,25 0,3 0,35 0,4 time (seconds) 0,45 0,5 0,55 0,6 0 0,2 0,4 0,6 0,8 1 1,2 1,4 Time (seconds rel. direct sound) 1,6 1,8 2 to give sound at receiver Listen using headphones Use for analysis and demonstration www.bksv.com, 42 21 Modeling You can model something that doesn’t exist! You can model something that already exists – and “measure” before you go there. Important: Garbage in Garbage out! 1 2 9 1 0 1 1 1 2 5 1 6 4 4 3 2 1 3 7 8 www.bksv.com, 43 Modeling Applications Concert halls Opera halls Foyers Auditoria Classrooms Open plan offices Stadiums (incl. open air) Room Dimension Gymnasiums Airport terminals greater than Train stations Factory halls 3 Wavelengths www.bksv.com, 44 22 Calculated Results – Measurement Parameters and more Analysis at selected Receiver Auralization www.bksv.com, 45 Modelling Advantage: Tracking down Echoes Directional Decay Directional part of decay shown Activate by using the A shortcut Click on reflection in decay to see its origin Diffuse field if directional decay is 6 dB below energy decay and parallel Non-diffuse field if less than 6 dB difference and narrowing www.bksv.com, 46 23 Easy to do comparisons Multi Point Response Analysis at selected Receivers Comparisons and correlations Noise Control assessment www.bksv.com, 47 Area graphs SPL at 1000 Hz >60.0 58.2 56.8 Grid Response Mapping of Receivers Cumulative statistics Fractile graph 55.4 54.0 52.6 51.2 49.8 48.4 47.0 Cumulative distribution function 95 1 90 45.6 85 80 75 44.2 70 65 Percent 60 42.8 2 55 50 45 41.4 40 35 30 <40.2 Odeonฉ1985-2003 25 20 15 10 5 47 47,5 48 48,5 49 49,5 50 50,5 51 51,5 52 SPL (dB) at 1000 Hz 52,5 53 53,5 54 54,5 55 55,5 56 X(95)-X(5) = 9.3 X(90)-X(10) = 6.2 X(75)-X(25) = 3.5 X(5,95) = (46.9, 56.2) X(10,90) = (49.2, 55.4) X(25,75) = (51.1, 54.6) X(50) = (53.1) Odeon©1985-2003 Fr a c tile s 60 59 You define a Receiver grid by Room surface(s) Receiver height above surface Receiver spacing 58 57 56 55 54 53 SPL (dB) 52 51 50 49 48 47 46 45 44 43 42 41 40 63 Odeon© 1985-2003 125 250 500 1000 Fr e q u e n c y ( H e r tz ) 2000 4000 8000 www.bksv.com, 48 24 Tools to improve your room acoustics Reflector Coverage Shows Reflector coverage Validates Reflector design www.bksv.com, 49 Animation Tools 3D Billard Visualize wave-fronts Investigate scattering effects Investigate possible echo problems www.bksv.com, 50 25 ODEON Animations, Cont. 3D Investigate ray-tracing Verify water tightness of geometry Investigate scattering effects www.bksv.com, 51 ODEON Results - Auralization 1 Examples of Auralization Flutter echo - before and after treatment Underground train station with PA system Classroom with and without acoustic treatment 1 11 10 1 9 2 18 2 8 1 173 12 6 www.bksv.com, 52 26 ODEON Results - Auralization 1 Flutter Echo in Concert Hall 1 Without diffusing panel Diffusing panel removes echo S ourc e: S urfac e: R efl.: P ath <m>: Time <ms>: Odeonฉ 1985-2003 Without diffusor ODEON 0 .0 0 1 *R ec eiver* 3 30.35 88 With diffusor Results - Auralization 2 0 .0 0 4 0 .0 0 6 0 .0 0 8 0 .0 0 1 0 0 .0 0 me tre s 32 10 9 2 8 6 Underground Station Train noise from line source Speech from four loudspeakers www.bksv.com, 54 27 ODEON Underground Station Train stopping Loudspeaker message Noise from passing train Reverberation time 8 s Train anechoic recording Speech anechoic recording www.bksv.com, 55 ODEON School Project Classroom Model www.bksv.com, 56 28 ODEON School Project Original Acoustics www.bksv.com, 57 ODEON School Project Absorption Added www.bksv.com, 58 29 ODEON School Project Absorption and Reflector Added Flutter Echo www.bksv.com, 59 What are Building Acoustics A part of the Community Comfort Market (B&K’s definition) A part of the Architectural Acoustics applications and interior noise and noise control. Concerned with building quality and community noise annoyance Which is a big part of the consulting work done by acoustical consultants www.bksv.com, 60 30 A bit of terminology Noise reduction is the difference between the sound level at point A and point B Transmission Loss is the reduction in sound power as it is transmitted between point A and point B – TL = Lwincident – Lwtransmitted Insertion loss is the difference in sound level before and after a “modification” A B Wt www.bksv.com, 61 Sound Power Transmission Sound Transmission Coefficient = = Wt/Wi Transmission Loss = TL=10*log(1/ Wi www.bksv.com, 62 31 Multiple Layer Walls increase Transmission Loss TL~20log(f)+20log(M) – 47 TL~20*log(Md)+34 (at 500 Hz) At 500 Hz – Solid with M=10kg/sq.m. » 27 dB – Two layers together » 34 dB – Two layers and separate by 10 cm » 40 dB www.bksv.com, 63 Multiple layers introduce new “resonances www.bksv.com, 64 32 Cavity Resonances www.bksv.com, 65 Complex Walls www.bksv.com, 66 33 Sweating the Details www.bksv.com, 67 Standard Ratings of Isolation STC- Standard Transmission Class www.bksv.com, 68 34 Isolation Between Spaces Regulations – Unified Building Code – STC 45 Use Driven – Speech Isolation STC Hearing Quality 25 Normal speech understood 30 Normal speech heard/ Loud speech understood 35 Loud speech heard 42 Loud speech audible 45 Loud speech not audible 50 Stereo just heard www.bksv.com, 69 Isolation Between Spaces (cont.) – NC Goal (or hearing protection) for other than speech isolation » Lp(in source room) –NC=NR » NR=TL+10log(Sw/A) – Select wall construction meeting TL goal from literature » » » » Get manufacturer test data Don’t try to calculate yourself Add 5 dB for safety factor Remember STC is for speech!!! What are you isolating?? www.bksv.com, 70 35 Building Acoustic Measurement Tasks… But also… troubleshooting noise problems (FFT – sound and vibration), assessing noise levels relative to the purpose of the room (Noise Criteria, EDT, Speech Intelligibility, etc.) and occasionally using sound-intensity to identify leaks and noise sources. www.bksv.com, 71 Types of Measurement A Airborne sound insulation ............ S T M Impact sound level …… S T D Facade insulation ............................. Installation noise ..... Reverberation time ........................... www.bksv.com, 72 36 Airborne Sound Insulation - Measurements Source Room Receiving Room Room 1 Room 2 B2 .......Background Noise Level Source Room Level ..........................L1 L2 ...............Receiving Room Level T2 .......................Reverberation Time Partition www.bksv.com, 73 Calculating sound insulation Example: Sound Transmission Loss S is partition area B2 S L2 L1 V T2 V is Receiving Room volume Sound Transmission Loss R = L1 - L2(B2) + 10 log(ST/0.16V) R dB ... this is a 1/3 octave Transmission Loss (TL) spectrum (without the Absorption correction it is called a Noise Reduction (NR) Spectrum) www.bksv.com, 74 37 Calculating sound insulation: weighting Place weighting curve to make sum of Deficiencies < 32dB (1band < 8dB) NRdB Read result STC at 500 Hz Reference curve Hz 500Hz STC: Weighted Sound Transmission Class - single number, e.g. 52 dB www.bksv.com, 75 Impact Sound Level - Measurements Similar to Airborne, except: L1 is not measured Tapping machine is used Source Room Room 1 Receiving Room Room 2 B2 ......Background Noise Level Tapping Machine ................ L2 .............Receiving Room Level T2 ......................Reverberation Time ..............Used only for T2 www.bksv.com, 76 38 Instrument Requirements Pink and white noise generator Measure – 1/3 and 1/1 octave bands (depending on standard) – level and reverberation time spectra Investigator™ Type 2260D – – – – Building Acoustics Software BZ7204 Calculation and display of...... Average of positions Sound reduction spectra (R’, DnT, NR, FTL....) Weighted indices (R’w, DnTw, NIC, FSTC,.....) Reverberation Time and Decay Curves ....according to the following standards – ISO, SS, DIN, ÖNORM, BS, Sia, UNI, NF, UNE, NEN, ASTM The 2260 Investigator has it all www.bksv.com, 77 Now the 2250 and 2270 have it all, too! Single (BZ7228) or Dual Channel Applications available (BZ7229) Single Channel on 2250 or 2270; Dual Channel on Type 2270 ONLY Systems and kits (add-ins) available Same accessory and cables as Type 2260D building acoustics systems With a few advantages… www.bksv.com, 78 39 Type 2250 Single-channel measurements Sound recording • Posibility to add spoken or written comments to measurements • • Optional software: BZ5503 and Qualifier type 7830. Software for reporting and post processing of results from Type 2260D (Building Acoustics Application) www.bksv.com, 79 Type 2270 & 2250 2270 only : • Camera option to document the test environment • Up to two-channels 2270 and 2250 : • Built-in pink and white noise generator • Equalisation of sound source spectra • Position management and sound recording www.bksv.com, 80 40 New for Euronoise 2009 Introducing the new Type 2734 light-weight, high power amplifier – – – – – 7Kg Mass Built-in pink & white noise generator Class D 500 W specification Wireless remote control Wireless source signal transmission www.bksv.com, 81 The Advanced Building Acoustics Analyzer Dual parameter display of L1, L2, B2 or L1-L2 or L2-B2 as well as the current position measurement of a live LZF spectrum Broadband level measurements Simple touch screen navigation between displays. www.bksv.com, 82 41 Results Overview Screen An easy to see overview of the many measurements in a Building Acoustics Project We can now keep track of measurements when we move the source to a second position Touch a warning for its description. Check or uncheck measurements to be included in the calculated results.. www.bksv.com, 83 Results Calculations Screen Select the Calculated spectrum here Show the result with or without the reference curve. See the one number calculated NIC or STC Here www.bksv.com, 84 42 BZ5503 – Archive results as normal Then: Export the results to Excel www.bksv.com, 85 Use BZ5503 to view calculated results www.bksv.com, 86 43 PULSE Reflex Building Acoustics Reporting www.bksv.com, 87 Pulse Reflex – Versatile, Powerful, Intuitive Post Processing Type 2250 Type 2270 Type 2260 www.bksv.com, 88 44 Combine Results www.bksv.com, 89 Export to Qualifier www.bksv.com, 90 45 Freedom to move - Wireless Control Wireless Transmission Kit Pocket Transmitter Through any partition Receiver Power Amplifier 2716 Loudspeaker 4292 www.bksv.com, 91 Sound Sources OmniSource OmniPower 1 Speakers 12 3.5 kg Weight 14 kg 105 dB Lw 122 dB OmniSource is for room acoustics OmniPower is for sound insulation www.bksv.com, 92 46 Let’s take a tour… www.bksv.com, 93 Summing up Today we’ve looked at measuring and modeling Architectural Acoustical behavior. Brüel & Kjær offers a range of tools to assist the acoustician is assessing a condition and offering solutions www.bksv.com, 94 47 25 Years Providing High Quality Building Acoustics Measurement Solutions 1980 1989 1996 2009 48