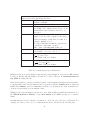
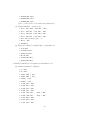
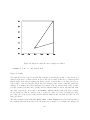
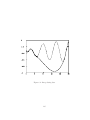
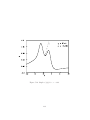
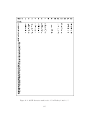
1
MLAB Beginner’s Guide by Daniel Kerner Revision Date: January 17, 2014 c Civilized Software, Inc. 12109 Heritage Park Circle Silver Spring, MD 20906 USA Tel: (301)962-3711 Email: [email protected] URL: http://www.civilized.com PREFACE MLAB Beginner’s Guide is an updated version of the book of the same name written by George A. Hutchinson and George Atta, and revised by Gary Knott and Bruce Krulwich, in the early 1980’s at the National Institutes of Health Division of Computer Research and Technology, Bethesda, MD. The original edition of this book provided an introduction to using the MLAB mathematical modeling program on a DEC PDP-10 mainframe computer. This book provides an introduction to using MLAB on Microsoft DOS/Windows (MSWindows), Apple Macintosh OS7/8/9/X, and Linux with X-Windows computers. Chapter and section names in the Table of Contents, figure numbers in the text and List of Figures, table numbers in the text and List of Tables, and page numbers in the index appear in the color blue and provide clickable links to the respective content. If the reader should find errors in this text, please send an email to [email protected] with a description of the error so that corrections can be made to future editions. Daniel Kerner Silver Spring, MD January, 2014 i Contents 1 A TUTORIAL MLAB SESSION 1 1.1 THE TUTORIAL . . . . . . . . . . . . . . . . . . . . . . . . . . . . . . . . . . . . 1 1.2 SUMMARY . . . . . . . . . . . . . . . . . . . . . . . . . . . . . . . . . . . . . . . . 13 2 NUMERICAL CALCULATION IN MLAB 15 2.1 DATA TYPES . . . . . . . . . . . . . . . . . . . . . . . . . . . . . . . . . . . . . . 15 2.2 SCALAR ASSIGNMENT STATEMENTS AND SCALAR EXPRESSIONS . . . . 16 2.3 FUNCTIONS AND THE FUNCTION COMMAND . . . . . . . . . . . . . . . . . 23 2.4 RELATIONS AND DEFINITION OF FUNCTIONS BY CASES . . . . . . . . . . 26 2.5 RECURSIVE FUNCTIONS AND THE TYPEOUT OPERATOR . . . . . . . . . 31 2.6 INDEXED SUMS, PRODUCTS, AND DEFINITE INTEGRALS . . . . . . . . . . 33 2.7 EVALUATING AND FINDING ROOTS OF EXPRESSIONS . . . . . . . . . . . . 36 2.8 DERIVATIVES OF FUNCTIONS . . . . . . . . . . . . . . . . . . . . . . . . . . . 37 2.9 THE TYPE COMMAND . . . . . . . . . . . . . . . . . . . . . . . . . . . . . . . . 40 2.10 SUMMARY . . . . . . . . . . . . . . . . . . . . . . . . . . . . . . . . . . . . . . . . 41 2.11 EXERCISES . . . . . . . . . . . . . . . . . . . . . . . . . . . . . . . . . . . . . . . 45 3 COMPUTATION WITH MATRICES IN MLAB 3.1 MATRIX ASSIGNMENT STATEMENTS AND MATRIX DIMENSIONS . . . . . ii 47 47 3.2 ENTERING NUMBERS INTO A MATRIX . . . . . . . . . . . . . . . . . . . . . . 49 3.3 GENERATING ARITHMETIC SEQUENCE VECTORS . . . . . . . . . . . . . . 54 3.4 MATRIX MANIPULATION OPERATIONS . . . . . . . . . . . . . . . . . . . . . 58 3.5 MATRIX ARITHMETIC OPERATIONS . . . . . . . . . . . . . . . . . . . . . . . 73 3.6 RANKORDER AND DISTRIBUTION OF VALUES IN A MATRIX . . . . . . . . 81 3.7 TABULATION OF A FUNCTION . . . . . . . . . . . . . . . . . . . . . . . . . . . 83 3.8 LINEAR INTERPOLATION . . . . . . . . . . . . . . . . . . . . . . . . . . . . . . 86 3.9 THE FOR COMMAND . . . . . . . . . . . . . . . . . . . . . . . . . . . . . . . . . 88 3.10 SUMMARY . . . . . . . . . . . . . . . . . . . . . . . . . . . . . . . . . . . . . . . . 91 3.11 EXERCISES . . . . . . . . . . . . . . . . . . . . . . . . . . . . . . . . . . . . . . . 93 4 MAKING PICTURES WITH MLAB 96 4.1 GRAPHICAL DISPLAY CONTROL COMMANDS . . . . . . . . . . . . . . . . . 96 4.2 WINDOW, CURVE, AND TITLE DATA OBJECTS . . . . . . . . . . . . . . . . . 97 4.3 THE DRAW COMMAND . . . . . . . . . . . . . . . . . . . . . . . . . . . . . . . . 105 4.4 THE AXIS COMMAND . . . . . . . . . . . . . . . . . . . . . . . . . . . . . . . . . 126 4.5 THE TITLE COMMAND . . . . . . . . . . . . . . . . . . . . . . . . . . . . . . . . 128 4.6 TITLE MODIFICATION COMMANDS . . . . . . . . . . . . . . . . . . . . . . . . 134 4.7 EXAMINING AND MODIFYING CURVE AND WINDOW DATA ITEMS . . . . 138 4.8 SIMPLIFYING MLAB GRAPHICS . . . . . . . . . . . . . . . . . . . . . . . . . . 142 4.9 SUMMARY . . . . . . . . . . . . . . . . . . . . . . . . . . . . . . . . . . . . . . . . 147 4.10 EXERCISES . . . . . . . . . . . . . . . . . . . . . . . . . . . . . . . . . . . . . . . 148 5 INPUT AND OUTPUT FOR MLAB 5.1 154 FILES . . . . . . . . . . . . . . . . . . . . . . . . . . . . . . . . . . . . . . . . . . . 154 iii 5.2 THE SAVE AND USE COMMANDS . . . . . . . . . . . . . . . . . . . . . . . . . 160 5.3 THE READ, READON, KREAD, AND KSREAD FUNCTIONS . . . . . . . . . . 163 5.4 THE PRINT COMMAND . . . . . . . . . . . . . . . . . . . . . . . . . . . . . . . . 165 5.5 THE PLOTDEV AND PLOT COMMANDS . . . . . . . . . . . . . . . . . . . . . 166 5.6 THE DO COMMAND . . . . . . . . . . . . . . . . . . . . . . . . . . . . . . . . . . 168 5.7 THE IF-THEN-ELSE COMMAND . . . . . . . . . . . . . . . . . . . . . . . . . . . 171 5.8 THE MENUCHOICE, GETSTRINGS, and WREAD COMMANDS . . . . . . . . 177 5.9 SUMMARY . . . . . . . . . . . . . . . . . . . . . . . . . . . . . . . . . . . . . . . . 183 5.10 EXERCISES . . . . . . . . . . . . . . . . . . . . . . . . . . . . . . . . . . . . . . . 184 6 FURTHER MATRIX OPERATORS 189 6.1 MATRIX COMBINATION . . . . . . . . . . . . . . . . . . . . . . . . . . . . . . . 189 6.2 MODIFYING DATA FOR ANALYSIS AND DISPLAY . . . . . . . . . . . . . . . 194 6.3 SHADING AREAS OF A POLYGON CURVE . . . . . . . . . . . . . . . . . . . . 200 6.4 SURFACE CONTOURS . . . . . . . . . . . . . . . . . . . . . . . . . . . . . . . . . 203 6.5 EIGENVALUES, EIGENVECTORS, AND COMPLEX NUMBERS . . . . . . . . 208 6.6 SINGULAR VALUE DECOMPOSITION OF A MATRIX . . . . . . . . . . . . . . 213 6.7 COVARIANCE AND CORRELATION . . . . . . . . . . . . . . . . . . . . . . . . 215 6.8 DISCRETE FOURIER TRANSFORMS . . . . . . . . . . . . . . . . . . . . . . . . 217 6.9 SUMMARY . . . . . . . . . . . . . . . . . . . . . . . . . . . . . . . . . . . . . . . . 221 6.10 EXERCISES . . . . . . . . . . . . . . . . . . . . . . . . . . . . . . . . . . . . . . . 223 7 CURVE-FITTING IN MLAB 225 7.1 SUM-OF-SQUARED-ERROR CRITERION FOR CURVE-FITTING . . . . . . . 226 7.2 WEIGHTED-SUM-OF-SQUARED-ERROR CRITERION . . . . . . . . . . . . . . 229 iv 7.3 EWT OPERATOR . . . . . . . . . . . . . . . . . . . . . . . . . . . . . . . . . . . . 233 7.4 FUNCTIONAL FORMS OF SEVERAL VARIABLES . . . . . . . . . . . . . . . . 236 7.5 JOINT MODELS OF SEVERAL FUNCTIONAL FORMS . . . . . . . . . . . . . 236 7.6 THE CONSTRAINTS COMMAND . . . . . . . . . . . . . . . . . . . . . . . . . . 238 7.7 GENERAL PROBLEM OF CURVE-FITTING A FUNCTIONAL FORM . . . . . 241 7.8 PREPARING DATA FOR CURVE-FITTING OPERATIONS . . . . . . . . . . . . 241 7.9 THE FIT COMMAND . . . . . . . . . . . . . . . . . . . . . . . . . . . . . . . . . . 244 7.10 THE FIT COMMAND CONTROL VARIABLES . . . . . . . . . . . . . . . . . . . 251 7.11 FORMULATING FUNCTIONAL FORM MODELS . . . . . . . . . . . . . . . . . 253 7.12 LINEAR MODELS . . . . . . . . . . . . . . . . . . . . . . . . . . . . . . . . . . . . 257 7.13 STATISTICAL CONSIDERATIONS FOR CURVE-FITTING . . . . . . . . . . . . 259 7.14 CURVE-FITTING SEARCH STRATEGIES . . . . . . . . . . . . . . . . . . . . . . 260 7.15 INITIAL PARAMETER ESTIMATES FOR NONLINEAR MODELS . . . . . . . 271 7.16 SUMMARY . . . . . . . . . . . . . . . . . . . . . . . . . . . . . . . . . . . . . . . . 273 7.17 EXERCISES . . . . . . . . . . . . . . . . . . . . . . . . . . . . . . . . . . . . . . . 275 8 SYSTEMS OF DIFFERENTIAL EQUATIONS IN MLAB 280 8.1 A FIRST ORDER DIFFERENTIAL EQUATION SOLVED IN MLAB . . . . . . . 280 8.2 COUPLED FIRST-ORDER DIFFERENTIAL EQUATIONS SOLVED IN MLAB 8.3 HIGHER ORDER DIFFERENTIAL EQUATION SOLVING IN MLAB . . . . . . 290 8.4 CONTROLLING THE DIFFERENTIAL EQUATION SOLVER . . . . . . . . . . 293 8.5 AN EXAMPLE OF CURVE-FITTING A DIFFERENTIAL EQUATION . . . . . 298 8.6 AN EXAMPLE OF A BOUNDARY VALUE DIFFERENTIAL EQUATION . . . 300 8.7 THE FIT COMMAND FOR DIFFERENTIAL EQUATIONS . . . . . . . . . . . . 301 8.8 SUMMARY . . . . . . . . . . . . . . . . . . . . . . . . . . . . . . . . . . . . . . . . 302 8.9 EXERCISES . . . . . . . . . . . . . . . . . . . . . . . . . . . . . . . . . . . . . . . 307 v 283 A FONT TABLES 314 B LIST OF TABLES 326 C LIST OF FIGURES 331 D BIBLIOGRAPHY 335 E INDEX 336 vi Chapter 1 A TUTORIAL MLAB SESSION In this first chapter, we will go through a simple MLAB session from beginning to end. In order to show many different aspects of MLAB, only brief explanations of commands are given. MLAB can run on many different types of computers. Initially, of course, you must carry out the appropriate steps needed to install MLAB on your computer. These steps are detailed in the installation instructions provided with the MLAB distribution. 1.1 THE TUTORIAL If the operating system on your computer has a graphical user interface (i.e. MSWindows or Macintosh), double click on the MLAB icon on the Desktop to begin the MLAB session. If the operating system on your computer has a command line interface (Linux/Unix or DOS), type the command mlab in response to the operating system prompt in a bash-shell or DOS command window to begin the MLAB session. A response similar to the following should appear on the display screen or in a new window: MLAB: Mathematical Modeling System, Revision: November 5, 2013 Executing file: /usr/local/lib/mlab/mlab Copyright: Civilized Software, Inc. (301)962-3711, email:[email protected] Web-site: WWW.CIVILIZED.COM Tue Nov 5 11:00:03 2013 Your current working directory: is C:\Users\csi\mlab\ Use FILEDIR to reach any other directory. ’* ’ is the command prompt This copy of MLAB belongs to csi 1 Type ’exit’ to exit from MLAB, or type another MLAB command. * In this Beginner’s Guide, text that the user types at the keyboard and text that the computer produces itself are typed in BOLD TYPEWRITER FONT. MLAB will then display a menu with the three options: • Look at a list of MLAB demonstration do-files. • Go to top-level MLAB. • Display some tips on using MLAB. (This is done by executing the do-file STARTUP.DO.) Selecting the first option causes MLAB to execute the do-file MLABEX.DO in the EXAMPLES sub-directory; MLABEX.DO displays a menu of example scripts, many of which are explained in separate chapters of the MLAB Application Manual. Selecting an example script from the menu will execute the script, and then recursively executes the MLABEX.DO script. While executing an example script, MLAB may pause occasionally to display instructions or a graph; strike any key on the keyboard to continue. Selecting the second option causes MLAB to terminate the STARTUP.DO script file and wait for a command. Selecting the third option causes MLAB to print a list of suggestions on how to proceed with MLAB. Striking the RETURN/ENTER key or clicking the CONTINUE button causes MLAB to execute the do-file MLABEX.DO, which was described previously. [Note, if you edit the file STARTUP.DAT in the directory where the MLAB application resides, type a number–i.e. ”1”–in the file, and save the file, then when the script STARTUP.DO is executed in future MLAB sessions, MLAB will simply go to top-level.] For the purpose of this tutorial, select the second option–Go to top-level MLAB. That will print an asterisk on the last line of the MLAB command window. This asterisk (*) is MLAB’s prompt for the user to enter an MLAB command. It may matter whether you type upper or lower case characters for MLAB commands; the MLAB system interprets non-system variables in the case typed, unless the variable CASESW is 0. In this tutorial, type all characters in either upper-case or lower-case. In general, a carriage return is to be typed at the end of any complete line of input to MLAB. On some computer keyboards, the carriage return key is marked ENTER; on others it is marked 2 RETURN. If an MLAB command is too long to type on a single line, you can type a backslash (\) to continue the command on the next line. MLAB will print a colon (:) as a prompt on each continuation line. The last line of the continued command should be followed by a carriage return as usual. Beware, you should end each line being continued with a blank just before the backslash to avoid unintended run-on text on the next line. You can also type several MLAB commands on the same line if you separate them by semicolons (;). If you type an MLAB command incorrectly, you will receive an error message. DOS, MSWindows, and Macintosh OS7/8/9 versions of MLAB invoke a built-in line editor so that you can edit the errant command. On Linux/Unix and Macintosh OSX systems, the error is usually corrected by retyping the command correctly. If typographical errors are noticed before a carriage return is typed, correct them by striking the BACKSPACE key until the text cursor has backed up to the first error; then continue to type from there. On DOS and MSWindows, holding down the SHIFT and CTRL keys and simultaneously striking the BREAK key will interrupt MLAB execution, print the message: Command in progress aborted. Safest Action: type EXIT, then restart MLAB. Riskier but often worthwhile: Save your data objects (SAVE IN MYFILE), then EXIT, restart MLAB, and restore the objects (USE MYFILE). and return to the MLAB command prompt (*). On Linux/Unix and Macintosh OSX systems, holding down the CONTROL key and simultaneously striking the C key, i.e. ^C (CONTROL-C), interrupts MLAB execution, and causes MLAB to print the message: Do you really want to quit MLAB? [y:YES, *:NO]: If you strike the y key, the MLAB session will be terminated; otherwise, MLAB prints the message: Resume calculation or return to top level? [t:TOP LEVEL, *:RESUME]: If you strike the t key, MLAB prints the message: Command in progress aborted. Safest Action: type EXIT, then restart MLAB. Riskier but often worthwhile: Save your data objects (SAVE IN MYFILE), then EXIT, restart MLAB, and restore the objects (USE MYFILE). 3 and returns to the * prompt; otherwise, MLAB resumes the interrupted calculation. Note, you can also suspend an MLAB session and return to the bash-shell prompt by typing ^Z (CONTROL-Z). After typing any bash-shell commands, you can return to the suspended MLAB session by typing fg. On Macintoshes with OS7/8/9 or OSX, MLAB can be forced to quit by holding down the Option and Apple keys and simultaneously striking the ESC key. The Macintosh Finder will then display a dialog box with a list of currently running programs; select MLAB in the list and click FORCE QUIT button to terminate MLAB. This manual focuses on explaining and presenting examples for MLAB statements and operators. Generally these examples are given in the context of keyboard input. In practice, you will find that constructing, modifying, and using “scripts” of MLAB commands (called do-files) is the most common and convenient way of using MLAB, particularly for complex and/or repetitive computations. Our introductory problem concerns the exponential law: y = a · eb·x which describes some simple growth phenomena. This relation is illustrated by the dry weights of chick embryos from ages 6 to 15 days recorded in Table 1.1: Ages in Days (x) 6 7 8 9 10 11 12 13 14 15 Dry Weights in Grams (y) .111 .078 .095 .126 .243 .180 .202 .387 .465 .831 Table 1.1: Simulated chick embryo weight data. Our objective is to make a graph showing these data points together with the exponential curve best approximating the variation in dry weights with age. First, enter the data by following the MLAB dialog below. In general, lines beginning with asterisks contain MLAB commands which you are to enter; other lines are the responses which you should see appear as a result of typing the indicated commands. 4 * DAY = 6:15 * DAY COL 2 = LIST(.111,.078,.095,.126,.243,.180,.202,.387,.465,.831) * TYPE DAY The computer response to these commands is to create a 10 row by 2 column matrix (rectangular array of numbers) called DAY and to type its contents as follows: DAY: a 1: 2: 3: 4: 5: 6: 7: 8: 9: 10: 6 7 8 9 10 11 12 13 14 15 10 by 2 matrix 0.111 0.078 0.095 0.126 0.243 0.180 0.202 0.387 0.465 0.831 The first number in each line indicates the row number of the matrix. The numbers in the column to the right of the row numbers are the ages of the embryos. The numbers in the right-most column are the corresponding dry weights of the embryos. Check the entries of matrix DAY. If any are incorrect, type the MLAB command: DELETE DAY and then retype the above MLAB commands in order to define the matrix DAY correctly. (Later you will learn easier ways to make corrections to matrices.) Our next objective is to display the data on the computer screen. Type the MLAB commands: * DRAW CA = DAY, POINTTYPE TRIANGLE, LINETYPE NONE * VIEW The first command causes the 10 by 2 data matrix DAY to be plotted as a list of 10 points in the (x, y) coordinate plane, with a small triangle drawn at each data point. The second command causes the picture of Figure 1.1 to show in a separate window on Linux/Unix with X-Windows, Macintosh, or MSWindows systems, or on the entire display screen of DOS systems. On Linux/Unix with X-Windows, Macintosh, and MSWindows systems, type the command: * UNVIEW 5 Figure 1.1: Plot of dry weights vs age. 6 to make the graphics window go away or click the close-box in the graphics window. On DOS systems, the picture will go away if you strike any key. The next set of commands will define the model; that is, describe the family of exponential curves by its functional form. Recall that the equation of an exponential curve has the form: y(x) = a · exp(b · x) where a and b are parameters of the curve. To fit an exponential curve to our data, we must first define the general equation of the exponential curve. Since we do not know the correct values of the parameters a and b of the exponential curve that best approximates the data, we assign initial values for later modification. You must guess these values. Type the following MLAB commands: * FUNCTION Y(X) = A*EXP(B*X) * A = .003 * B = .4 Of course, other initial guesses for the parameters A and B in the above MLAB commands could have been used. In MLAB, the parameters of a model may have constraints. For example, we may want to specify that the parameters A and B of the exponential curve approximating the data must have positive values. Use the MLAB command: * CONSTRAINTS CS1 = {A > 0, B > 0} to create a set of constraints. The constraints A > 0 and B > 0 are now named; that is, they are members of a set of constraints called CS1. We are now prepared to fit the exponential curve to our data, the matrix DAY. That is, we want to estimate the parameters A and B such that the corresponding curve passes as near as possible through the data points. For the moment, we will not describe the precise method of measuring nearness of a curve to given points (called the least-squares method). First, give the MLAB command: * FIT (A,B), Y TO DAY The response to this command is a computation of the parameter values corresponding to the best-fitting exponential curve. 7 final parameter values value error dependency 0.0050847413 0.0029804036 0.9897411712 0.334188183 0.042492703 0.9897411712 4 iterations CONVERGED best weighted sum of squares = 3.465262e-02 weighted root mean square error = 6.581472e-02 weighted deviation fraction = 1.251451e-01 R squared = 9.297622e-01 parameter A B In addition to other information, the response specifies best-fitting parameter values of .0050847413 for the parameter A and .334188183 for the parameter B. In fact, A and B have been changed to these new values, as you can see by typing the MLAB command: * TYPE A,B and observing the output: A = 5.08474129E-3 B = .334188183 In order to draw the best-fitting curve, we create a new matrix of (x, y) coordinates by typing in the following MLAB commands: * M = 6:15:.05 * M = POINTS(Y,M) This creates M as a two-column matrix which can be regarded as a list of 181 points in the (x, y) plane which lie on the best fitting exponential curve. Redisplay Figure 1.1 with the fitted exponential curve by typing the MLAB commands: * DRAW CB = M * VIEW This causes a curve segment (called CB) that is part of the best-fitting exponential curve defined by the points in M to be drawn in the default window on the screen. The result is shown in Figure 1.2. 8 Figure 1.2: Data points and best-fitting exponential curve. 9 Figure 1.3: Best-fitting exponential curve, suited for publication. 10 Suppose that this is sufficient analysis of the chick embryo data for our purposes. However, we would like to redraw our present picture as in Figure 1.3, which is more satisfactory for publication or for a permanent record. The curve can be rescaled, and the titles added, by typing the commands shown below. On Linux/Unix with X-Windows, Macintosh, and MSWindows systems, each graphics command will cause the part of the picture being modified to be displayed. * * * : * * * * : * WINDOW 0 TO 20, 0 TO 3 DRAW CB = POINTS(Y,0:20:.1) TITLE CC1 = "DRY WEIGHTS OF CHICK EMBRYOS", AT (0,3.3) WORLD \ SHIFT .35 TITLE CC2 = "FROM AGES 6 TO 15 DAYS" AT (0,3.15) WORLD SHIFT .4 BOTTOM TITLE "Ages in Days" LEFT TITLE "Weight in Grams" TITLE CF = "Y = .0051*EXP(.3342*X)" AT (16.5,1.5) WORLD ANGLE \ (180/PI*ATAN2(Y(18)-Y(16.5),3/20)) SIZE .013 VIEW After these commands, Figure 1.3 is displayed on the screen. The first command dimensions the MLAB window in the (x, y) plane so that it covers x in the interval of 0 to 20 and y in the interval of 0 to 3. The fitted curve CB is then redrawn for x in the interval 0 to 20. The TITLE commands are used to place the picture labels. Note that picture labels may use upper and/or lower case characters and be written in different sizes and at different angles. Also note the method used to calculate the angle for the title CF, and how this calculation took the user rectangle size into account. The identifier PI has a value approximating the transcendental number 3.141592654... The ATAN2 operator, as well as the other commands and operators used here, will be explained later. In order to make a permanent record of this picture as a PostScript file, type the MLAB command: * PLOT and observe the response: PLOT file is mlabp0.ps The response to the PLOT command gives the name of the plot file containing the saved picture, which is mlabp0.ps unless you have already created a file with that name. If the plot file mlabp0.ps exists, the first unused name in the sequence mlabp1.ps, mlabp2.ps, etc., is selected. To print the PostScript file on a printer supporting the PostScript language, type the command: 11 * PRINT FILE "mlabp0.ps" to which MLAB responds: file printed: mlabp0.ps You could also generate a Hewlett Packard PCL printer language file of an MLAB picture, or embed the PostScript language picture file in a document, using any of several methods. We will defer discussion of the required steps to Section 5.5. The dialog of the MLAB session can be scrolled for review from the MLAB prompt. With DOS and MSWindows MLAB, strike the up and down arrow keys and the Page Up and Page Down keys to scroll backwards and forwards. If you position the text cursor on a line and strike the Insert key, the line that the text cursor is on will be copied to the built-in line editor so that you may edit the line that the text cursor was on and create a new MLAB command. With Linux/Unix and Macintosh OSX MLAB, move the elevator-scroll-box on the side of the bash- or Darwin-shell window up or down with the mouse pointing device to review the MLAB session history. Striking the up- and down-arrow keys will bring previous MLAB commands of the current session to the command line. When a previous command is brought to the current command line in this manner, it can be edited by moving the text cursor anywhere in the command line with the left- and right-arrow keys, and then typing or deleting characters. The Insert key on the keyboard will toggle the keyboard between Insert and Overwrite modes. With Macintosh OS7/8/9 MLAB, move the elevator-scroll-box with the mouse pointing device to view MLAB commands and responses from earlier in the current MLAB session. Descriptions of many MLAB functions can be obtained with the HELP command. Type HELP at the MLAB prompt to get an overview of the help system, or type HELP <topic>, where <topic> is an MLAB statement or function name for information on the specific topic. (It is preferable, however, to use the MLAB Reference Manual to obtain the definitive description of the commands and functions provided by MLAB.) You are almost ready to complete this MLAB session and return control to the computer’s operating system. Let us suppose that you first wish to save the matrices, the current picture, and other data that you have defined so that they may be used in another MLAB session. You can save the information in a computer disk file named TUTOR1.SAV by typing the following MLAB command: * SAVE Y, M, A, B, DAY, CS1, W IN TUTOR1 to which MLAB responds 12 creating save file: TUTOR1.SAV The data in TUTOR1.SAV can be retrieved during this or a future MLAB session using the command: USE TUTOR1 You can now terminate the MLAB program and return to the operating system by typing * EXIT On computer systems with a graphical user interface, you can also terminate the MLAB program by the usual method of terminating an application. (i.e. select QUIT from the FILE menu or click the close box in the title bar of the MLAB command window.) When MLAB begins, it opens a file called MLAB.LOG and writes all subsequently-typed input and printed output to that file. Any previously-existing file named MLAB.LOG will be renamed to MLAB0.LOG; any file named MLAB0.LOG will first be shifted to be MLAB1.LOG; any file named MLAB1.LOG will first be shifted to be MLAB2.LOG; any file named MLAB2.LOG that is replaced by MLAB1.LOG will be deleted. The computer disk file MLAB.LOG now contains the session log, which you can print using a print utility program. In DOS, this is done by typing PRINT MLAB.LOG. For Linux/Unix, Macintosh, or MSWindows, you can open and print the MLAB.LOG file with any text editor or word processing program you have available. You can also rerun MLAB and type PRINT FILE MLAB0.LOG. (Do you see why we print MLAB0.LOG instead of MLAB.LOG?) Note that in this introductory example, MLAB commands are typed directly. This interactive mode of operation is useful when one-time exploratory computations are to be done, and this is the way the examples in the next few chapters will be presented. Generally, however, it is most convenient to construct a do-file of MLAB commands with the text-editor facility in MLAB (under DOS or MSWindows), or with a parallel running editor program (in other environments). You can repetitively execute such a do-file and revise it to construct a useful reusable script. Do-files are discussed in Chapter 5, but you may wish to gain practice with this mode of operation immediately. It is highly recommended that you use do-files; the added convenience obtained is well-worth the small effort needed to learn to construct them. 1.2 SUMMARY This chapter has shown a typical simple use of MLAB to make numerical calculations, manipulate matrices of numbers, fit curves to data, prepare graphical displays of the results, and save currently 13 defined variables for use in a subsequent MLAB session. The full MLAB system can analyze much more complicated models, including models defined by systems of ordinary differential equations. It also has capabilities for numerical calculation approaching those of computer programming languages, and generally far more convenient. 14 Chapter 2 NUMERICAL CALCULATION IN MLAB The basic methods for calculation of numerical values in MLAB will be considered in this chapter. 2.1 DATA TYPES In the Chapter 1 introductory tutorial, it was seen that MLAB users can create numerical data either as individual numbers called scalars (e.g., A, B) or as rectangular arrays of numbers called matrices (e.g., M, DAY). Two forms of symbolic data were also shown, namely, user-defined functions (e.g., Y) and constraint sets (e.g., CS1). There are twelve data types in MLAB: scalar, matrix, string, string array, function, constraint set, initial condition, window, curve, title, 3D-window, and surface. These MLAB data types will be discussed in the appropriate places. The individual data item names, chosen by the user, are called identifiers. Like most computer languages, MLAB considers arbitrary sequences of letters and digits to be identifiers, provided that the first character is a letter. In Macintosh and Linux/Unix, identifiers may be up to 35 characters long; in MSWindows, identifiers may be up to 27 characters long; and in DOS, identifiers may be up to 15 characters long. For example, X, AREA, T23A8, or PICTURE11 are valid identifiers, but 6AU4A is not. At each moment during an MLAB session, each identifier corresponds to at most one data item (scalar, matrix, etc.). It is called a scalar identifier if it corresponds to a scalar data item, a matrix identifier if it corresponds to a matrix data item, and an unknown identifier if it does not correspond to any data item. One can use appropriate MLAB commands to create data items or change existing data items of the twelve possible types by referring to identifiers that one has selected. 15 MLAB scalars and matrix entries are real numbers with a precision of approximately sixteen digits. A nonzero MLAB scalar or matrix entry must have a magnitude approximately in the range 2.225 × 10−308 to 1.798 × 10308 MLAB constants may be written in ordinary decimal notation, for example, -43.76, 12, or .003 Scientific notation may also be used, where powers of 10 are preceeded by the capital letter E, as in the following examples: 6.3E23 for 6.3 × 10²³ , -2E-5 for −2 × 10⁻⁵ The number following the E must be an integer between −308 and 308. Scalar constants are the simplest type of scalar expressions. A scalar expression may be roughly described as an algebraic or symbolic description of a number. The MLAB user constructs scalar expressions to describe the numerical calculations that are to be performed via MLAB. 2.2 SCALAR ASSIGNMENT STATEMENTS AND SCALAR EXPRESSIONS The MLAB assignment command is the most important method for making identifiers correspond to scalars or matrices in MLAB. For example, the MLAB assignment commands: * A = .003 * B = .4 in the tutorial section of Chapter 1 caused the unknown identifiers A and B to become scalar identifiers with the values .003 and .4 respectively. Blanks to the left or right of the equal sign have no effect, and are optional. The scalar assignment command is summarized in Table 2.1. For scalars, the two forms of the assignment command are: (unknown identifier) = (scalar expression) (scalar identifier) = (scalar expression) An underscore symbol (_) may be substituted for an equal sign (=) to indicate an assignment. Table 2.1: Scalar assignment command. 16 The commands A = .003 and B = .4 above are of the first type. Suppose that the next command of the tutorial session had been: * B = A+3 This command would have been of the second type, changing the value of the scalar B from .4 to 3.003 since the scalar expression A+3 represents the number .003 + 3 = 3.003. The second form of the assignment command can be self-referring. For example, the command: * B = B/2 gives B a new value equal to half the current value. The examples A+3 and B/2 above suggest the first two rules for constructing and evaluating scalar expressions. First, scalar constants are scalar expressions which are always evaluated to their indicated numeric value, and scalar identifiers are scalar expressions which are evaluated to their current value within the MLAB session. Second, scalar expressions can be constructed by symbolically indicating the arithmetic operations of addition (+), negation or subtraction (-), multiplication (*), division (/), and raising to a power (^ or **). The circumflex (^) here means the character SHIFT-6 present on most keyboards, not a control character. For example, assuming that all identifiers below are scalars, the following are scalar expressions: 1.5-2*XA, 3.3 ^4, MASS/WIDTH*DEPTH+K1 Note that blanks may be inserted between identifiers and operations in MLAB expressions; they are ignored. Scalar expressions involving two or more arithmetic operations may have several possible evaluations. For example, does 2 ^3-1 have value 7 or 4? As in algebraic notation and most programming languages, two methods of removing the ambiguity are available. First, parentheses may be used to explicitly specify the order of operations. For example, the scalar expressions (2 ^3)-1 and 2 ^(3-1) express the two possible interpretations of 2 ^3-1, and the operation within the parentheses is performed first in each case. Complicated scalar expressions may have nested parentheses, with expressions inside parentheses evaluated in turn to obtain the final value. For example, the MLAB scalar expression: * (A0+((2*A1)*T))+(A2*(T*T)) corresponds to the algebraic expression usually written as: a0 + 2a1 t + a2 t2 . 17 Note that multiplication, which is denoted by juxtaposition in algebraic notation, must be explicitly specified with an asterisk for a multiplication sign in MLAB. Second, where parentheses are not given (it may be cumbersome to parenthesize a complicated scalar expression fully), MLAB follows the usual algebraic hierarchy of operations. That is, raising to a power is performed first, then multiplications and divisions are performed from left to right, and, finally, additions and subtractions are performed from left to right. For example, A0+2*A1*T+A2*T*T is also an MLAB scalar expression which is equivalent to the algebraic expression shown above. As in most programming languages, the elementary functions of the real numbers are available in MLAB. Some examples of mathematical expressions and corresponding MLAB expressions are given below: sin2 (ax) + cos2 (bx) 1/3 loge (y + √ (a + x/c) ) βz + 1 | exp(x) − arcsin(x)| becomes becomes becomes becomes SIN(A*X) ^2+COS(B*X) ^2 LOG(Y+(A+X/C) ^(1/3)) SQRT(BETA*Z+1) ABS(EXP(X)-ASIN(X)) Of course, some scalar expressions are undefined for certain real numbers when such operations as division by zero, logarithm of a negative number, etc., are called for. Even if mathematically defined, the computed result may cause arithmetic overflow (EXP(500) > 1.7 × 10308 , for example), or may be numerically meaningless (for example, SIN(10 ^50) will not compute accurately since the argument has only sixteen digit precision). During scalar expression evaluation, warning messages will be issued if overflow occurs or undefined functions are found. In such cases, computationally-plausible results are taken as the results and the expression evaluation process continues. [This can be an important aid in some situations. Warning may also be given for the underflow condition, where a number of magnitude less than 2 × 10−308 is computed during a scalar expression evaluation (computation continues with zero replacing the scalar value causing underflow). The MLAB user should be aware of the possibility of numerical inaccuracy, and should exercise due caution in the choice of scalar expressions for computation.] Theoretically, every MLAB scalar expression can be constructed step by step, beginning with scalar identifiers and scalar constants and then applying the notational rules in some order. In practice, correct MLAB expressions can be written directly by using the familiar algebraic notation. Whenever a notational rule is introduced, the numerical operation it describes must also be known. Let SE1, SE2, etc., indicate both the names and the numerical values of the scalar expressions in this discussion. We may now present some of the more common scalar operators available in MLAB. Table 2.2 summarizes the scalar arithmetic notational rules. Table 2.3 summarizes the common trigonometric functions in MLAB; Table 2.4 summarizes the common inverse trigonometric functions in MLAB; Table 2.5 summarizes the logarithmic, exponential, and hyperbolic trigonometric functions in MLAB; and Table 2.6 summarizes some commonly-used special functions. In general, this book does not discuss all the operators and functions available in MLAB; please refer to the MLAB Reference Manual for a complete definition of every operator and function in MLAB. 18 The arithmetic notational rules and the corresponding numerical calculations are described in this chart. Overflow or underflow may occur. SE1 + SE2 sum SE1 + SE2 is computed. -SE1 negative -(SE1) is computed. SE1-SE2 difference SE1 - SE2 is computed. SE1*SE2 product SE1 * SE2 is computed. SE1/SE2 quotient SE1 / SE2 is computed. division by zero may occur. SE1 ^SE2 Either ** or ^ may be used. Let a =SE1 and b =SE2. b>0 ab = a ∗ a ∗ ... ∗ a (b times) b = integer b=0 ab = 1 for a 6= 0 b<0 1/(a−b ) b = integer b 6= integer exp(b ∗ log(a)) for a > 0 0 for a = 0, b ≥ 0 (SE1) equals SE1. Table 2.2: Scalar arithmetic notational rules. For example, the parenthesis rule applied to A-1 states that (A-1) is a scalar expression. Moreover, 1.05*(A-1) is a scalar expression by the rule SE1*SE2. In general, parentheses are used for intermediate scalar expressions rather than for the final expression. The following trigonometric functions may be used to form scalar expressions: SIN(SE1) sine of angle SE1 measured in radians COS(SE1) cosine of angle SE1 measured in radians TAN(SE1) tangent of angle SE1 measured in radians SIND(SE1) sine of angle SE1 measured in degrees COSD(SE1) cosine of angle SE1 measured in degrees TAND(SE1) tangent of angle SE1 measured in degrees All of the functions above are defined everywhere but are meaningless for arguments of large magnitude. Table 2.3: Trigonometric functions. 19 The following inverse trigonometric functions may be used to form scalar expressions: ASIN(SE1) arcsine of SE1 measured in radians from −π/2 to π/2 defined for SE1 from −1 to 1 ACOS(SE1) arccosine of SE1 measured in radians from 0 to π defined for SE1 from −1 to 1 ATAN(SE1) arctangent of SE1 measured in radians from −π/2 to π/2 defined for all SE1 ATAN2(SE1,SE2) arctangent of SE1/SE2 defined as the angle z measured in radians, −π ≤ z < π, formed from the positive x-axis and the ray from the origin passing through the point (SE1,SE2) in the (x, y)-plane. ATAN2(0,0) equals 0 (by convention) Table 2.4: Inverse trigonometric functions. The following logarithmic and exponential functions may be used to form scalar expressions: LOG(SE1) natural logarithm of SE1 defined for SE1> 0 LOG10(SE1) base 10 logarithm of SE1 defined for SE1> 0 EXP(SE1) exponential function, exp(x), for x = SE1 defined for −709 < SE1 < 709; overflow for larger values; underflow for smaller values. SINH(SE1) hyperbolic sine of x =SE1, (exp(x) − exp(−x))/2, defined for −709 < SE1 < 709, overflow otherwise COSH(SE1) hyperbolic cosine of x = SE1, (exp(x) + exp(−x))/2, defined for −709 < SE1 < 709, overflow otherwise TANH(SE1) hyperbolic tangent of x = SE1, (exp(x) − exp(−x))/(exp(x) + exp(−x)), defined for all SE1 Table 2.5: Logarithmic, exponential, and hyperbolic trigonometric functions. Random numbers are often useful in testing mathematical models. Successive use of the MLAB RAN operator (summarized in Table 2.7) will generate numbers in a pseudo-random series. Each use of RAN(0) will return the next value from the series in use, while RAN(n), for n 6= 0, will begin a new series which will be a function of n. The user of random numbers should be aware that there is a theoretical difference between pseudorandom and random numbers. The algorithm by which pseudo-random numbers are produced in 20 Certain commonly-used special functions can be employed in scalar expressions as follows: ABS(SE1) absolute value of x = SE1, |x|, defined for all SE1 SQRT(SE1) square root of SE1 defined for SE1 > 0 INT(SE1) the largest integer y such that y ≤ SE1, defined for all SE1. Note: INT(-1.5) is −2, not −1. In mathematics texts sometimes denoted by ⌊x⌋ for real x. MOD(SE1,SE2) If SE1 and SE2 are positive integers of sixteen digits or less, the value computed is the integer division remainder of SE1 divided by SE2. For example, MOD(18,5) = 3. For any scalars SE1 and SE2 the expression is equivalent to SE1 if SE2 = 0 and to SE1 - SE2 * INT(SE1/SE2) if SE2 6= 0. LOGGAMMA(SE1) natural logarithm of Γ(SE1) defined for all SE1 except SE1 = −n for (n = 0, 1, 2, ...) ERF(SE1) error Rfunction: ( √2π ) 0x exp(−t2 )dt for x =SE1, defined for all SE1. GAUSSF(SE1) normal probability function: Rx 2 ( √12π ) −∞ exp(− t2 )dt for x =SE1, defined for all SE1. Table 2.6: Commonly-used special functions. MLAB is based upon an algorithm for uniform (0, 1) random numbers derived from ”Efficient and Portable Combined Random Number Generators” by Pierre l’Ecuyer, in Communications of the ACM 31 (1988) 742-749. Often, it is desirable to generate normal (0, 1) pseudo-random numbers having mean 0 and variance 1. Such normal pseudo-random numbers may be generated with the NORMRAN function defined in MLAB. The NORMRAN operator is summarized in Table 2.8. Normal pseudo-random numbers are often used in generating error in simulated data. MLAB provides random number generators for more than 20 different distribution functions. See the MLAB Reference Manual or type HELP RANDOM at the MLAB prompt for a complete listing. In mathematical text, the elements of a matrix are often denoted by the use of subscripts. For example, the entries of a 2 row by 3 column matrix A may be labelled in the following way: 21 The RAN operator has the form: RAN(SE1) RAN returns a pseudo-random number from a series of such numbers. If SE1 = 0 then the next value along the current series is returned. If SE1 6= 0 then a new series is started which will be a function of SE1. Table 2.7: Random number operator. The NORMRAN operator has the form: NORMRAN(SE1[,SE2[,SE3]])) NORMRAN returns a pseudo-random number from a series of such numbers. If SE1 = 0 then the next value along the current series is returned. If SE1 6= 0 then a new series is started which will be a function of SE1. SE2 and SE3 are optional values specifying the mean and variance, respectively, of the normally-distributed random numbers. If not supplied, SE2 defaults to zero and SE3 defaults to 1. Table 2.8: Normal random number operator. a1,1 a2,1 a1,2 a2,2 a1,3 a2,3 so that, for example, the element in row i + 1 and col j of A, for appropriate integers i and j would be denoted by ai+1,j . In MLAB, parentheses () or, equivalently, brackets [] are used to denote matrix elements, so that M(1,1) and M[1,1] both denote the first element of the first row of a matrix M. For example, DAY(5,2) or DAY[5,2] denotes the entry in row 5 and column 2 of a matrix DAY, and A(I+1,J) or A[I+1,J] denotes the entry in row I+1 and column J of an MLAB matrix A if I and J are scalar identifiers. Table 2.9 summarizes construction of matrix entries in MLAB. The construction and manipulation of MLAB matrices will be considered in Chapter 3. A list of all of the identifiers defined as scalars in an MLAB session can be obtained by giving the command: * TYPE SCALARS 22 In general a scalar expression describing any matrix entry can be constructed using an appropriate matrix identifier M and scalar expressions SE1 and SE2 to specify the row and column positions, as follows: M(SE1,SE2) If SE1 and SE2 are positive integers i and j, respective ly, then the value returned is the matrix entry in row i and column j of M if it exists, and is undefined otherwise. In general, M(SE1,SE2) has the same meaning as M(INT(SE1),INT(SE2)), making scalars into integers. An error message appears if a nonexistent matrix element is specified. M(SE1) This expression is normally used for column vectors (matrices with 1 column), and is exactly the same as M(SE1,1). Table 2.9: Construction of matrix entries. 2.3 FUNCTIONS AND THE FUNCTION COMMAND You may employ the FUNCTION command to symbolically define a function of one or more variables by specifying a corresponding scalar expression. The FUNCTION command is described in Table 2.10. Defined functions may then be used in subsequent commands and scalar expressions. This is helpful for several reasons. First, very complicated expressions need not be given all at once, but can be defined part by part using intermediate defined functions. Second, the combined use of defined functions and matrices gives you powerful techniques for numerical computation and picture generation. Third, certain mathematical operations are available for direct use only in FUNCTION command scalar expressions, although they can be used indirectly in assignment commands and other MLAB commands by reference to the defined functions. Finally, the curve-fitting and differential equation modeling features of MLAB are organized around the MLAB concept of a defined function. Suppose that a functional form F is specified in mathematical text by the equation: F (s, x) = K · (s2 + 1 ) · e−a·x x This defines F to be a function of two real variables s and x called arguments, which can be computed by means of the given expression defining F (the right side of the equation above). The variables K and a which appear in the expression defining F , but are not arguments of F , are called parameters of F . In fact, the equation above describes an infinite family of functions of two variables, since different numerical values for the parameters will lead to different functions. 23 Before F can be numerically evaluated at specified points, e.g. F (1, 2), F (−3.5, 0), etc., numerical values for K and a must be specified. The MLAB FUNCTION command is equivalent to the above mathematical technique for defining a function in parametric form. For example, the definition of F could be expressed by the MLAB command: * FUNCTION F(S,X) = K*(S*S+1/X)*EXP(-A*X) Note that the FUNCTION command is a straightforward translation of the mathematical text. The meaning is also very similar. In particular, after executing the above FUNCTION command, the function F can be referenced in subsequent scalar expressions. For example, observe the MLAB dialog below: * FUNCTION F(S,X) = K*(S*S+1/X)*EXP(-A*X) * K = -2 * A = 0 * TYPE F, 11+F(2,2) FUNCTION F(S,X) = K*(S*S+1/X)*EXP((-A)*X) = 2 * A = 1 * T = 2 * TYPE F(3.4,LOG(T)-3) = -223.481907 Note that the TYPE command for F returns the current function definition. In order to numerically evaluate a reference to F, the parameters K and A must be scalar identifiers, that is, must have numerical values. This is not true for the arguments S and X which could be known or unknown MLAB identifiers. As shown above, the scalar expressions to be substituted for the argument list identifiers are supplied in parentheses following the function identifier. For example, the command TYPE F(U+1,GG) has exactly the same effect as the command: * TYPE K*((U+1)^2+1/GG)*EXP(-A*GG) for scalar identifiers U and GG. The formal argument list identifiers S and X are used only to interpret references to the function F, and any actual data items named S or X are not damaged by using these names as formal arguments. For example, if the function Y is defined by: * FUNCTION Y(X) = A*EXP(B*X) 24 The general form of the FUNCTION command is given by: FUNCTION F(A1, A2, ... , An) = SE0 Here, F is either an unknown MLAB identifier or a function identifier according to whether one is defining a new function or redefining a previously existing function. The next part of the command (A1,A2, ... , An) is called the “formal argument list,” and consists of n for (n ≥ 0) distinct MLAB identifiers (usually unknown identifiers) which are enclosed in parentheses and separated by commas. A defined function may have a null argument list; for example, FUNCTION F() = SE0. The final part SE0 is the scalar expression defining F. Usually, the scalar expression SE0 contains the formal argument list identifiers as well as other scalar identifiers. The word FUNCTION may be abbreviated by FCT. Only the equal sign (=) is acceptable in a FUNCTION command; the underscore( ) can not be used. The FUNCTION command creates or modifies a function data item with identifier F. This data item, which consists of a formal argument list and a defining scalar expression, is stored in symbolic form. An existing function data item can be referenced in subsequent scalar expressions. If (SE1, SE2, ... , SEn) is an actual argument list (scalar expresssion list), the value F(SE1, SE2, ... , SEn) is obtained by evaluating scalar expression SE0 which is obtained from the scalar expression SE0 defining F. If the formal argument list for F is (A1, A2, ... , An), then SE0 is obtained from SE0 by substituting SEk for each occurrence of Ak in SE0, k = 1, 2, ... , n, and then SE0 is evaluated as usual. Table 2.10: FUNCTION command. (as in the Chapter 1 tutorial) and A = .003, B = .4, and C = 3 are scalars, then Y(C+1) is computed in MLAB by the steps: Y(C+1) = = = = = = Y(3+1) Y(4) A*EXP(B*4) .003*EXP(.4*4) .003*EXP(1.6) .0148591 A scalar expression defining a function may contain references to other defined functions, assuming that circular definitions are avoided. For example, consider the commands: 25 * FUNCTION GA(X) = A0 + A1*X + A2*X*X * FUNCTION GB(T1,T2) = C*GA(T1+T2) + ATAN2(D*T1, T2) Here, GB makes reference to the defined function GA. The parameters of a defined function consist of the scalar identifiers in the defining scalar expression which are not contained in the argument list, as well as any parameters of defined functions referred to in the defining scalar expression. For example, the parameters of GB are C, D, A0, A1, and A2. Here, C and D are identifiers which appear in the defining expression for GB but are not arguments; and A0, A1, and A2 are parameters for GA, which are used in defining GB. A defined function may have any number of parameters, including zero. Note that matrix element references look exactly like defined function references for functions of one or two variables. (In effect, a matrix can be regarded as a function defined by table lookup.) There is no real problem with this ambiguity since F(2,3) can only refer to one data item F which must be either a matrix or a defined function. It is recommended that the MLAB user always specify the same number of arguments in any references to a defined function as was specified in the FUNCTION command defining it. However, there are conventions for handling defined function references with too many arguments (extra arguments are ignored) or too few arguments (arguments not supplied are treated as scalar identifiers). A list of all of the identifiers defined as functions in an MLAB session can be obtained by giving the command: * TYPE FUNCTIONS 2.4 RELATIONS AND DEFINITION OF FUNCTIONS BY CASES In mathematical applications, functions are often defined by fitting together parts of several other functions. In MLAB, the conditional scalar expression (IF-THEN-ELSE) can be used to construct MLAB functions of this kind. In Figure 2.1, for example, the function y = f (x) given f (x) = exp(−ax), 1, if x ≥ 0; otherwise. is shown for a = 3. This function can be defined and used as in the following MLAB dialog: 26 Figure 2.1: Graph of y = f (x). 27 Figure 2.2: Graph of y = g(t). * FUNCTION F(X) = IF X >= 0 THEN EXP(-A*X) ELSE 1 * A = 3 * TYPE F(-2), F(1) = 1 = 4.97870684E-2 Observe that the condition X >= 0 following the word IF determines whether the THEN clause or the ELSE clause scalar expression is evaluated to obtain the numeric value of the conditional expression. In Figure 2.2, the graph of y = g(t) is given by: g(t) = sin(t), 0, if 0 < t < 180 (degrees); otherwise. This function can be defined by the MLAB command: 28 Figure 2.3: Graph of y = h(x). * FUNCTION G(T) = IF T > 0 AND T < 180 THEN SIND(T) ELSE 0 In this example, there is a compound condition obtained by joining the two conditions T > 0 and T < 180 by the Boolean operator AND. That is, the THEN clause is used only if both conditions are true. MLAB also has the Boolean operators OR (inclusive) and NOT (logical negation). Arithmetic comparisons and Boolean operators are just scalar expressions under the convention that “true” is represented by 1 and “false” is represented by 0. The graph of y = h(x) in Figure 2.3 corresponds to the function: h(x) = 1 − x, −1 + x, 1, if 0 < x ≤ 1; if 1 < x ≤ 2; otherwise. One way to define h(x) in MLAB is by using an auxiliary function K, as shown below: * FUNCTION H(X) = IF X > 0 AND X <= 2 THEN K(X) ELSE 1 * FUNCTION K(X) = IF X <= 1 THEN 1-X ELSE -1+X 29 Note that it does not matter what values are taken by K(X) except when X is between 0 and 2, if K is used only to help evaluate H. Another, more efficient way to define h(x) in MLAB is using nested conditional expressions, as in the statement * FUNCTION H(X) = IF X > 0 AND X <= 2 THEN (IF X <= 1 THEN \ : 1-X ELSE X-1) ELSE 1 Functions of several variables can be defined by conditional scalar expressions in a similar way. For example, the MLAB command: * FUNCTION Z(X,Y) = IF X*X + Y*Y < 1 THEN SQRT(1-X*X-Y*Y) ELSE 0 defines a function of two variables whose graph is obtained from the (x, y)-plane by replacing the unit disk by a hemisphere. Any two scalar expressions can be compared by any of the six comparison scalar operations: <, >, <=, >=, =, and NOT=. For example, the MLAB function RCP defined by: * FUNCTION RCP(T) = IF T NOT= 0 THEN 1/T ELSE 0 will compute reciprocals except that RCP(0) = 0. The error condition DIVISION BY ZERO will not occur when RCP(0) is evaluated, because only the correct clause (THEN or ELSE) is numerically evaluated for a conditional scalar expression occurring in an MLAB function definition. As described in Table 2.11, a comparison expression is regarded as a scalar expression, which evaluates to either 0 or 1. The Boolean operators NOT, AND, and OR also form scalar expressions which evaluate to 0 or 1. Note that comparison or logical operations may appear in any scalar expression just like other scalar operations. For example, the command: * FUNCTION F(X) = (NOT(X>0)) + (X>0)*EXP(-A*X) is an alternative method for correctly defining the function shown in Figure 2.1. However, be careful with parentheses when using such expressions. For example, NOT(X>0)+1 is interpreted as NOT((X>0)+1) rather than ((NOT(X>0))+1 by MLAB. 30 In general, arithmetic comparison, logical, and conditional scalar expressions work normally if 1 equals “true” and 0 equals “false”. Arithmetic comparisons values: SE1 < SE2 1 if SE1 < SE2; 0 if SE1≥ SE2 SE1 > SE2 1 if SE1 > SE2; 0 if SE1 ≤ SE2 SE1 = SE2 1 if SE1 = SE2; 0 if SE1 6= SE2 SE1 >= SE2 1 if SE1 ≥ SE2; 0 if SE1 < SE2 SE1 <= SE2 1 if SE1 ≤ SE2; 0 if SE1 > SE2 SE1 NOT= SE2 1 if SE1 6= SE2; 0 if SE1 = SE2 Logical scalar expressions values: NOT SE1 1 if SE1 = 0; 0 if SE1 6= 0 SE1 AND SE2 1 if SE1 6= 0 and SE2 6= 0 0 if SE1 = 0 or if SE2 = 0 SE1 OR SE2 1 if SE1 6= 0 or if SE2 6= 0 0 if SE1 = 0 and SE2 = 0 Conditional expression values: IF SE1 THEN SE2 ELSE SE3 SE2 if SE1 6= 0; SE3 if SE1 = 0 Table 2.11: Comparison, logical, conditional expressions. 2.5 RECURSIVE FUNCTIONS AND THE TYPEOUT OPERATOR There are a few situations in which functions are most easily defined recursively, that is, where evaluation of the function involves evaluating the function at a different value. An example of this is the factorial function, n!, mathematically defined as the product n! = n · (n − 1) · (n − 2) · ... · (3) · (2) · (1) The value of 4! is thus 4! = 4 · 3 · 2 · 1 = 24. The easiest way of defining the factorial function is FACTORIAL(x) = 1, x · FACTORIAL(x − 1), 31 for x = 1 for x > 1 This form of function definition is possible in MLAB with the statement: * FUNCTION FACTORIAL(X) = (IF X = 1 THEN 1 ELSE X*FACTORIAL(X-1)) Note, however, the computation specified is very wasteful when we want to tabulate FACTORIAL on a range of successive integers. Another example of a function that is most often defined recursively is the function which when called with the integer n produces the nth term in the Fibonacci series: 0, 1, 1, 2, 3, 5, 8, ..., which is mathematically defined as FIB(x) = 0, 1, FIB(x − 1) + FIB(x − 2) for x = 0 for x = 1 for x > 1 This function can be defined in MLAB with the statement * FUNCTION FIB(X) = (IF X<2 THEN X ELSE FIB(X-1) + FIB(X-2)) The TYPEOUT operator, summarized in Table 2.12, is often useful in debugging recursively defined functions (and in debugging functions in general). TYPEOUT(X) will return the value of X and will type out this value as a side-effect. The following dialog illustrates this: * FUNCTION FACT(X) = IF X = 1 THEN 1 ELSE TYPEOUT(X*FACT(X-1)) * A = FACT(4) :: 2 :: 6 :: 24 * TYPE A A = 24 When MLAB prints something due to a TYPEOUT command, the line of typed output begins with a double colon, (::). When evaluating FACT(4), MLAB expanded the statement to TYPEOUT(4*TYPEOUT(3*TYPEOUT(2*1))) and executed the inner parenthesized parts first. 32 The general form of the TYPEOUT operator is: TYPEOUT(SE1) The value SE1 is returned and is typed out as a side-effect. This is useful in debugging function definitions. If a matrix expression is used in place of SE1 then erroneous results will occur. Table 2.12: TYPEOUT scalar operator. 2.6 INDEXED SUMS, PRODUCTS, AND DEFINITE INTEGRALS Three common mathematical notations, the indexed sum, the indexed product, and the definite integral, have corresponding SUM, PRODUCT, and INTEGRAL operators for numerical calculation in MLAB. For example, suppose f (n) = log(n!) is to be computed by means of the equivalent indexed sum: n X log(j). j=1 Then this function can be defined and evaluated as shown in the following MLAB dialog: * FUNCTION F(N) = SUM(J,1,N,LOG(J)) * TYPE EXP(F(6)),F(40) = 720 = 110.32064 The function f (n) = log(n!) can also be computed by means of the equivalent indexed product: log( n Y j=1 This function can be defined and evaluated as: * FUNCTION F(N) = LOG(PRODUCT(J,1,N,J)) 33 j). Redefining F * TYPE EXP(F(6)),F(40) = 720 = 110.32064 Similarly, the integral: I(x) = Z x exp(−t2 )dt 0 can be defined and evaluated as shown in the following MLAB dialog: * FUNCTION I(X) = INTEGRAL(T,0,X,EXP(-T*T)) * TYPE I(2), I(1.5)-I(1) = .882076325 = .109359866 The SUM, PRODUCT, and INTEGRAL operations, summarized in Table 2.13, are permitted only in FUNCTION commands although they may be used indirectly in assignment commands or other MLAB commands by reference to functions in which they appear. For example, suppose a(x) and b(x) are functions of one variable; f (x, y) is a function of two variables; and A, B, and F are the corresponding function identifiers defined by MLAB FUNCTION commands. Then the definitions b(n) g(n) = X f (n, j) j=a(n) b(n) p(n) = Y f (n, j) j=a(n) where a(n) and b(n) are integers, and the definition h(x) = Z b(x) f (x, y)dy a(x) can be expressed by the MLAB commands: 34 The general forms of these FUNCTION command scalar expressions are shown below: SUM(X,SE1,SE2,SE3) PRODUCT(X,SE1,SE2,SE3) INTEGRAL(X,SE1,SE2,SE3) Here, X denotes an MLAB identifier used formally as the index variable of the sum or product, or as the variable of integration. That is, X may be an unknown identifier when the SUM, PRODUCT, or INTEGRAL expression is evaluated, and any data item with the same name as the identifier X is irrelevant to the evaluation of the sum or integral. In particular, X should not be an argument of the function defined using the SUM, PRODUCT, or INTEGRAL expression. The scalar expressions SE1 and SE2 should not contain the identifier X. For a SUM expression, SE1 and SE2 are the lower and upper limits, respectively, of the indexed sum or product. For an INTEGRAL expression, SE1 and SE2 are the lower and upper integration bounds, respectively, for the definite integral. The last scalar expression SE3 will usually contain the identifier X. It gives the numerical description of the terms being summed for the SUM operation, multiplied for the PRODUCT operation, and of the function being integrated for the INTEGRAL operation. Table 2.13: SUM, PRODUCT, and INTEGRAL operators. * FUNCTION G(N) = SUM(J,A(N),B(N),F(N,J)) * FUNCTION P(N) = PRODUCT(J,A(N),B(N),F(N,J)) * FUNCTION H(X) = INTEGRAL(Y,A(X),B(X),F(X,Y)) Note that a particular sum, product, or integral can be evaluated by using a function with no arguments. For example, the MLAB commands: * FUNCTION SS() = SUM(J,1,12,J*J*J) * S = SS() assigns to S the scalar value of the sum of the first 12 cubes. 35 2.7 EVALUATING AND FINDING ROOTS OF EXPRESSIONS Instead of finding the value of a function at a certain point it is often desirable to find the point at which the function assumes a certain value. This is done in MLAB with the ROOT operator– summarized in Table 2.14, which finds a point at which an expression equals zero. The ROOT operator takes an identifier to use as the independent variable, an expression containing that identifier, and an interval of independent variable values in which to search for a root. It returns a value for the independent variable, within the given interval, at which the expression equals zero. For example, to find the point at which the function SIN(X) equals .75, within the interval [−1.57, 1.57], the following dialog is used: * FUNCTION F(A,B) = ROOT(X,A,B,SIN(X)-.75) * TYPE F(-1.57,1.57) = .848062079 Note that like the SUM, PRODUCT, and INTEGRAL operators, the ROOT operator may only appear in function bodies. The EVAL operator, also summarized in Table 2.14, is used to compactly define functions that have subexpressions embedded repeatedly in them. This operator takes an expression, an identifier for which to substitute in this expression, and an expression into which to make the substitution. It will evaluate the second expression with the value of the first expression substituted for each occurrence of the given identifier. For example, the function defined by: f (x) = sin(x2 + 2) · exp(x2 + 2) + x2 + 2 could be easily defined with the MLAB statement * FUNCTION F(X) = EVAL(A,X*X+2,SIN(A)*EXP(A)+A) While the EVAL operator is not frequently used explicitly, it arises automatically in calculating the symbolic derivative of the ROOT operator. Like the INTEGRAL, PRODUCT, and SUM operators, ROOT and EVAL may only be used in function definitions. 36 The general form of the ROOT and EVAL operators are given by: ROOT(X,SE1,SE2,SE3) EVAL(X,SE1,SE2) The ROOT operator returns a value for X which is in the interval [SE1,SE2] and which is a root of SE3. If no such root exists then the value 1.7976 × 10308 is returned. If several such roots exist, then one of them is chosen according to the internal algorithm used. This will not necessarily be the smallest or the largest of these roots. The EVAL operator evaluates SE2 with all occurrences of X replaced with SE1. This arises automatically in the derivative of ROOT. The ROOT and EVAL operators may only be used in function bodies. Table 2.14: ROOT and EVAL operators. 2.8 DERIVATIVES OF FUNCTIONS In calculus, the concept of the derivative of a function and the corresponding notations: dy dx f ′ (x) or are introduced for functions y = f (x) of one variable. Subsequently, partial derivatives of functions of several variables are introduced, with notations such as: ∂w ∂y or hy (x, y, z) for a function w = h(x, y, z) of three variables, for example. There are also notations for multiple ordinary and partial derivatives, such as: d2 y dx2 or f ′′ (x) or ∂2w ∂x∂z or hxz (x, y, z), etc. These notations are not convenient for typing or computer printing, and so the symbol ’ (apostrophe) is used in MLAB to indicate ordinary or partial differentiation. The identifier F’X denotes the derivative of the function F with respect to the symbol X. The symbol with respect to which 37 df , but F’ is illegal. we are differentiating must be stated; F’X is the MLAB name of the function dx The special identifier DIFF can be used in place of ’, thus F DIFF X can be written in place of F’X. This notation is used to specify various derivatives of MLAB functions which are defined by FUNCTION statements. First, consider some ordinary derivatives, in the following MLAB dialog: * FCT F(X) = A*COS(X) * TYPE F’X, F’X’X FUNCTION F’X(X) = -SIN(X)*A FUNCTION F’X’X(X) = -COS(X)*A Observe that F’X, denoting the first derivative d2 f (x) , dx2 df (x) dx , and F’X’X, denoting the second derivative are also functions with argument X; that is, they are defined function data items. Secondly, note that MLAB has generated correct scalar expressions for derivatives of the trigonometric functions sin(x) and cos(x). In most cases MLAB will apply rules for symbolic differentiation of scalar expressions containing arithmetic operations, builtin functions, and so on. However, it is advisable to examine symbolic derivatives before using them because some special expressions may be differentiated in a way that is not desired. This applies to non-standard expressions involving IF-THEN-ELSE, INT, or relational operators, as shown in Table 2.15. Special cases of differentiation follow, with d(A) signifying the derivative of the expression A with respect to some variable. d(A = B) A = B d(A < B) A = B d(A > B) A = B d(A <= B) A = B d(A >= B) A = B d(SUM(I,A,B,E) SUM(I,A,B,d(E)) d(A AND B) d(A) AND d(B) d(A OR B) d(A) OR d(B) d(NOT A) NOT d(A) d(IF A THEN B ELSE C) IF A THEN d(B) ELSE d(C) d(ABS(A)) IF A > 0 THEN d(A) ELSE -d(A) d(INT(A)) (INT(A) = A) d(MOD(A,B)) d(INT(INT(A)/INT(B))) Table 2.15: Special cases of differentiation. MLAB derivative functions named by DIFF expressions can be used for numerical calculation in the usual way. For example, the derivative of the above-mentioned function F could be evaluated as shown in the following dialog: 38 * A = 2 * TYPE F DIFF X(PI/2), F’X(PI/2) = -2 = -2 The expression 2*(-SIN(PI/2)) was numerically evaluated as −2. The rules for partial derivatives in MLAB are quite similar. Consider the MLAB dialog: * FUNCTION G(X,Y) = A*X*EXP(X+KA/Y) * TYPE G’X,G’Y,G’KA,G’T FUNCTION G’X(X,Y) = A*EXP(X+KA/Y)+EXP(X+KA/Y)*A*X FUNCTION G’Y(X,Y) = -(KA/(Y*Y))*EXP(X+KA/Y)*A*X FUNCTION G’KA(X,Y) = (1/Y)*EXP(X+KA/Y)*A*X FUNCTION G’T(X,Y) = 0 Note that the variables of differentiation (X, Y, KA, and T in the four examples above) may be either arguments or parameters of the function to be differentiated, or may even not occur in the function. The symbolic differentiation operation with respect to a given variable treats all other arguments or parameters of the function as scalar constants in accordance with the usual rules of calculus. Multiple differentiations iterate the above process, as shown in the example of a second-order partial derivative below: * FUNCTION P1(X1,X2) = C*X1*X1*X2 * TYPE P1’X1’C FUNCTION P1’X1’C(X1,X2) = 2*X1*X2 * TYPE P1’X1’C(3,5) = 30 Observe that the partial derivative of P1 with respect to X1 and C was computed and numerically evaluated correctly. If the scalar expression defining a function contains references to other defined functions, then the chain rule will be applied to compute derivatives of this function. The resulting expression will define the derivative in terms of the derivatives of other functions. For example, observe the following MLAB dialog: * FUNCTION U(X,Y) = LOG(X)*Y * FUNCTION V(T) = U(2*T,-T) * TYPE V’T FUNCTION V’T(T) = U’T(2*T,-T)+2*U’X(2*T,-T))-U’Y(2*T,-T) 39 The chain rule for v(t) = u(x(t), y(t)) is given by: ∂u dx ∂u dy dv = · + · dt ∂x dt ∂y dt So, the MLAB differentiator has applied the rule correctly with reference to U’X and U’Y by name, and symbolic evaluation of X’T as 2 for X(T) = 2*T and Y’T as −1 for Y(T) = -T. It is also possible to define a function that makes reference to a derivative by name, as in: * FUNCTION W(Z) = U’X(Z,C+Z) MLAB will attempt to differentiate a SUM expression term by term. For example, an erroneous expression is obtained for the coefficients as shown below: * FUNCTION P(X) = SUM(I,0,N,A(I+1)*X^I) * TYPE P’X FUNCTION P’X(X) = SUM(I,0,N,I*X^(I-1)*A(I+1)) Then P’X(0) is incorrectly computed. However, this can be corrected by separating some of the terms as shown in the following dialog: * FUNCTION P(X) = A(1)+A(2)*X+SUM(I,2,N,A(I+1)*X^I) * TYPE P’X FUNCTION P’X(X) = A(2)+SUM(I,2,N,I*X^(I-1)*A(I+1)) This is true in many cases; an incorrect or unsatisfactory symbolic derivative can be avoided by carefully forming the function definition. Derivative functions may be explicitly defined with function statements as shown in Table 2.16. This is how differential equations are specified. It is also useful to define forward-difference or centered-difference derivatives by explicit function statements, in some cases. 2.9 THE TYPE COMMAND It is clear from the previous examples that the TYPE command enables the MLAB user to see the current values of scalar or matrix identifiers or to obtain the numerical values of scalar expressions. As will be seen in subsequent chapters, the TYPE command responds with appropriate information about any MLAB data item or outputs the result of evaluating any of a variety of MLAB expressions. The TYPE command is summarized in Table 2.17. Uses of the TYPE command for other kinds of MLAB data items and expressions will be described as such terms are introduced. 40 In general, derivatives in MLAB may be defined by expressions of the form: F’X1’X2...’Xn F DIFF X1 DIFF X2 ... DIFF Xn Here, F is the identifier of an MLAB function, and X1,X2,...,Xn is a list of n MLAB identifiers (usually arguments and parameters of F) for n ≥ 1. Let DF denote the general DIFF expression shown above. Then DF defines an MLAB function, which has the same list of arguments as F. The scalar expression defining function DF is obtained by n-fold symbolic differentiation of the expression defining F, treated as an ordinary or partial derivative with respect to the list of variables X1,X2,...,Xn. If F has m arguments, then the scalar expression: DF(SE1,SE2,... ,SEm) can be used for numerical calculation of derivatives. Table 2.16: Defining MLAB derivatives. 2.10 SUMMARY In the following let SE1, SE2, ... , SEn denote scalar expressions; let U denote an unknown identifier; let X denote a scalar identifier; let F denote a function identifier defined by a FUNCTION command or builtin function with m arguments, A1, A2, ... , Am; and let DF denote an ordinary or partial derivative F’A1’A2 ... ’Ak. 1. MLAB Data Types are: (a) scalar; (b) matrix; (c) string; (d) string array; (e) function; (f) constraint set; (g) initial condition; (h) window; 41 The TYPE command has the general form: TYPE T1,T2,...,Tn This command causes information describing or evaluating the given terms T1,T2,...,Tn to be typed on the terminal. Each term must be either an MLAB identifier or a permissible MLAB expression. The response to any term includes the data type of the identifier or expression plus information about the particular data item corresponding to that term. If the term is an MLAB identifier, the response lists that identifier along with its value. If Tj is an MLAB expression, the response lists only the value of the expression. TYPE SE1,SE2,...,SEn types SE1,SE2,...,SEn TYPE M types the current matrix entries by row, starting each row with the row number of the matrix (some rows require more than one line of output). TYPE F types the FUNCTION command currently defining F. TYPE F’X1’X2...’Xm types the indicated ordinary or partial derivative; if necessary, creates and types symbolic derivative expressions. Table 2.17: TYPE command. (i) curve; (j) title; (k) 3D-window; (l) surface. 2. Scalars and matrix entry values have sixteen digit precision and non-zero magnitudes from 2.2 × 10−308 to 1.7 × 10308 approximately. 3. Scalar Expression Formation Rules are: (a) Scalar constants and scalar identifiers are scalar expressions. (b) Scalar arithmetic operations are: • • • • • SE1 + SE1 -SE1; SE1 * SE1 / SE2; SE2; SE2; SE2; 42 • SE1 ^SE2 (or SE1 ** SE2). (c) Order of operations is specified by parentheses or by the hierarchy of operations as follows: • • • • Evaluation of functions; Exponentiation (^) or (**); Multiplication (*) and division (/) from left to right; Addition (+) and subtraction (-) from left to right. • • • • • • SIN(SE1); COS(SE1); TAN(SE1); SIND(SE1); COSD(SE1); TAND(SE1). • • • • ASIN(SE1); ACOS(SE1); ATAN(SE1); ATAN2(SE1,SE2). • • • • • • LOG(SE1); LOG10(SE1); EXP(SE1); SINH(SE1); COSH(SE1); TANH(SE1). • • • • • • • ABS(SE1); SQRT(SE1); INT(SE1); MOD(SE1,SE2); LOGGAMMA(SE1); ERF(SE1); GAUSS(SE1). (d) Trigonometric functions include: (e) Inverse trigonometric functions include: (f) Logarithmic and exponential functions include: (g) Special functions include: (h) Matrix entries are written: • M(SE1,SE2); 43 • M(SE1). (i) The value of a user-defined function at the actual arguments SE1, SE2, ... , SEn, is: • F(SE1,SE2,...,SEn) (See FUNCTION command). (j) Scalar comparison operators are: • • • • • • SE1 SE1 SE1 SE1 SE2 SE1 < SE2; <= SE2; > SE2; >= SE2; = SE2; NOT= SE2. (k) Logical operators are: • NOT SE1; • SE1 AND SE2; • SE1 OR SE2. (l) Indexed sum and product operators are: • SUM(X,SE1,SE2,SE3) (permitted in functions only). • PRODUCT(X,SE1,SE2,SE3) (permitted in functions only). (m) Definite integral is: • INTEGRAL(X,SE1,SE2,SE3) (permitted in functions only). (n) The root operator is: • ROOT(X,SE1,SE2,SE3) (permitted in functions only). • EVAL(X,SE1,SE2) (permitted in functions only). (o) Reference to the symbolic function derivative of a function F with respect to a symbol X is: • F’X or F DIFF X. 4. MLAB Commands for Numerical Calculation are: (a) Scalar assignment command (creates or changes a scalar): • U = SE1 or • X = SE1. (b) FUNCTION command (creates or redefines a function): • FUNCTION U(A1,A2,...,An) = SE1 or • FUNCTION F(A1,A2,...,An) = SE1. (c) TYPE commands for scalar expressions: • TYPE SE1,SE2,...,SEn or • TYPE F or • TYPE F’A1’A2 ... ’An. 44 2.11 EXERCISES 1. Convert the following mathematical expressions to appropriate MLAB scalar expressions: (a) |(cos2 (3u))(tanh(3v)| − euv √ (b) arctan[c+ −c] 1+d2 (c) ⌊log10 (x0 ) + .9999999⌋ where ⌊z⌋ denotes the largest integer not greater than z (d) max(x1, x2), the larger of x1 and x2 2. Construct MLAB FUNCTION commands to define the following functions: (a) f (x, y) = B · loge ( Ry x sin2 (t)dt) where B is a constant (b) g(z) = U · f (z, 1) where U is a constant and f is defined in part (a) (c) A periodic square wave function s(t) of period 2 · p, defined by: s(t) = −3, 3, (2 · n − 1) · p ≤ t < 2 · n · p 2 · n · p ≤ t < (2 · n + 1) · p for all integers n, where p is a positive constant (Hint: Adapt MOD(INT(T/P),2). (d) r(z) = 5j=1 wj · z j using an indexed sum and a column vector W with W (1) = w1 , W (2) = w2 , W (3) = w3 , W (4) = w4 , and W (5) = w5 . P (e) The function h(x) defined by: h(x) = where c is a constant 0, x2 , 2 c , x < 0; 0 ≤ x ≤ c; x > c. (f) The function: y2 (x) = y1′ (x) − c · y1 (x) where y1 (x) = Z x 0 exp(−k · t)dt, y1′ (x) = dy1 dx and c and k are constants. 3. What are the arguments and parameters of each of the functions of exercise 2? 4. Start a new MLAB session. (a) Recover the data saved in the Chapter 1 tutorial as indicated in the following MLAB command: 45 USE TUTOR1 (b) Evaluate the expressions of exercise 1 by TYPE commands, first assigning arbitrary values to the variables occurring in these scalar expressions. (c) Numerically evaluate F(A,M(7,2)), using the scalar A and matrix M recovered from the Chapter 1 tutorial and function F defined in exercise 2(a). Test all MLAB functions defined in exercise 2 by selecting arbitrary argument and parameter values. To set up the indexed sum coefficients of exercise 2(d), use the MLAB command: W = LIST(1,-2,0,1,3) (d) Exit from MLAB and print a copy of MLAB.LOG. 46 Chapter 3 COMPUTATION WITH MATRICES IN MLAB It has been shown how, by using scalar expressions (symbolic descriptions of numbers) and scalar assignment commands, the MLAB user can perform scalar calculations and display the results through TYPE commands. Similarly, the MLAB user, by using matrix expressions and matrix assignment commands, can perform matrix calculations. The general form the matrix assignment command is shown in Table 3.1. With the TYPE command, the user can show all or part of a specified matrix or directly type out the matrix that corresponds to a specified matrix expression. Because matrices have more structure than scalars, the matrix operations and assignment commands tend to be somewhat more complicated than scalar operations. However, matrix manipulations give the MLAB user considerably greater power to perform calculations and generate pictures. Mastery of the basic matrix operators and manipulation techniques is an important part of the MLAB user’s training. 3.1 MATRIX ASSIGNMENT STATEMENTS AND MATRIX DIMENSIONS The simplest matrix assignment commands for creating and changing MLAB matrices are similar to the corresponding scalar assignment commands. In Chapter 1, the successive commands: * M = 6:15:.05 * M = POINTS(Y,M) 47 The matrix assignment command has the general forms, where ME1 is a matrix-valued expression: (unknown identifier) = ME1 (matrix identifier) = ME1 As in scalar commands, an underscore symbol ( ) may be substituted for the equal sign (=). Table 3.1: General forms of matrix assignment command. were matrix assignment commands of the first and second types, respectively. Here, 6:15:.05 and POINTS(Y,M) are matrix expressions (to be explained below). The first command changes M from an unknown identifier to a matrix identifier corresponding to the matrix 6:15:.05. The second command causes the current matrix associated with M to be changed to the matrix symbolically described by POINTS(Y,M). Note that the second type of matrix assignment command can be self-referring. For example, the matrix expression POINTS(Y,M) which describes the new matrix assigned to M makes reference to the current value 6:15:.05 of the matrix M when the second matrix assignment command above is executed. Matrix expressions are similar to scalar expressions in several respects. If a matrix with a certain MLAB identifier is created during an MLAB session, then one can refer to that matrix by its identifier in matrix expressions that are part of subsequent MLAB commands. There are various matrix operations that can be indicated in matrix expressions in order to input and edit matrices, do matrix arithmetic, evaluate functions at many points, and so on. Parentheses indicate the order of operations in matrix expressions involving several operations. The use of parentheses is recommended in matrix expressions having several operations. To give the forms of matrix expressions, let ME1, ME2, ... , MEn denote arbitrary matrix expressions that the MLAB user chooses as arguments for the operations in question. ME1, ME2, etc., will also indicate the matrices (rectangular arrays of numbers) obtained by evaluating the corresponding matrix expressions. Because some matrix operations have scalar arguments, SE1,SE2,...,SEn will continue to be used to indicate scalar expressions and the number corresponding to a scalar expression chosen by the MLAB user. The matrix dimensions (number of rows and number of columns) can be obtained by the operations NROWS and NCOLS, described in Table 3.2. Each of these operations defines a scalar expression with one matrix argument. For example, recall the 181 row by 2 column matrix M created and saved in the Chapter 1 Tutorial. These dimensions can be checked by following the MLAB dialog: * USE TUTOR1 USING: W,CS1,DAY,B,A,M,Y * TYPE NROWS(M) 48 = 181 * TYPE NCOLS(M) = 2 In general, these dimension operations take any matrix expression argument, as shown below: NROWS(ME1) is the number of rows of the matrix ME1 (a scalar) NCOLS(ME1) is the number of columns of the matrix ME1(a scalar) Table 3.2: Matrix dimension operators. Like other scalar operations, NROWS and NCOLS can be used as parts of more complicated scalar expressions. For example, if M is a matrix, then 2*NROWS(M)-1 is a scalar expression. 3.2 ENTERING NUMBERS INTO A MATRIX Three matrix expressions: LIST, KREAD, and READ, can be used to enter numbers into matrices. The LIST expression, described in Table 3.3, can have matrix arguments, but only the form having scalar arguments will be considered here. The KREAD and READ expressions, are more flexible and efficient than the LIST expression, and are recommended for MLAB matrix input in most cases. The simple LIST expression of n scalar arguments (n ≥ 1) has the form: LIST(SE1,SE2,...,SEn) It corresponds to a column vector of length n (i.e., an n row by 1 column matrix), with entries SE1,SE2...,SEn respectively. Table 3.3: LIST expression, simple form. For example, observe the following MLAB dialog: * XA = 30 * M1 = LIST(SIND(XA),XA-90,-2E4) * TYPE M1 M1: a 3 by 1 matrix 1: 0.5 2: -60 3: -20000 49 Data for a two dimensional matrix can be input from the keyboard by using an appropriate KREAD expression, as described in Table 3.4. The KREAD expression of 2 scalar arguments (both ≥ 1) has the form: KREAD(SE1,SE2) It allows the user to type entries for a matrix with SE1 rows and SE2 columns from the keyboard. When MLAB executes this form of the KREAD operator, it prints the message Type in numbers for KREAD. End lines with <Enter> and waits for the user to type SE1*SE2 scalars from the keyboard. The numbers may be typed in free format, separated by tabs, spaces, letters, or commas. Input lines are terminated by pressing the ENTER key. If the user hits the Escape key before entering the specified number of scalars, then the matrix row containing the final number is completed with zeros, and no more rows are created. Excess numbers are ignored. Scalar expressions are not evaluated. Assignment of scalars to the resulting matrix entries are made by rows; the first scalar is assigned to the (1,1) element of the resulting matrix; subsequent scalars fill the first row before filling subsequent rows. Table 3.4: KREAD expression, simple form. For example, observe the following MLAB dialog: * A = 3 * M = KREAD(3,2) Type in numbers for KREAD. End lines with <Enter> 1.E100 A 4 5 .023 7.5 9.8 1 27 833 * TYPE M M: a 3 by 2 matrix 1: 1E100 2: 5 3: 7.5 4 0.023 9.8 In this example, the line 50 1.E100 A 4 5 .023 7.5 9.8 1 27 833 was typed in response to the KREAD prompt. Note, that although A was previously defined as a scalar, the letter A which was typed in response to the KREAD operator was ignored by MLAB. Also, of the nine scalar values typed in the response, the last three values–1, 27, and 833–were ignored by MLAB. The first and second scalars–1.E100 and 4–were assigned to the first row of the resultant matrix; the third and fourth scalars–5 and .023–were assigned to the second row of the resultant matrix; and the fifth and sixth scalars–7.5 and 9.8–were assigned to the third row of the resultant matrix. The second argument in the KREAD expression may be omitted if a column vector is to be entered. Therefore, * M = LIST(1,3,2,7.8,22) and * M = KREAD(5) Type in numbers for KREAD. 1 3 2 7.8 22 End lines with <Enter> result in the same matrix M. The READ operator offers another method for entering scalars into a matrix. For the moment, only the two READ expressions used for typing in a matrix at the keyboard will be considered. The first form of the READ expression, summarized in Table 3.5, is used to enter an array (matrix) of numbers. A typical MLAB dialog using the console READ expression for typing in a matrix is shown below: * MAT = READ(CON,2,4) Type <CONTROL>Z after last number 5.35 -6.1 2.3E-3 45 1.1 -72 ^Z * TYPE MAT MAT: a 1: 5.35 2: 1.1 2 by 4 matrix -6.1 -72 0.0023 0 45 0 51 The keyboard entry form of the READ expression is: READ(CON,SE1,SE2) The word CON is short for console. The expressions SE1 and SE2 are positive integers, usually constants. If m =SE1 and n =SE2, the READ expression will create an m by n matrix (m rows and n columns). If necessary, SE1 and SE2 are made into integers by applying the INT function. When a console type of READ expression is in a matrix assignment command or other MLAB command, the command’s execution is halted, and the following message appears: TYPE <CONTROL>Z AFTER LAST NUMBER Scalar constants may now be typed in to fill the m by n matrix named, proceeding from left to right across each row and giving each complete row from the first to the last. Carriage returns are typed wherever convenient. It is not necessary to type rows as separate lines of input. If mn scalar constants are entered to completely fill the matrix and are followed by a carriage return, input is ended and the matrix assignment command or other MLAB command will proceed with the READ expression evaluated to the m by n matrix that was typed in. Typing CONTROL-Z (^Z) or hitting the Escape key means that the typing of the numbers has been completed. If fewer than mn numbers are entered, the matrix row containing the final number is completed with zeros, and no more rows are created. Table 3.5: READ expression, console form. The column vector form of the READ expression is: READ(CON) The method for entering numbers is the same as described above, except that CONTROL-Z (^Z) is now the only way to terminate input. If n numbers are entered (up to a maximum of 1000), a column vector of the n given numbers is used for the READ(CON) expression’s value. Table 3.6: READ expression, vector form. The second form of the READ expression, shown in Table 3.6, is used simply to enter a column vector of numbers. 52 The READ expression has a third form that can be used to read matrix entries from a computer disk file. That expression will be explained in Section 5.1. Because it is a common beginner error, the user should note that LIST, KREAD, and READ are matrix expressions and they should be assigned to a matrix or unknown identifier. Without an assignment, LIST, KREAD, and READ will simply echo the input. This is shown for the READ expression in the MLAB dialog below: * READ(CON,3,2) TYPE <CONTROL>Z AFTER LAST NUMBER .1 .2 .3 .4 .5 .6 ^Z : a 1: 0.1 2: 0.3 3: 0.5 3 by 2 matrix 0.2 0.4 0.6 Suppose a number is mistyped while entering a matrix using a LIST, KREAD, or READ expression. If the error is noticed immediately, the user can backspace until the incorrect entry is deleted and continue by typing the correct number. However, if the error is not noticed immediately, the matrix input operation can be completed with one or more incorrect matrix entries. Then, scalar values can be assigned to any incorrect entries. For example, if TA is a 4 row by 7 column matrix which is correct except that TA(3,6) is 1.84 instead of the desired value 1.48, then the matrix entry assignment command: * TA(3,6) = 1.48 corrects the error while leaving all other entries of TA unchanged. An additional feature of this matrix entry assignment command is that it can enlarge the matrix dimensions. For example, observe the following MLAB dialog: * A = LIST(-1,7) * TYPE A A: a 2 by 1 matrix 1: -1 2: 7 * A(1,3) = 23 53 * TYPE A A: a 2 by 3 matrix 1: -1 2: 7 0 0 23 0 Note that the matrix dimensions are enlarged sufficiently so that the operation makes sense. Also note that zeros are supplied for matrix entries that are not otherwise determined. This principle, called matrix expansion by zeroes, is also used for many other MLAB matrix operations. A matrix can be created by a matrix entry assignment command if an unknown identifier is given, again using matrix expansion by zeroes. For example, an unknown identifier X becomes a matrix identifier in the following MLAB dialog: * TYPE X value = unknown * X(2,3) = 7.2 * TYPE X X: a 1: 0 2: 0 2 by 3 matrix 0 0 0 7.2 There are similar matrix entry assignment commands specifying only one index, which are commonly used with column vectors. For example, * V(5) = 1 changes V(5) to 1 if V has length 5 or more, or first extends V to length 5 by supplying components with zero values if necessary. Table 3.7 summarizes the matrix entry assignment command. 3.3 GENERATING ARITHMETIC SEQUENCE VECTORS The colon (:) is used in MLAB matrix expressions to denote column vectors of consecutive integers or, more generally, finite arithmetic sequences of real numbers. An arithmetic sequence with n terms and difference d (d 6= 0) between successive terms has the form: 54 Suppose i =SE1 and j =SE2 are positive integers for some scalar expressions SE1 and SE2. If M denotes an m by n MLAB matrix, then M(SE1,SE2) = SE3 changes the matrix entry in row i and column j to SE3 if i ≤ m and j ≤ n. If i > m or j > n or both, then M becomes a p by q matrix, where p is the larger of m and i, and q is the larger of n and j. The element in row u, column v of the enlarged matrix is: unchanged if u ≤ m, v ≤ n SE3 if u = i and v = j 0 otherwise If U denotes an unknown MLAB identifier, then U(SE1,SE2) = SE3 creates an i by j matrix U with all elements equal to zero except for the element in the lower right corner, which equals SE3. The two forms: M(SE1) = SE3 and U(SE1) = SE3 are usually used for column vectors and are equivalent to: M(SE1,1) = SE3 and U(SE1,1) = SE3 If necessary, SE1 and SE2 are made into integers by the INT function. As usual, the underscore ( ) may be used for the equal sign (=). An error message is typed if a zero or negative row or column is specified. Table 3.7: Matrix entry assignment command. a, a + d, a + 2 · d, a + 3 · d, ..., a + (n − 1) · d with the j th term a + (j − 1) · d. The MLAB colon expression a:b:d describes the column vector of the finite arithmetic sequence which goes from a to b in steps of size d. The form a:b may be used if d = 1. Some examples are given below: 55 • -2:6:2 equals LIST(-2,0,2,4,6) • 1:-6:-1 equals LIST(1,0,-1,-2,-3,-4,-5,-6) • 2.01:2.08:0.03 equals LIST(2.01,2.04,2.07) • 0:10:0.05 describes a column vector of length 201 with components 0, 0.05, 0.1, ..., 9.9, 9.95, 10.0 (195 terms omitted) • 11:25 describes a column vector of length 15 with components 11, 12, 13, ..., 25, respectively, since d = 1 is assumed • 1:10000:2 describes a column vector of all the odd integers less than 10000 Note that the sequence may be increasing (d > 0) or decreasing (d < 0). Also, b determines the length n of the sequence by the agreement that b is the largest acceptable term if the sequence is increasing or is the smallest acceptable term if the sequence is decreasing. A summary is provided in Table 3.8. In general, the arithmetic sequence matrix expression is given by: SE1:SE2:SE3 If a =SE1, b =SE2, and d =SE3 the result is a column vector with components: a, a + d, a + 2 · d, ..., a + (n − 1) · d, such that a + (n − 1) · d ≤ b < a + n · difd > 0 a + (n − 1) · d ≥ b > a + n · difd < 0 SE1:SE2 If d = 0, an error message appears. If d < 0 and a < b, then −d is used. If d > 0 and a > b, then −d is used. exactly the same as SE1:SE2:1 Table 3.8: Arithmetic sequence matrix expression. Note that scalar expressions may be used to specify a, b, and d. For example, observe the following MLAB dialog: * X1 = 1 * X2 = 3 56 * R = X1:X2:((X2-X1)/50) * TYPE R R: a 1: 2: 3: . . . 49: 50: 51: 51 by 1 matrix 1 1.04 1.08 (45 terms omitted) 2.92 2.96 3 The MLAB colon and exclamation point expression (a:b!c), summarized in Table 3.9, generates the column vector of the finite arithmetic sequence which goes from a to b in c steps. For example: • 1:4!4 equals LIST(1,2,3,4) • 10:1!5 equals LIST(10,7.75,5.5,3.25,1) • 1.2:1.5!4 equals LIST(1.2,1.3,1.4,1.5) • 0:1!100 describes a column vector with the 100 elements 0, .010101, .020202, ..., .989899, 1 (95 terms omitted) Note that the sequence may be increasing or decreasing. The fixed-number-of-members sequence matrix expression is given by: SE1:SE2!SE3 If a =SE1, b =SE2, and c =SE3 with c > 0, the result is a column vector with components: a, a + d, a + 2 · d, ..., b = a + (c − 1) · d, where d = (b − a)/(c − 1). Table 3.9: Fixed-number-of-members arithmetic sequence matrix expression. Scalar expressions may be used to specify a, b, and c as the following MLAB dialog shows: 57 * * * * X1 = 3 X2 = 4 R = X1:X2!(100*(X2-X1)) TYPE R R: a 1: 2: 3: . . . 99: 100: 100 by 1 matrix 3 3.01010101 3.02020202 (95 terms omitted) 3.98989899 4 The arithmetic sequence matrix operations a:b:d, a:b, and a:b!c are some of the most frequently used MLAB operations. 3.4 MATRIX MANIPULATION OPERATIONS In using MLAB, one often needs to rearrange elements in matrices, select submatrices of existing matrices, and join matrices together to form larger matrices. There are a number of MLAB matrix expressions and matrix assignment commands which are useful for such matrix editing. For example, given an m by n matrix A, the n by m matrix obtained by interchanging the rows and columns of A, called the ”transpose” of A, is frequently denoted by A′ in mathematics texts. The apostrophe (’) is also used to denote the matrix transpose operation in MLAB, as shown in Table 3.10 and the MLAB dialog below: * TYPE (1:3)’ : a 1: 1 1 by 3 matrix 2 3 Here the transpose of a column vector is seen to be a row vector. The matrix DAY from the Tutorial of Chapter 1 can be transposed as follows: * USE TUTOR1 USING: W,CS1,DAY,B,A,M,Y 58 In general, the apostrophe (’) notation can be used to indicate matrix transpose in arbitrary matrix expressions: ME1’ If ME1 is an m by n matrix [ai,j ], the result is the transposed n by m matrix [aj,i ]. Of course, it is sometimes necessary to use parentheses (i.e., the form (ME1)’) to indicate the transpose operation that is desired. Table 3.10: Matrix transpose notation. * TYPE DAY’ : a 2 by 10 matrix 1: 6 7 15 2: 0.111 0.078 0.831 8 9 10 11 12 13 14 0.095 0.126 0.243 0.18 0.202 0.387 0.465 Note that when a matrix has a large number of columns, its rows may be broken between the end of one line and the beginning of the next in matrix output, as shown above. A method to avoid this annoyance will be given later. As noted in the introduction to Section 3.2, the LIST expression may have matrix arguments as well as scalar arguments. Table 3.11 summarizes the general form of the LIST operator. The general LIST expression of n arguments (n ≥ 1) has the form: LIST(E1,E2,...,En) The expressions, Ei, may be scalar expressions, SEi, or matrix expressions MEi, i = 1,2,...,n. The result is a column vector of values. If Ei is a scalar expression, SEi, the element of the vector is the value, SEi. If Ei is a matrix expression, MEi, the elements of the vector are the values of MEi taken row by row. The value or values are concatenated on the result. Table 3.11: LIST expression, general form. For example, observe the following MLAB dialog: * TYPE R1, R2 R1: a 3 by 2 matrix 59 1: 1 2: 3 3: 5 2 4 6 R2: a 2 by 3 matrix 1: 7 2: 10 8 11 9 12 * M = LIST(R1,-35,R2) * TYPE M M: a 1: 2: 3: 4: 5: 6: 7: 8: 9: 10: 11: 12: 13: 13 by 1 matrix 1 2 3 4 5 6 -35 7 8 9 10 11 12 Another operator that is useful for editing matrices is the SHAPE operator. The SHAPE operator is used to convert a column vector into a matrix of any size, as is shown in Table 3.12 and the following dialog: * TYPE SHAPE(2,4,1:8) : a 1: 1 2: 5 2 by 4 matrix 2 6 3 7 4 8 * M = LIST(0,1,3,5,10,21) * TYPE SHAPE(4,2,M) : a 1: 0 4 by 2 matrix 1 60 2: 3 3: 10 4: 0 5 21 1 The SHAPE operator requires three arguments: the number of rows and columns for the resultant matrix and a column vector of values. As the dialog above shows, if the resultant matrix requires more than the number of elements in the column vector, the column vector is extended with as many copies of itself as are necessary to fill the resultant matrix. This demonstrates a second principle for supplying missing matrix elements in MLAB, called matrix expansion by cyclic extension. The general SHAPE expression has the form: SHAPE(SE1,SE2,ME1) If SE1 and SE2 are positive integers m and n, respectively, and ME1 is a column vector, B, of k rows, then the result is an m by n matrix whose elements are the elements of ME1 assigned on a row-by-row basis. More precisely, if k ≥ m · n, the elements of the resulting matrix A, are the elements of B, such that Ai,j = B(i−1)·m+j if k < m · n, the elements of the resulting matrix A, are the elements of B, such that Ai,j = B1+(((i−1)·m+j−1) mod k) If ME1 is not a column vector, then LIST(ME1) is used in its place. Table 3.12: SHAPE expression, general form. The operation 1 + (((i − 1) · m + j − 1) mod k) means compute the value of ((i − 1) · m + j − 1), divide by k, take the remainder, and add 1. This effectively extends column vector B with copies of itself. There are two matrix operations, ROW and COL, that are used to form submatrices of existing matrices by selecting certain rows or columns. The ROW operator is described in Table 3.13 and the COL operator is described in Table 3.14. For example, if DM is a 6 by 20 matrix in MLAB, then DM ROW 3:6 COL 6:10 is a matrix expression denoting the 4 by 5 submatrix of DM formed from the elements in rows 3,4,5, and 6 and columns 6,7,8,9, and 10 of the matrix DM. Note that the colon notation for sequences of consecutive integers is used to indicate the selected rows and columns; this is a commonly used form of the ROW and 61 COL matrix expressions. However, ROW and COL operations can also be used to rearrange the order of the rows or columns, and to repeat or skip rows or columns. For example, DM ROW (2,5,1,5) denotes a 4 by 20 matrix with the first row the same as the second row of DM, the second and fourth rows the same as the fifth row of DM, and the third row the same as the first row of DM. DM COL (20:1:-1) denotes the matrix obtained from DM by reversing the order of the columns, from the twentieth to the first. A simpler use for ROW and COL is to choose a particular row or column of a matrix. That is, DM ROW 4 and DM COL 1 are the corresponding 1 row by 20 column vector (a row vector) and 6 row by 1 column vector (a column vector), respectively. In general, ROW matrix operations have one of the following forms: ME1 ROW ME2 For an arbitrary m by n matrix ME1 and a k by 1 column vector ME2 of integers j1 ,j2 ,...,jk with all ji between 1 and m, the result is a k by n matrix with ith row equal to row ji of ME1 for i = 1, 2, ..., k. All entries of ME2 are made into integer values by applying INT if necessary, and an error message appears if a nonexistent row of ME1 is indicated. ME1 ROW SE1 ME1 ROW (SE1,...,SEn) Use with NCOLS(ME2) > 1 is equivalent to ME1 ROW LIST(ME2). In other words, elements are taken from ME2 row by row to use as row numbers of ME1. equivalent to ME1 ROW LIST(SE1) equivalent to ME1 ROW LIST(SE1,...,SEn) Table 3.13: ROW matrix operators. In addition to the simple matrix assignment commands and matrix entry assignment commands previously described, there are additional matrix assignment commands based on ROW or COL specifications, as. summarized in Table 3.15 and Table 3.16. That is, one or more given rows of a matrix can be directly replaced, leaving the other rows unchanged. Similarly, specified columns of a matrix can be directly replaced. For example, recall the MLAB dialog in Chapter 1 which created the matrix DAY: * DAY = 6:15 * DAY COL 2 = LIST(.111,.078,.095,.126,.243,.180,.202,.387,.465,.831) The second command above expands the column vector DAY to a 2 column matrix with the first column unchanged and the second column as specified by the LIST expression. A matrix can also be created by a ROW or COL matrix assignment command, if an unknown identifier instead of 62 In general, COL matrix operations have one of the following forms: ME1 COL ME2 For an arbitrary m by n matrix expression ME1 and ME2 a k by 1 column vector of integers j1 , j2 ,...,jk , with all ji between 1 and n, the result is an m by k matrix with ith column equal to column ji of ME1 for i = 1, 2, ..., k. All entries of ME2 are made into integer values by applying INT if necessary, and an error message appears if a nonexistent column of ME1 is indicated. ME1 COL SE1 ME1 COL (SE1,SE2,...,SEn) Use with NCOLS(ME2) > 1 is equivalent to ME1 COL LIST(ME2) equivalent to ME1 COL LIST(SE1) equivalent to ME1 COL LIST(SE1,SE2,...,SEn) Table 3.14: COL matrix operators. the identifier of an existing matrix is given. Note that a combination of the principle of matrix expansion by cyclic extension and the principle of matrix expansion by zero extension is used to supply missing matrix elements. Matrix expansion by cyclic extension is applied when there are insufficient data for an explicit row and/or column assignment. Matrix expansion by zero extension is applied for implicit row and/or column assignment. This distinction will become clearer in the examples to follow. Some typical uses of ROW and COL matrix assignment commands follow. If A is a 20 by 5 matrix, then * A ROW 5:8 = KREAD(4,5) replaces rows 5, 6, 7, and 8 of matrix A by a 4 by 5 matrix that is typed in at the keyboard. If B is a column vector of length 18, * A COL 3 = B replaces the first 18 elements of column-3 of matrix A by column vector B. A(19,3) gets B(1) and A(20,3) gets B(2) in accordance with the cyclic extension matrix expansion principle. After these assignment commands, A is still the same size, but the command: 63 * A COL 7 = B enlarges matrix A to a 20 by 7 matrix with column-6 all zeros and column-7 equal to column vector B plus B(1) and B(2) in rows 19 and 20, respectively. Note column-6 was not explicitly assigned so the principle of matrix expansion by zero extension was used for column-6. Data was explicitly provided for column-7 so the principle of matrix expansion by cyclic extension was used for column-7. The command: * A ROW (3,6,11,19) = A ROW (6,19,3,11) permutes rows 3, 6, 11, and 19 of matrix A while the command: * A COL (1,2,5) = A COL (5,1,2) permutes columns 1, 2, and 5 of matrix A. If C is an n by 7 matrix for n >= 3, * A ROW (1,4,3) = C has the same effect as the three commands: * A ROW 1 = C ROW 1 * A ROW 4 = C ROW 2 * A ROW 3 = C ROW 3 Observe that only three rows of C were actually used above. If C was a 1 by 7 matrix, * A ROW (1,4,3) = C would substitute C for each of rows 1, 4, and 3. There are two MLAB matrix operations, denoted by ampersand (&) and ampersand-apostrophe (& ’), which allow one to join two matrices together to form a larger matrix. These operators are described in Table 3.17. Roughly speaking, the ampersand operation forms the larger matrix by placing the second matrix argument below the first, while the ampersand-apostrophe operation forms the larger matrix by placing second matrix argument to the right of the first. These operations are called row concatenation (& ) and column concatenation (& ’). Matrix expansion by cyclic extension is used, if necessary, to fill any unspecified entries in the resulting matrix. Observe the following MLAB dialog: 64 The M M M general forms of the ROW matrix assignment commands are: ROW ME1 = ME2 ROW SE1 = ME2 ROW (SE1, SE2, ... ,SEn) = ME2 Here, M is either an MLAB matrix identifier or an unknown identifier. If M is unknown, the command is executed just as if M was the 1 by 1 matrix [0]. Because SE1 abbreviates LIST(SE1) and because (SE1,SE2, ... , SEn) abbreviates LIST(SE1,SE2,...,SEn) in the second and third forms of the matrix assignment commands given above, only the first form (that containing ME1), needs separate discussion. Let ME1 denote a column vector (if NCOLS(ME1) > 1 then LIST(ME1) is used) of positive integers j1 ,j2 ,...,jk , which represent row numbers of M. If necessary, the INT function is applied to the entries of ME1 to produce j1 , j2 , ... , jk . If any ji is zero or negative, an error message appears. Suppose M is an m by n matrix and ME2 is an m′ by n′ matrix expression. Then the command: M ROW ME1 = ME2 causes M to become an m∗ by n matrix, where m∗ is the maximum of m and j1 , j2 , ... , jk . First, if m′ > k or n′ > n, a warning message is printed that the dimensions of ME2 exceed the dimensions of the left hand side matrix. Then, if m < m∗ , m∗ − m rows of zeros are added to M. Next, for each i ≤ k, the ith row of ME2 replaces row ji of M, with cyclic extension or truncation of the ith row of ME2, as necessary. If i > m′ , so there is no ith row of ME2, m′ is subtracted successively from i until the remainder is between 1 and m′ , i.e. the rows of ME2 are used cyclically to replace rows of M as required. Table 3.15: ROW matrix assignment command. * TYPE MA,MB MA: a 1: 1 2: 7 2 by 3 matrix -1 1 2 3 65 The M M M general forms of the COL matrix assignment commands are as follows: COL ME1 = ME2 COL SE1 = ME2 COL (SE1,SE2,...,SEn) = ME2 As in ROW matrix assignment commands, M denotes an MLAB matrix identifier or an unknown identifier, SE1 abbreviates LIST(SE1), and (SE1,SE2,...,SEn) abbreviates LIST(SE1,SE2,...,SEn). Let ME1 denote a column vector (if NCOLS(ME1) > 1 then LIST(ME1) is used) of positive integers j1 , j2 , ... , jk , representing column numbers of M. If necessary, the INT function is applied to the entries of ME1 to produce j1 , j2 ,..., jk . If any ji is 0 or negative, an error message appears. Let M be an m by n matrix and ME2 be an m′ by n′ matrix expression. Then the command: M COL ME1 = ME2 causes M to become an m by n∗ matrix, where n∗ is the maximum of n and j1 , j2 , ... , jk . Again, if m′ > m or n′ > k a warning message is printed that the dimensions of ME2 exceed the dimensions of the left hand side matrix. Then, if n < n∗ , n∗ − n columns of zeros are added to M. Next, for each i ≤ k, the ith column of ME2 replaces column ji of M, with cyclic extension or truncation of the ith column of ME2, as necessary. If i > n′ , then n′ is subtracted from i until the remainder is between 1 and n′ . That is, the columns of ME2 are used cyclically to replace the columns of M as required. Table 3.16: COL matrix assignment command. MB: a 1: 4 1 by 3 matrix -2 2 * TYPE MA & MB : a 1: 1 2: 7 3 by 3 matrix -1 1 2 3 66 3: 4 -2 2 * TYPE (MA ROW(2,1) COL 2) &’ MB : a 2 by 4 matrix 1: 1 2: -1 4 4 -2 -2 2 2 * TYPE (MA COL 1) & MB : a 1: 1 2: 7 3: 4 3 by 3 matrix 1 7 -2 1 7 2 * TYPE (MA COL 3) &’ MB : a 1: 2 2: 3 2 by 4 matrix 4 4 -2 -2 2 2 For example, suppose an experiment continues for three weeks, with one daily measurement taken from each of 50 experimental animals. Assume that one has entered three 50 by 7 matrices W1, W2, and W3, of data recorded from the first, second, and third weeks of the experiment. Then the MLAB command: * E = (1:21)’ & (W1 &’ W2 &’ W3) will create a 51 by 21 matrix E which has days 1 to 21 of the experiment numbered across the top row and has the full 21 day responses of the 50 experimental animals in rows 2 through 51. There is a matrix repeating expression, denoted by double carets(^^), which is related to the ampersand (& ) matrix expression. This is described in Table 3.18. For example, MA ^^3 is equivalent to MA & MA & MA. That is, the specified number of copies of the given matrix are joined successively from top to bottom of the resulting matrix. To join copies of a matrix from left to right to form a larger matrix, the column-wise replication operator (^^’) described in Table 3.19 can be used. For example, the matrix expression (MA ^^’4)’ is equivalent to MA & ’MA &’MA & ’MA. The matrix joining and repeating operations can also act on scalar expressions, which are then treated like column or row vectors, as appropriate, with all components equal to the given scalar 67 Let ME1 be an m by n matrix expression, [aij ] and ME2 be an m′ by n′ matrix expression, [bij ] throughout. In general, the matrix joining operations are given as follows: ME1 & ME2 The result is an (m + m′ ) by n∗ matrix [cij ], where n∗ is the larger of n and n′ . The m rows of ME1 are followed by the m′ rows of ME2 with all rows extended to length n∗ by cyclic replication of columns as necessary. More precisely, cij = ai,1+[(j+n−1) mod n] if i ≤ m and j ≤ n∗ , cm+i,j = bi,1+[(j+n′ −1) mod n′ ] if i ≤ m′ and j ≤ n∗ . ME1 & ’ ME2 The result is an m∗ by (n + n′ ) matrix, [cij ], where m∗ is the larger of m and m′ . The n columns of ME1 are followed by the n′ columns of ME2 with all columns extended to length m∗ by cyclic extension of rows if necessary. More precisely, cij = a1+[(i+m−1) mod m],j if i ≤ m∗ and j ≤ n, ci,n+j = b1+[(i+m′ −1) mod m′ ],j if i ≤ m∗ and j ≤ n′ , Table 3.17: Matrix joining operators. In general, the matrix row repeating operation is given by: ME1 ^^SE1 If SE1 is a positive integer n, then this expression is equivalent to ME1 & ME1 & ... & ME1 (n-fold repetition). For any number SE1 the expression is equivalent to ME1 ^^INT(SE1). Table 3.18: Matrix row replication operator. In general, the matrix column repeating operation is given by: ME1 ^^’ SE1 If SE1 is a positive integer n, then this expression is equivalent to ME1 & ’ME1 & ’... & ’ME1 (n-fold repetition). For any number SE1 the expression is equivalent to ME1 ^^’ INT(SE1). Table 3.19: Matrix column replication operator. 68 value. (See Table 3.20.) The matrix dimensions are computed so that the resulting operation makes sense. For example, observe the following MLAB dialog: * TYPE 6 &’ (2:3) &’ (-1) : a 1: 6 2: 6 2 by 3 matrix 2 3 -1 -1 * TYPE (1^^4)’ : a 1: 1 1 by 4 matrix 1 1 1 * TYPE 9 & LIST(3,2,-4)’ : a 1: 9 2: 3 2 by 3 matrix 9 2 9 -4 The following general forms of matrix joining and matrix repeating operations are evaluated as indicated: SE1 & SE2 a 2 by 1 column vector with the first element equal to SE1 and the second element equal to SE2. SE1 & ’ SE2 a 1 by 2 row vector with the first element equal to SE1 and the second element equal to SE2. SE1 ^^SE2 an n by 1 column vector with all elements equal to SE1, where n = INT(SE2) ≥ 1. SE1 & ME1 equivalent to: (SE1 ^^NCOLS(ME1))’ & ME1 ME1 & SE1 equivalent to: ME1 & (SE1 ^^NCOLS(ME1))’ SE1 & ’ ME1 equivalent to: (SE1 ^^NROWS(ME1)) & ’ ME1 ME1 & ’ SE1 equivalent to: ME1 & ’ (SE1 ^^NROWS(ME1)) Scalars are treated like constant row vectors for ampersands, and like constant column vectors for ampersand-apostrophes. Table 3.20: Matrix joining and repeating operator evaluation. A constant matrix of any size can easily be constructed using matrix editing operations. For example, if A, M and N are MLAB scalars such that M and N are integers, then ((A ^^N)’) ^^M describes an M by N matrix with all entries having the scalar value A. 69 Numbers can be sorted into an increasing sequence using the SORT matrix expression of MLAB as described in Table 3.21. For example, a column vector can be sorted as shown in the following MLAB dialog: * TYPE V V: a 1: 2: 3: 4: 5: 5 by 1 matrix -2.2 4.1 3.7 -1.5 0.7 * TYPE SORT(V,1) : a 1: 2: 3: 4: 5: 5 by 1 matrix -2.2 -1.5 0.7 3.7 4.1 An arbitrary matrix M can be sorted so that a specified column k is an increasing sequence. That is, the sort process permutes the rows of the matrix so that the entries in the k th column are an increasing sequence. The sort is “stable”, in that rows with the same entry in column k of the sorted matrix will appear in the same relative order as they were in the unsorted matrix. Therefore, one can sort a list of row vectors into lexicographic order by sorting successively on several columns, as shown in the following MLAB dialog: * TYPE M M: a 1: 2: 3: 4: -1 7 7 -1 4 by 3 matrix 5 4 3 8 6 -8 9 6 * N = SORT(M,2) * TYPE N N: a 4 by 3 matrix 70 1: 2: 3: 4: 7 7 -1 -1 3 4 5 8 9 -8 6 6 * R = SORT(N,1) * TYPE R R: a 1: 2: 3: 4: -1 -1 7 7 4 by 3 matrix 5 8 3 4 6 6 9 -8 By sorting first on column 2 of the martix M, the matrix N is obtained. Then, by sorting on column 1 of matrix N the matrix R is obtained. In matrix R, note that blocks of successive rows with the same entry in column 1 correspond to increasing sequences in column 2. That is, 5, 8 is an increasing sequence in column 2 for both -1 entries in column 1; and 3, 4 is an increasing sequence in column 2 for both 7 entries in column 1. Lexicographic order may be obtained more directly by SORT(ME1,0). A matrix may be sorted so that column k occurs in descending order by SORT(ME1,-k). The general form of the SORT matrix expression is given by: SORT(ME1,SE1) Let ME1 = [aij ], an m by n matrix expression. Suppose SE1 is a positive integer k, k ≤ n. Then the result is an m by n matrix obtained by permuting the rows of ME1 so that: (1) column k of the result has an increasing sequence of matrix entries, and (2) row order is not changed for rows with the same kth component. An error message appears if INT(SE1) is not a valid column of ME1. Table 3.21: SORT matrix operator. Other useful matrix editing operators are GETDIAG, COMPRESS, ROTATE, MAXROW, and MINROW, which are described in Table 3.22. GETDIAG returns a 1-column matrix consisting of the largest main diagonal of a matrix. COMPRESS returns a copy of a matrix with all rows removed in which an element in a specified column is zero. ROTATE returns a copy of a matrix with its rows rotated 71 down a given number of indices. MAXROW returns the row index of the maximum of all values in a specified column. Similarly, MINROW returns the row index of the minimum of all values in a specified column. Let ME1 = [aij ], an m by n matrix expression. The following forms of matrix editing operations are evaluated as indicated: GETDIAG(ME1) Let k be the smaller of m and n. The result is a k by 1 column vector, [di ], such that di = aii , i = 1, 2, ..., k. That is, the result is the largest main diagonal of ME1. COMPRESS(ME1,SE1) Let SE1 be a positive integer k, k ≤ n and m∗ be the number of elements in column k of ME1 not equal to zero. The result is an m∗ by n matrix which is a copy of the rows of ME1 in which the k th element, aik ,is not 0. ROTATE(ME1,SE1) Let SE1 be an integer k. The result is an m by n matrix whose rows are the rows of ME1 rotated down k indices. That is, the result is the matrix M ROW ((NROWS(ME1)+1-k) NROWS(ME1),1:NROWS(ME1)-k). If k > m then the rows of ME1 are rotated down k mod m rows. If k < 0 then the rows of ME1 are rotated up k rows. MAXROW(ME1,SE1) Let SE1 be a positive integer k, k ≤ n. The result is an integer r, 1 ≤ r ≤ m, such that ark > aik for i = 1, 2, ..., m. That is, the result is the row index r for which ark is the maximum for all values in column k. In case of ties, the result is the least row index. MINROW(ME1,SE1) Let SE1 be a positive integer k, k ≤ n. The result is an integer r, 1 ≤ r ≤ m, such that ark < aik for i = 1, 2, ..., m. That is, the result is the row index r for which ark is the minimum for all values in column k. In case of ties, the result is the least row index. Table 3.22: Some useful matrix editing operators. In this Matrix Editing Operations section, it was shown that the TYPE command can be used for displaying lists of matrix identifiers or, more generally, matrix expressions. That is, the form: * TYPE ME1, ME2, ... , MEn 72 will cause n numerical matrices to be displayed. If the matrix expression is an MLAB identifier, a heading containing the identifier and the dimensions of the matrix will precede the listed values of the matrix. Otherwise, only a heading containing the dimensions of the matrix precedes the display of numbers. One useful form of the above TYPE command employs the COL operation for handling large matrix displays. Where the rows of a given matrix are too long to be accommodated in one line, this command form will divide the matrix into convenient parts. For example, if C is a 10 column matrix to be examined, the command: * TYPE C COL 1:5, C COL 6:10 will cause C to be typed in two parts, columns 1 to 5 and columns 6 to 10. This keeps the rows short enough to be shown on one line. Thus, vertical alignment of the columns is maintained and the ”wrap-around” problem for long-lines is avoided. 3.5 MATRIX ARITHMETIC OPERATIONS There are a number of matrix arithmetic operations available for use in MLAB matrix expressions. Arithmetic operations involving one scalar argument and one matrix argument allow: • adding a scalar to a matrix • subtracting a scalar and a matrix from each other • multiplying a matrix by a scalar • dividing a matrix by a scalar Caution: the operation of raising a matrix to a scalar power follows a different rule, to be discussed later. The forms of matrix arithmetic operations with scalar/matrix arguments are given in Table 3.23 and examples are given in the following MLAB dialog: * TYPE V V: a 1: -1 2 by 3 matrix 7 0 73 2: 6 2 -4 * U = 6 * TYPE (U/2) + V : a 1: 2 2: 9 2 by 3 matrix 10 5 3 -1 * TYPE 0.5 - V : a 2 by 3 matrix 1: 1.5 2: -5.5 -6.5 -1.5 0.5 4.5 * TYPE (-2)*V : a 2 by 3 matrix 1: 2 2: -12 -14 -4 0 8 * TYPE (V COL 1:2) / (U-1) : a 2 by 2 matrix 1: -0.2 2: 1.2 1.4 0.4 There are MLAB matrix expressions for the standard matrix arithmetic operations, as shown in Table 3.24. The entry-by-entry negative of a matrix can be computed. Also, the sum or difference of a pair of matrices can be formed. For example, observe the following matrix dialog: * TYPE M1,M2 M1: a 1: 1 2: 3 M2: a 1: -1 2: 3 2 by 3 matrix 5 -7 -2 0 2 by 3 matrix 4 -6 12 -2 74 Let SE1 and ME1 be, respectively, a scalar expression and an m by n matrix expression, [aij ], in all operations below. Assume the value of SE1 is x. The general forms of permitted matrix expressions involving arithmetic operations with scalar and matrix arguments (excluding raising to a power) are given below: SE1 + ME1 result is an m by n matrix, [bij ], with bij = x + aij for all i ≤ m and j ≤ n ME1 + SE1 equivalent to SE1 + ME1 SE1 - ME1 result is an m by n matrix, [bij ], with bij = x − aij for all i ≤ m and j ≤ n ME1 - SE1 equivalent to (-SE1) + ME1 SE1 * ME1 result is an m by n matrix, [bij ], with bij = x ∗ aij for all i ≤ m and j ≤ n ME1 * SE1 equivalent to SE1 * ME1 ME1 / SE1 equivalent to (1/SE1) * ME1 Table 3.23: Matrix expressions with scalar/matrix arguments. * TYPE -M1 : a 1: -1 2: -3 2 by 3 matrix -5 7 2 0 * TYPE M1 + M2 : a 1: 0 2: 6 2 by 3 matrix 9 -13 10 -2 * TYPE M1 - M2 : a 1: 2 2: 0 2 by 3 matrix 1 -1 -14 2 If MA and MB are matrices of different sizes, then rows and columns are cyclically replicated in MA and MB as needed in order to compute MA + MB or MA - MB. This is similar to the matrix expansion by cyclic extension principle for matrix editing operations and ROW or COL matrix assignment commands. For example, observe the MLAB dialog: 75 * TYPE U,V U: a 2 by 1 matrix 1: 6 2: 4 V: a 1: 7 1 by 2 matrix -1 * TYPE U + V : a 1: 13 2: 11 2 by 2 matrix 5 3 The dimensions of a matrix sum or difference are the smallest possible. In other words, NROWS(MA+MB) and NROWS(MA-MB) are the larger of the two numbers NROWS(MA) and NROWS(MB), and NCOLS(MA+MB) and NCOLS(MA-MB) are the larger of the two numbers NCOLS(MA) and NCOLS(MB). In the operations below, let ME1 be an m by n matrix expression, [aij ], and ME2 be an m′ by n′ matrix expression, [bij ]. The general forms of the above matrix arithmetic operations are: ME1 + ME2 The result is an m∗ by n∗ matrix [cij ] with m∗ the larger of m and m′ and n∗ the larger of n and n′ . Define aij = a1+[(i+m−1) mod m],1+[(j+n−1) mod n] when i > m or j > n, and bij = b1+[(i+m′ −1) mod m′ ],1+[(j+n′ −1) mod n′ ] when i > m′ or j > n′ . Then the result is cij = aij + bij . -ME1 result is the m by n matrix [−aij ] ME1 - ME2 equivalent to ME1 + (-ME2). Table 3.24: Matrix expressions with matrix arguments. The Euclidean length |v| of an n-dimensional vector: v = (v1 , v2 , ..., vn ) is given by the formula: 76 v uX u n 2 vj |v| = t j=1 In MLAB, the LENGTH operation on a matrix computes Euclidean vector lengths, as described in Table 3.25. More precisely, the rows of the m by n matrix argument are treated as n-dimensional vectors, and an m by 1 column vector of Euclidean lengths is computed. Observe the following MLAB dialog: * E E: a 3 by 2 matrix 1: 3 2: 0.5 3: -1 4 0.5 2 * LENGTH(E) : a 3 by 1 matrix 1: 5 2: .707106781 3: 2.23606798 The general form for vector length computation is: LENGTH(ME1) If ME1 is an m by n matrix expression, [aij ], then the result is an m by 1 column vector, [di ], such that di is the Euclidean length of (ai1 , ai2 , ..., ain ) for i ≤ m. Table 3.25: Vector LENGTH operator. In matrix algebra, the product of an m by p matrix A and a p by n matrix B is an m by n matrix C given as follows: cik = p X aij bjk j=1 where A = [aij ], B = [bij ], and C = [cik ]. That is, the number of columns of A equals the number of rows of B, and each entry of C = AB is formed from a row of A and column of B by the inner product operation for vectors. In MLAB, matrix products are indicated by an asterisk (*), as for scalar products. The matrix product operation is described in Table 3.26. For example, observe the following MLAB dialog: 77 * TYPE A,B A: a 1 by 2 matrix 1: -1 B: a 2 2 by 3 matrix 1: 3 2: -1 0 1 1 2 * TYPE A*B : a 1: -5 1 by 3 matrix 2 3 If the first matrix argument has too many columns or the second matrix argument has too many rows, an error message is printed. The general form of the matrix product operation is the following: ME1 * ME2 If ME1 is an m by c matrix expression, [aij ], and ME2 is an c by n matrix expression, [bjk ], then the result is an m by n matrix, [cik ], with: cik = Pc j=1 aij bjk This is the usual matrix product. Table 3.26: Matrix product operation. In MLAB, one can indicate repeated products A*A*...*A of a given square matrix A by raising A to a (scalar) integer power. The matrix power operation is described in Table 3.27. For example, note the following MLAB dialog: * TYPE A A: a 1: 3 2: -2 2 by 2 matrix -7 8 78 * TYPE A^3 : a 2 by 2 matrix 1: 223 2: -222 -777 778 Note that TYPE A ^3 is the same as TYPE A*A*A. Raising a square matrix to the power zero yields an identity matrix of the same size, and raising a nonsingular (square) matrix A to the −1 power yields the matrix inverse as shown in the continuation of the above dialog: * TYPE A^0 : a 1: 1 2: 0 2 by 2 matrix 0 1 * B = A^(-1) * TYPE B, A*B B: a 1: 0.8 2: 0.2 : a 2 by 2 matrix 0.7 0.3 2 by 2 matrix 1: 1 2: 2.22044605E-16 0 1 Note that A*B is not a perfect identity matrix, due to small rounding errors in computing the entries of B. Nonsingular square matrices can also be raised to negative integer powers. For example, A ^(-5) is the same as B ^5 if B is the inverse matrix of A. Matrices raised to integer powers are also defined for negative powers of singular square matrices, and even for negative powers of non-square matrices. The Moore-Penrose generalized inverse is used; however, further discussion of these cases will be omitted here. In MLAB, an element-by-element matrix product operation, denoted by asterisk-apostrophe (*’), is also available, as described in Table 3.28. For matrices with the same dimensions, the result is obtained by multiplying corresponding matrix entries pairwise. If one argument is a column vector, then the result is obtained by multiplying each row of the other matrix argument by the corresponding vector component. Examples are shown in the following MLAB dialog: 79 In general, matrix powers are given as follows: ME1 ^SE1 Usually, SE1 is an integer n; if not, an error message is printed. Assume ME1 is a square m by m matrix A. If n > 0, the result is A*A*...*A (n times). If n = 0 the result is an m by m identity matrix, [dij ], where dii = 1 and dij = 0 for i 6= j. If n = −1 and ME1 is a nonsingular matrix A, then the result is the matrix inverse A−1 . If n < −1, the result is (A−1 ) ∗ (A−1 ) ∗ ... ∗ (A−1 ) (n times). As usual, the circumflex (^) may be replaced by double asterisks (**). Table 3.27: Matrix power operation. * TYPE UX,UY,V UX: a 1: 1 2: -3 UY: a 1: -2 2: 6 V: a 2 by 3 matrix 2 4 5 -1 2 by 3 matrix -2 1 4 3 2 by 1 matrix 1: 8 2: -3 * TYPE UX *’ UY : a 1: -2 2: -18 2 by 3 matrix -4 4 20 -3 * TYPE V *’ UX : a 1: 8 2: 9 2 by 3 matrix 16 -12 40 3 80 Element-by-element matrix products are computed by component-by-component multiplication of corresponding columns of the two matrix arguments. If two column vectors have unequal lengths, then the elements of the shorter column vector are recycled and paired with the remaining components of the longer vector. If one matrix has fewer columns than the other, then the columns of the narrower matrix are used cyclically (first column used again after the last, then second column again, etc.). For example, if A has twice as many columns as B, then A *’ B and A *’ (B & ’ B) are equivalent matrix expressions. For a column vector B, A *’ B is equivalent to the matrix expression A *’ (B ^^’ NCOLS(A)). As previously noted, this is the same as multiplying each row of A by the corresponding component of B. The general form of the element-by-element matrix product is given by: ME1 *’ ME2 Let ME1 be an m by n matrix expression, [aij ], and ME2 be an m′ by n′ matrix expression, [bij ]. The result [cij ] is an m∗ by n∗ matrix, where m∗ is the larger of m and m′ and n∗ is the larger of n and n′ . Then cij = aij ∗ bij , where aij is defined for j > n by successively subtracting n from j until the result is between 1 and n, and bij is defined for j > n′ by successively subtracting n′ from j until the result is between 1 and n′ . Table 3.28: Element-by-element matrix product operation. Similarly, the matrix transpose and element-by-element matrix product operations can be used to multiply each column of a matrix component-by-component with a given row vector. 3.6 RANKORDER AND DISTRIBUTION OF VALUES IN A MATRIX Given data in a matrix, M, it is often desired to calculate the empirical distribution or the numerical ranking of the data values in M. One method of calculating the density function, or histogram of data given in a matrix is given in Section 6.2. The empirical cumulative distribution of the data can be easily calculated using the MLAB CDF operator. The CDF operator, described in Table 3.29, takes a matrix of values, M, and a matrix of values, A, over which to compute the values of the distribution function of the data. It will return a matrix whose first column contains the values of A and whose second column contains the number of values from M which are less than or equal to the corresponding value in A divided by the total number of values in M. While graphing this distribution matrix will be left to Section 6.1, we can look at the CDF operator in the following dialog: * M = LIST(7,1,5,2,7,5,8,1,3,7) * TYPE CDF(M,1:10) 81 : a 1: 2: 3: 4: 5: 6: 7: 8: 9: 10: 10 by 2 matrix 1 2 3 4 5 6 7 8 9 10 0.2 0.3 0.4 0.4 0.6 0.6 0.9 1 1 1 * TYPE CDF(M,SORT(M)) : a 1: 2: 3: 4: 5: 6: 7: 8: 9: 10: 1 1 2 3 5 5 7 7 7 8 10 by 2 matrix 0.2 0.2 0.3 0.4 0.6 0.6 0.9 0.9 0.9 1 The MLAB RANKORDER operator–described in Table 3.29 will take as input a matrix, M, sort it on its last column, and add an additional column beyond the last column which contains the rank values. For rows of M with identical last-column values, the rank values in the result matrix will be averaged. This is shown in the following dialog: * M = 1:5 &’ LIST(1,4,2,5,3) * TYPE RANKORDER(M) : a 1: 2: 3: 4: 5: 1 3 5 2 4 5 by 3 matrix 1 2 3 4 5 1 2 3 4 5 * M = 1:5 &’ LIST(1,3,2,3,4) 82 * TYPE RANKORDER(M),RANKORDER(M COL 1 &’ -(M COL 2)) : a 1: 2: 3: 4: 5: 1 3 2 4 5 : a 1: 2: 3: 4: 5: 5 2 4 3 1 5 by 3 matrix 1 2 3 3 4 1 2 3.5 3.5 5 5 by 3 matrix -4 -3 -3 -2 -1 1 2.5 2.5 4 5 Note the way in which we negated the second column of M in order to rank the matrix in descending order. The general form of the CDF and RANKORDER operators are given by: CDF(ME1,ME2) RANKORDER(ME1) The CDF operator, for NCOLS(ME1) = NCOLS(ME2) = k, will return a matrix whose last column gives the fraction of rows of ME1 whose values are all less than or equal to the corresponding values of ME2. The RANKORDER operator sorts ME1 on its last column and adds a column containing the rank values. The rank values are 1:NROWS(ME1) except that duplicate values are assigned the average of their row indices. Table 3.29: The CDF and RANKORDER operators, general forms. 3.7 TABULATION OF A FUNCTION It has been shown that a defined function or built-in function of n arguments can be evaluated at a given n-tuple of real numbers in MLAB. However, the MLAB user often wants to evaluate a function numerically at many points in order to study its properties in some region. The MLAB matrix operations ON and POINTS permit the evaluation of functions at many points in 83 one operation. For example, suppose that a table of numerical values of the hyperbolic cosine, cosh(x), in the interval from 0 to 1 is desired, and that computation at every step of size 0.01 is sufficient. The expression * COSH ON (0:1:0.01) describes a column vector of length 101 containing the numerical values: cosh(0), cosh(0.01), ..., cosh(0.99), cosh(1) The expression POINTS(COSH,0:1:0.01) describes a 101 by 2 matrix. The first column is the column vector of arguments 0, 0.01, etc. The second column now gives the function values cosh(0), cosh(.01), etc. Note that the rows of this two-column matrix may be regarded as (x, y) coordinates of points on the graph of the function y = cosh(x). Again, recall the MLAB commands: * M = 6:15:.05 * M = POINTS(Y,M) in Chapter 1. These commands assign the 181 by 2 matrix POINTS(Y,6:15:.05) to M. Here, Y was a defined function given by: * FUNCTION Y(X) = A*EXP(B*X) which describes an exponential curve with parameters A and B. The values of A and B were first set arbitrarily and then changed by a curve-fitting command to describe the best-fitting curve for the data DAY in Chapter 1. The matrix M may be regarded as a list of 181 points (x, y) lying on this exponential curve, with the consecutive x coordinates 6.00, 6.05, ... , 15.00. Although the ON and POINTS operations are most often used with functions of one variable and arithmetic sequence (colon) column vectors, they can be used with built-in or defined functions of n variables provided that the matrix expression for the list of arguments specifies an n-column matrix. For example, observe the following MLAB dialog: * FUNCTION F(X,Y) = 2*Y/X * TYPE B B: a 1: 1 2 by 4 matrix 2 3 4 84 2: 5 6 7 8 * TYPE F ON (B COL 1:2) : a 2 by 1 matrix 1: 4 2: 2.4 * TYPE POINTS(F,B COL (1,4)) : a 1: 1 2: 5 2 by 3 matrix 4 8 8 3.2 Symbolic derivatives can be evaluated by using the ON and POINTS matrix operations. For example, consider the following MLAB dialog: * FUNCTION G(X) = X*EXP(-X) * TYPE G DIFF X, POINTS(G DIFF X, 0:1:.2) FUNCTION G’X(X) = EXP(-X)-EXP(-X)*X : a 1: 2: 3: 4: 5: 6: 0 0.2 0.4 0.6 0.8 1 6 by 2 matrix 1 .654984602 .402192028 .219524654 8.98657928E-2 0 The ON and POINTS matrix operations may also be used to evaluate symbolic partial derivatives of MLAB functions of several variables. The MAPPLY operator is a useful extension of the ON operator. A typical expression is MAPPLY(F,M), where F is a function of one, two, or three arguments, and M is a matrix. An NROWS(M) by NCOLS(M) matrix is returned, whose (i, j)th entry is F(M(i,j)) if F is a function of one argument; F(i,j) if F is a function of two arguments; and F(i,j,M(i,j)) if F is a function of three arguments. The general form of the ON, POINTS, and MAPPLY operators are shown in Table 3.30. For example, suppose that B is a 10 by 4 matrix of positive numbers, and a 10 by 4 matrix B1 is to be constructed such that the entries of B1 are the base 10 logarithms of the corresponding entries of B. 85 The general descriptions of the ON, POINTS, and MAPPLY matrix operations are: F ON ME1 Here, F must be the identifier of a function, f, of n arguments, either defined by a FUNCTION command or a built-in function (e.g., SIN, EXP, etc.), and ME1 must be a matrix of n columns. If ME1 is an m by n matrix [aij ] then the result is an m-vector with ith component f (ai1 , ai2 , ..., ain ) for i = 1, 2, ..., m. POINTS(F,ME1) Equivalent to ME1 & ’ (F ON ME1) DF ON ME1 Equivalent to F ON ME1 except that the symbolic derivative F DIFF X1 DIFF X2 ... DIFF Xk specified by DF is evaluated. POINTS(DF,ME1) Equivalent to ME1 & ’ (DF ON ME1) MAPPLY(F,ME1) F must be a function of one, two, or three arguments. If ME1 is an m by n matrix, the result is an m by n matrix whose (i, j)th entry is F(M(i,j)) if F is a function of one argument; F(i,j) if F is a function of two arguments; or F(i,j,M(i,j)) if F is a function of three arguments. Table 3.30: ON, POINTS, and MAPPLY matrix operators. The expression LOG10 ON B does not work because LOG10 is a function of one argument and B has more than one column. However, the computation can be performed with B1 = MAPPLY(LOG10,B). Note that the result of an ON operation is always a column vector, but the result of a POINTS operation is a matrix of n + 1 columns for a function or derivative of n variables, while the result of an MAPPLY operation has both the row and column dimensions of the matrix to which the function was applied. 3.8 LINEAR INTERPOLATION There are many times when you may wish to search through a matrix of data to find the data value corresponding to a given measurement or key value. For example, if you have a matrix, M, containing values of a quantity corresponding to a range of times, you may wish to see the value of the quantity at a certain time without typing out the entire matrix and looking through it manually. The MLAB LOOKUP operator, described in Table 3.31, serves just this purpose. Given a 2-column matrix of key values and corresponding data values, the LOOKUP operator will return the data value corresponding to any given key value. 86 Using the matrix DAY from Chapter 1, have MLAB type out the dry weights corresponding to day 11 and day 8 by entering the following dialog: * USE TUTOR1 Using: W,CS1,DAY,B,A,M,Y * TYPE LOOKUP(DAY,11), LOOKUP(DAY,8) = .18 = .095 In the above dialog LOOKUP ’s were done on key values that existed in the matrix. As the following dialog shows, the LOOKUP operator will perform linear interpolation if necessary. * M = LIST(1,2,4,9,10) &’ (1:5) * TYPE LOOKUP(M,4) = 3 * TYPE LOOKUP(M,5),LOOKUP(M,8) = 3.2 = 3.8 The LOOKUP operator will perform linear interpolation only if the given key value is not found in the first column of the data matrix. However, the INTERPOLATE operator, explained in Section 6.2, provides the method of cubic spline interpolation if this is necessary. * M = LIST(1,5,3,2,4) &’ (1:5) * TYPE LOOKUP(M,1),LOOKUP(M,2),LOOKUP(M,3),LOOKUP(M,4),LOOKUP(M,5) = 1 = 1.25 = 1.5 = 5 = 5 As this dialog shows, the LOOKUP operator will not perform properly if the input matrix is not sorted on column one. The SORT operator, explained in Section 3.4, should be used if necessary. It is sometimes necessary to perform LOOKUP’s on data in multicolumn matrices. The matrix operations explained elsewhere in this lesson can usually be used to transform your data into the proper form. 87 The general form of the LOOKUP matrix operator is the following: LOOKUP(ME1,SE1) where ME1 is a two-column matrix in sort by column 1 and SE1 is the value to be searched for in ME1 COL 1. The result is the value from the second column of the row whose first column value is equal to SE1. If SE1 does not exist in column one of ME1 then linear interpolation is used. If NCOLS(ME1) > 2, then only the first two columns of ME1 are considered. Table 3.31: LOOKUP matrix operator 3.9 THE FOR COMMAND It sometimes happens that a sequence of similar MLAB commands is needed to achieve some objective. For example, suppose a 5 by 5 matrix M with all elements on the diagonal and below set equal to 1 and all elements above the diagonal set equal to 0 is desired. M could be created with the following MLAB commands: * * * * * M M M M M ROW ROW ROW ROW ROW 1 2 3 4 5 COL COL COL COL COL 1 = 1:2 1:3 1:4 1:5 1 = = = = 1 1 1 1 Because this is repetitious, MLAB provides a capability for repeated execution of an MLAB command. The repeated command usually makes reference to an index variable (an unknown or scalar MLAB identifier), which is assigned different scalar values for the different executions of the repeated command. Users familiar with traditional programming languages already know the similar concept of the loop. To execute a similar sequence of MLAB commands repeatedly, a general form for the MLAB command desired must first be constructed using an index variable. In the above example of constructing M, the general form of the command using the index variable J is: M ROW J COL 1:J = 1 Note that executing the above command four times with the index variable J assigned scalar values 1, 2, 3, 4, and 5, respectively, will create the matrix M wanted. The full MLAB command for the loop creating M is: 88 * FOR J = 1:5 DO {M ROW J COL 1:J = 1} This kind of repeated MLAB command is called a FOR command. The simple form of the FOR command is described in Table 3.32. The part of the command between FOR and DO looks like a matrix assignment command associating the column vector 1:5 to the index variable J. This is interpreted as specifying the scalar values to be assigned to the index variable J during consecutive repetitions of the command following DO. The number of repetitions equals the length of the column vector 1:5. The MLAB commands appearing between the left and right curly braces {} are repeatedly executed with J taking on the values 1,2,3,4, and 5. Note that the matrix M can also be computed as * M = DIAG((1^^5)^^’5,0:-4) or * FUNCTION F(I,J) = IF J <= I THEN 1 ELSE 0 * M = MAPPLY(F,SHAPE(5,5)) Although the FOR command is useful, it is slow and should be avoided when possible. Often there are matrix operators that can be used in place of FOR commands. In general, the (simple) FOR command has the form: FOR X = ME1 DO command An underscore ( ) may replace the equal sign (=). The matrix expression ME1 is usually a column vector; if NCOLS(ME1)> 1 then LIST(ME1) is used. The repeated MLAB command usually uses the index variable (X) in some scalar expression but this is not required. Table 3.32: FOR command, simple form. The matrix expression need not be an arithmetic sequence. The forms shown below are other examples of acceptable FOR commands: * FOR V = LIST(2.1,0,3,3,-2E4) DO {command} * FOR KK = (B COL 3) DO {command} The repeated command can itself be a FOR command, for example: 89 * FOR I = 1:10 DO {FOR J = 1:10 DO {A(I,J) = I+J-1}} In addition to the above simple form, the FOR command can also be used to specify repetitive execution of a list of MLAB commands, as described in Table 3.33. For example, suppose F is an MLAB function (via some FUNCTION command) and X is a k by 1 column vector of numbers x1 , x2 , ..., xk . The functional values: F (xi ), F (F (xi )), F (F (F (xi ))), ..., F (N )(xi ) obtained by iterated composition of the function F can be evaluated for all i <= k by the compound FOR command: * FOR J = 1:N DO {X = F ON X; TYPE J; TYPE X} At each iteration, X(I) is replaced by F(X(I)) for I from 1 to NROWS(X), and then J and the vector X are typed out. That is, J and the Jth iterate of F applied to the original vector X are typed out in each of N iterations, for a specified scalar N. The general form of the (compound) FOR command is: FOR X = ME1 DO command1; command2; ... ; commandn Note that semicolons are used to separate the MLAB commands. With this FOR command, the entire list of commands is repeatedly executed, once for each scalar value assigned to the index variable, X, as specified by the column vector ME1. Table 3.33: FOR command, compound form. If an operation can be executed either by a suitable matrix expression or by a FOR command, the FOR command should be avoided. Evaluation of a matrix expression in MLAB is almost always more efficient than execution of an equivalent FOR command. 90 3.10 SUMMARY In the following let SE1, SE2, ... denote arbitrary scalar expressions; let ME1, ME2, ... denote arbitrary matrix expressions; let U denote an unknown identifier; let M denote a matrix identifier; let F denote a function identifier defined by a FUNCTION command or a builtin function, with m arguments: X1, X2, ..., Xm; and DF denote an ordinary or partial derivative F’X1’X2 ... ’Xn. 1. Matrix Dimension Operations are: (a) NROWS(ME1); (b) NCOLS(ME1); 2. Matrix Expression Formation Rules are: (a) Matrix identifiers are matrix expressions (b) Parentheses may be used to indicate order of operations (c) Matrix input operations are: • • • • • LIST(SE1,SE2,...,SEn); LIST(ME1,ME2,...,MEn); KREAD(SE1,SE2); READ(CON,SE1,SE2); READ(CON); (d) Finite arithmetic sequences are: • SE1:SE2:SE3; • SE1:SE2; • SE1:SE2!SE3; (e) Matrix editing operations are: • • • • • • • • • • ME1’ (transpose); ME1 ROW ME2 (row selection); ME1 COL ME2 (column selection); ME1 & ME2 (above-below concatenation); ME1 & ’ ME2 (left-right concatenation); ME1 ^^SE1 (repeated above-below concatenation); ME1 ^^’ SE1 (repeated left-right concatenation); SORT(ME1,SE1); GETDIAG(ME1); COMPRESS(ME1,SE1); 91 • ROTATE(ME1,SE1); • MAXROW(ME1,SE1); • MINROW(ME1,SE1); (Some operations also work with scalar arguments.) (f) Matrix arithmetic operations are: • • • • • • • SE1 + ME1 ; ME1 + SE1; ME1 + ME2; SE1 - ME1; ME1 - SE1; ME1 - ME2; SE1 * ME1; ME1 * SE1; ME1 * ME2; SE1 / ME1; ME1 / SE1; ME1 / ME2; ME1 ^SE1 (** may replace ^); ME1 *’ ME2 ABS(ME1); • • • • • • F ON ME1; POINTS(F,ME1); MAPPLY(F,ME1); DF ON ME1; POINTS(DF,ME1); MAPPLY(DF,ME1); (g) Functions evaluated at matrix lists of arguments are: 3. MLAB Commands for Computation with Matrices are: (a) Matrix assignment commands: • • • • • • • • • • • • • • • U = ME1; M = ME1; U(SE1,SE2) = SE3; M(SE1,SE2) = SE3; U(SE1) = SE2; M(SE1) = SE2; U ROW ME1 = ME2; M ROW ME1 = ME2; U ROW SE1 = ME1; M ROW SE1 = ME1; U ROW (SE1,SE2,...,SEn) = ME1; M ROW (SE1,SE2,...,SEn) = ME1; U COL ME1 = ME2; M COL ME1 = ME2; U COL SE1 = ME1; 92 • M COL SE1 = ME1; • U COL (SE1,SE2,...,SEn) = ME1; • M COL (SE1,SE2,...,SEn) = ME1; (b) TYPE command for matrix expressions: • TYPE ME1,ME2,..., MEn; (c) FOR command: • FOR X = ME1 DO command; • FOR X = ME1 DO command1; command2; ... 3.11 ; commandn; EXERCISES 1. Suppose that a 7 by 5 matrix of data is recorded on paper and an MLAB matrix named N containing this data is to be created. (a) What MLAB command should be given so that N can be typed? (b) Suppose that the fourteenth number is accidentally mistyped while typing in the 35 matrix entries of N, so that the corresponding matrix entry holds an incorrect value. What MLAB command changes the incorrect entry to its correct value, say 65.3? (c) Suppose that a repetition of the 27th number on the list of 35 matrix entries is accidentally typed without noticing the error, so that all matrix entries following the twenty-seventh are not in the correct matrix positions for N . Construct one or more MLAB commands by which N could be corrected without the necessity of retyping all 35 entries. (d) Suppose that the first column of N should be the arithmetic sequence of the seven numbers 12, 24, 36, 48, 60, 72, 84. Construct N by an MLAB command or commands so that the entries in the first column need not be typed individually. 2. Let A = [aij ] and B = [bij ] be m by n matrices, and suppose that t is a number. Construct MLAB command(s) by which an m by n matrix C = [cij ] can be constructed so that: cij = (aij )2 + bij · t + t2 for all i ≤ m and j ≤ n. 3. Suppose that real numbers x1 , x2 , and x3 are to be determined by solving the system of linear equations below: x1 2 · x1 x1 +2 · x2 −x2 93 −x3 +2 · x3 +x3 = 144 = 63 = −30 It is known that this system is equivalent to the matrix equation AX = B, where: 1 A = 2 3 x1 X = x2 , x3 2 −1 0 2 , −1 1 144 B = 6 . −30 If A has an inverse matrix A−1 , it is known that X = A−1 B is the unique solution for the matrix equation AX = B. Construct MLAB commands to create the matrices A and B, set X equal to A−1 B, type X, and finally type AX to test whether AX = B is satisfied. 4. Construct MLAB commands to efficiently create the following matrices: (a) A 10 by 10 matrix Z = [zij ], such that zii = 0 and zij = 2 if i 6= j, for all i, j ≤ 10. (b) A 7 by 6 matrix K = [kij ], such that kij = 1 for i, j ≤ 2, kij = −1 if 3 ≤ i ≤ 7 and 3 ≤ j ≤ 6, and kij = 0 otherwise. (c) A 25 by 3 matrix U, where column 1 of U contains the integers 25, 24, 23, ... ,1 in descending sequence, column 2 is given by U(I,2) = U(I,1)*I*I for I ≤ 25, and column 3 is given by U(I,3) = I*(U(I,1)+U(I,2)) for I ≤ 25. (d) An 8 by 5 matrix CPT3, with every row equal to (.6, 4.1, -3.7, 2.1, -1.1). (Hint: Use the repeat operator (^^).) (e) A 10 by 10 matrix D = [dij ] such that dii = i for i ≤ 10 and dij = 0 for i 6= j. (Hint: Use a FOR command.) 5. Write MLAB commands to compute a 5 by 1 column vector M such that M(I) is the average (mean value) of the 7 numbers in column I of the matrix N in exercise 1, for I ≤ 5. Then write MLAB commands to divide each element of N by the mean value of the column of N to which that element belongs. (Hint: Use the *’ and ’ operations.) 6. Let a function f be given by: f (x) = [t − sin(x)]/[t + cos(x)] where t is constant. Write MLAB commands that will create a 21 by 2 matrix P which lists (x, y) coordinates for 21 points on the graph of y = f (x), with the x coordinates going from -1 to 1 in steps of size 1/10. Create a similar matrix PD for the derivative df (x)/dx of f (x). 7. The binomial coefficient C(m, n) is defined for integers m ≥ n ≥ 0 by the formula m!/n!(m− n)!, where 0! = 1. A 5 by 5 matrix of binomial coefficients with C(i − 1, j − 1) in row i and column j is given as: 1 1 1 1 1 0 1 2 3 4 94 0 0 1 3 6 0 0 0 1 4 0 0 0 0 1 It can be proved that C(m, n) = C(m − 1, n − 1) + C(m − 1, n) for m > n > 0, and clearly C(m, 0) = C(m, m) = 1 for all m. Construct a 10 by 10 matrix BC of binomial coefficients extending the above matrix, with BC(I,J) = C(I − 1, J − 1) for I, J ≤ 10. (Hint: Examine the effects of V = LIST(1) followed by repeated execution of the command V = V+(0 & ’V), and then use a suitable FOR command.) 8. The median of an odd number 2 · n + 1 of scalars is the middle element of the list of given scalars if they are put in increasing order, i.e. it is the (n + 1)st in the ordered list. Construct MLAB command(s) computing the median of the entries of a column vector S, assuming that NROWS(S) is odd. 9. Suppose that an m by n matrix D is regarded as a list of m n-dimensional row vectors. Construct MLAB command(s) by which an m by n matrix ND can be created, where ND is a list of m n-dimensional unit row vectors (vectors of Euclidean length 1), and each row vector of ND is a positive scalar multiple of the corresponding row vector of D. Assume that no rows of D are all zeros. 10. Suppose that you have a matrix, M, containing points along a curve. Use the LOOKUP and INTEGRAL operators to find the area under the curve contained in M. 11. Start an MLAB session. Test the answers for exercises 1-9 by first assigning numerical values to the scalars and matrices that were not specified. Keep a log of the session and have it printed. 95 Chapter 4 MAKING PICTURES WITH MLAB This chapter describes the detailed principles of MLAB graphics and MLAB graphics commands. For a simpler description of quick and automatic MLAB graphics, refer to the book MLAB Graphics Examples. Only two-dimensional pictures will be considered here. MLAB facilities for making images of curves and surfaces in three-dimensional space will be discussed in Chapter 9 of a future edition. Almost all MLAB users find that making pictures is a considerable part of their interaction with MLAB. MLAB graphics constructions are done using special MLAB commands. Although it is easy to make simple pictures with these commands, complex pictures can be more intricate to construct. One advantage of having a command-based facility available is that your graphics constructions can be scripted in a do-file for easy repetitive use. 4.1 GRAPHICAL DISPLAY CONTROL COMMANDS There are two MLAB commands used for overall control of graphical pictures: VIEW and UNVIEW. The VIEW and UNVIEW commands, described in Table 4.1, are like on and off switches for graphical pictures. When running MLAB on systems with a graphical window-based user interface, such as Linux/Unix with X-Windows, Macintosh, MSWindows, or NextStep/Unix, the VIEW command causes a second window–apart from the window containing MLAB commands–to appear on the screen. This window can be moved, iconized, resized, or zoomed/unzoomed, using the usual window controls. Call this second window the MLAB picture. (It is tempting to call the MLAB picture a window, 96 but in MLAB, “window” has another meaning.) The UNVIEW command makes the MLAB picture disappear. When running MLAB on a DOS PC, the VIEW command causes the MLAB commands on the screen to be replaced with a full screen picture which remains on the screen until the user strikes a key. Once a key is struck, the picture disappears and the screen containing the recent history of MLAB commands returns. The UNVIEW command has no effect on DOS PCs. A second use of the display control commands is to avoid unnecessary delays. Redrawing a complex picture may require a few seconds. One may want to make several changes to the current picture, without waiting for the picture to be redrawn after each change. To do this, execute the UNVIEW command after the initial VIEW command, then give graphics commands modifying the picture, and then execute the VIEW command to display the new picture. Since it is sometimes impossible to interrupt the drawing of a picture without destroying the MLAB session, one must anticipate this problem in order to avoid it with display control commands. The general forms of the MLAB picture display commands are: VIEW [W1,...] UNVIEW where W1,... is an optional list of one or more MLAB window objects. VIEW displays the MLAB picture with the named MLAB window objects. If no window objects are named, VIEW displays all window objects. UNVIEW removes the MLAB picture from the display screen. Table 4.1: The VIEW and UNVIEW commands. MLAB window objects are explained in the next section. 4.2 WINDOW, CURVE, AND TITLE DATA OBJECTS The MLAB data types called curve, axis, title, and window are involved in making two-dimensional pictures. Curves are data objects which contain certain related elements of a picture. A curve might describe a set of points scattered throughout a picture, or a curved line drawn in the picture, or a sequence of straight line segments connected end-to-end, or numbers to be drawn at specified locations in the picture. A title data object may contain some text labeling coordinate axes or a legend explaining what is drawn in a graph. A window consists of lists of curves, axes, and titles, plus certain values controlling the positioning and display of the curves and the window in the MLAB picture. Be careful not to confuse the MLAB window data type with the MLAB picture that appears as a result of the VIEW command. Frequently, the MLAB user makes into an individual picture a single window data object that is being defined. However, it is possible 97 Figure 4.1: The aligned rectangle with x in [−.4, .8] and y in [10, 40]. to make a picture in which several MLAB window data objects are displayed simultaneously, and the window objects may overlap on the viewing screen if the user requests it. The positioning and display of curves, axes, titles, and windows are specified by giving aligned rectangles. An aligned rectangle in the (x, y)-plane is a rectangle with two sides parallel to the x-axis and two sides parallel to the y-axis. In MLAB, such rectangles are specified by four numbers using the phrase: SE1 TO SE2, SE3 TO SE4 (As before, the notations SE1, SE2, etc., denote MLAB scalar expressions and their corresponding numerical values.) The phrase above specifies an aligned rectangle with horizontal x-range SE1 to SE2 and vertical y-range SE3 to SE4. For example, -.4 TO .8, 10 TO 40 is the aligned rectangle shown in Figure 4.1. Each window data object has three aligned rectangles associated with it: the user clipping rectangle, the frame rectangle, and the image rectangle. The user clipping rectangle of a window 98 object is specified so that the x-axis and y-axis ranges correspond to the units of measurement appropriate to the user’s application. For example, suppose the user wishes to graph counts of radioactive samples, in the range 100 to 100,000, measured every four hours for two days in a certain experiment. Then 0 TO 48, 0 TO 100000 would be an appropriate description of the user clipping rectangle, corresponding to a range 0 to 48 measured in hours along the x-axis, and a range 0 to 100,000 measured in counts along the y-axis. Alternatively, the base 10 logarithms of the radioactive counts, in the range 2 to 5, might be the desired graph. An appropriate user clipping rectangle would then be 0 TO 48, 2 TO 5. The user clipping rectangles for different window objects are completely independent. The frame rectangle of a window object defines what portion of the MLAB picture will contain the window object. The frame rectangles of the windows in the two pictures shown in the Tutorial of Chapter 1 covered the entire MLAB picture. As in those examples, the contents of a frame rectangle typically consists of an image of the user rectangle with some surrounding area in which titles or axis labels appear. A frame rectangle is usually specified in screen fraction units. Screen fraction units are numbers which range from 0 to 1 and specify a fraction of the MLAB picture’s extent in the horizontal x direction or the vertical y direction. For example, the frame rectangle for a window that occupies the full MLAB picture would be specified by 0 TO 1, 0 TO 1 in screen fraction units. Note that (0,0) in screen fraction units corresponds to the lower left corner of the MLAB picture. A frame rectangle for a window object that occupies the upper right quarter of the MLAB picture would be specified by .5 TO 1, .5 TO 1 in screen fraction units. The image rectangle of a window object describes the location of the graphical image of the user clipping rectangle within the frame rectangle. If the usable part of the frame rectangle is regarded as an aligned rectangle with origin (0,0) in its lower left corner then the horizontal and vertical extents of the image rectangle may be specified in frame fraction units. The image rectangle of a window object can describe the entire usable frame rectangle, or can be any aligned rectangle which lies within the usable frame. For example, a window with image rectangle .5 TO 1, 0 TO 1 will map the user clipping rectangle to the right half of the frame rectangle. The border about an image rectangle of a window object is drawn automatically, unless the user makes special provision not to do so. That is, a window data object will be displayed with the outline of the image rectangle even if it has an empty list of curves. The curves in a window are always drawn within the image rectangle of that window in the MLAB picture. (There is an exception: characters of titles and axes may lie outside the associated image rectangle.) The image rectangles of different windows are completely independent. In particular, several windows objects can be displayed together to form a picture, with the corresponding image rectangles disjointed, overlapping, or with small rectangles inset in larger rectangles, as needed. The MLAB graphics command WINDOW can be used to create a window object or to modify the user clipping rectangle of an existing window object. The MLAB command FRAME can be used to specify or modify the frame rectangle in a specific window. Similarly, the MLAB command IMAGE can be used to create a window data item or to modify the image rectangle of an existing window. The WINDOW, FRAME, and IMAGE commands are summarized in Table 4.2. For example, consider 99 the commands: * WINDOW -1 TO 5, 0 TO 100 IN PIC * FRAME 0 TO .5, 0 TO 1 IN PIC * IMAGE .1 TO .9, .1 TO .9 IN PIC Suppose PIC is an unknown MLAB identifier in each of these statements. Any of the WINDOW, FRAME, or IMAGE commands above would create a window object named PIC which has no curves. • If only the WINDOW command were given, it would define PIC to be a window data item and set its user clipping rectangle to the specified rectangle -1 TO 5, 0 TO 1; the PIC frame rectangle would be set to the default rectangle 0 TO 1, 0 TO 1 in screen fraction units; and the PIC image rectangle would be set to the default rectangle .125 TO .875, .125 TO .875 in frame fraction units. • If only the FRAME command were given, it would define PIC to be a window data item and set its frame rectangle to the left half of the MLAB picture; the user clipping rectangle of the window would be set to the default value 0 TO 10, 0 TO 10 and the image rectangle would be set to the value .0625 TO .4375, .125 TO .875 in frame fraction units. • If only the IMAGE command were given, it would define PIC to be a window data item and set its image rectangle to .1 TO .9, .1 TO .9 in frame fraction units; the user clipping rectangle would be set to the default value 0 TO 10, 0 TO 10 and the frame rectangle would be set to the default value 0 TO 1, 0 TO 1 in screen fraction units. The default user clipping rectangle is always 0 TO 10, 0 TO 10. The default frame rectangle is always 0 TO 1, 0 TO 1 in screen fraction units. The default image rectangle expressed in frame fraction units is always .125 TO .875, .125 TO .875, which corresponds to .125*S TO .875*S, .125*T TO .875*T in screen fraction units where S and T are the width and height, respectively, of the frame in screen fraction units. Alternatively, suppose PIC is an existing window data item. Then • the WINDOW command above changes the user clipping rectangle of PIC to the specified value -1 TO 5, 0 TO 100, leaving the frame rectangle and image rectangle unchanged. • the FRAME command changes the frame rectangle of PIC to the specified value 0 TO .5, 0 TO 1 in screen fraction units, leaving the user clipping rectangle and the image rectangle unchanged. • the IMAGE command above changes the image rectangle of PIC to the aligned rectangle .1 TO .9, .1 TO .9, leaving the user clipping rectangle and frame rectangle unchanged. 100 The simple forms of the WINDOW, FRAME, and IMAGE commands are: WINDOW SE1 TO SE2, SE3 TO SE4 [IN wi] FRAME SE1 TO SE2, SE3 TO SE4 [IN wi] IMAGE SE1 TO SE2, SE3 TO SE4 [IN wi] where wi is either a window identifier or unknown. The clause IN wi is optional. If the IN-clause is not included, the command will apply to the default window named W. For a window wi, the user clipping rectangle, frame rectangle, or image rectangle is changed to the given specification SE1 TO SE2, SE3 TO SE4. For wi unknown, wi becomes a window with no curves and the specified user clipping rectangle, frame rectangle, or image rectangle. The WINDOW command creates a window with default frame rectangle 0 TO 1, 0 TO 1 and default image rectangle .125 TO .875, .125 TO .875. The FRAME command creates a window with default user rectangle 0 TO 10, 0 TO 10 and default image rectangle .125*S TO .875*S, .125*T TO .875*T, where S is the width of the frame rectangle and T is the height of the frame rectangle. The IMAGE command creates a window with default user rectangle 0 TO 10, 0 TO 10 and default frame rectangle 0 TO 1, 0 TO 1. Table 4.2: WINDOW, FRAME, and IMAGE commands. Curve data objects contain a considerable amount of information, divided basically into a curve matrix part, a point-type part, a line-type part, and a label part. The MLAB graphics command DRAW is used to specify some or all of these parts in a curve. A curve matrix usually has two columns, corresponding to x- and y-coordinates. That is, a curve matrix is an n row by 2 column matrix which is part of a curve data object, and which is regarded as a list of n points in the (x, y) plane. For example, the matrix: .9 1200 −1.1 350 2.5 650 0 −200 considered as a curve matrix, is regarded as a list of the four points (.9,1200), (-1.1,350), (2.5,650), and (0,-200) in the plane. An n row by 2 column curve matrix also has n − 1 line segments associated with it, the line segments going between adjacent points on the list. The matrix above, for example, has three straight line segments associated with it. The first goes from (.9,1200) to (-1.1,350); the second goes from (-1.1,350) to (2.5,650); and the last goes from (2.5,650) to (0,-200). Figure 4.2 shows the four points and three lines associated with the matrix above. 101 Figure 4.2: Plot of a curve matrix. 102 Each curve belongs to exactly one window object, and the user rectangle, frame rectangle, and image rectangle of that window together determine where curve matrix points will be positioned in the MLAB picture. The n points of the curve matrix are given with the x and y coordinates corresponding to the window’s user rectangle. It is the user’s responsibility to insure that all desired curve matrix points lie within or on the user rectangle. Curve matrix points and lines lying outside the user rectangle will not be displayed, and lines will be clipped if they cross the user rectangle boundary. (There is an exception to this rule–the window object can be defined such that the user clipping rectangle is automatically recomputed to capture all of its curves. This will be discussed later.) The dimensions of the MLAB picture and the frame and image rectangles of the window are used to compute the point positions in the MLAB picture. Essentially, each (x, y) point in the user rectangle is displayed in proportionally the same position in the image rectangle. That is, the center of the user rectangle is displayed as the center of the image rectangle, the lower left corner of the user rectangle is displayed as the lower left corner of the image rectangle, and so on. The inches-per-unit ratios are generally different for the x and y coordinates, so that figures may be foreshortened or extended for convenient examination. For example, the image rectangle of Figure 4.2 is a square, but it corresponds to a user rectangle which is 360 times as high as it is wide (5 units on the x-axis vs. 1800 units on the y-axis). A precise rule for conversion of a point (x, y) in the user rectangle to its corresponding coordinates (xi , yi ) in inches on the MLAB picture can be given. Assume that the MLAB picture dimensions and user, frame, and image rectangles are: MLAB picture : ci inches wide, di inches high user rectangle : a to c, b to d in user coordinates frame rectangle : a′ to c′ , b′ to d′ in screen fraction units image rectangle : a∗ to c∗ , b∗ to d∗ in frame fraction units as shown in Figure 4.3. Since the inches-per-unit ratios are (ci − ai )(c′ − a′ )(c∗ − a∗ )/(c − a) for the x-axis and (di − bi )(d′ − b′ )(d∗ − b∗ )/(d − b) for the y-axis, the proportionality rule corresponds to the formulas: (x − a) (c − a) (y − b) = (di − bi )(d′ − b′ )(d∗ − b∗ ) (d − b) xi = (ci − ai )(c′ − a′ )(c∗ − a∗ ) yi 103 Figure 4.3: Illustration of MLAB user rectangle, frame, and image rectangles. 104 That is, xi is a linear function of x and, similarly, yi is a linear function of y. Recall that WINDOW, FRAME, and IMAGE commands can be used to modify the respective user, frame, and image rectangles in an existing window. These commands will usually change the positions of curve matrix points in the MLAB picture, even though the curve matrix itself contains the same numbers as before. The dimensions of the MLAB picture (ci and di ) are fixed to the full screen dimensions for DOS PC MLAB; they may be changed by resizing the MLAB picture on systems with windowing graphical user interfaces. The border of the frame rectangle is not drawn in an MLAB picture, unless the command FRAMEBOX command is given. The border of the frame rectangle will be hidden if the command NO FRAMEBOX is given. The border of the image rectangle is drawn in an MLAB picture, unless the command NO IMAGEBOX is given. The border of the image rectangle can be drawn in the MLAB picture by giving the command IMAGEBOX. 4.3 THE DRAW COMMAND The short form of the DRAW command, shown in Table 4.6, is primarily used to create a curve data object with a specified curve matrix part and to assign the curve to a specified window. It can also be used to modify the curve matrix of an existing curve. Consider the DRAW command: * DRAW CA = DAY POINTTYPE TRIANGLE LINETYPE NONE IN W This is similar to the DRAW command given in the Tutorial of Chapter 1. There are five parts to this short DRAW command: 1. an unknown MLAB identifier CA to be used as the name of the new curve data object; 2. the two-column matrix DAY to be used as the curve matrix for CA; 3. a clause specifying the point-type of the curve CA; 4. a clause specifying the line-type of the curve CA: 5. and the clause IN W to specify that CA will belong to the list of curves of the window W. The point-type clause specifies what is to be drawn at each of the n points of the plane specified by the n by 2 curve matrix. For example, the clause POINTTYPE "X" would specify that the capital 105 letter X is to be drawn at each of the n curve matrix points. POINTTYPE may be abbreviated as PT. The specification POINTTYPE TRIANGLE of the example asks for small triangles. Alternatively, a point-type number may be given instead of a name. PT 3, POINTTYPE 3, PT TRIANGLE, and POINTTYPE TRIANGLE all have the same result. Similarly, the line-type clause specifies what is to be drawn at each of the n − 1 lines between adjacent curve matrix points. It requires the word LINETYPE, which may be abbreviated LT, and a number or a line-type name. LT 1, LINETYPE 1, LT SOLID, and LINETYPE SOLID each would cause solid line segments to be drawn, as in Figure 4.2. The clause LINETYPE NONE of the example in Chapter 1 specifies that nothing is to be drawn at the lines associated with the curve matrix DAY. That is, the specification POINTTYPE TRIANGLE, LINETYPE NONE causes scattered triangles to be drawn in the picture. The possible point-types and line-types are listed in Table 4.3, Table 4.4, and Table 4.5 and shown in Figure 4.4. Note that point-types corresponding to convex shapes can be generated by negating the point-type values. Also note in Figure 4.4 that with DASHED linetypes, dashes are continued across curve matrix points. That is, dash lengths are preserved even if the resulting dashes are broken lines. It is important to note that the curve matrix of a curve is completely separate from that matrix which is used to define it; the defining matrix is copied to establish the curve matrix. In the above example, changing the matrix DAY has no effect on the curve CA. Drawing with line-type 6 (MARKER) combines features of drawing with line-types 1 (SOLID) and 5 (ALTERNATE). The curve matrix begins with a dummy row identifying a marker value in column 1. The curve is then drawn as for line-type 1, except that another dummy marker row is inserted between any two points where the user wants to lift the pen. For example, the matrix M in the following MLAB dialog: * TYPE M M: a 1: 2: 3: 4: 5: 6: 7: 8: 9: 10: 11: 12: 100 1 5 3 1 100 2 2 4 100 2 3 12 by 2 matrix 0 1 1 8 1 0 2 4 4 0 3 3 106 Figure 4.4: Samples of point-types and line-types. 107 Point-types 0 1 2 3 4 5 6 7 8 9 10 11 12 13 14 15 16 17 18 19 20 21 22 23 24 25 26 27 28 29 30 31 Symbol NONE VBAR CROSSPT TRIANGLE SQUARES STAR HBAR OCTAGON XPT LTICK RTICK UTICK DTICK CIRCLE ARROW DOTPT DIAMOND XERRBAR YERRBAR XLOGTICK YLOGTICK NBAR TBAR RBAND LBAND UBAND DBAND DRBAND DLBAND DUBAND DDBAND ARROWTIP "c" Description no points (default) vertical bars plus signs (+) triangles squares stars horizontal bars eight-sided figure X-shaped symbol leftward tick mark rightward tick mark upward tick mark downward tick mark variable resolution circle vector field arrow a small dot a diamond symbol horizontal error bar vertical error bar horizontal logarithmically-spaced ticks vertical logarithmically-spaced ticks normal bar tangent bar solid line extending to the right image margin solid line extending to the left image border solid line extending to the top image border solid line extending to the bottom image border dotted line extending to the right image border dotted line extending to the left image border dotted line extending to the top image border dotted line extending to the bottom image border directed arrow the character c in a specified font Table 4.3: Point-types. could be a curve matrix for a curve to be drawn with LT MARKER. The number in M(1,1), which is 100, is interpreted as an interruption marker for drawing the corresponding curve. Since the marker occurs 3 times in M COL 1, at M(1,1), M(6,1), and M(10,1), the curve is drawn in 3 pieces, corresponding to rows 2 through 5, 7 through 9, and 11 through 12 of M; rows 1, 6, and 10 108 Filled Point-types -3 -4 -5 -7 -13 -16 Symbol -TRIANGLE -SQUARES -STAR -OCTAGON -CIRCLE -DIAMOND Description solid-filled triangles solid-filled squares solid-filled stars solid-filled eight-sided figure solid-filled variable resolution circle a solid-filled diamond symbol Table 4.4: Solid-filled point-types. Line-types 0 1 2 3 4 5 6 7 8 9 10 11 12 Symbol NONE SOLID DASHED LDASH DDASH ALTERNATE MARKER VMARKER DOTTED DOTMARK DASHMARK SMARKER SVMARKER Description no lines solid lines (default) short dashes long dashes alternating long and short dashes connect every other point solid line with marker skipping variable dashed line with marker skipping dotted line dotted line with marker skipping dashed line with marker skipping solid line with marker skipping using spline curves variable dashed line with marker skipping using splines Table 4.5: Line-types. are not data points. More precisely, a new curve created by the MLAB command: * DRAW C = M, PT NONE, LT MARKER could be replaced by three new curves drawn by the commands: * DRAW C1 = M ROW 2:5, POINTTYPE 0, LINETYPE 1 * DRAW C2 = M ROW 7:9, POINTTYPE 0, LINETYPE 1 * DRAW C3 = M ROW 11:12, POINTTYPE 0, LINETYPE 1 Clearly, the first piece draws a triangle and the second and third pieces form a letter “F” within the triangle. 109 Drawing with line-type 7 (VMARKER) is similar to drawing with line-type 6 (MARKER) except that dashed lines with variable lengths, instead of solid lines, are drawn. The second column in a marker row contains the dash-length in inches to be used. For example, if M(1,2) = .125 and M(6,2) = M(10,2) = .25 in M COL 2 of the matrix M above and LT 7 is specified, the triangle will be drawn with dashed lines of lengths 1/8 inch and the letter “F” within the triangle will be drawn with dashed lines of lengths 1/4 inch. It is possible to omit certain parts of the short DRAW command. To modify an existing curve, only the curve name and the clauses specifying the desired changes are needed. For example, the command: * DRAW CA IN W, LINETYPE 1 will move CA to window W and change its line-type, but will leave its curve matrix and point-type unchanged. Similarly, the curve matrix could be modified while leaving the window, point-type, line-type unchanged, and so on. If a new curve item is to be created, default values will be supplied for omitted parts. If the curve identifier is omitted, it is assumed that a new curve is to be created, and the first unknown identifier in the list C0, C1, C2, C3, etc., will be used as the curve name. (It is recommended that the user supply curve names when developing a new picture.) The curve matrix can not be omitted from a DRAW command that creates a new curve. If the window clause is omitted from a DRAW command creating a new curve, then IN W is assumed. W is an MLAB window with special properties, which is supplied automatically by the MLAB system in response to a DRAW command requiring it. Use of W will be discussed in more detail later. Finally, the default clauses POINTTYPE 0 (no points) and LINETYPE 1 (solid lines) will be supplied if necessary for a DRAW command creating a new curve. For example, the command: * DRAW M COL (1,3), POINTTYPE SQUARE will create in window W a curve data item C0 (assuming C0 was unknown) with curve matrix M COL (1,3), using squares at the points connected by solid lines. The window clause of the DRAW command includes either an unknown identifier or a window identifier. If the identifier has not been previously defined, the DRAW command will create a new window data item with default user, frame, and image rectangles, and add the curve matrix to it. If the identifier has been previously defined as a window, the curve matrix is simply added to it. If the window clause is not supplied in a DRAW command, the curve matrix is added to a window named W which is created if it does not exist. A common MLAB user error is to omit the window clause of the DRAW command while adding curves to a window not named W. This will cause the new curve, Ci, where i is some integer, to be drawn in the default window W, overlapping the window currently in use. Suppose the user is drawing in a window named PIC but neglects to add IN PIC to a DRAW command. To correct this error, use the command sequence: 110 The short form of the DRAW command is: DRAW [C =] ME1 [POINTTYPE ptyp] [LINETYPE ltyp] [IN W] The identifier C is either unknown (to create a new curve) or is an existing curve to be modified. The n by 2 matrix ME1 becomes the curve matrix for C, and curve C is put into window W. The user may use DRAW commands such that NCOLS(ME1) = 1 or 2 for 2-dimensional drawing. If NCOLS(ME1) = 1, the MLAB adds another column to the curve matrix so that it becomes 1:NROWS(ME1) & ’ ME1. The curve’s point type (ptyp) can be a scalar expression such that INT(ptyp) is an integer between 0 and 30, a quoted keyboard character (i.e. "c"), or a predefined point type name. The curve’s line type (ltyp) can be a scalar expression such that INT(ltyp) is an integer between 0 and 19, or a predefined line type name. The word POINTTYPE may be abbreviated PT and the word LINETYPE may be abbreviated LT. For line types other than 6, 7, 9, 10, 11, and 12, the curve is drawn on the display by drawing the specified point symbol at each of the n points in the curve matrix and drawing the specified type of line at each of the n − 1 lines between points in adjacent rows of the curve matrix. For line types 6, 7, 9, 10, 11, and 12, if ME1 is an n by 2 matrix [aij ], then a11 is the marker value x. A point symbol is displayed at a point (ai1 , ai2 ) of the curve matrix if ai1 6= x for i = 2, 3, ..., n. For line type 6, a solid line is drawn from (ai1 , ai2 ) to (ai+1,1 , ai+1,2 ) if both ai1 and ai+1,1 are unequal to x, for i = 2, 3, ..., n − 1. Line type 7 is similar to line type 6 except that each line connecting a given set of points headed by the marker value ai1 = x will be drawn with a dashed line whose dash-length is ai2 inches; if ai2 = 1 a dash-length of infinity, i.e., a solid line will be drawn. For a new curve ME1 must be supplied but a curve name Cn and clauses IN W, PT 0, and LT 1 will be supplied as needed. To modify an existing curve, the curve name must be supplied; and the curve matrix, window, pointtype, and linetype will remain at their previous values if the modifying clause is omitted. Table 4.6: DRAW command, short form. * UNVIEW * DRAW Ci IN PIC * DELETE W 111 * VIEW PIC Points and lines from a DRAW command lying outside the user rectangle are not drawn, and lines intersecting the user rectangle show only the part lying within the user rectangle. In many cases, the most difficult part of making a picture in MLAB is the preparation of curve matrices or matrix expressions for use in DRAW commands. This requires competence in the scalar and matrix techniques given in Chapter 2 and Chapter 3, as well as an understanding of the analytic geometry applying to the desired figures. Consider smooth curves in the plane. The simplest such curves are the graphs of functions which can be defined by MLAB FUNCTION statements. Suppose F(X) is a defined function of one variable, and its graph in a certain range, from c to d, is to be examined. The normal procedure would be to set up a matrix M by the arithmetic sequence operation c:d:e, where e is a fraction of d-c chosen so that NROWS(M) is of moderate size, say between 25 and 200. If a DRAW command with the curve matrix POINTS(F,M) and default types POINTTYPE 0, LINETYPE 1 is set up, then the eye sees the result as a smooth curve of the graph of F(X) from c to d. The actual drawing, of course, is obtained by connecting many short line segments end-to-end. Examples are shown in Figure 4.5. In Figure 4.5(a) the graph of a cubic polynomial y = x3 − 7x2 + 14x − 8 in the range from 0 to 6 was constructed in the window object W by the MLAB commands: * * * * * WINDOW 0 TO 6, -10 TO 40 IN W NO IMAGEBOX IN W FUNCTION P(X) = X^3-7*X^2+14*X-8 DRAW G = POINTS(P,0:6:.1) IN W VIEW In Figure 4.5(b) there is an ellipse defined by the equation x2 + 16y 2 = 1. This figure was drawn by two applications of the function graph method. Observe that the upper half of the ellipse is the function graph of: y1 (x) = 1 1 · (1 − x2 ) 2 4 in the range from -1 to 1, and the lower half is the graph of −y1 (x) in the same range. So, Figure 4.5(b) can be drawn by the commands: * UNVIEW * DELETE G 112 Figure 4.5: Examples of smooth-curve drawing. 113 * * * * * * * WINDOW -1 TO 1, -.3 TO .3 IN W FUNCTION Y1(X) = 0.25*SQRT(1-X*X) M = POINTS(Y1,-1:1:.02) DRAW EA = M IN W M COL 2 = -(M COL 2) DRAW EB = M IN W VIEW The above technique is not suitable for the curve of Figure 4.5(c), which twists and turns frequently. Curves of this type are often best drawn by a parametric representation. That is, a pair of functions x(s) and y(s) are defined so that the desired curve consists of the points (x(s), y(s)) for all s in a certain range of values, say from c to d. In that case, the point (x(s), y(s)) traces the curve as s increases from c to d. Here an arithmetic sequence matrix c:d:e is set up to obtain a sufficient number of s values, and then the F ON M matrix expression is used twice to generate the curve matrix from the parametric definition. The curve of Figure 4.5(c) has the parametric description: 1 · sin(8 · s) 4 y(s) = sin(s) x(s) = for s in the range from 0 to π. The MLAB commands to draw it were: * * * * * * * * * * UNVIEW DELETE EA,EB WINDOW -.3 TO .3, 0 TO 1 IN W FUNCTION X(S) = 0.25*SIN(8*S) FUNCTION Y(S) = SIN(S) M = 0:PI:.02 N COL 1 = X ON M N COL 2 = Y ON M DRAW C = N IN W VIEW Now consider the situation in which straight strokes are required but are not arranged in any end-to-end pattern. Examples are shown in Figure 4.6. In Figure 4.6(a), the clause LINETYPE 5 (ALTERNATE) is used to lift the pen between strokes. That requires a 12 row by 2 column curve matrix in order to draw the 6 strokes. The following dialog shows how Figure 4.6(a) can be drawn: 114 * * * * * UNVIEW WINDOW -1 TO 5, 0 TO 4 IN W DELETE C MD = SHAPE(12,2,LIST(0,1,0,3,1,4,3,4,4,3,4,1,3,0,1,0,0,2,4,2,2,0,2,4)) TYPE MD MD: a 1: 2: 3: 4: 5: 6: 7: 8: 9: 10: 11: 12: 0 0 1 3 4 4 3 1 0 4 2 2 12 by 2 matrix 1 3 4 4 3 1 0 0 2 2 0 4 * DRAW CD = MD LINETYPE 5 IN W * VIEW The clause LINETYPE 5 (ALTERNATE) can also be used to draw dashed lines or curves, with the user controlling the lengths of the dashes. In Figure 4.6(b), LINETYPE 6 (MARKER) was used to do stick-figure drawing. This curve was specified by the following MLAB commands: * * * * : * UNVIEW DELETE CD WINDOW 6.7 TO 8.1, 1 TO 1.9 IN W MC = SHAPE(15,2,LIST(100,0,7,1,7.5,1,7.5,1.5,7,1.5,7,1,100,0,\ 7,1.5,7.35,1.9,7.8,1.9,7.8,1.4,7.5,1,100,0,7.5,1.5,7.8,1.9)) TYPE MC MC: a 1: 2: 3: 4: 5: 6: 7: 100 7 7.5 7.5 7 7 100 15 by 2 matrix 0 1 1 1.5 1.5 1 0 115 Figure 4.6: Examples of stick-figure drawing 116 8: 9: 10: 11: 12: 13: 14: 15: 7 7.35 7.8 7.8 7.5 100 7.5 7.8 1.5 1.9 1.9 1.4 1 0 1.5 1.9 * DRAW CC = MC LINETYPE 6 IN W * VIEW The curve matrix MC consists of a marker row (100,0), followed by the cube’s front face given by (7,1), (7.5,1), (7.5, 1.5), (7,1.5), and (7,1). Then came another marker row (100,0), and the cube’s outline was completed by (7,1.5), (7.35,1.9), (7.8,1.9), (7.8,1.4), and (7.5,1). The last three rows of the 15 by 2 curve matrix were a marker row (100,0) and the final edge (7.5,1.5) to (7.8,1.9). LINETYPE 6 (MARKER) can also be used with parametric drawing techniques as in Figure 4.5(c) to draw several contours or curved lines on the display with a single DRAW command. The complete form of the DRAW command, shown in Table 4.7, is obtained by adding PTSIZE, PTFONT, LABEL, LABELSIZE, LABELFONT, OFFSET, PLACE, ANGLE, FORMAT, and COLOR clauses to the short form of the DRAW command. The complete form of the DRAW command is: DRAW C = ME1 POINTTYPE ptyp PTSIZE SE1 [UNITS] PTFONT SE2 LINETYPE ltyp LABEL ME2 LABELSIZE SE2 [UNITS] LABELFONT SE3 OFFSET (SE4,SE5) [UNITS] PLACE (A,B) FORMAT (SE6,SE7,SE8,SE9,SE10,SE11) ANGLE SE12 COLOR col IN W Table 4.7: DRAW command, complete form. The complete DRAW command provides additional control over the point-type and line-type used for the curve matrix beyond that provided by the short form of the DRAW command. It also allows some or all of the points in the curve matrix to be labelled with numbers. The PTSIZE-clause determines the size of the point symbols drawn at each (x, y) coordinate in the curve matrix. If the PTSIZE-clause is omitted, the default point type size is 0.02 units of the window’s horizontal frame extent. If the PTSIZE-clause is provided with only a scalar expression SE1, the value of the scalar is interpreted as the size of the point type in units of the horizontal frame extent. Alternate units can be specified by following the scalar expression SE1 with any one of the words FFRACT, IFRACT, or WORLD. FFRACT stands for horizontal frame fraction units; IFRACT stands for horizontal image fraction units; and WORLD stands for horizontal user coordinates. For example, the clause 117 PT SQUARE PTSIZE 1.5 WORLD would put a square measuring 1.5 units of the user x-coordinates on a side, at each point in the curve matrix. If the point type is a quoted character, the PTFONT-clause can be included to specify which character font is to be used when the quoted character is drawn at each point in the curve matrix. The scalar expression in the PTFONT-clause should evaluate to a value s such that 1 ≤ s ≤ 34 or −14 ≤ s ≤ −2. On all systems, the positive numbers 1,2,...,34 specify one of the Hershey fonts. On MSWindows and Macintosh systems, (but not on Linux/Unix or DOS systems), the negative numbers -2,-3,...,-14 specify one of the TrueType fonts. Tables showing the 34 different Hershey fonts and the 13 different TrueType fonts available in MLAB are shown in Appendix A. The clause: PT "z" PTFONT 13 would cause the Greek letter ζ (the character corresponding to lower case z–ASCII character number 122–in font number 13, as shown in Appendix A, Figure A.8) to be drawn at each point in the curve matrix. If the PTFONT-clause is not included in a DRAW statement, the default font is font number 5. In the short form of the DRAW command, the LINETYPE-clause included either a scalar expression or a name to specify the type of line segment to be used in connecting (x, y) coordinates of the curve matrix. The first 5 linetypes are variations of the pattern: a thin first line segment, followed by a first gap, followed by a second thin line segment, followed by a second gap. For example, LT SOLID fits this pattern with the gaps having zero extent. Instead of using a name or number in the LINETYPE-clause, it is possible to use seven numbers separated by commas and enclosed by parentheses to specify the line type, as follows: LINETYPE (SE1,SE2,SE3,SE4,SE5,SE6,SE7) SE1 specifies the length of the first line segment in the pattern; SE2 specifies the length of the gap; SE3 specifies the length of the second line segment; and SE6 specifies the thickness of the two line segments. SE7 specifies how the line segments are filled: • if SE7 evaluates to -1, then the line segments are not filled. • if SE7 evaluates to 0, then the line segments are solid filled. 118 • if SE7 evaluates to k > 0, then the line segments are filled with k horizontal thin line segments. The scalar expression SE4 specifies the length of a tic mark that is placed in the center of the first gap. If SE4 is positive, the tick mark extends equally to both sides of the gap; if SE4 is negative, the tick mark extends to one side of the gap. Similarly, SE5 specifies the length of a tic mark that is placed in the center of the second gap. For example, a line consisting of • solid dashes of width .05 horizontal frame fraction units and length .1 horizontal frame fraction units; • gaps of width .1 horizontal frame fraction units; • tick marks in every other gap that are .05 horizontal frame fraction units wide and .1 horizontal frame fraction units long. is displayed in an MLAB picture shown in Figure 4.7 by the following commands: * * * * * UNVIEW DELETE W WINDOW 1 TO 10, 1 TO 10 IN W DRAW C = 1:10 LINETYPE (.1,.1,.1,-.1,0,.05,0) IN W VIEW The LABEL clause of the extended DRAW command is used to place numbers near some or all of the (x, y) coordinates in the curve matrix. It includes a label matrix which has m rows and either 1 or 2 columns. If the label matrix has 1 column, the successive numbers in the column vector label successive points in the curve. For example, LABEL .1:1:.1 will cause the first point in the curve matrix to be labelled with the number .1, the second point in the curve matrix to be labelled with the number .2,. . . , and the tenth point in the curve matrix to be labelled with the number 1. If the label matrix has 2 columns, the first column is interpreted as a list of numerical labels and the second column specifies which points in the curve matrix get the labels. For example, the LABEL-clause: LABEL (.2:1:.2)&’(2:10:2) 119 Figure 4.7: Example of 7-parameter LINETYPE with values (.1,.1,.1,-.1,0,.05,0). 120 will cause the numbers 0.2, 0.4, 0.6, 0.8, 1.0 to be printed at the second, fourth, sixth, eighth, and tenth points in the curve matrix, respectively. Each label number is printed, in digital form, in the picture and near the corresponding curve matrix point. For example, the digits 1, 2, 3, and 4 shown near the curve matrix points in Figure 4.2 were generated by the statements: * M = SHAPE(4,2,LIST(.9,1200,-1.1,350,2.5,650,0,-200)) * DRAW M LABEL 1:4 * VIEW Label matrices are frequently used to number the tick marks on the axes of a graph. In Figure 4.2, for example, label matrices specified as -2:3 and -300:1500:300 were used to number the x-axis and the y-axis. (The x- and y-axes in Figure 4.2 were actually created by XAXIS and YAXIS statements, which will be described later.) The LABELSIZE clause specifies the heights of the label digits in frame fraction units; if omitted, the heights of the label digits are .015 horizontal frame fraction units. The label size can also be expressed in horizontal image fraction units or units of user x-coordinates by including the word IFRACT or WORLD, respectively. The LABELFONT clause specifies the number of the particular font table that the label characters are to be taken from. The default clause LABELFONT 5 is supplied in all DRAW commands with no LABELFONT clause. The OFFSET clause specifies where the lower left corner of a box enclosing the label will be placed with respect to the corresponding curve matrix point. If omitted, the offset is (0,0); this means the lower left corner of the label box is placed at the corresponding curve matrix point. If included, the OFFSET clause requires two numbers separated by a comma and enclosed in parentheses; the first number specifies the horizontal displacement of the lower left corner of the label with respect to the curve matrix point, the second number specifies the vertical displacement of the lower left corner of the label with respect to the curve matrix point. These numbers may be positive or negative. If no units are specified, these numbers are assumed to be in horizontal frame fraction units; alternatively, including IFRACT will cause the offsets to be interpreted in units of horizontal image fraction units. Including WORLD will cause the offsets to be interpreted in units of horizontal user coordinates. For example, the clause OFFSET (-.5,.5) WORLD would put the lower left corner of the box enclosing a label at a point .5 user x-coordinates to the left, and .5 user x-coordinates above the corresponding curve matrix point. 121 The PLACE clause takes two words, separated by a comma and enclosed in parentheses, and specifies a point on the box surrounding the label which should be placed at the offset to the corresponding curve matrix point. The first word may be either LEFT, CENTER, or RIGHT, and the second word may be either TOP, CENTER, or BOTTOM. Without a PLACE clause, the lower left corner of the label box is placed at the offset from the corresponding curve matrix point. The clause PLACE (LEFT,TOP) would place the top left corner of the label box at the offset from the curve matrix point. The clause FORMAT(SE6,SE7,SE8,SE9,SE10,SE11) specifies the format in which the point labels are to be drawn. The meanings of the scalar values SE6, SE7, SE8, SE9, SE10, and SE11 are beyond the scope of this guide; however, a complete description of the format codes appears in the NFORMAT section of The MLAB Reference Manual. The clause FORMAT(-3,9,0,0,2,0) is supplied if the FORMAT clause is omitted. Suppose M is the 5 row by 2 column matrix and W is the window created by the following MLAB commands: * * * * WINDOW -.8 TO 3.4, -.5 TO 1.25 IN W NO IMAGEBOX IN W M = SHAPE(5,2,LIST(0,1,.5,.4,1,.2,1.5,.5,2,0)) TYPE M M: a 1: 2: 3: 4: 5: 0 0.5 1 1.5 2 5 by 2 matrix 1 0.4 0.2 0.5 0 The LABEL-clause with a single column matrix, * DRAW CX = M LABEL 1:5 IN W * VIEW produces the curve with lables as shown in Figure 4.8(a). In order to label the points with numbers in a different font and size, and shift the labels to the right and below the corresponding curve matrix points–as shown in Figure 4.8(b)–the following command could be used: 122 * DRAW CX OFFSET (.05,-.05) LABELSIZE .075 LABELFONT 29 IN W * VIEW Note that the LABEL-clause need not be repeated because the labels 1:5 are already associated with the curve data item CX. The clause OFFSET(.05,-.05) is used to specify the x and y displacements, in horizontal frame fraction units, between each label and the corresponding curve matrix point. In Figure 4.8(b), for example, each label was printed .05 horizontal frame fraction units to the right and -.05 horizontal frame fraction units below the corresponding point. The clause LABELSIZE .075 specifies that the label digits are to be .075 horizontal frame fraction units high. The clause LABELFONT 29 specifies that the label digits are taken from font table number 29. The label matrix can contain arbitrary numbers and may have fewer rows than the curve matrix. For example, the labelled curve of Figure 4.8(c) was drawn by the MLAB commands: * N = LIST(.62,.24,-.1) &’ 1:5:2 * DRAW CX LABEL N OFFSET (0,0) PLACE (CENTER,TOP) LABELSIZE .05 IN W * VIEW The LABEL-clause with the 2-column label matrix N causes the number .62 to be printed at the first point in the curve matrix, .24 to be printed at the third point in the curve matrix, and -.1 to be printed at the fifth point in the curve matrix. The PLACE-clause causes the top, center of the label to be put at the corresponding data matrix point. The LABELSIZE-clause resets the size of the font characters to .05 horizontal frame fraction units. Figure 4.8(d) was drawn by the command: * DRAW CX FORMAT(-2,5,0,3,0,1) LABELSIZE .1 IN W * VIEW Here, the FORMAT-clause changes the format of the labels and the LABELSIZE clause increases their size. The clause ANGLE SE12 specifies the angle (in degrees) of the baseline on which the label is drawn with respect to the x-axis. For example, ANGLE 90 would cause the label to be printed on a line parallel to the y-axis and directed toward the top of the window. 123 Figure 4.8: Examples of point labeling. 124 Color name WHITE BLACK GREY RED GREEN YELLOW BLUE VIOLET PURPLE ORANGE PINK AQUA CHARTREUSE BROWN ROSE TURQUOISE Linux with X-Windows, DOS Color No. 1 0 43 49 13 61 4 36 36 57 59 32 45 37 55 31 MSWindows, Macintosh Color No. 1 0 2185 3841 241 4081 16 2351 2351 4001 4029 1006 2289 2115 3947 1245 Table 4.8: Color names and numbers. The clause COLOR col specifies the color of line-type, point-type, and label given in the DRAW command for color graphics displays and plotting devices. col may be a number or a name of a color. The color numbers and corresponding color names are listed in Table 4.8. If a COLOR-clause is not included in a DRAW command, the default color is 1, i.e. WHITE, on Linux/Unix with X-Windows, MSWindows, Macintosh OS/X, and DOS systems; the default color is 0, i.e. BLACK, on Macintosh OS7/8/9 and printer devices. For some computers systems, the color number in Table 4.8 may not correspond to the listed color. For example, COLOR 11 does not appear to be pink on MSWindows with a video graphics adapter set to 16-color mode. The color numbers listed for MSWindows MLAB in Table 4.8 are color numbers for a computer with a video graphics adapter set to display 256 or more colors; the color numbers will be different for a computer with a video graphics adpater in 16-color mode. The clause COLOR COLORX(r,g,b) can be used to obtain the color number closest to the color defined by the combination of red, green, and blue intensity specifications given by values r, g, and b, respectively. r, g, and b must be numbers in the interval [0, 1]. For example, COLOR COLORX(0,0,1) would result in blue, and COLOR COLORX(1,1,1) would result in white. The COLORN function maps the integers 1,2,3,. . . ,15 to the colors in Table 4.8. This function is convenient when using a FOR-loop to draw different color curves. For example, the following MLAB commands will draw 6 different exponential curves, each in a different color. 125 * FCT F(X) = EXP(-A*X) * FOR I = 1:6 DO {A = .5*I; DRAW POINTS(F,0:10!100) COLOR COLORN(I);} * VIEW Of course you can always define your own vector of color numbers and use an index into the vector to select your own sequence colors. 4.4 THE AXIS COMMAND The XAXIS, YAXIS, and AXIS commands are used to create axis data objects. The general AXIS command is shown in Table 4.9. Axis data objects are similar to curve data objects, in that they include a curve matrix, linetype, pointtype, and label matrix. The use of XAXIS and YAXIS is demonstrated by the MLAB commands that made the axes in Figure 4.2: * XAXIS X1 = -2:3 &’-300 PT UTICK LABEL -2:3 LABELSIZE .015 FFRACT \ : OFFSET (-.01,-.025) IN W * YAXIS Y1 = -2 &’ -300:1500:300 PT RTICK LABEL -300:1500:300 LABELSIZE \ : .015 FFRACT OFFSET(-.09,-.01) IN W * VIEW Just as the DRAW command specifies a curve matrix, point-type, line-type, label matrix, color, etc., for a curve, so the AXIS commands define these elements for a curve to be used as an axis. The curve matrix for the axis named X1 includes the six points (-2,-300), (-1,-300), (0,-300), (1,300), (2,-300), and (3,-300). Since the line-type is not specified, the default SOLID (= 1) is used. The point-type is an upwards directed tick mark, UTICK. Each point in the curve matrix is also labelled with a number from the label matrix which consists of the numbers -2, -1, 0, 1, 2, and 3. The height of each number is .015 horizontal frame fraction units. Each label appears .01 frame fraction units to the left and .025 frame fraction units below each point in the curve matrix. Since a FORMAT clause was not included, the label numbers are formatted by FORMAT(-3,9,0,0,2,0). There are two important differences between a curve resulting from a DRAW command and an axis resulting from an AXIS command. The first difference is that the points, line segments, and labels of a curve that extend beyond the user rectangle of a window are not visible in the window’s image rectangle. However the points, line segments, and labels of an axis can appear anywhere in the window’s frame rectangle. The second difference is that if a window’s user rectangle is redefined, a curve data item is not changed–its curve and label matrices remain the same. But an axis data item is changed when a window’s user rectangle is redefined; the axis’s curve matrix is rescaled and, if the axis is an x- or y-axis, its label matrices are rescaled so that they are appropriate for the new user rectangle. For example, if the user rectangle for window W shown in Figure 4.2 is changed by the command: 126 Figure 4.9: Figure 4.2 after the user rectangle is redefined. * WINDOW -1.5 TO -.5, 300 TO 600 IN W Figure 4.9 results. Note that the labels of curve C and the line segments connecting the points of curve C have not changed in the user coordinate system; however, since the rectangle in the user coordinate system that is visible in the window’s image has changed, parts of curve C have been clipped and are no longer visible. Also note that the labels and curve matrix points on the x-axis and y-axis have changed. For example, the axis Y1 in Figure 4.2 consisted of the 7 points (-2,-300), (-2,0), (-2,300), (-2,600), (-2,900), (-2,1200), and (-2,1500), labelled with the numbers -300, 0, 300, 600, 900, 1200, and 1500, respectively. As a result of the WINDOW command which redefined the user rectangle, Y1 was changed so that it consisted of the 7 points (-1.5,300), (-1.5,350), (-1.5,400), (-1.5,450), (-1.5,500), (-1.5,550), and (-1.5,600), labelled with the numbers 300, 350, 400, 450, 500, 550, and 600, respectively. The axis command begins with either XAXIS, YAXIS, or AXIS. If XAXIS is used, labels and points for the resulting axis data item will re-scale when the user rectangle’s x-coordinates are changed by 127 The complete form of the AXIS command is: <X|Y>AXIS A = ME1 POINTTYPE ptyp PTSIZE SE1 [UNITS] PTFONT SE2 LINETYPE ltyp LABEL ME2 LABELSIZE SE2 [UNITS] LABELFONT SE3 OFFSET (SE4,SE5) [UNITS] PLACE (A,B) FORMAT (SE6,SE7,SE8,SE9,SE10,SE11) ANGLE SE12 COLOR col IN W Table 4.9: AXIS command, complete form. subsequent WINDOW commands. If YAXIS is used, labels and points for the resulting axis data item will re-scale when the user rectangle’s y-coordinates are changed by subsequent WINDOW commands. If AXIS is used, only the points (not the labels) for the resulting axis data item will re-scale when the user rectangle’s x- and/or y-coordinates are changed by subsequent WINDOW commands. If the axis name, A, is omitted from an XAXIS command, the default name W1.XAXIS is provided, where W1 is the window name specified in the IN clause. If the axis name is omitted from an YAXIS command, the default name W1.YAXIS is provided, where W1 is the window name specified in the IN clause. If the axis name is omitted from an AXIS command, then the first unique name in the series A0, A1, A2,. . . is used as the axis name. Tick marks and bands are the usual point types for axes. Point types LTICK (= 9) or RTICK (= 10) are typically used for tick marks on y-axes; UTICK (= 11) or DTICK (= 12) are typically used for tick marks on x-axes. NONE is the default point type for axes. The PTSIZE, PTFONT, LINETYPE, LABEL, LABELSIZE, LABELFONT, OFFSET, PLACE, FORMAT, ANGLE, and COLOR clauses of the AXIS command are provided optionally as in the DRAW statement. The window name defaults to W if the IN clause is not included. 4.5 THE TITLE COMMAND The TITLE command, shown in Table 4.10, is used to place text in an MLAB picture. It defines or modifies a title data object which consists of a string and some information about where and how the string is to appear. In computer science, an arbitrary sequence of characters is called a string. The characters are usually printable characters such as upper and lower case Latin letters, digits, punctuation marks, and other symbols that can be typed. An example of the TITLE command follows: * TITLE JX = "HEIGHT 30", SIZE .015 FFRACT, ANGLE 90, FONT 5, \ : PLACE (BOTTOM,LEFT), AT (.7,20) WORLD, SHIFT 0, COLOR GREEN IN W 128 This command shows nine parts of the TITLE command. Its effect would be to place the text string HEIGHT 30 in the position shown in Figure 4.1. Here, JX is an unknown identifier. After execution of the TITLE command, it becomes the identifier of a title object that has the text string HEIGHT 30. The text string in the command is enclosed in quotation marks to indicate its beginning and end. As in the DRAW command, the clause IN W puts the new title object JX into the list of items in the window W. The SIZE clause specifies character height. So, SIZE .015 FFRACT indicates that the text string will be drawn .015 horizontal frame fraction units high. Upper and lower case letters in a text string appear in the picture as typed. Lower case letters and punctuation are printed in correct proportion to upper case characters. The clause ANGLE 90 specifies that the text is to be written vertically upward, i.e. at an angle of 90 degrees measured counterclockwise from normal horizontal text. The clause FONT 5 specifies that the character set in font table number 5 will be used. The clause AT (.7,20) WORLD specifies that the first character of the text string is to be drawn at the display point corresponding to the user rectangle point (.7,20). That is, the starting point of the text string is given in the user’s coordinate system for the window. The clause SHIFT 0 specifies that the string is not to be shifted from the starting point (.7,20). The clause COLOR GREEN specifies that the color of the string is to be green for graphic displays. Green appears black for monochrome display and plotting devices. In general, the AT clause specifies the location, in user-rectangle coordinates, for the bottom left corner of the box surrounding the first character in the string. Note that this is the same as the AT clause for point labels. The SHIFT clause allows the string to be shifted along the line running from the starting location of the string to the edge of the user rectangle, at the specified angle. For example, the following commands will produce the picture shown in Figure 4.10: * * * * * * * UNVIEW DELETE W WINDOW 0 TO 10, 0 TO 10 IN W TITLE "Shifting", AT (0,8) WORLD, SHIFT 0, SIZE .05, IN W TITLE "is so", AT (0,5) WORLD, SHIFT .5, SIZE .05, IN W TITLE "nice!!", AT (0,2) WORLD, SHIFT 1, SIZE .05, IN W VIEW Note that unlike curves resulting from a DRAW command which are clipped to the user rectangle, titles from a TITLE command are clipped to the frame rectangle. Titles can extend beyond the image rectangle if the image rectangle is smaller than the frame rectangle. Like the short DRAW command, the TITLE command can often be abbreviated by omitting unnecessary clauses. A TITLE command to modify an existing title need only supply the title identifier and all clauses containing new information. Other clauses will remain as previously specified. For example, the MLAB command: * TITLE JX, AT (.7,21) WORLD 129 Figure 4.10: Shifting text strings. 130 could be used to reposition the text of the curve JX created above, while leaving the text string, window, size, angle, font table number, shift value, and color unchanged. If the title identifier is omitted from a TITLE command, the new curve will be identified as T0, T1, etc., just as curves in DRAW commands are identified as C0, C1, etc. Since first attempts to position text are often unsatisfactory, it is advisable to supply title identifiers for new text to facilitate further modifications. Any clause can be omitted from a TITLE command creating a new curve, except the text string itself. As needed, the following default clauses will be supplied for a new curve: IN W, AT (0,0) FFRACT, SIZE .02 FFRACT, ANGLE 0, FONT 5, SHIFT 0, \ COLOR 1, PLACE (LEFT,BOTTOM) Note that the default SIZE is the same as the default LABELSIZE for point labels. The ANGLE clause is frequently omitted, as in most of the TITLE commands shown near the end of Chapter 1. Since quotation marks are used to delimit a string, a text string that contains one or more quotation marks presents a special problem. One can proceed by using the MLAB built-in function ASCII and the addition operator + to define the string. ASCII(X) returns the character corresponding to the ASCII value of INT(X), where X is a number. The + operator appearing between two string variables results in a string that is the concatenation of the two string varibles. Since the quote character is ASCII number 34 in font 5, the MLAB command: * TITLE QT = "Here is a quotation mark "+ASCII(34), FONT 5, AT (2.1,43) WORLD, IN W will cause the title QT to have the text: Here is a quotation mark " Continuing a title onto a second line also requires special treatment. It requires that the title string contain an embedded control character for the line feed and carriage return at the end of the first line. The MLAB commands: * * * * * : * DELETE W WINDOW 0 TO 10, 0 TO 10 IN W DRAW SHAPE(2,2,LIST(0,6,10,7)) IN W LT DASHED DRAW SHAPE(2,2,LIST(0,7,10,8)) IN W TITLE TD = "Experimental: solid line’MControl: dashed line" AT \ (1,5) WORLD, IN W VIEW 131 Figure 4.11: Examples of a multiple-line text. 132 provide an example of multiple-line titles. The two lines of text corresponding to the title TD are shown in Figure 4.11. Note that the apostrophe (’) and the letter (M) in the TITLE command’s quoted string were interpreted as embedded control characters and caused the characters immediately following the ’M to be positioned below the first character of the title’s string. The general form of the TITLE command is: TITLE T = "(text)" IN W, SIZE SE1 [UNITS], ANGLE SE2, FONT SE3,/ AT (SE4,SE5) [UNITS], SHIFT SE6, COLOR col, PLACE (A,B)" Table 4.10: TITLE command. The text string is typed between quotation marks as shown above. It can also be coded, that is, have special codes in it that dynamically control the size, font, and relative position of the various noncode characters in the string. These are explained in the next section. The title T is put in the list of titles of window W. If the window clause is omitted, then an existing title T remains in the same window, and a new title T is put into the default window W. The clause SIZE SE1 [UNITS] specifies character size and spacing for the text string in frame fraction, image fraction, or user coordinates, as previously described. If no units are specified, SE1 is assumed to be in horizontal frame fraction units. The clause ANGLE SE2 specifies that the text is to be displayed at an angle of SE2 degrees, where 0 degrees is left-to-right horizontal text, positive angles are measured counter-clockwise from zero, and negative angles are measured clockwise from zero. The clause FONT SE3 specifies that the character table or type style in font table number INT(SE3) is to be used. The table number must be an integer between 1 and 34, inclusive, to select a Hershey font, or between -2 and -14, inclusive, to select a TrueType font. (Recall, TrueType fonts are not supported on Linux/Unix with X-Windows or DOS systems.) The character tables for these fonts are shown in Appendix A. The clause AT (SE4,SE5) [UNITS] specifies that the first character of the string is printed at the point (SE4,SE5) in the specified units; FFRACT means frame fraction units, IFRACT means image fraction units, and WORLD means user rectangle coordinate system of the window containing the curve. If the units are omitted, the coordinates are assumed to be in frame fraction units. The clause SHIFT SE6 positions the text string shifted from the point (SE4,SE5). The shifting is along a line in the direction implied by the angle SE2 if SE2 > 0 and in the opposite direction if SE2 < 0. The shifting line starts at the point (SE4,SE5) and extends to the point of intersection of this line and the nearest extended boundary of the frame rectangle. 133 Text characters may be printed anywhere in the frame rectangle; they need not lie within the image rectangle of the window containing the curve. However, any characters in the text string lying partly or wholly outside the window frame will not be shown. The clause COLOR col specifies that color number INT(col) is used if col is a number. col may also be a color name as listed in Table 4.8 The clause PLACE(A,B) specifies which part of the box that encloses the text string will be placed at the position determined by the AT and SHIFT clauses. A may be either LEFT, RIGHT, or CENTER, and B may be either TOP, CENTER, or BOTTOM. The tables in Appendix A show all of the characters available in each of the MLAB fonts. 4.6 TITLE MODIFICATION COMMANDS As was mentioned in the preceding section, MLAB has special coded commands which may be embedded in strings. These string modification commands enable the user to change the characteristics of a string while in the process of drawing it. These codes are embedded in the string of a TITLE command and are of the form ’nC, where the apostrophe ’ indicates the start of the code, n is an optional real number argument, and C is a command code. These codes are listed in Table 4.11, and examples of many of them are given in the following commands: * * * * WINDOW 0 TO 1, 0 TO 1 IN W TITLE T1 = "f(x) = ’.6U’Zx+y’Z’3B’1Dx-y" AT (.1,.1) WORLD SIZE .06 IN W TITLE T2 = "d = 4t’.6U’.5S2’2S’.6D+2" AT (.1,.5) WORLD SIZE .06 IN W VIEW This dialog produces the picture shown in Figure 4.12. The ’nU and ’nD commands cause following characters to be moved up or down, respectively, by n character heights. The ’nZ command causes underlining to be toggled on or off, which in this example is used to make the horizontal fraction bar. The ’nB command causes the following n characters to appear exactly over the n preceding character. In other words, ’nB, means backspace n characters. The ’nS code will change the character size by a scale factor of n, so the ’.5S command in the second string will halve the size and the ’2S will double it to return it to its original size. The commands: * TITLE T1 = "’15Ta’1T = ’26TI’1Tu dx" * TITLE T2 = "y’’ = ’25Tkjjj’3B’1Tx-y" * VIEW 134 Figure 4.12: Changing character size and position. 135 Figure 4.13: Changing character font tables. produce the picture shown in Figure 4.13. The ’nT command changes the font table used to font R √ number n. This is used to draw the α, , and characters. Double apostrophes (’’) are used to have an apostrophe drawn in the string instead of it being interpreted as a string modification command. The commands: * TITLE T1 = "’.33W’2H M’2W’.66H L’2W’.66H A’2W’.66H B", SIZE .025 * TITLE T2 = "’-20AThis is a circle", ANGLE 90, SIZE .025 * VIEW produce the picture shown in Figure 4.14. The ’nH command and the ’nW command change character height and width, respectively, by a scale factor of n. In the example, the height is initially set to twice the usual and the width is initially set to one third the usual. The height and width are then scaled by factors of two thirds and two, respectively, between each of the four letters. The ’nA command, however, need only be used once and will cause an angle change of n degrees between each of the following characters. This character rotation can be turned off by the ’0A command. 136 Figure 4.14: Changing character height, width, and angle. 137 String modification commands, listed below, are embedded in the text string of a TITLE command. ’nS Multiply character size by n ’nW Multiply character width by n ’nH Multiply character height by n ’nT User character-font table n ’nU Move up n characters ’nD Move down n characters ’nB Move back n characters ’nF Move forward n characters ’nA Set incremental angle of n degrees ’R Reset all parameters ’Cx Control character corresponding to x ’Lx Lower case character corresponding to x ’Y Toggle vertical bars between characters on/off ’Z Toggle underlining on/off ’nO Use color number n ’M Carriage return and line feed ’E Go to after rightmost character ’nIx Draw x for a total of n+1 times ’nX Draw centered over the n-th preceding character Table 4.11: String modification command codes. 4.7 EXAMINING AND MODIFYING CURVE AND WINDOW DATA ITEMS Displaying individual curves, axes, titles, and windows can be controlled by MLAB BLANK and UNBLANK commands, as described in Table 4.12. If a curve or axis is blanked, then none of its parts (curve matrix, label matrix, line-type, and point-type) are shown on the display, although the curve data item continues to exist. The BLANK command puts one or more curves in the blanked condition. The UNBLANK command removes one or more curves from the blanked condition, so that they again appear on the display. The blanked or nonblanked status of each curve is independent of the VIEW and UNVIEW commands. A BLANK or UNBLANK command may refer to a window data item. This is equivalent to applying the BLANK or UNBLANK command to the entire list of curves and titles currently in that window object. Suppose window W1 has been blanked in order to work on a current window W2. Window W1 may be redisplayed while still retaining but not displaying window W2 by the MLAB commands: * BLANK W2 138 * UNBLANK W1 Curves subsequently added to a previously blanked window are blanked as well. For example, if X were an unknown identifier and U were a defined window, then the MLAB commands: * BLANK U * DRAW X = M IN U would cause the window U to contain a blanked curve X, in addition to all of the other curves of U, which would be blanked. The general forms of the BLANK and UNBLANK commands are: BLANK D1, D2, ... , Dn UNBLANK D1, D2, ... , Dn where n >= 1 and D1, D2, ... , Dn is a list of n identifiers, each being a curve, title, or window (or a 3D graphical data item). All listed curves and all curves belonging to listed windows are put in blanked condition or in unblanked condition, as specified by the word BLANK or UNBLANK. Table 4.12: BLANK and UNBLANK commands. When using a slow graphical device, one may want to blank some curves in a picture to avoid delays in redrawing the picture after changes. For example, a list of curves can be blanked in a window W by an appropriate BLANK command such as: * BLANK CA, CC, CD and then either certain of the curves can be selectively unblanked or all of the curves in the window W can be unblanked by executing: * UNBLANK W The TYPE command can be used to obtain information about windows, curves, axes, and titles as well as about other data types previously discussed. A list of defined window objects can be obtained by the command * TYPE WINDOWS 139 a typical MLAB response would be currently defined WINDOWS W For a window identifier W, the command: * TYPE W produces a response having the following information: the list of curves, axes, and titles in W, and the user rectangle, frame rectangle, and image rectangle of W. The format of the response follows: window: W (UNBLANKED) priority: 0 window clipping limits (world units) wxmin:1 wxmax:10 wymin:1 wymax:10 adjustment codes: WNICE, WNICE, WNICE, WNICE frame color: WHITE (0) NO FRAMEBOX frame in screen fraction units (width,height = 1): x:0 to 1, y:0 to 1 frame in screen inches:x:0 to 4, y:0 to 3 image color: WHITE (0) IMAGEBOX, color: BLACK (1) image in frame inches:x:0.7 to 3.7, y:0.375 to 2.625 image in frame fraction units:x:0.175 to 0.925, y:0.125 to 0.875 image in screen fraction units:x:0.175 to 0.925, y:0.125 to 0.875 image in screen inches:x:0.7 to 3.7, y:0.375 to 2.625 CURVES: C0 AXES: W.XAXIS, W.YAXIS TITLES: T1 The curves, axes, and titles are always listed in the order in which they were created, from last to first. Note that the user rectangle, frame rectangle, and image rectangle are clearly defined. The following MLAB dialog shows how lists of the currently defined curves, axes, and titles may be obtained: * TYPE CURVES currently defined CURVES C2 in W W.YAXIS in W W.XAXIS in W C0 in W 140 C1 in W * TYPE AXES currently defined AXES W.YAXIS in W W.XAXIS in W * TYPE TITLES currently defined TITLES W.TOP in W Information about a specific curve, axis, or title can be obtained using the TYPE statement, as well. For example, if a curve item has the identifier C0, the MLAB command: * TYPE C0 responds with information as appropriate about the DRAW command clauses that are currently in effect for C0. A typical response is: curve: C0, (UNBLANKED) in window: W curve data matrix: 10 rows points: pointtype: 0, font: 5, size: 0.02 FFRACT color: BLACK (1) lines: linetype: 1, color: BLACK (1) no label matrix labels: font: 5, size: 0.02, FFRACT color: BLACK (1) format: (-3,5,0,0,2,0), angle: 0 place (left, bottom) xoffset: 0, yoffset: 0 FFRACT initial axis window: 0, 10, 0, 10 wclipsw: 1 However, the curve matrix and label matrix are not typed out. The curve matrix and label matrix of a curve can be recovered by using the CURVEM and LABELM operators, as described in Table 4.13. For example, the command: * TYPE CURVEM(C0), LABELM(C0) would yield a complete description of C0’s curve matrix and label matrix. Thus, it is not necessary to retain matrices which have been used to create curves or labels, since such matrices can always be recovered from the corresponding curve data items. As usual, the CURVEM and LABELM operators can be used as parts of more complicated matrix expressions. 141 For a curve or axis identifier C, the general forms of the CURVEM and LABELM operators are: CURVEM(C) the curve matrix of the curve or axis with identifier C LABELM(C) the label matrix of the curve or axis with identifier C Table 4.13: CURVEM and LABELM operators. A window, curve, axis, or title can be renamed by the use of a special assignment statement. The form of window renaming assignment commands is shown in Table 4.14. For example, the command: * W3 = U1W would cause the window U1W to be renamed as W3, with U1W becoming an unknown identifier. Similarly, the command: * SA2 = TEMPC15 would rename the curve TEMPC15 as SA2, with TEMPC15 becoming an unknown identifier. The general forms of the renaming assignment commands are: U = W and U = C for arbitrary unknown, window, and curve identifiers U, W, and C respectively. Table 4.14: Window renaming assignment commands. 4.8 SIMPLIFYING MLAB GRAPHICS There are several techniques available in MLAB for reducing the labor of making pictures in MLAB. First, there is an alternative form of the WINDOW command, as described in Table 4.15. Rather that explicitly defining the user rectangle’s limits, an ADJUST clause can be given in the WINDOW command. Roughly speaking, the statement * WINDOW ADJUST WNICE IN W1 142 makes the user rectangle the smallest rectangle that nicely contains all the curve matrix points of curves in the window W1. In Figure 4.15, for example, the critical points (0,-3), (1.34,2.3332), and (2,1) lie on the boundary of the user rectangle, which goes from 0 to 2 on the x-axis and from -3 to 2.5 on the y-axis. If another curve is added to a window which has been defined with the ADJUST WNICE clause, the user rectangle will be redefined, if necessary, so that all curves are within the user rectangle. WNICE is one of seven options for the ADJUST clause in the WINDOW statement. The other options are WFIX, WSHRINK, WEXPAND, WFLOAT, WSLACK, and WMATCH. Each of these options is explained in Table 4.15. An alternative form of the WINDOW command is: WINDOW ADJUST p [IN wi] The clause IN wi is optional. If omitted, IN W is supplied. p is either one of the words WFIX, WSHRINK, WEXPAND, WFLOAT, WSLACK, WNICE, or WMATCH, or a corresponding, number. WFIX or 0 means neither expand nor shrink the user rectangle limits when adding or deleting curves. WSHRINK or 1 means decrease the user rectangle limits, if necessary, when deleting curves from the window. WEXPAND or 2 means increase the user rectangle limits, if necessary, when adding curves to the window. WFLOAT or 3 means shrink or expand user rectangle limits, if necessary, to accomodate added or deleted curves. WSLACK or 7 means increase user rectangle limits by 5 percent of the rectangle extent beyond that determined by minimum shrink extent. WNICE or 11 means increase user rectangle limits by as much as 10 percent of the minimum shrink extent to obtain round numbers on axes. WMATCH or 15 means use the larger of minimum x or y-shrink extent to achieve unit aspect ratio. Table 4.15: The WINDOW statement with ADJUST-clause. Another labor saving device to precede the TITLE command with one of the words TOP, BOTTOM, LEFT, or RIGHT. This will automatically place the title string at the specified position in the window’s frame. For example * TOP TITLE T = "The MLAB Learning Curve" * BOTTOM TITLE B = "time" * LEFT TITLE L = "MLAB Fluency" 143 Figure 4.15: Part of a parabola drawn in the default window. would place the title T in the center of the margin above the image rectangle, the title B in the center of the margin below the image rectangle, the title L in the center of the margin to the left of the image rectangle–written at an angle of 90 degrees. A third technique is to make use of the special window called W. For example, the MLAB commands: * * * * RESET FUNCTION G(X) = -3*X*X + 8*X - 3 DRAW C = POINTS(G,0:2:.02) VIEW result in Figure 4.15 showing a parabola: Adding the commands: * UNVIEW 144 Figure 4.16: Additional parts of parabolas drawn in the default window. * * * * * FUNCTION H(X) = -G(X) DRAW D = POINTS(H,0:2:.02) LT 2 DRAW E = POINTS(G,.3:3:.02) TOP TITLE T = "Parabolas" VIEW results in Figure 4.16. Note that the DRAW commands did not specify a window identifier with which to associate the curves C, D, and E, and title T, and yet, • the user rectangle is always defined as the aligned rectangle that encloses all of the points in all of the curve matrices; • the frame rectangle extends over the entire MLAB picture; • the image rectangle has an even margin and its border is drawn; 145 • labelled x and y axes with 6 labels and tick marks are supplied and they are relabelled appropriately when the user rectangle changes; The reason for this automatic behavior is that MLAB provided the default clause IN W to the DRAW statement. Then, since W was an unknown identifier, MLAB read the save file DW.SAV for the window specifications. (Save files will be described in more detail in the next chapter.) Typically, the default window object W saved in DW.SAV was defined by the following MLAB commands: WINDOW 0 TO 10, 0 TO 10 ADJUST WNICE IN W FRAME 0 TO 1, 0 TO 1 FFRACT IN W IMAGE .125 TO .875, .125 TO .875 IN W IMAGEBOX IN W XAXIS 0:10!6&’0 LABEL 0:10!6 LABELSIZE .015 FFRACT FORMAT(-3,5,0,0,2,0) PT UTICK IN YAXIS 0&’0:10!6 LABEL 0:10!6 LABELSIZE .015 FFRACT FORMAT(-3,5,0,0,2,0) PT RTICK IN FFRACT OFFSET (-.01,-.025) \ W FFRACT OFFSET (-.09,-.01) \ W The following MLAB dialog shows the status of the window object W when drawn as shown above: * TYPE W window: W (UNBLANKED) priority: 0 window clipping limits (world units) wxmin:0 wxmax:3 wymin:-6 wymax:3 adjustment codes: WNICE, WNICE, WNICE, WNICE frame color: WHITE (0) NO FRAMEBOX frame in screen fraction units (width,height = 1): x:0 to 1, y:0 to 1 frame in screen inches:x:0 to 4, y:0 to 3 image color: WHITE (0) IMAGEBOX, color: BLACK (1) image in frame inches:x:0.7 to 3.7, y:0.375 to 2.625 image in frame fraction units:x:0.175 to 0.925, y:0.125 to 0.875 image in screen fraction units:x:0.175 to 0.925, y:0.125 to 0.875 image in screen inches:x:0.7 to 3.7, y:0.375 to 2.625 CURVES: E, D, C AXES: W.XAXIS, W.YAXIS TITLES: T DRAW and TITLE commands can be used to add and modify curves and titles in the default window W, just as for any other window. The user, frame, or image rectangle of W can also be changed by the WINDOW, FRAME, or IMAGE commands. Indeed, a user can define W as desired; the MLAB-supplied default window is only used if no window called W is present. 146 4.9 SUMMARY In the following let SE1, SE2, ... denote arbitrary scalar expressions; ME1, ME2, ... denote arbitrary matrix expressions; U denote an unknown identifier; C denote a curve identifier; T denote a title identifier; A denote an axis identifier; and W denote a window identifier. 1. MLAB two-dimensional graphical data types: (a) window (user rectangle, frame rectangle, image rectangle, framebox, imagebox, list of curves, list of axes, list of titles) (b) curve (curve matrix, label matrix, pointtype, linetype) (c) axis (curve matrix, label matrix, pointtype, linetype) (d) title (text string, position) 2. MLAB Commands for making pictures: (a) Display control commands: • VIEW W1,.... • UNVIEW (b) Window creation and modification: • • • • • WINDOW SE1 TO SE2, SE3 TO SE4 ADJUST WTYPE IN W FRAME SE1 TO SE2, SE3 TO SE4 COLOR SE5 IN W IMAGE SE1 TO SE2, SE3 TO SE4 COLOR SE5 IN W [NO] FRAMEBOX COLOR SE1 IN W [NO] IMAGEBOX COLOR SE1 IN W (c) Curve creation and modification: • DRAW C = ME1 IN W, POINTTYPE <SE1|"c">, PTSIZE SE2 [UNITS],/ PTFONT SE3, LINETYPE <SE4|(SE5,SE6,SE7,SE8,SE9,SE10)>, LABEL ME2,/ LABELSIZE SE11 [UNITS], LABELFONT SE12, OFFSET (SE13,SE14) [UNITS],/ PLACE (A,B), FORMAT (SE15,SE16,SE17,SE18,SE19), ANGLE SE20, COLOR SE21/ (New curve defaults: name C = C0, C1, etc., W = default window, POINTTYPE 0, PTSIZE .02 FFRACT, PTFONT 5, LINETYPE 1, LABELSIZE .02 FFRACT, LABELFONT 5, OFFSET (0,0) FFRACT, PLACE (LEFT,BOTTOM), FORMAT (-3,5,0,0,2,0), ANGLE 0, COLOR 1) (d) Axis creation and modification: • <X|Y>AXIS A = ME1 POINTTYPE SE1, PTSIZE SE2 [UNITS]/ PTFONT SE3 LINETYPE <SE4|(SE5,SE6,SE7,SE8,SE9,SE10)> LABEL ME2/ LABELSIZE SE11 [UNITS] LABELFONT SE12 OFFSET (SE13,SE14) [UNITS]/ PLACE (A,B) FORMAT (SE15,SE16,SE17,SE18,SE19,SE20) ANGLE SE21/ 147 COLOR SE22 IN W/ (New axis defaults: name = W.XAXIS, W.YAXIS, or A0, A1, etc., default window = W, POINTTYPE 0, PTSIZE .02 FFRACT, PTFONT 5, LINETYPE 1, LABELSIZE .02 FFRACT, LABELFONT 5, OFFSET (0,0) FFRACT, PLACE (LEFT,BOTTOM), FORMAT (-3,5,0,0,2,0), ANGLE 0, COLOR 1) (e) Title creation and modification: • TITLE T = "(text)" IN W, SIZE SE1 [UNITS],/ ANGLE SE2, FONT SE3, AT (SE4,SE5) [UNITS], SHIFT SE6, COLOR SE7, PLACE(A,B)/ (New title defaults: name = T0, T1, etc., default window = W, SIZE .02 FFRACT, ANGLE 0, FONT 5, AT (0,0) FFRACT, SHIFT 0, COLOR 1, PLACE (LEFT,BOTTOM).) (f) Curve and window blanking: • BLANK D1, D2, ... , Dn • UNBLANK D1, D2, ... , Dn (g) TYPE command for windows, curves, axes, or titles: • TYPE W, TYPE C, TYPE A, or TYPE T (h) Renaming windows or curves: • U = W, U = C, U = A, or U = T (i) Recovering curve and label matrices from curves and axes: • CURVEM(C) or LABELM(C) • CURVEM(A) or LABELM(A) (j) Special facilities: • default window W: Automatically supplied by MLAB in response to a DRAW or TITLE command requiring it. Frame and labelled x-axis and y-axis are included. Automatic rewindowing is performed when DRAW commands introduce new curves. 4.10 EXERCISES 1. Start MLAB and reproduce Figure 4.2 as follows: (a) Create a window W by using the WINDOW, FRAME, and IMAGE commands. (b) Create the x-axis with labelled tick marks, the y-axis with labelled tick marks, and the rectangle bordering the image rectangle. (c) Draw the three straight line segments between adjacent data points, and label the points as shown. 2. Rename the window W in exercise 1 with the new name F2, and blank F2. 148 3. Suppose HL is a scalar and W is a window with default user, frame, and image rectangles, and the following MLAB commands are executed: * WINDOW ADJUST WFIX * TITLE "HL:" AT (6,4) WORLD * DRAW LIST(7,4)’ LABEL LIST(HL) LABELSIZE .02 FFRACT What would be the effect on the displayed picture? 4. Let a function F be given by: F (x) = loge (x2 + k 2 ) Run MLAB and give commands to accomplish the following objectives: • Express F as an MLAB function with a parameter k. • For parameter values k = 1, 2, 3, 4, 5, draw the graph of F from 0 to 4 in the default window W. Below each curve at the value x = 2 label the curve with the inscription “k =” and the corresponding value of k for that curve. • Rewindow the default window W so that the x-axis and y-axis labels are integers, but the five curves remain visible. 5. In Figure 4.17, are shown some geometric figures drawn by MLAB. From the following descriptions, design sequences of MLAB commands to create the required curve matrices and DRAW commands to display the curves. A window with user rectangle -10 TO 10, 10 TO 10 should be used. After designing the commands, run MLAB and test to see whether each figure is obtained. (a) The regular hexagon in the upper left corner has center at (-7,7), leftmost vertex (-9,7), and rightmost vertex (-5,7). (b) The rectangular grid in the upper right corner has horizontal lines for y = 4:10 and vertical lines for x = 4:10. (c) The triangle of circles in the lower right corner has vertices at (7,-5), (5,-9), and (9,-9). (d) The half-circle in the lower left corner has radius 2 and the circle’s center is at (-7,-7). (e) The spiral in the center is described in polar coordinates (r, a) by the equation r = a/20, for 0 < a < 20. (Hint: use the parametric form with x and y expressed as functions of a.) 6. The data points in Figure 4.18 are: (10,1.82), (26,1.70), (41,1.58), (52,1.88), (20,1.35), and (37,.95) for group A; and (48,1.70), (45,1.42), (82,1.31), (65,.85), (77,.97), and (87,.56) for group B. A square was drawn at the x-coordinate and y-coordinate mean values for group A, and a triangle was drawn for the means of group B. Reproduce Figure 4.18. 149 Figure 4.17: Five practice drawings. 150 Figure 4.18: Practice drawing using squares and triangles. 151 Figure 4.19: Practice drawing using font tables. 152 7. Reproduce Figure 4.19 by using the first 28 font tables available in MLAB. 8. Suppose MA, MB, ... , MZ are 26 MLAB matrices for drawing script capital Latin letters. If drawn with LINETYPE 6, each will display the corresponding letter (script A for MA, etc.) filling the user rectangle 0 TO 1, 0 TO 1. The marker value (MA(1,1), MB(1,1), etc.) is 10 for all the matrices. Construct MLAB commands by which you could make a monogram of your initials, using a matrix constructed from the given matrices. Make any assumptions needed about the MLAB window to be used for the display. (Hint: Be careful that the matrix constructed for LINETYPE 6 drawing has consistent marker values.) 9. Use the string modification commands listed in Table 4.11 to draw the following equations in an MLAB graphics window: (a) (sin2 θ)a (b) y = a0 x + a21 (c) R 3x2 dx = x3 10. Draw cos(x) versus x at 100 points with x in the interval [0, π/4]. Define the window so that it has unit aspect ratio. Draw tan(x) versus x at 100 points in the same window. What are the coordinates of the point where the two curves intersect. Use the ROOT operator to refine the precision of the coordinates of the point of intersection. 153 Chapter 5 INPUT AND OUTPUT FOR MLAB Digital computers perform computations by means of a central processor which can access computer memory. A typical computer task involves input operations, computational operations, and output operations. Input operations occur when data or commands are transmitted to the computer memory. In the computational process, commands in computer memory are interpreted, operations are performed on data in computer memory, and the results are placed in computer memory. Then output operations transmit these results from computer memory to the computer display or to some other computer output or storage device. Much of MLAB input and output is directly between the user’s keyboard and the computer’s memory. However, other types of input and output are also useful, either to save time and effort or to make best use of the computer’s facilities. In this chapter, most of the commands available to the MLAB user for input and output operations are discussed. 5.1 FILES MLAB creates and reads various files. These files are “indexed” in various directories. (In operating systems with graphical-user-interface, such as Macintosh and MSWindows systems, directories are often referred to as folders. For such systems, substitute the word folder for directory in the discussion that follows.) MLAB is itself a file which resides in the MLAB directory. When you installed MLAB, you should have manually established the appropriate path information for the MLAB directory to allow the MLAB-executable file to be located by the operating system when you request that MLAB be run. MLAB mandatorily reads and writes certain files and, optionally, reads and writes certain other files as specified below. Some of these files must reside in certain specific directories; others may reside in arbitrary directories of your choice. 154 It is usual to create at least one specific working directory where your MLAB-related data-files and do-files are kept. Generally this directory should be your current directory when you use MLAB. In any event, there are three directories of interest for running MLAB: 1. the MLAB-executable directory, which is the directory where the MLAB program is located; 2. your home directory, which—on multi-user computer systems—is the directory you are in when you log-on to the computer; and 3. your current directory, which is the directory you are in when you start the MLAB program. In an MSWindows system, the MLAB-executable directory is specified during the installation process; it is C: \MLAB if MLAB was installed in the default location. The home directory is the same as the current directory. The current directory can be determined by examining the properties of the MLAB application with the Program Manager which refers to the current directory as the working directory. To run MLAB double-click on the MLAB icon located in the Desktop folder or the MLAB program group. It is not easy to choose your own current directory. In a Macintosh system–if you followed the installation directions— the MLAB-executable directory, the home directory, and the current directory are all the same, namely, the desktop folder entitled: • MLAB, for Macintosh OSX; • MLAB for Power Macintosh, for Macinsosh OS9; and • MLAB for Macintosh, for Macintosh OS7/8. On Macintosh OSX systems, MLAB is a terminal application that runs in a Darwin terminal window. On Macintosh OS7/8/9 systems, MLAB runs in its own command window. To run MLAB, locate the MLAB application icon in the MLAB directory, and double-click on it. It may be helpful to locate the MLAB application in the MLAB folder on the desktop, select the MLAB application file with a single mouse click, and then select “Make Alias” from the Finder’s File menu. Then drag the MLAB “Alias” icon to the desktop. Then, to run MLAB, simply double-click on the MLAB “Alias” icon. In a standard Linux/Unix with X-windows system, the MLAB-executable directory is specified during the MLAB installation process–usually /usr/local/lib/mlab/. Your home directory is the directory you are in when you log-in, i.e. /home/[username]/. On these systems, MLAB runs in a bash-shell terminal window. To run MLAB, you must first establish a set of X-server processes, and then create a terminal emulator process such as XTERM with an accompanying window, if this is not done already. You must then “enter” that terminal window and cd (change 155 directory) to the desired working directory. Then you can issue the command “mlab” to run MLAB. In NeXTStep/Unix systems, the MLAB-executable directory is specified during the installation process. If running MLAB from a NeXTStep/Unix terminal window, the home directory is the directory you are in when you log-in and the current directory is the directory you are in when you run MLAB by typing “mlab”. MLAB can also be run from the NeXTStep Workspace (i.e., “desktop”) by either double-clicking on the MLAB icon, or by double-clicking on the name of an MLAB do-file in the file browser window. In this latter case MLAB will be automatically be supplied with the do-command to execute the selected do-file. In either case, when MLAB is run from the NeXTStep Workspace, your current directory will be your home directory as determined when you logged in. (Beware: if your home directory could not be found at login time, the system will have assigned the top-level root directory as your home directory.) Also when MLAB is run from the NeXTStep workspace, a front-end MLAB interface process is run which, in turn, communicates with an MLAB “session” process. You may establish further MLAB sessions by clicking the Session→New menu item. In a DOS system, the MLAB-executable directory is specified during the installation process; it is C: \MLAB if MLAB was installed in the default location. Your home directory is the same as the current directory. To run MLAB, you should cd (change directory) to the working directory you desire, and then run MLAB by typing “mlab” (assuming the DOS PATH environment variable is properly set). For example, if you create a directory called C: \MLAB \WORK, cd to that directory, and type “mlab”, then C: \MLAB \WORK is the current directory. MLAB accesses and creates files. Each such file must be in a specific directory. There are MLAB control strings whose values determine where some files will be. Other files are assumed to be in certain fixed directories. MLAB commands may be typed in the screen or the text window. Currently, aside from backspace, no special line-editing facilities are present, so, for example, don’t try to use arrow keys while typing commands. When an error occurs, however, such as a mistyped command, DOS, MSWindows, and Macintosh OS7/8/9 MLAB will invoke a special single-line editor which allows you to correct the erroneous command. Macintosh OSX and Linux/Unix versions of MLAB do not yet have such a feature. However, you can use the up- and down-arrow keys to bring previously typed commands to the current command line and use the left- and right-arrow keys to move the text cursor in the current command line and delete or insert characters to edit the command. For individual exploratory computations, it is appropriate to directly type MLAB commands. Usually, however, it is most convenient to construct a do-file with the text-editor facility in MLAB (under DOS or MSWindows), or with a parallel-running editor program in other environments. You can repetitively execute such a do-file and revise it to construct a useful reusable script. MLAB accesses or creates the following types of files which are discussed below: 156 1. log-files, 2. startup-do-files, 3. save-files, 4. plot-files, 5. print-files, 6. read-files, 7. do-files, and 8. MLAB-control-files. Each computer disk file has a name of the form: filename.ext where filename is a user-selected name. In the case of DOS, the filename is limited to eight characters (beginning with a letter and followed by seven or fewer letters and/or digits 0-9) and ext is an optional extension of one to three characters. On MSWindows, Macintosh OS7/8/9/X, and Linux/Unix, the filename and extension are not limited to eight characters and three characters, respectively. Also, on DOS, MSWindows, and Macintosh OS7/8/9 systems, the filename and extension are not case-sensitive; on Macintosh OSX, NeXTStep/Unix, and Linux/Unix, the filename and extension are case-sensitive. In Chapter 1, for example, a save file named TUTOR.SAV was created. Other examples of acceptable names for disk files are: EXPR2A.1, JONES, FILE1.LST, ST.F4, and MLAB.LOG. Other systems allow various extended forms of filenames, but DOS names are a lowest common denominator which we will use herein. Certain extensions have special meanings by convention. For MLAB users, the log filename MLAB.LOG and the extensions DAT, DO, PS, and LST have special roles, which will be described later. Save-files, print-files, plot-files, read-files, and do-files will all be accessed in the directory specified by the MLAB control string FILEDIR. For example, • on DOS or MSWindows systems, if FILEDIR = \MLAB \WORK \KINETICS \ then the MLAB command PRINT mat will create the file \MLAB \WORK \KINETICS \mat.lst. • on Linux/Unix systems, if FILEDIR = /home/George then the MLAB command PRINT mat will create the file /home/George/mat.lst. • on Macintosh OSX systems, if FILEDIR = /Users/csi/ then the MLAB command PRINT mat will create the file /Users/csi/mat.lst. 157 • on Macintosh OS7/8/9 systems, if FILEDIR = Disk:MLAB for Macintosh:kinetics then the MLAB command PRINT mat will create the file Disk:MLAB for Macintosh:kinetics:mat.lst. If FILEDIR is the empty string, the current directory is used. Note the special pattern ∼ may not be used on Linux/Unix or Macintosh OSX systems when defining FILEDIR; MLAB has no understanding of this shorthand notation. Also note, in the examples above, the character used to separate directory names and filenames differs according to the system on which MLAB is running. On DOS and MSWindows systems, the character is backslash, \; on Linux/Unix and Macintosh OSX, the character is slash, /; and on Macintosh OS7/8/9, the character is colon, :. If, the MLAB control string DOFILEDIR is set, then it will be used instead of FILEDIR to determine the directory where MLAB do-files will be sought. (This does not affect the automatic execution of the start-up do-file mlabinit.do.) The various types of files accessed or created by MLAB are discussed below in more detail. • Log-files: mlab.log, mlab0.log, ... When MLAB is run, it creates a log-file in your current directory. This log-file is named MLAB.LOG. During the MLAB session, all MLAB commands that are typed in and all MLAB responses that are displayed are entered into this disk file. However, the pictures on the graphical display are not entered into the log file. (These are to be created using the PLOT command.) After the MLAB command EXIT is given to end the session, the disk file MLAB.LOG can be printed or used as desired. One common use is to edit the log file to construct a do-file for further use. Any previously-existing file named MLAB.LOG will be renamed to MLAB0.LOG; any file named MLAB0.LOG will first be shifted to be MLAB1.LOG; any file named MLAB1.LOG will first be shifted to be MLAB2.LOG; any file named MLAB2.LOG that is replaced by MLAB1.LOG will be deleted. • Startup-do-files: mlabinit.do, $HOME/.mlabrc In Linux/Unix, NeXTStep/Unix, and Macinosh OSX, if the do-file .mlabrc is present in your home directory, it will be interpreted when MLAB is first run. Subsequently, in Linux/Unix, NeXTStep/Unix, Macinosh OSX, and in MSWindows, Macintosh OS7/8/9, or DOS, if the do-file called mlabinit.do is present in your current directory, it will be interpreted when MLAB is run. • Save-files: *.sav 158 MLAB can be directed to create binary files holding MLAB data objects (scalars, matrices, windows, functions, initials, strings) via the SAVE command. These files are called save-files and have the extension .sav. The data objects stored in a save-file can be read into MLAB by means of the USE command. Save-files are created and accessed in the directory specified by FILEDIR. • Plot-files: mlabp#.ps, mlabp#.lj MLAB can be directed to create PostScript and LaserJet plot-files by using the PLOT command. The file names for PostScript plot-files have an mlabp prefix followed by a number and a .ps extension. The file names for LaserJet plot-files have an mlabp prefix followed by a number and an .lj extension. Plot-files are created and accessed in the directory specified by FILEDIR. • Print-files: mlab.lst, *.lst, * MLAB can be directed to create print files by using the PRINT command. Print-files have default name mlab.lst if no name is specified, and moreover subsequent print operations append to this file. A print-file has the default extension .lst if the file name with no extension is given. Alternately, the full print-file name can be given in quotes. Print-files are created and accessed in the directory specified by FILEDIR. Print-files are text-files which may be used in any way desired, including physically printing them when you wish. In order to print any file, you can type the MLAB command PRINT FILE <filename>, or you may use the facilities of your operating environment to “send” the file to the printer. This can be difficult in some cases. • Read-files: *.dat The READ operator in MLAB can be used to read numbers from a text-file. Such text-files are accessed in the directory specified by FILEDIR. • Do-files: *.do Do-files are text-files containing MLAB commands; thus they are executable scripts. A do-file z.do is executed by typing DO z. Such do-files are accessed in the directory specified by control string DOFILEDIR. If DOFILEDIR is empty, then do-files are accessed in the directory specified by FILEDIR. Do-files provide the usual way in which you control MLAB to develop a computation or do repetitive tasks. • MLAB control files: MLAB.HLP, gxfonts.0, etc. MLAB consists of an executable file and a number of associated control files. These files are 159 found in the MLAB executable directory, and possibly in certain ancillary directories. These directories are fixed at the time MLAB is installed. 5.2 THE SAVE AND USE COMMANDS You can save data objects on the disk for later reuse. Such files are called SAVE-files; they are created by the MLAB SAVE command. The SAVE command is described in Table 5.1. To execute the SAVE command of MLAB, the user supplies: 1. a list of MLAB identifiers separated by commas for currently defined data items and 2. a filename for a computer disk file to be created or modified. For example, recall the command: * SAVE Y, M, A, B, DAY, CS1, W IN TUTOR1 from the Tutorial in Chapter 1, which created a computer disk file named TUTOR1.DAT. This file contained the function definition for Y, the matrices M and DAY, the scalars A and B, the set of constraints CS1, and the window W that were defined during the session. When the window W is saved, all its curves, titles, and axes are automatically saved also. However, curves, titles, and axes can only be saved by saving the window containing them. To recover these data items in a subsequent MLAB session, the MLAB USE command, described in Table 5.2, is given with the filenames previously chosen, as in the following dialog: * USE TUTOR1 Using: W,CS1,DAY,B,A,M,Y Note: It is permissible to state an extension other than .sav for the name of a SAVE file. If the filename is delimited by double quotes, the characters between the double quotes will be taken as the exact file name. Some USE and SAVE command cautions should be noted: • USE commands only work with files created by SAVE commands. 160 The general forms of the SAVE command are: SAVE D1, D2, ... , Dn IN filename where D1, D2, ... , Dn is a list of MLAB identifiers (cannot be unknown, curve, or surface identifiers), and filename is the name of a disk file. This statement causes the values of the identifiers D1, D2, ... , Dn to be saved in the specified file. On a DOS computer, all characters in the filename after the first eight are deleted. In any case, the extension .DAT is added. If the identifier list D1, D2, ... , Dn is omitted, then all currently defined data items are saved. If the filename is omitted then each data item in the identifier list will be saved in its own file, with the identifier names used as above for filenames. Table 5.1: SAVE command. The general forms of the USE command are: USE filename1, filename2, ... , filenamen where filename1, filename2, ... , filenamen are names of disk files created by the SAVE command. If the command SAVE IN filename is given in one session, then the command: USE filename given in a subsequent session, allows the user to use the items saved in the earlier session. An important use is to allow resumption of interrupted work at a later time. The complete filename for the disk file is obtained by deleting any characters after the first eight and adding a period (.) and the extension. Table 5.2: USE command. • The computer disk file created by a SAVE command can not be changed by subsequent assignment, FUNCTION, DRAW, or other MLAB commands that modify data items in computer memory. A snapshot of the data items is created at the moment the SAVE command is executed. Another SAVE command must be given if it is desired to save modified data items that were previously saved with different values. • A SAVE command can cause a previously-created file to be deleted before the new list of 161 items is saved. However, the user is first warned by the message: ##Save: file TUTOR1.SAV already exists. [R:overwrite, *:keep existing file]: The user can then respond R to replace the old file, or * to cancel the SAVE command, leaving the old file unchanged. • The USE command can destroy MLAB data items currently in computer memory by replacing them. Note the following dialog: * Y = 1:10 * USE TUTOR1 Using: W,CS1,DAY,B,A,M ##diskuse: an object with an existing name is being used. [R:rename, O:overwrite]: If O is typed, then the USE command will destroy the old column vector Y by replacement. • MLAB SAVE commands create files in a compact (binary) form for economical storage. Therefore, attempting to print or edit .SAV files will produce unintelligible output from a disk file that was created by an MLAB SAVE command. • Save files created by one operating system version of MLAB cannot be USEd by another operating system version of MLAB. You can only USE such a file on the same operating system in which it was created. The SAVE and USE commands are sometimes useful within a single MLAB session. For example, one might want a series of graphs which differ only in the data and certain title information. Here, a window named PIC can be created containing a common framework for the picture series: axes and labels, common legends and descriptive information, and so on. Then the command: * SAVE PIC creates a file named PIC.SAV to save this framework. Now adding data curves and titles to the framework on the screen, creates the first picture. The commands: * PIC1 = PIC * BLANK PIC1 * USE PIC change the window name PIC to PIC1, blank PIC1, and then retrieve PIC for starting the second picture PIC2. A similar technique can be used to create the remaining pictures in the series. A saved picture may have some or all of its curve data items blanked. For example, one could put two blanked TITLES having different titles into PIC and then unblank the string curve wanted for the current picture. 162 5.3 THE READ, READON, KREAD, AND KSREAD FUNCTIONS In Chapter 3, it was shown that the KREAD matrix expression: * KREAD(SE1,SE2) can be used to read typed-in numerical values into an MLAB matrix at the keyboard. The LIST operator is another convenient way to directly prepare a matrix containing some particular numbers. If, however, a matrix has more than 20 or 30 entries, it is usually preferable to prepare a textfile containing the data, rather than to type the data during the MLAB session. You can use any desired text editing program that creates ASCII text files, such as EDIT or NOTEPAD on MSWindows; TeachText or SimpleText on Macintosh; Emacs or vi on Linux/Unix, Macintosh OSX, and NeXTStep/Unix; or the builtin MLAB text editor on DOS. You can launch most of these editors by typing the MLAB command EDIT FILE <filename>. Text files are conveniently examined, changed, and augmented. Such a text-file can then be read to form a matrix by using the MLAB READ operator. If the file name in an MLAB READ operation is a proper MLAB identifier consisting of letter, digits, and dot characters only, then surrounding quotation marks may be omitted. Such an unquoted file name will have the extension .DAT appended to it. For example: * M14 = READ(ROD1,150,2) would access the first 300 numbers of the disk file ROD1.DAT to construct the 150 row, 2 column MLAB matrix M14. A READ matrix expression may refer to a text-file that contains too few numbers to fill up the specified size of the matrix. The complete form of the READ command is shown in Table 5.3. In that case, rows are successively filled until all available numbers have been used; any incomplete rows are filled with zeroes. For example, if ROD1 contains 145 numbers, then the command in the previous paragraph would create a 73 by 2 matrix M14, with M14(73,2) equal to 0. This property of the READ matrix expression permits the user to overestimate the number of rows in the matrix if the exact number of rows of data are not known. However, the number of columns must be known exactly. If the number of columns is not specified, 1 is assumed. The MLAB operator READON constructs a matrix with numbers read from a file. It is identical to READ, except that it leaves the file open after a portion of it has been read. A subsequent READON 163 The general forms of the READ matrix expression are: READ("...filename.ext",SE1,SE2) READ(filename,SE1,SE2) READ("CON",SE1,SE2) The first form is used for an arbitrary disk file. The second form is used if the disk file name has the extension DAT. The third form is used for keyboard input. The expression is evaluated to an m by n matrix, where 1 ≤ m ≤ SE1 and n = SE2. The matrix entries must be MLAB constants in character form (see Section 2.1) on the source specified. Alphabetic and other non-numeric characters (except a period) are treated like blanks. Termination of input occurs either because (1) m rows of numbers each of length n, have been entered in the matrix, or (2) no more numbers are available from the input source (e.g., CTRL-Z or Escape was detected for device CON:, the end of the computer disk file was reached). If termination of input occurs because of case (2) above, then the current row of the matrix is completed with zero entries if necessary, and no additional rows of the matrix are included. If SE1 and SE2 are omitted from the READ matrix expression, then the default values of 1000 rows and 1 column are assumed. Table 5.3: READ matrix expression, general form. applied to the same file continues where the previous READON operation left off. In this way, the numbers in a file may be processed piecemeal. If, when executing READON(F,X,Y) fewer than X*Y numbers remain in the file, then only a FLOOR(k/Y)*Y, matrix is returned, where k is the number of values remaining in the file; the last row is padded with 0-values as necessary. If X < 0, the file F is immediately closed, and a 0-row null matrix is returned. The MLAB operator KREAD constructs a scalar or matrix by reading one or more numbers from the keyboard. There are four options for the arguments: no arguments, a single string argument S, or one or two scalar arguments, X and Y; the argument X and the optional argument Y specify the number of rows and columns of the matrix result, so that X · Y is the number of numbers to be read. KREAD is a convenient way to read data from within a do-file. If there are no arguments, a single number entered at the keyboard is read and returned as a scalar value. If, when a single number is requested, the user enters no number but simply presses the ENTER/RETURN key, then the value MAXPOS is returned. Testing for MAXPOS is a convenient way to determine that some default input value should be used. 164 If there is a string argument S, MLAB will print the string to the MLAB command window, and wait for the single number to be entered followed by the RETURN/ENTER key. This is convenient for dialog-directed input. Otherwise, this case is identical to the no argument case. If X is given and Y is omitted, then X numbers are read, and a 1-column matrix with X rows is returned. If both X and Y are given, then X*Y numbers are read, and a matrix with X rows and Y columns is returned. You must enter at least X*Y numbers. The numbers may be typed in free format, separated by spaces, tabs, or commas. Input lines are terminated by pressing the RETURN/ENTER key. If the Escape key is typed in an input line, the current row of the matrix is completed with zero entries and no more rows are added to the matrix. Excess numbers are ignored. Thus KREAD will read in a fixed number of numbers, i.e. if you specify X = 8 and Y = 2, you must type in 16 numbers unless the Escape key is struck. To read-in an indeterminate number of numbers, READ should be used. The input to KREAD ignores ^Z, in distinction to READ(CON,...), which terminates with either ^Z or the ESCape key. The MLAB operator KSREAD returns a string which is read from the keyboard. The string to be entered is terminated by the first white-space character (i.e, space, tab, or LF/CR (RETURN/ENTER key)) which appears in the input. Entry must be terminated by pressing the RETURN/ENTER key. Thus, the KSREAD function provides a convenient means of entering a file name for use in a do-file. 5.4 THE PRINT COMMAND In previous chapters, it was shown that the MLAB TYPE command can be used to display information about current data items. The MLAB PRINT command is similar to the TYPE command, except that MLAB data information is directed to a file by the PRINT command. The general form of the PRINT command is shown in Table 5.4. For example, the same descriptive information is generated by the two MLAB commands below: TYPE NROWS(M), NCOLS(M), M PRINT NROWS(M), NCOLS(M), M IN MDATA The TYPE command causes the two scalars NROWS(M) and NCOLS(M) and the matrix M given in the command to be typed to the MLAB command window. The PRINT command causes a computer disk file named MDATA.LST to be created containing the same information in character form. This file is an ASCII text-file; it is suitable for printing (unlike the MLAB SAVE command) or for reading by another program. After exiting from MLAB, the user can either use the MLAB command: 165 PRINT FILE MDATA.LST or employ another program or operating system service to physically print the produced file. For example, in DOS or an MSWindows Command prompt window, we can type: PRINT MDATA.LST at the prompt to cause the contents of our file to be printed on the computer’s printer. In Linux/Unix, NeXTStep/Unix, and Macintosh OSX, we can type: lpr MDATA.LST at the bash-shell XTERM or Darwin terminal window prompt to print the file on the computer’s printer. (Note that the MLAB and DOS PRINT commands are different and that the MLAB PRINT command does not, itself, initiate the printing of data–the command PRINT FILE <filename> must typed in MLAB.) The MLAB PRINT command is often used to prepare large arrays or other large volumes of data for subsequent printing on the printer. Another valuable use for the PRINT command is to create a disk file of character data for input to another computer program. The MLAB TYPE command causes descriptive information to be listed in the MLAB command window when typing out certain data types. For example, when typing a scalar, the scalar name and an equal sign (=) are typed as well as the value of the scalar; when typing a matrix, the matrix name, its dimensions, and row numbers are typed as well as the values of matrix elements. This descriptive information can be suppressed if the scalar NAMESW is set equal to 0. This suppression applies to the results of both the TYPE command and the PRINT command. 5.5 THE PLOTDEV AND PLOT COMMANDS In Chapter 4, techniques were discussed by which pictures can be generated and displayed using MLAB. The MLAB user can make permanent records of the displayed pictures if there is a PostScript or Hewlett Packard LaserJet printer accessible to the computer. MLAB provides the PLOT command, described in Table 5.5, for making a disk file containing data necessary to reproduce the currently displayed picture. The output file can contain either PostScript language commands–which are ASCII commands developed by Adobe, Inc., that can be edited, embedded in documents, or displayed with various other programs such as Ghostscript; 166 The general form of the PRINT command is: PRINT D1, D2, ... , Dn IN filename where each of D1, D2, ... , Dn is an MLAB identifier (scalar, array, defined function, constraint set, initial, curve, window, surface, or 3Dwindow), a scalar or matrix expression, or a derivative of a function. The PRINT command creates a computer disk file named filename.LST (with filename truncated to eight characters if necessary), containing alphabetical and numerical characters suitable for printing. The data has the same format as would be obtained from a TYPE command applied to the same list of identifiers and expressions. The clause IN filename can be omitted, in which case the data items are appended to the end of the file named MLAB.LST. An MLAB file can be physically printed, if a suitable printing device is attached to the computer, with the command: PRINT FILE <filename> where filename is an existing filename in the current working directory. Table 5.4: PRINT command. or Hewlett Packard LaserJet Graphics Language commands–which are binary graphics language commands developed by Hewlett Packard Inc. that can be sent to a suitable HP printer. MLAB can generate any of six types of output plot files, specified with one of the following PLOTDEV commands: • PLOTDEV = PSL, for black and white, PostScript language in landscape mode; • PLOTDEV = PSP, for black and white, PostScript language in portrait mode; • PLOTDEV = PSCL, for color, PostScript language in landscape mode; • PLOTDEV = PSCP, for color, PostScript language in portrait mode; • PLOTDEV = LJ2L, for black and white, HP Graphics Language in landscape mode; or • PLOTDEV = LJ2P, for black and white, HP Graphics Language in portrait mode. 167 Here, landscape mode refers to the larger dimension of an 8x11.5 inch page oriented horizontally; portrait mode refers to the larger dimension of an 8x11.5 inch page oriented vertically. If no PLOTDEV command is given, PLOTDEV = PSL output files are generated. If PLOTDEV is set to generate PostScript output, i.e. PLOTDEV = PSL, PSP, PSCL, or PSCP, then the name of the disk file created by a PLOT command is mlabp # .ps where # is 0,1,2,.... The PLOT command never modifies an existing ps file; it always creates a new file with the first unused name in the sequence mlabp0.ps, mlabp1.ps, mlabp2.ps, etc. The MLAB response to a PLOT command shows the name of the computer disk file that was created. For example, the MLAB dialog: * PLOT PLOT file is mlabp0.ps indicates that the computer disk file mlabp0.ps was created, containing data needed to display or plot the current picture on a PostScript printer. If PLOTDEV is set to generate Hewlett Packard Graphics Language output, i.e. PLOTDEV = LJ2P or LJ2L, then the name of the disk file created by a PLOT command is mlabp # .lj where # is 0,1,2,.... The PLOT command never modifies an existing lj file; it always creates a new file with the first unused name in the sequence mlabp0.lj, mlabp1.lj, mlabp2.lj, etc. Using the PLOT command, it is even possible to do MLAB graphics blind, without viewing the current picture. However, for elaborate plots such a procedure is likely to lead to errors unless it has been tested thoroughly in advance. For simple plots the danger of requiring several iterations is small. MLAB output ps and lj files are not in a form suitable for subsequent input to MLAB. (The MLAB SAVE and USE commands may be used for window data items for that purpose.) In order to physically plot an MLAB plot-file, you must either type a PRINT FILE command or use the facilities of your operating system to send the plot-file to your printer. 5.6 THE DO COMMAND As previously described, the MLAB DO command causes execution of one or more MLAB commands (separated by semicolons) which are read in character form from some computer input device. In practice, DO commands almost always refer to disk files. The general form of the DO command is presented in Table 5.6. Suppose TEST.DO consists of MLAB commands ending with DO TESTA (followed by a semicolon) and TESTA.DO consists of MLAB commands ending with DO TESTB (followed by a semicolon). 168 The general form of the MLAB PLOT command is: PLOT W1,W2,... IN filename W1, W2, ... are one or more window identifiers. If no window identifiers are specified, all defined windows will be included. filename is the name of a file. If the specified filename corresponds to a file that already exists in the MLAB working directory, the user will be prompted to specify if the existing file should be kept or over-written. If no file extension is provided in filename and the plotting device specified by a prior PLOTDEV command is a PostScript device, then ps is used as the extension. If no file extension is provided in filename and the plotting device specified by a prior PLOTDEV command is an HP Graphics Language device, then lj is used as the extension. If no filename is provided and the plot device is a PostScript device, then the first unused name in the sequence mlabp0.ps, mlabp1.ps, etc., is created containing the current picture. If no filename is provided and the plot device is an HP Graphics Language device, then the first unused name in the sequence mlabp0.lj, mlabp1.lj, etc., is created containing the current picture. PLOT can be executed without displaying the picture. Table 5.5: PLOT command. Issuing the command DO TEST causes all MLAB commands in the files TEST.DO, TESTA.DO, and TESTB.DO to be executed. It is also possible for a DO file to contain several DO commands interspersed with other MLAB commands. It is the user’s responsibility to avoid an infinite circle of DO file references. The DO command may be executed repeatedly by using a FOR command. For example: * FOR J = 1:100 DO {DO RUN} will execute the MLAB commands in RUN.DO a hundred times, with J equal to 1, 2, ... , 100, consecutively. Of course, scalar expressions containing J may occur in MLAB commands that 169 In general, the DO command has one of the three forms: DO filename DO "filename.ext" DO STR Here, the .ext is optional. The first form refers to a file having extension DO in the user’s disk area. Note that the extension is not typed in the DO command. It is valid to put DO commands into DO files and to chain together several such files so long as an infinite circularity is avoided. If a serious error condition occurs during execution of a DO file, then execution of all DO files is terminated immediately and an error message will appear. Certain error conditions cause warning messages to be typed without interrupting DO file execution. After all DO file commands are executed, an asterisk (*) prompt appears. All contents of the specified device or file, are interpreted as MLAB commands separated by semicolons and are executed in sequence. Table 5.6: DO command. have been saved in RUN.DO. Note that the word DO appears twice in the command, first as part of the syntax of the FOR command and then to specify the DO command. At first, the MLAB DO command seems to be just a labor-saving device of no great importance. The experienced MLAB user, however, finds that DO files are very useful for avoiding large amounts of repetition. For example, systems of interrelated FUNCTION definition statements can be put into DO files, thus avoiding the necessity of retyping long and complex expressions. Designing and testing an MLAB DO file is similar to writing a computer program and is usually more difficult than executing MLAB commands interactively. This is because one must foresee in advance all the possibilities that may arise. There is a special use of the TYPE command for issuing messages from the DO file to the display. The message is enclosed in quotation marks and becomes the argument of the TYPE command. For example, the commands: TYPE "K IS THE BINDING VALUE."; TYPE K; in a DO file will lead to the computer response: 170 K IS THE BINDING VALUE. during execution of the DO command for that file. This message could be used to remind the user what is required here, say an assignment statement for the scalar K. You can also direct the input of values within a do-file. For example, you might program: K = KREAD("Enter the value K") in the file READK.DO. Then typing: * DO READK causes MLAB to print: Enter the value K and wait for the user to type a number. Then one might enter: .2E-4 so that the computation continues with this value assigned to K. 5.7 THE IF-THEN-ELSE COMMAND There is another MLAB command, the conditional or IF-THEN-ELSE command, described in Table 5.7, which can be used to control execution of MLAB commands. It is generally useful in DO files. This command is similar to the IF-THEN-ELSE scalar expression described in Chapter 2. However, the THEN and ELSE clauses for the conditional command contain MLAB commands or parenthesized lists of MLAB commands, not scalar expressions. There is little point to using the conditional command when typing in MLAB commands, since one can simply find out whether the condition is true or false and then type in the MLAB commands in the THEN or ELSE clause, as appropriate. In a DO file, however, one must provide for both alternatives in advance, and so this form is useful. Consider the example: 171 The general form of the conditional command is: IF SE1 THEN command-group1 ELSE command-group2 If SE1 NOT= 0, then the commands following the THEN clause are executed. If SE1 = 0 then the commands following the ELSE clause are executed. This agrees with the convention that true is represented by 1 and false is represented by 0 for arithmetic comparison and logical connectives considered as scalar operations. The specifications for command-group1 and command-group2 are: (1) nothing (2) a single MLAB command (without semicolon), or (3) a sequence of n MLAB commands in parentheses, separated by semicolons, of the form: (command1; command2; ... ; commandn) The ELSE clause including command-group2 may be omitted. Table 5.7: Conditional command. IF X=0 THEN TYPE "ERROR: X IS 0" ELSE V = 1/X; which is a proper conditional command. This command causes the message ERROR: X IS 0 to be typed when X is zero, and causes the assignment statement V = 1/X to be executed when X is nonzero. The error condition DIVISION BY ZERO does not occur if this command is executed in a DO file, since only expressions in the executed clause are evaluated. The next example shows an ELSE clause with two MLAB commands: IF K<35 THEN K = K+1 ELSE (K = 0; TYPE "K RESET TO 0"); This command increases K by one when K < 35, and sets K to zero and causes the message K RESET TO 0 to be typed when K >= 35. In MLAB, the THEN clause can not be omitted from a conditional statement, but the ELSE clause can be omitted. However, the MLAB commands within either clause can be omitted. For example: IF X NOT = 0 THEN X = X-1; IF X NOT = 0 THEN X = X-1 ELSE; IF X = 0 THEN ELSE X = X-1; 172 are equivalent conditional commands. As an example of the use of these techniques, consider the quadratic equation: a · x2 + b · x + c = 0 There are two roots of this equation, which are both real or which form a complex conjugate pair according to whether the discriminant: d = b2 − 4 · a · c is positive or negative. The DO file QUAD.DO shown below solves any such quadratic equation: /* QUAD.DO */ TYPE "SET CF=LIST(A,B,C) FOR ROOTS OF A*X^2 + B*X + C = 0."; DO CON; DSCR = CF(2)^2-4*CF(1)*CF(3); IF DSCR >= 0 THEN ( S = (-CF(2)+SQRT(DSCR))/(2*CF(1)); T = (-CF(2)-SQRT(DSCR))/(2*CF(1)); TYPE "REAL ROOTS S AND T") ELSE ( S = -CF(2)/(2*CF(1)); T = SQRT(-DSCR)/(2*CF(1)); TYPE "COMPLEX CONJUGATE ROOTS S+Ti AND S-Ti"); TYPE S,T; Lines 1-2 request that the user enter the desired coefficients a, b, and c into a 3 by 1 matrix CF. In line 3, the discriminant is computed as DSCR. Lines 4-10 contain a single, large conditional command which computes S and T correctly in the two possible cases and issues the correct message. Finally, S and T are typed at line 11. Note that all statements are separated by semicolons. An example of MLAB dialog using QUAD.DO is given below: * DO QUAD SET CF=LIST(A,B,C) FOR ROOTS OF A*X^2 + B*X + C = 0. CF = LIST(1,-5,6) REAL ROOTS S AND T S = 3 T = 2 * DO QUAD SET CF=LIST(A,B,C) FOR ROOTS OF A*X^2 + B*X + C = 0. CF = LIST(2,7,23) 173 COMPLEX CONJUGATE ROOTS S+Ti AND S-Ti S = -1.75 T = 2.90473751 In DO files, any comments can be put between quotation marks and followed by a semicolon. These comments have no effect upon the execution of the DO file and are not displayed. Comments may also be bracketed by /* and */ as in the C programming language. This section concludes with some general advice on designing and testing large DO files. The methods below are not intended to be exact rules, but guides for a coherent approach. To design DO files: 1. Keep in mind the DO file objective and design MLAB data items (scalars, matrices, windows, and curves) which will be required to generate the wanted numerical results or pictures. 2. Analyze the data items (such as scalars, MLAB functions, data matrices, and partially completed windows which will be required as input) in order to create the final MLAB data items that are wanted. Design a strategy for input to the DO file: whether data items are to be created before executing the DO file or during execution by means of DO CON commands and whether saved data items such as windows are to be obtained by USE commands, assignment commands, or other MLAB input commands. 3. Design the computational and output procedures, that is, the MLAB commands and expressions which will compute the desired MLAB data items using the input data items. Use conditional commands (IF-THEN-ELSE commands) where required to treat alternatives. Develop expressions in full generality, avoiding unsupported assumptions that are based on the properties of a particular set of input test data. (Errors of this kind frequently occur when constructing pictures.) 4. If a DO file is to be used repeatedly during the MLAB session, it may be necessary to modify data items before exiting from the DO file. Design the necessary commands so that repeated executions of the DO file will work correctly. 5. It is usually helpful to add comments or typed messages to a DO file, so that its principles can be quickly recalled after a lapse of time. It is particularly useful to state the name of the file in the first line of the file itself. 6. It is often convenient to use RESET at the beginning of a do-file. It is also useful to use the assignment command ECHODO = 3; this causes the do-file to echo to the MLAB command window when it is executed. When a large DO file is first constructed, it is likely to have a number of errors that produce error messages or unintended results. Some standard methods for discovering and correcting such errors are described below: 174 1. Tests for Syntax Errors: (a) Check that every DO file command and comment has a semi-colon. (b) Check that all parentheses, brackets, and quotation marks are in proper pairs. (c) Check that scalar and matrix operations have the proper number, order, and type of arguments; that matrix dimensions are correct; and that MLAB commands have correct syntax. (d) Check that the DO files are not too long. Long files are hard to understand and debug. 2. Tests for MLAB Identifier Misuse: (a) Check that all MLAB data items required in a DO file have been created. (b) Check that the same MLAB identifier has not been used for more than one purpose and that the identifier is not an MLAB reserved word (see the latest edition of the MLAB Reference Manual). (c) Check that MLAB identifiers have been deleted where necessary to free them for subsequent use as unknown identifiers. 3. Tests for Logical Flow Errors: (a) Check whether conditions are improper or tests are reversed in IF-THEN-ELSE commands or in the IF-THEN-ELSE scalar expressions, and whether any needed operations have been omitted from the THEN or ELSE clauses. (b) If the DO file is intended to be used repeatedly within the same MLAB session, make sure that it works repeatedly (not just once). Check any commands preparing for the next use of this DO file for possible omissions and errors. 4. General Error Correcting Methods: (a) Examine error messages and output for clues to DO file malfunction. (For example, DIVISION BY ZERO or ASSIGNING MATRIX TO SCALAR suggest particular types of errors.) (b) Examine MLAB data items and graphical displays for clues in a DO file malfunction. (A curve not displayed may not exist, may be blanked, or may be outside the user rectangle or off the display screen. Here, a TYPE command for the window, curve, and curve matrix should reveal the situation.) (c) Insert temporary TYPE or other commands into the DO file to monitor logic of the file as well as some of the intermediate results. (d) Execute DO file command sequences by typing them interactively and examining the computed results. Several samples of input data may be needed, to detect errors caused by expres-sions that work for some cases but not in full generality. 175 Sufficient persistence with the above methods will usually enable the user to prepare DO files. On Linux/Unix and Macintosh OSX systems, the execution of an MLAB command can be interrupted by typing ^C (CONTROL-C). Then the currently executing MLAB command is suspended and the message Do you really want to quit MLAB? [y:YES, *:NO]: is printed. If you type y, MLAB will terminate and leave you at the bash-shell prompt. If you type *, MLAB then prints the prompt: Resume calculation or return to top level? [t:TOP LEVEL, *:RESUME]: If you respond with *, MLAB will continue with the suspended operation. If you type t, then MLAB responds: Command in progress aborted; MLAB state indeterminate. Safest Action: type EXIT to return to DOS, then restart MLAB. Riskier but often worthwhile: Save your data objects (SAVE IN MYFILE) then EXIT, restart MLAB, and restore the objects (USE MYFILE). On MSWindows and DOS systems, the execution of an MLAB command can be interrupted by holding the SHIFT and CONTROL keys down and striking the Break key. Then the currently executing MLAB command is suspended and the message: Command in progress aborted. Safest Action: type EXIT, then restart MLAB. Riskier but often worthwhile: Save your data objects (SAVE IN MYFILE) then EXIT, restart MLAB, and restore the objects (USE MYFILE). is printed. On Macintosh OS7/8/9 and OSX systems, MLAB can be interrupted at any time by pressing the Apple key and the Option key, and simultaneously striking the ESC key. A dialog window then appears offering the option of terminating the MLAB session. On all systems, the MLAB FIT, INTEGRATE, MINIMIZE and POINTS operations can be interrupted and stopped by striking the letter “Q”; MLAB will then return to the command prompt. 176 5.8 THE MENUCHOICE, GETSTRINGS, and WREAD COMMANDS The MLAB functions MENUCHOICE, GETSTRINGS, and WREAD can be used to provide a graphical user interface to do-files on Linux/Unix with X-Windows, DOS, MSWindows, and Macintosh systems. The MLAB function MENUCHOICE creates a menu from which the user can select one of a number of options. GETSTRINGS creates a dialog window in which the user can fill-in a form; and WREAD can be used to store a 2-column matrix containing coordinates specified by mouse-clicks in an MLAB window. The function MENUCHOICE is described in Table 5.8. It takes 4 arguments, the last three are optional. MENUCHOICE(T,S,X,C) displays a menu in a dialog window, with a title and a list of text strings specifying a set of k choices to be made. For Linux with X-Windows, Macintosh, and MSWindows systems, a radio-button appears to the left of each text string and a CONTINUE button appears beneath the menu. Generally MENUCHOICE will be used within a DO-file. By use of the up- and down-arrow keys and the TAB key, the user may select one member of this list. On Linux/Unix with X-Windows, Macintosh, and MSWindows systems, the radio-button corresponding to the currently-selected string is filled in. On DOS, the currently-selected string is displayed in reverse-video. When the RETURN/ENTER key is pressed or the CONTINUE button is clicked, the dialog window is removed from the screen and an integer value is returned that is the sequence number in {1, 2, . . . , k} of the selected string. For DOS systems, the optional scalar or array C specifies the color choice as an integer for each of the elements of the menu in this order: the title text, the title box-border and the title background, the menu text,the menu box-border, and the menu background. If C is a 2-column matrix, column 1 contains the background color while column 2 contains the foreground color. If C is a 1-column matrix, it contains the background color and the text color defaults to white. Row 1 of the array C pertains to the title; row 2 pertains to the menu items; row 3 pertains to the title box, and row 4 pertains to the menu box. If rows 2-4 are omitted, the information from row 1 is used for all items. If rows 3 or 4 are omitted, the information from rows 1 and 2 is used respectively. If C is a scalar, it defines the background color, while all text and box-borders are white. If C is omitted, the menu text, title text, menu box-border, and title box-border all default to white, and the backgrounds all default to black. The following MLAB commands, demonstrate how MENUCHOICE might be used to display a menu of mathematical distributions and conditionally define the function F according to the user’s selection from the menu. T = "Select a distribution:" 177 S[1] = "Normal" S[2] = "Student’s t" S[3] = "Uniform" S[4] = "Triangular" S[5] = "Poisson" X = 3 M = MENUCHOICE(T,S,X) IF M = 1 THEN FCT F(X) = GAUSSF(X,1,0) ELSE IF \ M = 2 THEN FCT F(X) = STUTF(X,2,0) ELSE IF \ M = 3 THEN F(X) = UNIF(X,1,0) ELSE IF \ M = 4 THEN F(X) = TRIF(X,0,1) ELSE IF \ M = 5 THEN F(X) = POISSF(X,1) In Linux/Unix with X-Windows, Macintosh, and MSWindows systems, the menu would look something like this: Select a distribution: ◦ Normal ◦ Student’s t • Uniform ◦ Triangular ◦ Poisson Continue The MLAB operator GETSTRINGS provides a form-fill-in mechanism for obtaining user input that is also useful in do-files. The general form of the GETSTRINGS function is summarized in Table 5.9. GETSTRINGS takes 6 arguments; the last 4 are optional. GETSTRINGS(T,S,H,X,Y,L) displays a tabular form with a title specified by string argument T, a list of of prompt-fields specified by string array argument S, a list of initial strings for the form specified by the string array argument H, an initially active field specified by the integer scalar X, a string-field width specified by the integer scalar or vector Y, and form layout specified by the integer scalar L. GETSTRINGS returns a stringarray containing the contents of the editable-text fields of the form at the time the user strikes the RETURN/ENTER key or clicks the CONTONUE button with the mouse. The elements of the returned string-array can then be converted to scalar values, function definitions, matrices, titles, etc. Generally, GETSTRINGS will be used within a DO-file. The user selects each text-entry field to be edited using the up-arrow and down-arrow keys, the TAB key, or the mouse. The initial string appearing in a given text-entry field may be recovered by pressing the ESCape key. The user terminates the form fill-in process by pressing the ENTER/RETURN key. On Linux/Unix with X-Windows, Macintosh, and MSWindows systems, the form fill-in process may also be terminated by clicking the mouse button while the mouse is on the CONTINUE button. Upon quitting, 178 The general form of the MENUCHOICE function is: MENUCHOICE(T[,S[,X[,C]]]) where T is either a string or string array defining the title and/or instructions for the menu. the optional argument S is a string array defining the entries in the menu. X is an optional scalar defining the menu option that is selected when the menu is first displayed on the screen. If the user should strike the ESCape key at any time while the menu is displayed on the screen, the option specified by argument X will, again, be selected. If omitted, the first, top-most option is selected. If X is less than 1, no option is initially selected when the menu is displayed. C is an optional vector defining the colors used to draw the title, title background, menu options, and menu background. C is only supported on DOS systems. On Linux/Unix with X-Windows, Macintosh, and MSWindows systems, the menu text and selected radio-button are drawn in black on a white background, and a Continue button appears under the menu. If the argument T is provided as a string array, then each element of the string array T will appear as a line of text above the menu. MENUCHOICE() returns a scalar integer corresponding to the number of the menu option selected by the user when the Continue button was clicked or the RETURN/ENTER key was struck. If argument S is not provided, then only the text in argument T will appear in the menu window and the window will remain on-screen until the Continue button is clicked or RETURN/ENTER key is struck. In this case, MENUCHOICE returns the value 0. Table 5.8: General form of MENUCHOICE. the form is removed from the display and a string array containing the contents of the updated text entry fields is returned. For DOS systems, the optional argument C is a scalar or a 1- or 2-dimensional array that specifies 179 the color attributes for each of the components of the text-entry form in the following order: the title text, the prompt text, the text-entry field text, the title-box border and the prompt/entry field-box border. If C is omitted altogether, all background colors are black and all text and boxborder foreground colors are white. If C is a scalar, all background colors are the color defined by the value of that scalar. If C is a 1-column array, the background colors for each of the components are defined by the corresponding values of the array and the text and/or box-border foreground colors are white. If C is a 2-column array, the first column defines the background colors and the second column defines the text and box-border foreground colors. The optional argument L is a scalar that specifies the layout style of the tabular form. L determines the columnar layout of the prompts and entry fields. The width of the tabular form is determined by the overall maximum of the width of the title string and the maximum of the combined widths of the prompt and entry fields. We have the following options: • L = 1 (default) The prompt strings are all left-justified in the form. The widths of all the prompts are the same, and this width is the width of the entire form less the width of the text-entry fields. The widths of each text-entry field is determined by the associated text-entry width value as determined by the entry width argument processing. The start of the text-entry field immediately follows the prompt field on the line. The visual result is that the prompts are all in a rectangular column, and the text-entry fields are all left justified against the prompt column while the right edge of the entry area will be ragged if the entry fields have different widths or uniform if all entry fields have the same width, as in the case of a constant or scalar entry width argument. • L=2 The prompt strings are left-justified in the form. The length of each prompt field is determined by the length of the prompt string. If all prompt strings have the same length, the prompt area is rectangular, otherwise the right edge of the prompt area is ragged. The text-entry fields start immediately after the associated prompt fields, and the text-entry field widths are determined by the entry width argument, so in general both the left and right sides of the entry area are ragged. • L=3 The prompt strings are left-justified in the form. The width of each prompt field is determined by the length of the prompt string. If all prompt strings have the same length, the prompt area is rectangular, otherwise the right edge of the prompt area is ragged. The text-entry fields start immediately after the associated prompt fields, and the entry widths are extended to the right edge of the window, so that the right edge of the entry area is uniform. 180 • L=4 This layout is identical to the layout specified by L = 1 except that the prompt strings are right justified in the prompt area. The following MLAB commands demonstrate how GETSTRINGS might be used to display a form for obtaining map coordinates and set the variables LAT and LON to the values filled in the form. TTL = "Enter the coordinates of a point: " PR[1] = "Latitude (-90<South<0,0<North<90) " PR[2] = "Longitude (-180<West<0,0<East<180) " DF[1] = "39" DF[2] = "-74" STR1 = GETSTRINGS(TTL,PR,DF) STR = "LAT ="+STR1[1] DO STR STR = "LON ="+STR1[2] DO STR In the last four lines, after the GETSTRINGS command has been executed, the string STR is defined and then executed with a DO statement to convert the responses in string-array STR to scalar values and store the scalar values in the variables LAT and LON. On Linux/Unix with X-Windows, MSWindows, and Macintosh systems, the form would something like this: Enter a the coordinates of a point: Latitude (-90<South<0,0<North<90) Longitude (-180<West<0,0<East<180) Continue 39 < − -74 On DOS systems, the form would not have a CONTINUE button and the currently active text-field would be drawn in reverse-video. The MLAB operator WREAD(X,Y,Z) returns a 2-column matrix where rows of the matrix correspond to one or more pairs of coordinates in an MLAB graphics window that are specified with the mouse pointing device. The WREAD command is described in Table 5.10. Given a scalar X, an MLAB window name Y, and a scalar Z, the command: M = WREAD(X,Y,Z) 181 causes MLAB to show the window corresponding to window identifier specified by Y on the display screen as if a VIEW command were given, and wait for the user to specify X ordered pairs with the mouse pointing device using the method specified by integer argument Z. Once the required number of points have been stored, or earlier if the user strikes the ESCape key, the MLAB graphics window is removed from the screen and the 2-column matrix of specified points is returned. If Z is omitted or equal to 0, then an ordered pair is selected by positioning the mouse cursor at a desired point in the window Y and then pressing and releasing the mouse button. WREAD changes the pixel value at each selected point to the color WHITE. The world coordinates corresponding to the mouse position are then stored as a row of the output matrix, in this case matrix M. The user may terminate WREAD before X ordered pairs have been selected by striking the ESCape key on the keyboard. If Z is equal to 1, WREAD will dynamically display the world coordinates of the current mouse position at the bottom left corner of the image rectangle. Ordered pairs are then selected as for Z=0, by positioning the mouse cursor at a desired point in the window and then pressing and releasing the mouse button. If Z is equal to 2, WREAD starts to read and store world coordinates of the mouse cursor position when the mouse button is pressed, and continues to read and store world coordinates of the mouse cursor position as the mouse is dragged (i.e. the mouse is moved while the mouse button is down) across the window. In this mode, WREAD stops reading mouse coordinates when the mouse button is released or X coordinate pairs have been stored. If Z is 3, both of the features for Z equal 1 and 2 are enabled. If argument Y is omitted, the default 2D window, W, is displayed and points are specified in that window. If argument X is omitted, it defaults to a value of 10. The following MLAB commands demonstrate how the mouse can be employed to specify the location of a title: * * * * DRAW 1:5 M = WREAD(1,W,2) TITLE "LINE SEGMENT" AT (M[1,1],M[1,2]) WORLD IN W VIEW The first command establishes a curve in the default window W. The second command causes MLAB to display the default window and wait for the user to click the mouse button. The current mouse cursor coordinates will be displayed at the lower left corner of the image rectangle of the default window. Once the user clicks the mouse button, the picture is removed from the screen 182 and the mouse coordinates are returned in the matrix M. Then the title containing the text LINE SEGMENT is established at the world coordinates (M[1,1],M[1,2]) in the default window. The final VIEW command then displays the default window with the curve and title. 5.9 SUMMARY In the following, let file1, file2, ... , filen denote disk files; dev denote an input-device name; filename, and filename1, filename2, ... , filenamen denote user-selected disk filenames of one to eight characters; ext denote an optional filename extension of one to three characters; D1, D2, ... , Dn denote MLAB identifiers; SE1 and SE2 denote arbitrary scalar expressions; Wname denotes a window name; M denotes a matrix identifier; and ME1 denotes a column vector. 1. File Specification: • filename.ext 2. MLAB Input Matrix and String Expressions: • READ(filename,SE1,SE2) • READ("filename.ext",SE1,SE2), (.ext is optional) • READ("dev:",SE1,SE2) (m by n matrices, m ≤ SE1 and n =SE2 are read; if SE1 and SE2 are omitted, column vectors are read until CTRL-Z (^Z) or end-of-file is detected.) • READ(CON,SE1,SE2) (same as READ("CON:",SE1,SE2)) • READON("filename.ext",SE1,SE2) • KREAD(prompt,SE1,SE2) (string prompt is printed and (m by n) matrix is read row-by-row.) • KSREAD() (reads a string.) • MENUCHOICE(T[,S[,X[,C]]]) (displays the title string or string array, T, and menu options specified by string array S, with option number X initially selected, and waits for user to select an option; the number of the option selected by the user is returned as a scalar value.) • GETSTRINGS(T,S[,H[,X[,Y[,C[,L]]]]]) (displays the title string T, prompt string-array S, initial string-array fields H, specifier of which initial string-array is active X, field-width specifier Y, and waits for user to fill-in fields; returns a string-array containing the final string-array fields.) • WREAD([SE1[,Wname[,SE2]]]) (reads m=SE1 ordered pairs specified by mouse-clicks in window Wname, with n=SE2 specifying the mode; returns a 2-column, m-row matrix.) 183 3. MLAB Commands for Input and Output: • SAVE D1, D2, ... , Dn IN filename (saves or replaces data items D1, D2, ..., Dn in a disk file named filename.SAV) • SAVE IN filename (saves all currently defined data items in a disk file named filename.SAV) • SAVE D1, D2, ... , Dn (saves D1, D2, ..., Dn in disk files named D1.SAV, D2.SAV, ... , Dn.SAV) • USE filename1, filename2, ... , filenamen • DELETE D1, D2, ... , Dn (deletes MLAB data items D1, D2, ..., Dn) • DELETE M ROW ME1 (deletes matrix rows) • PRINT D1, D2, ... , Dn IN filename (similar to the TYPE command, but creates a character disk file named filename.LST) • PLOT (creates a .ps or .lj picture file) • DO filename (executes a .DO character file of MLAB commands on a disk file) • DO "filename.ext" (executes a character file of MLAB commands on the disk file filename.ext) • DO "CON:" (reads MLAB commands from console) • DO CON (same as DO "CON:") • TYPE "(text)" • IF SE1 THEN commandgroup1 ELSE commandgroup2 4. MLAB session record on computer disk file: MLAB.LOG 5.10 EXERCISES 1. Suppose that one wants to create an 80 row by 5 column MLAB matrix M with the first column representing days 1 to 80 of an experiment and the other columns representing measured quantities as follows: col 2 = ai , col 3 = bi , col 4 = ci , col 5 = di for days i = 1, 2, ..., 80. Describe MLAB commands for creating M for each of the following circumstances: (a) The numbers are written in a table in a laboratory notebook. 184 (b) A text file has been created which has the numbers: a1 , a2 , ..., a80 b1 , b2 , ..., b80 c1 , c2 , ..., c80 d1 , d2 , ..., d80 in successive lines of text. (c) A text file contains 80 lines of text, each line containing for i = 1, 2, ..., 80 the data: i (day number), ai , bi , ci , di in the given order. 2. Suppose the contents of a computer disk file have been forgotten. How can the contents of this file be determined in each of the following cases? Also, which of the files can be modified, and how can it be done in each case? (a) The file is EX1.DO, and is known to be an MLAB DO file. (b) The file is MAR.SAV, and is known to have been created by an MLAB SAVE command. (c) The file is T2.LST. (d) The file is mlabp0.ps. (e) The file is DATA5, and is known to be numeric data which was read into MLAB using a READ matrix expression. (f) The file is A.DAT, and nothing else is known about it. 3. Assume that M and N are large two-column matrices. A DRAW command is executed which creates a curve C with a curve matrix which is a copy of M. When another DRAW command is executed to create a curve D with a curve matrix which is a copy of N, the error message response is: ##Error: allocator failed: num: 1000001, size: 8 This means there is insufficient memory available in MLAB. What would be the quickest attempt to overcome this obstacle? 4. Suppose that X is a 400 row by 12 column matrix which is to be printed. Since it is too wide for the printer page, it is to be printed as two 400 row by 6 collumn matrices, the first matrix containing columns 1-6 and the second containing columns 7-12. Furthermore, the row numbers 1-400 are to be printed as a seventh column for each of the two matrices. Design a sequence of MLAB commands to achieve this. 185 5. Suppose that one wants to draw Figure 4.18 in two colors. The axes and labels are to be black, and the function graph and shading, red. How could one do this using MLAB? 6. Construct a DO file which operates on a matrix M to make separate graphs of the curves given by M COL (1,J) for J = 2, 3, ... , NCOLS(M). Each picture is to be plotted, and no picture is to appear on the graphical display. Modify the DO file so that it can also put all the curves in the same graph. 7. Construct DO files that normalize vectors, that is, compute Y ON V for a given vector V, where FCT Y(X) = A*X+B for suitable scalars A and B, in the following cases. (a) To compute VN = Y ON V, where each coordinate x of V corresponds to (x − m)/d in VN for m the mean (average) of the elements of V and d the unbiased standard deviation of elements of V. (b) To compute VB = Y ON V, where each coordinate of V is normalized in VB so that the smallest element of V corresponds to 0 in VB and the largest element of V corresponds to 100 in VB. (c) To compute VA = Y ON V, where coordinates of V are temperatures in Fahrenheit and the corresponding coordinates in VA are to be temperatures in centigrade. 8. Suppose a 1000 row by 2 column MLAB matrix D containing the results of 10 different experiments has been created, each result being a 100 by 2 matrix of (time, intensity) measurements. That is, the first experiment corresponds to D ROW 1:100; the second experiment to D ROW 101:200; and so on. (a) Design a DO file LOOK.DO such that the execution of E = 1 and of DO LOOK displays an intensity vs. time graph of the first experiment (curve matrix D ROW 1:100) in default window W on a graphical display; the second execution of DO LOOK displays the graph of the second experiment (D ROW 101:200); and so on for subsequent executions of DO LOOK. (b) Choose a method that overrides the consecutive sequence by modifying E, so that any experiment in a series can be displayed or skipped as desired. (c) Change this DO file to account for K experiments, each corresponding to an N row by 2 column matrix in a K*N row by 2 column matrix D. Because the variables K and N may be different during different runs of the experimental procedure, the user should be requested to assign values for K and N during execution of the DO file. 9. Create files representing the DO files designed in exercises 6, 7, and 8 above. Run MLAB and test your answers to the previous exercises wherever it is feasible. 186 The general form of the GETSTRINGS function is: GETSTRINGS(T,S[,H[,X[,Y[,C[,L]]]]]) where: T is a required string defining the title for the form; if no title is desired, set T = "". S is a required 1-dimensional string array containing descriptive text associated with each text-entry field. These are the prompts that will appear to the left of each editable text string in the form. These strings must be short enough so that the length of the prompt combined with the length of the text entry field is less than or equal to 78 characters. H is an optional string array containing the initial contents of the editable text string fields to be filled in the form; if omitted, the initial text string fields are empty. If H has fewer elements than the string-array argumentS, the initial values of the text entry fields with no corresponding H element default to empty strings. If H has more elements than S, then only the first NROWS(S) elements of H are used. X is an optional integer scalar specifying which of the text string fields to be filled-in is active (i.e. to where keyboard keys will be directed) when the form is first displayed. If X is omitted, the initial active text-entry field defaults to 1–the top-most field. Y is an optional scalar or 1-dimensional array that specifies the width (in characters) of the text-entry fields; if Y is omitted, all text-entry fields will be 10 characters wide; if Y is an integer scalar, all text-entry fields will be Y characters wide; if Y is a 1-dimensional array, the width of each text-entry field is determined by the value of the corresponding element of Y. In all cases, if an initial value for a text-entry field is defined by H and the width of the initial string is more than the width defined by Y, then the width will be expanded to accomodate the initial string defined in H. C is ignored on Linux/Unix with X-Windows, Macintosh, and MSWindows systems. All background colors are white and all foreground, text colors are black. For DOS systems, the optional argument C is a scalar or a 1- or 2-dimensional array that specifies the color attributes for each of the components of the text-entry form as described in the text. The optional argument L is a scalar equal to 1,2, 3, or 4 that specifies the layout style of the tabular form, as described in the text. 187 Table 5.9: General form of GETSTRINGS. The general form of the WREAD command is: WREAD([X[,Y[,Z]]] where: scalar integer X specifies the number of points to be read. If X is omitted, the default value of X is 10. optional window identifier Y specifies the MLAB window from which points are to be read. If Y is omitted, the default 2D window W is used. optional scalar integer Z specifies the mode for selecting points. If Z is omitted or equal 0, points are selected by positioning the mouse cursor at a desired point on the graph and pressing and releasing the mouse button. If Z=1, then the current mouse cursor coordinates are displayed at the lower left corner of the image rectangle, and points are selected as for Z=0. If Z=2, then points are selected by the mouse positions obtained while the mouse button is pressed and the mouse is dragged across the window. If Z=3, then the current mouse cursor coordinates are displayed as for Z=1 and recorded as for Z=2. The user can terminate WREAD before X points have been selected, by striking the ESCape key. WREAD returns a 2-column matrix of coordinates. Table 5.10: The WREAD command. 188 Chapter 6 FURTHER MATRIX OPERATORS Many operators have been given that enable an MLAB user to define functions, compute scalar and matrix quantities, and aid in displaying results graphically. This section will explain several other MLAB operators which, while they are matrix operators, are designed mainly for use in developing graphs and pictures. Also explained in this section are other matrix operations which have many diverse uses, including picture drawing. 6.1 MATRIX COMBINATION MLAB has two matrix operators, MESH and CROSS, which are designed to combine two matrices in ways that are difficult to do with just the matrix joining operators of Section 3.4. The MESH operator takes as input two matrices and returns a matrix containing successive rows of the two input matrices, taken alternately. The odd rows of the resulting matrix, rows 1, 3, 5, ..., will contain the rows of the first input matrix, and the even rows of the resulting matrix, rows 2, 4, 6, ..., will contain the rows of the second input matrix. The two input matrices will be cyclically extended, as necessary, so the resulting matrix will have 2m rows and n columns, where m is the greater of the numbers of rows in the two input matrices and n is the greater of the numbers of columns of the two input matrices. The following commands show two common uses of the MESH operator: * * * * * * M1 = POINTS(SIN,0:10:.25) M1 COL 2 = (M1 COL 2)+2 M2 = POINTS(COS,0:10:.25) DRAW M1 DRAW M2 DELETE M1 ROW 1:NROWS(M1):2 189 Figure 6.1: Shading a graph using MESH. * DELETE M2 ROW 1:NROWS(M2):2 * DRAW MESH(M1,M2), LINETYPE ALTERNATE * VIEW The result of these commands is shown in Figure 6.1. The MESH operator was used to combine the points on the two curves into one matrix containing the endpoints of the shading lines. LINETYPE ALTERNATE then draws this matrix as desired. The MESH operator can be used in many other ways to compute a matrix to be drawn with linetype ALTERNATE. For example, the following commands will draw the polar graph r(θ) = cos(7·θ), using the MESH operator to easily draw and label the polar coordinate axes. * * * * * RESET WINDOW -1.5 TO 1.5, -1.5 TO 1.5 IN W1 IMAGE .25 TO 2.25, .25 TO 2.25 INCHES IN W1 U = 0:150:30 DRAW MESH((COSD ON U) &’ (SIND ON U), \ 190 Figure 6.2: Graphing in polar coordinates. : : * * * (COSD ON U+180) &’ (SIND ON U+180)) IN W1, \ LINETYPE ALTERNATE, LABEL MESH(U,U+180) FUNCTION R(T) = COS(7*T) DRAW TPOLAR(R,0:PI:.05) IN W1, LINETYPE DASHED VIEW These commands draw the polar graph shown in Figure 6.2. The MESH operator is used to draw and label the coordinate axes. Drawing the curve is achieved using the standard polar transformations x = r · cos(θ), y = r · sin(θ). These transformations are applied automatically in the built-in function TPOLAR which is used instead of POINTS. The MESH operator can also be used to draw information in a certain way. Consider, for example, the CDF operator given in Section 3.6. While this operator returns a matrix of values corresponding 191 to the values of the empirical distribution function at a variety of points, distribution functions are commonly drawn as step functions, as in Figure 6.3. The following commands use the MESH and ROTATE operators to accomplish this: * * * * * * * * * * * RESET FUNCTION GROUP(X) = INT(X*30)/30 M = GROUP ON (RAN ON 0^^30) G = CDF(M) R = ROTATE(G COL 1, NROWS(G)-1) &’ (G COL 2) S = MESH(G,R) DEL S ROW NROWS(S) DRAW S H = CDF(M,0:1:.05) DRAW H, LINETYPE NONE, POINTTYPE VBAR VIEW The method used to draw the step function by these commands can be easily understood by considering that the bottom endpoint of each vertical line, which is every other point in the matrix, has the x-coordinate of the next point and the y-coordinate of the preceding point. These steps are all combined in the function STEPGRAPH. The CROSS operator also combines two matrices by column-concatenating the rows of the first matrix with the rows of the second in every possible combination. If the first and second input matrices are m1 by n1 and m2 by n2 matrices, respectively, then the resulting matrix will have m1 · m2 rows and n1 + n2 columns. The CROSS operator is often used to specify a grid of points on the plane, for example, * CROSS(-5:5,-5:5) specifies an 11 by 11 grid of points, with the origin at the center, spaced at unit intervals. This could be used to analyze a function of two variables, as will be discusssed in Section 6.4. It could also be used to list and manipulate values for a function of several variables, as will be done in Section 7.15. One of the most common uses of the CROSS operator is to generate a rectangular grid to use in generating contour plots, as shown in section 4, later in this chapter. Finally, the CROSS of two lists, each stored as a 1 column matrix, is the collection of all pairs with a member from each list, stored as a 2-column matrix. The general forms of the MESH and CROSS operators are presented in Table 6.1. 192 Figure 6.3: CDF step function graph. 193 The general forms of the MESH and CROSS matrix expressions are: MESH(ME1,ME2) CROSS(ME1,ME2) The MESH matrix operator will alternate the rows of ME1 and ME2. If ME1 is an m by n matrix and ME2 is an m′ by n′ matrix, the result is an m∗ by n∗ matrix, where m∗ is two times the larger of m and m′ and n∗ is the larger of n and n′ . ME1 and ME2 are expanded with zeros as necessary. The CROSS matrix operator will pair up and column-concatenate the rows of ME1 and ME2 in all possible combinations. If ME1 is an m by n matrix and ME2 is a m′ by n′ matrix, the result is an m∗ by n∗ matrix, where m∗ = m∗ · m′ and n∗ = n + n′ . Table 6.1: Matrix Combination Operators. 6.2 MODIFYING DATA FOR ANALYSIS AND DISPLAY Many problems may arise when trying to use experimental measurements for mathematical calculations and modeling. One problem is the irregularity of measurements, that is, data existing plentifully in some areas but not in others. Another problem often found is that noisy measurements have introduced spurious fluctuations which we wish to remove from the data. MLAB has two operators, INTERPOLATE and SMOOTH, which are designed to combat these respective problems. The INTERPOLATE operator will take a matrix of data points and return a matrix containing selected points on a smooth, cubic spline, curve passed through these points. This is shown in the following command sequence: * * * * * * * DELETE W FUNCTION F(X) = SIN(X)*LOG(X) M = POINTS(F,LIST(1,2,4,5,18,19)) DRAW M, LINETYPE NONE, POINTTYPE CROSSPT DRAW INTERPOLATE(M,0:20:.25) DRAW POINTS(F,0:20:.25), LINETYPE DASHED VIEW The result of these commands, shown in Figure 6.4, shows the data points as plus signs, the interpolated curve as a solid line, and the actual function curve as a dashed line. It can be plainly seen in this figure that the INTERPOLATE operator provides good estimates when approximating 194 Figure 6.4: Interpolating data. 195 values close to existing data points but may not behave as you wish when interpolating far from other points. The INTERPOLATE operator also applies to surfaces, as will be seen in Section 6.4. The SMOOTH operator is designed to eliminate oscillations from a curve matrix by modifying the last column based on the surrounding data. This can be done as preparation for curve fitting, which will be explained in Chapter 7, for other mathematical analysis, or for drawing or plotting. The effects of the SMOOTH operator can be seen visually by entering the following commands: * * * * * * * * * RESET FUNCTION F(X) = X*X-4*X+5 M = POINTS(F,1:10) DRAW M M(3,2) = M(3,2)+10 M(7,2) = M(7,2)-7 DRAW M, LINETYPE NONE, POINTTYPE CROSSPT DRAW SMOOTH(M), LINETYPE DASHED VIEW The resulting picture, shown in Figure 6.5, demonstrates the effect that SMOOTH has on noisy data. This can be useful whenever such “data noise” is likely and could have a disrupting effect on calculations. Combined use of the SMOOTH and INTERPOLATE operators can take data points, reduce “noise”, and deduce intermediate points that lie along a smooth curve of the data. This resulting matrix could be used as input for a curve-fitting process, explained later, or used for graphically displaying data. However, care should be used to ensure that spurious results are avoided. The BARGRAPH operator can also be used in preparing pictures. BARGRAPH will take a 2 column matrix of (x, y) coordinates sorted on column 1 as input and will return the points of a step function graph corresponding to the matrix. Unlike the step function graph in Figure 6.3, the BARGRAPH operator will place the actual data points at the center of the steps, not at the corners. Histograms are often presented in this form, as will be seen later. A step function graph is made using the following commands: * * * * * * RESET M = POINTS(COS,0:10:.5) DRAW M, LINE 2 DRAW BARGRAPH(M) WINDOW 0 TO 10, -1 TO 1 VIEW The result of these commands is shown in Figure 6.6. 196 Figure 6.5: Smoothing data. 197 Figure 6.6: Step function graph of a curve. 198 Figure 6.7: Histogram of random data. Suppose we have a matrix, X, containing measurements of a random event. We know that the values of X are between two values, P and Q, and we want to see an estimate of their density function over this range. Such a graph is called a histogram, and it gives the distribution of the values of X in B buckets ranging from P to Q. The following commands will graph the histogram of 100 random measurements ranging from zero to one into fifty equally-spaced buckets as a bar graph, using the HISTO operator. * * * * * * RESET P = 0; Q = 1; B = 50 X = RAN ON ((LIST(0,P,Q)’)^^100) DRAW BARGRAPH(HISTO(X,B)) WINDOW 0 TO 1, 0 TO 10 VIEW The bar graph of this histogram matrix is shown in Figure 6.7. It should be remembered that all of these operators use and return matrices which represent points 199 The general forms of the INTERPOLATE , SMOOTH, BARGRAPH, and HISTO matrix operators are: INTERPOLATE(ME1,ME2) SMOOTH (ME1) BARGRAPH(ME1) HISTO(ME1) The INTERPOLATE operator will return the points of a curve with values taken at ME2 interpolated from ME1. For values in ME2 for which points exist in ME1 the same values are maintained. NCOLS(ME2) must equal NCOLS(ME1)-1 for INTERPOLATE to work. The SMOOTH operator will take a matrix as input and return points of a smoothed curve with values taken at the same places as ME1 was. The endpoints of ME1 and SMOOTH(ME1) are always the same. The BARGRAPH operator will take a 2 column matrix of (x, y) coordinate pairs sorted in increasing order on column 1, and return a 2 column matrix of (x, y) coordinates corresponding to the step graph of the input matrix. The HISTO operator will return the points of the step function approximation of ME1, with the points of ME1 at the center of the steps. Table 6.2: INTERPOLATE, SMOOTH, BARGRAPH, and HISTO matrix operators. on curves and not curves, themselves, and can thus be combined with each other and with other matrix operators in order to achieve a desired result. The general forms of the SMOOTH, BARGRAPH, and HISTO matrix operators are shown in Table 6.2. 6.3 SHADING AREAS OF A POLYGON CURVE In Figure 6.1 we saw how to use the MESH operator to shade the area between two curves. This method can usually only be used to draw vertical lines. In general, the MLAB FILL operator may be used to fill in a polygon with fill lines. It takes as input a matrix of points, the number of fill lines to generate, and the angle at which to draw the fill lines. The result is a matrix containing the endpoints of the fill lines, which can then be drawn using linetype ALTERNATE. The following commands show this: 200 Figure 6.8: Shading in a circle. * * * * * RESET M = (COSD ON 0:360) &’ (SIND ON 0:360) DRAW M DRAW FILL(M,20,45), LINETYPE ALTERNATE WINDOW ADJUST WMATCH The result of these commands is shown in Figure 6.8. The matrix M contains the points of a circle of radius one, and this circle is shaded with 20 fill lines at an angle of 45 degrees. The FILL operator can also use marker skipping similar to that of linetype MARKER in the DRAW command. (See Section 4.3 for a description of linetype MARKER.) To use this feature, element (1, 1) of the input matrix must specify a marker value of MAXPOS (≈ 1.7 × 10308 ). This marker value can then be placed in column-1 of any row of the matrix to signal the end of one polygon and the start of another. If polygons are contained inside one another or are overlapping, then the symmetric difference of the two is used, as is shown in the following dialog: * RESET 201 Figure 6.9: Shading several polygons. * M2 COL 1 = KREAD(24) -1 1 5 5 1 1 -1 2 3 3 2 2 -1 4 6 6 4 4 -1 7 8 8 7 7 * M2 COL 2 = READ(24) 0 2 2 6 6 2 0 3 3 5 5 3 0 1 1 4 4 1 0 2 2 6 6 2 * FUNCTION F(X) = IF X < 0 THEN MAXPOS ELSE X * M2 = MAPPLY(F,M2) * DRAW M2, LINETYPE MARKER * DRAW FILL(M2,50,135), LINETYPE ALTERNATE * WINDOW 0 TO 9, 0 TO 7 * VIEW Note how the MAPPLY operator is used to change all elements of the matrix M that are less than 0 to MAXPOS. The result of this dialog is shown in Figure 6.9. Note that the fill-line matrix was still drawn with linetype ALTERNATE while the figure had to be drawn with linetype MARKER to take the marker skipping into account. The FILL operator takes the value MAXPOS in element (1, 1) to indicate marker skipping. Notice also that the FILL operator assumes that you are drawing closed polygons, and will add a final additional side to close each polygon if necessary. 202 With close scrutiny the reader will notice that the angle of the fill lines in Figure 6.9 are not exactly 135 degrees. This is because the FILL operator, when calculating the fill-line endpoints, does not know in what window the fill-lines will be drawn and thus does not know the relation between the image and user window coordinates. The angle at which the fill lines are drawn is perfect only when the user window is a square or is in proportion with a user-specified image window. Use the command * WINDOW ADJUST WMATCH to scale the window axes so that a unit of length in the x-direction equals a unit of length in the y-direction. A crosshatching or grid effect can be accomplished using fill lines at right angles to each other. Note that the angle adjustments described in the preceding paragraph are necessary to have this done properly. The general form of the FILL operator is shown in Table 6.3. The general form of the FILL matrix operator is given by: FILL(ME1,SE1,SE2) where ME1 is a matrix containing the polygons to be shaded, SE1 is the number of fill lines to be generated, and SE2 is the angle, in degrees, of the fill lines. The matrix returned contains pairs of fill-line endpoints and should be drawn using linetype ALTERNATE. If ME1(1,1) = MAXPOS then ME1(1,1) will be used as a marker value and thus several figures can be contained in ME1 and shaded simultaneously. If two or more figures overlap then the symmetric difference is taken for shading purposes. SE1 and SE2 have default values of 10 and 0, respectively. Table 6.3: FILL matrix operator. 6.4 SURFACE CONTOURS It is often the case that data will be collected over a range of values of an independent variable. We have seen many MLAB operators designed to manipulate and display such information. However, it is sometimes the case that there are two independent variables, that is, the data would have 203 to be displayed in three dimensions. While MLAB does include facilities for true 3-dimensional graphics, it is often easier to analyze a 2-dimensional representation of your data in the form of a contour map. A contour map assumes that you have no more than one data value for each (x, y) pair, and draws a surface using variably-dashed lines indicating different levels. The MLAB CONTOUR operator is used to develop such a contour map. The CONTOUR operator takes as input two matrices. The first must be a 3-column matrix of data values whose first two columns specify a rectangular grid of points on the (x, y) plane and whose third column contains z-coordinate data values. The second matrix must be a column vector of z-coordinate values whose levels are to be included in the contour map. The result of this operator is a 2-column matrix whose rows appear in groups headed by marker rows. Each marker row contains MAXPOS in the first column and a value V between zero and one in the second column. The following rows in the group are points on the contour level line corresponding to the particular group. Each value V is determined as (l − lmin )/lmax , where l is the level value of the curve, lmin is the minimum level value, and lmax is the maximum level value. to the height of the level of the particular group. This matrix format corresponds to that of linetype MARKER, VMARKER, SMARKER, or SVMARKER which are explained below. The following MLAB commands will draw a contour map of the function f (x, y) = x · y 2 · cos(x − y) shown in Figure 6.10: * * * * * * * RESET FUNCTION F(X,Y) = X*Y*Y*COS(X-Y) M = POINTS(F,CROSS(-3:3,-3:3)) C = CONTOUR(M,-27:27) DRAW C, LINETYPE VMARKER WINDOW ADJUST WMATCH VIEW Often, however, the data we want to analyze are not taken over a grid of (x, y) values but are scattered randomly in space. In this case it is necessary to use the INTERPOLATE operator to interpolate values over a grid of values, and it is often beneficial to SMOOTH the data beforehand. This technique is shown in the following command sequence: * * : * RESET DA COL 1 = LIST(-2,-2,-1.5,-1.5,-1,-1,-.5,-.5,0,0,.5,.5,1,1,1.5,\ 1.5,2,2) DA COL 2 = LIST(-2,2,1,1.5,-1.5,2,-1.5,-1,0,2,-2,1.5,-2,-1.5,-1.5,\ 204 Figure 6.10: A contour map of f (x, y). 205 Figure 6.11: A contour map of interpolated data. : * : * * * * * -1,-2,-1) DA COL 3 = LIST(-7.04,-8.6,-2.1,-2.5,-1.3,-3.55,-.13,.48,1,1,3,.5,5,\ 3.22,4.3,2.35,8.96,2.74) DAI = INTERPOLATE(DA,CROSS(-2:2:.5,-2:2:.5)) DRAW C1 = CONTOUR(DAI,-9:9:.5), LINETYPE VMARKER DRAW C2 = DA COL (1:2), LINETYPE NONE, POINTTYPE CROSSPT WINDOW ADJUST WMATCH VIEW * * * * * * * DELETE W DAS = SMOOTH(DA) DAI = INTERPOLATE(DAS,CROSS(-2:2:.5,-2:2:.5)) DRAW C1 = CONTOUR(DAI,-9:9:.5), LINETYPE VMARKER DRAW C2 = DA COL (1:2), LINETYPE NONE, POINTTYPE CROSSPT WINDOW ADJUST WMATCH VIEW 206 Figure 6.12: A contour map of interpolated, smoothed data. 207 The resulting contour maps are shown in Figure 6.11 and Figure 6.12. Note the regularity gained by smoothing the data in the second example. Notice also that the interpolation yielded much greater detail in the areas near which the original data points were located. You can see this more easily by entering the command: * DRAW C2, COLOR 2 after drawing Figure 6.11. The contours in the contour map shown in Figure 6.11 can also be smoothed by using the SVMARKER line-type. The SVMARKER line-type draws variable dashed lines with marker skipping using spline curves. The flatness of the spline curves is controlled by the value of the scalar FLATNESS; the default value of FLATNESS is 1. In the limit, as FLATNESS goes to 0, the spline curve becomes piecewise straight between the actual points of the contour. * * * * * DELETE W DRAW C1 = CONTOUR(DAI,-9:9:.5), LINETYPE SVMARKER DRAW C2 = DA COL (1:2), LINETYPE NONE, POINTTYPE CROSSPT WINDOW ADJUST WMATCH VIEW Figure 6.13 shows the result. The CONTOUR operator is described in Table 6.4. The general form of the CONTOUR matrix operator is: CONTOUR(ME1,ME2) where ME1 is a 3-column matrix of 3-dimensional data values taken over a rectangular grid of (x, y) coordinates and ME2 is a columnvector of z-coordinate levels to be shown on the resulting contour map. The result is a matrix of points which will generate the desired contour map when drawn using linetype VMARKER. Table 6.4: CONTOUR matrix operator. 6.5 EIGENVALUES, EIGENVECTORS, AND COMPLEX NUMBERS The EIGEN operator, described in Table 6.5, will compute the eigenvalues λ1 , λ2 , ..., λn , and eigenvectors v1 , v2 , ..., vn , of an n by n matrix A. EIGEN(A) is a (2 · n + 2) row by n column matrix 208 Figure 6.13: A contour map of interpolated data with spline curve contours. 209 whose first two rows have as columns the real and imaginary parts of the n eigenvalues of A, and whose (2 · k + 1)st and (2 · k + 2)nd rows are the real and imaginary parts of the k th eigenvector of A. The k th eigenvector vk corresponds to the k th eigenvalue λk . The relation Avk = λk vk holds for k = 1, 2, ..., n. Eigenvalue-eigenvector analysis is useful in the study of stability of differential equation systems. Given a differential equation system in canonical form dy1 = F1 (y1 , y2 , ..., yn ) dt dy2 = F2 (y1 , y2 , ..., yn ) dt .. .. . . dyn = Fn (y1 , y2 , ..., yn ) dt dy 0 which has an equilibrium solution (y10 , y20 , ..., yn0 ), whereat dti = 0, the stability of that equilibrium is determined by the signs of the real parts of the eigenvalues of the Jacobian matrix ∂F1 ∂y1 ∂F2 ∂y1 ∂F1 ∂y2 ∂F2 ∂y2 ∂Fn ∂y1 ∂Fn ∂y2 .. . .. . ... ... .. . ... ∂F1 ∂yn ∂F2 ∂yn .. . ∂Fn ∂yn where each of the indicated partial derivatives is evaluated at the point of equilibrium (y10 , y20 , ..., yn0 ). Furthermore, if an equilibrium is just barely unstable by this criterion, e.g. there is only a single eigenvalue with positive real part, then the direction of the trajectory of the dynamical system in the vicinity of the equilibrium is parallel to the eigenvector of the eigenvalue with positive real part, passing through the initial point close to (y10 , y20 , ..., yn0 ). Finally, if there is a single pair of complex eigenvalues with positive real part, then the trajectory will lie in the plane formed by the corresponding eigenvectors, and will be a spiral whose rate of rotation is proportional to the imaginary part of the eigenvalue pair and whose rate of departure from the vicinity of the equilibrium is proportional to the real part of the eigenvalue pair. As an example, consider the van der Pol oscillator, which obeys the differential equations: dy1 dt dy2 dt = y2 = −y1 + µ · (1 − y12 ) · y2 210 which has an equilibrium at (0, 0). The Jacobian matrix of this system, evaluated at the equilibrium is: 0 1 −1 µ The following MLAB dialog shows the evaluation of the eigenvalues and eigenvectors of this Jacobian matrix for µ = 1. * J = LIST(0,-1) &’ LIST(1,1) * M = EIGEN(J) * TYPE M M: a 1: 2: 3: 4: 5: 6: 6 by 2 matrix 0.5 .866025404 .353553391 -.612372436 .353553391 .612372436 0.5 -.866025404 .707106781 0 .707106781 0 Since the eigenvalues are complex, with positive real part, we conclude that the equilibrium (0, 0) is unstable, and that trajectories starting close to (0, 0) will depart from it along a spiral. Figure 6.14 shows a solution to the van der Pol equation starting from near the equilibrium, for µ = 1 generated from the following MLAB commands: * * * * * * * * * * * RESET FCT Y1’T(T) = Y2 FCT Y2’T(T) = -Y1+MU*(1-Y1^2)*Y2 INITIAL Y1(0) = 0 INITIAL Y2(0) = .01 MU = 1 M = INTEGRATE(Y1’T,Y2’T,0:10!101) DRAW M COL (2,4) N = M ROW 1:101:20 DRAW N COL (2,4) LT NONE PT XPT LABEL 0:10:2 VIEW Complex numbers may be manipulated in MLAB using the +, -, CPROD, CDIV, and CPOW operators. The standard + and - matrix operators will work with complex numbers because corresponding 211 Figure 6.14: A solution to the van der Pol equation. 212 The general form of the EIGEN matrix operator is given by: EIGEN(ME1) Let ME1 be an n by n real matrix. The result is an (2n + 2) by n matrix. The first two rows contain the real parts and imaginary parts, respectively, of the eigenvalues of ME1. The remaining 2n rows contain the real and imaginary parts of the eigenvectors of the corresponding eigenvalues. Table 6.5: EIGEN matrix operator. matrix elements will correctly match up. Complex number multiplication, division, and exponentiation are achieved with the CPROD, CDIV, and CPOW operators, which are defined in Table 6.6. These operators each take two 2-column matrices, A and B; for each matrix, the first column represents the real part and the second column represents the imaginary part of a list of complex numbers.CPROD(A,B) is a matrix with two columns where each row is the product of the complex numbers in the corresponding row of A and B. If A and B do not have the same number of rows, the matrix with the fewer number of rows is cyclically extended. Similarly, CDIV(A,B) and CPOW(A,B) return 2 column matrices that are the complex quotients and powers of the complex numbers in rows of matrices A and B. These functions are useful in dealing with the discrete Fourier transform operators and will be discussed there in that context, or with the EIGEN operator discussed above. 6.6 SINGULAR VALUE DECOMPOSITION OF A MATRIX An a by b matrix, M, can be written as a product of matrices U, P, and V’, UPV’ = M, where U is an a by b matrix such that UU’ = I, V is a b by b matrix such that VV’ = I, and P is a b by b real diagonal matrix whose diagonal elements σ1 ≥ σ2 ≥ . . . ≥ σn ≥ 0 are called the singular values of M. The number of non-zero singular values is the rank of M, but since round-off may produce small non-zero values in place of zero, caution is required. The MLAB SVD operator, described in Table 6.7, will compute U, V, and the diagonal elements of P, from M. The matrix returned is equal to (GETDIAG(P)’) & U & V. The SVD procedure is also employed in computing the Moore-Penrose generalized inverse of a matrix, used for matrix inverses in MLAB. Singular value decomposition has an important application in analyzing data derived from experiments in which a number of processes are occurring simultaneously and for which the measured data are linear combinations of some property of each process. This set of conditions is not especially peculiar; it applies, for example, to optical spectra. (An optical spectrum is a measured functional relation between the color, i.e. wavelength, of light shining upon a transparent sample 213 The general forms of the CPROD, CDIV, and CPOW operators are: CPROD(ME1,ME2) CDIV(ME1,ME2) CPOW(ME1,ME2) ME1 and ME2 are 2 column matrices whose first columns contain the real parts and second columns contain imaginary parts of a list of complex numbers. If ME1 and ME2 do not have the same number of rows, the shorter of the matrices is cyclically extended column-wise. The result of CPROD is a 2-column matrix containing the real and imaginary parts of the complex product of corresponding rows of ME1 and ME2. The result of CDIV is a 2-column matrix containing the real and imaginary parts of the complex quotient of corresponding rows of ME1 and ME2. The result of CPOW is a 2-column matrix containing the real and imaginary parts of the power. Table 6.6: Complex number operators. and the degree to which the light is attenuated in passing through the sample.) One source of such spectra is the titration of a mixture of acids and bases monitored by changes in the optical spectrum of the mixture. (A titration is a common chemical analysis procedure in which a specimen is subjected to the sequential addition of equal amounts of some chemical, in this case hydrogen ion. Following each addition, a measurement is made of some property of the specimen.) The data takes the form of a matrix whose columns are the measured spectra at some hydrogen ion concentration and whose rows are the absorbance at successive points through the titration at fixed wavelength. Applying the SVD operator to this matrix, we obtain the matrices U,P, and V. Examination of the magnitude of the successive singular values, combined with tests of randomness in the columns of U and V, provides sufficient evidence to estimate the number of titrating species with some confidence. Only the largest singular values associated with non-random columns of U and V as measured by autocorrelation are associated with identifiable titrating species. Using the nonrandom columns of V, the data may be fit to a sum of Henderson-Hasselbach titration functions by least squares methods, using the squares of the singular values as weighting factors. (The Henderson-Hasselbach function is a physically motivated mathematical model for the optical trace arising from the titration of a single acid or base.) See the chapter Analysis of Absorption Spectra214 Titration Data in the MLAB Applications Manual. The general form of the SVD matrix operator is: SVD(ME1) If ME1 is an m by n matrix, A, with m ≥ n, then SVD(ME1) is an (m + n + 1) by n matrix H, such that P = DIAG(H ROW 1), U = H ROW 2:(m+1), and V = H ROW (m+2):(m+n+2), where UU’ = I, VV’ = I, and UPV’ = M. If M is symmetric, that is M = M’, the singular values of M are the absolute values of the eigenvalues of M, and the columns of V are the eigenvectors. In any case, the product of the singular values is the absolute value of the determinant of M. If ME1 is an m by n matrix with m < n, SVD(ME1’) is computed. Table 6.7: SVD matrix operator. 6.7 COVARIANCE AND CORRELATION MLAB contains two operators for computing the covariance and correlation matrices of a set of n-tuple observations. Given an n-column matrix of data, D, whose rows are n-tuple observations, COV(D) is the sample covariance matrix of this data, and CORR(D) is the sample correlation matrix. The CORR and COV operators are described in Table 6.8. In particular, if the rows of D are samples of the vector of random variables (x1 , x2 , ..., xn ), then the (i, j)th element of COV(D) is the unbiased estimate of the covariance between xi and xj , and the (i, j)th element of CORR(D) is the unbiased estimate of the correlation between xi and xj . If D is a 1-column matrix, then COV(D)[1,1] is the sample variance of the numbers in D. For example, given the data matrix, D, as listed below, the associated covariance and correlation matrices are listed. * TYPE D D: a 8 by 2 matrix 1: -0.8188943 2: 0.9785145 3: -0.2872429 1.595087 -0.5698285 -0.347616 215 4: 5: 6: 7: 8: 0.1407133 1.610475 -2.233432 0.9479984 1.367598 1.090237 -0.70895 -0.478001 -0.5481901 -1.999153 * TYPE COV(D) : a 2 by 2 matrix 1: 1.67393876 2: -.645592141 -.645592141 1.24619036 * TYPE CORR(D) : a 2 by 2 matrix 1: 1 2: -.446988405 -.446988405 1 We can compute these values directly for comparison purposes, as follows: * * * : * * * * * * * FUNCTION MN(X) = SUM(I,1,NROWS(X),X(I))/NROWS(X) FUNCTION COVAR(X,Y) = CVI(X,Y,MN(X),MN(Y)) FUNCTION CVI(X,Y,XM,YM) = SUM(I,1,NROWS(X),(X(I)-XM)*(Y(I)-YM))\ /(NROWS(Y)-1) FUNCTION SD(X) = SQRT(COVAR(X,X)) FUNCTION COR(X,Y) = COVAR(X,Y)/(SD(X)*SD(Y)) H(1,1) = COVAR(D COL 1,D COL 1) H(2,2) = COVAR(D COL 2,D COL 2) H(1,2) = COVAR(D COL 1,D COL 2) H(2,1) = H(1,2) TYPE H H: a 2 by 2 matrix 1: 1.67393876 2: -.645592141 * * * * * H(1,1) H(2,2) H(1,2) H(2,1) TYPE H H: a = = = = -.645592141 1.24619036 COR(D COL 1,D COL 1) COR(D COL 2,D COL 2) COR(D COL 1,D COL 2) H(1,2) 2 by 2 matrix 1: 1 2: -.446988405 -.446988405 1 216 The convenience of having COV and CORR predefined is clear from the complexity of defining these functions. The general forms of the COV and CORR matrix operators are: COV(ME1) CORR(ME1) If ME1 is a matrix of n-tuple observations, COV(ME1) is the sample covariance matrix of this data and CORR(ME1) is the sample correlation matrix. Table 6.8: Covariance and correlation matrix operators. 6.8 DISCRETE FOURIER TRANSFORMS The Fourier series of a real-valued periodic function x(t) of period p is a sum of oscillations which reconstitutes the function x: x(t) = ∞ X h=0 M (h/p) · cos((2π · h/p) · t + φ(h/p)) where M (s) is the amplitude function of x and φ(s) is the phase function of x. Both M and φ are real-valued functions which are defined to be 0 except possibly at the points 0,1/p,2/p,.... Note these points are the frequencies in cycles per t-unit, of the cosine oscillations which sum to x. It is of interest to compute the functions M and φ from x. In particular M shows the relative strengths of the various members of the set of oscillations which sum to form x. The function M 2 (s) is called the power spectrum of x. When x is given numerically by means of n equally-spaced samples of x over one period, we usually assume x is sampled often enough so that x is smooth between samples, and M (s) is 0 for s > (n/2)/p. We are given the matrix of input: X= t0 t0 + T t0 + 2 · T .. . x(t0 ) x(t0 + T ) x(t0 + 2 · T ) .. . t0 + (n − 1) · T x(t0 + (n − 1) · T ) 217 where T = p/n, and we wish to compute the values M (0), M (1/p), ..., M ((n/2)/p), and φ(0), φ(1/p), ..., φ((n/2)/p). These two sequences of values are called the real discrete Fourier transform of the samples of x. The MLAB operator, REALDFT, can be used to compute the real discrete Fourier transform of x. If X is a matrix with n rows and n is a power of 2, REALDFT(X) uses a fast, discrete Fourier transform algorithm and returns a matrix with 3 columns and (n/2) + 1 rows. The j th row is [(j − 1)/p, M ((j − 1)/p), φ((j − 1)/p)], containing the frequency, amplitude, and phase-shift values for the (j + 1)st cosine term in the Fourier series of x. If n, the number of rows in the input matrix, is not a power of 2, REALDFT(X) first performs a linear interpolation of matrix X at the values X(1,1):X(n,1)!nn, where nn is the greatest power of 2 less than n. REALDFT(X) then computes the real discrete Fourier transform of the interpolated function values and returns a matrix with 3 columns and (nn/2) + 1 rows. Note that if n is not a power of 2, some information may be lost in the process of resampling x. For example, given the samples of average monthly relative sunspot numbers from 1900 to 1985 (available from Appendix 1 of S. Lawrence Marple, Jr.’s Digital Spectral Analysis with Applications Englewood Cliffs, New Jersey: Prentice-Hall, Inc., 1987, pp.474-475) in a file called SLM.DAT, the following MLAB dialog draws the data and the amplitude of its Fourier transform versus period so that one can see that the primary sunspot cycle is about 10 or 11 years for that interval. * * * * RESET M = READ("SLM.DAT",1020,2) M = SORT(M,1) TYPE M ROW 1:5 : a 1: 2: 3: 4: 5: 5 by 2 matrix 1900 1900.08333 1900.16667 1900.25 1900.33333 9.4 13.6 8.6 16 15.2 * P = REALDFT(M) * NROWS(P) = 257 * TYPE P ROW 1:5 : a 5 by 3 matrix 1: 0 2: 1.17651765E-2 59.252449 23.0381617 0 -.369664928 218 Figure 6.15: Average monthly sunspot number (top) and its Fourier transform amplitude (bottom). 3: .023530353 4: 3.52955295E-2 5: .047060706 * * * * * * * * 2.52949674 10.9995289 11.8243895 1.05383481 .495864914 -1.31285923 DELETE P ROW 1 P COL 1 = 1/(P COL 1) DRAW M W1 = W FRAME 0 TO 1, .5 TO 1 IN W1 DRAW P COL 1:2 FRAME 0 TO 1, 0 TO .5 IN W VIEW W,W1 Figure 6.15 shows the result. Notice that the data consists of 1020 (t, x(t)) pairs, and 1020 is not a power of 2. Therefore the matrix returned by REALDFT has 257 rows, where 257 is 1 + 2⌊log2 1020⌋−1 . To convert the frequencies in column 1 of the matrix returned by REALDFT to periods, elements of that column 219 were replaced by their reciprocals. However, to avoid a zero-divide, the first row of the REALDFT result was deleted. The amplitude for that 0-frequency component represents the average value about which the function oscillates, i.e. its offset, and has a value of 59.2. The REALDFT operator also applies to samples of periodic functions of two arguments. When deconvolution or transfer function calculation is the motive for using the Fourier transform, the complex-valued form is desirable. The complex-valued discrete Fourier transform and its inverse are produced by the MLAB function DFT and IDFT, respectively. DFT operates upon a matrix M which specifies n = NROWS(M) equally-spaced sample values of a complex-valued function, f . The result is a 3-column matrix which is the complex-valued Fourier transform. Convolution is an operation on a pair of functions, f and g, which yields a third function, r, defined by: r(x) = Z ∞ −∞ f (z)g(x − z)dz When f and g are defined only on the positive integers, we have the discrete convolution: r(i) = ∞ X j=1 f (j) · g(i − j + 1) for i ≥ 1 In this case we may think of convolution as a matrix multiplication of the form: r =G·f where r and f denote the vectors (r(1), r(2), ...)′ , and (f (1), f (2), ...)′ , and g(1) g(2) G = g(3) .. . 0 g(1) g(2) .. . 0 0 g(1) .. . ... ... ... .. . 0 0 0 .. . is a lower triangular matrix. In both cases, we write r = f ∗ g, using “∗” to denote convolution. Convolution arises in various situations. One common application is in processes described by probability distributions. If X and Y are random variables with density functions f and g, respectively, then the random variable X + Y has the density function r = f ∗ g. This rather abstract situation has numerous concrete realizations. For example, suppose that the random 220 variable Y is the background level of some substance in a population, while the random variable X is the added amount of the same substance as a result of some treatment. When the substance is measured in the population, the detected level will be a random variable Z = X + Y , with density function r. If the background density function, g, is known, the treatment density function, f , can be found by deconvolution, i.e. solving the above matrix equation, to yield: f = G−1 · r Since G is triangular, the solution is easier than in the general case. f (i) = (r(i) − i−1 X j=1 f (j) · g(i − j + 1))/g(1), for 1 ≤ i ≤ n This operation can be done directly in MLAB using the DECONV operator, but it may be done more efficiently by taking advantage of the discrete Fourier transform operators. If the MLAB vectors, R and G are the distributions r(i) and g(i) above, then the commands: * RT = DFT(R); GT = DFT(G) * F = IDFT(RT COL 1 &’ CDIV(RT COL 2:3,GT COL 2:3)) compute the desired distribution f (i). The DFT, IDFT, and REALDFT operators are described in Table 6.9. 6.9 SUMMARY In the following let SE1, SE2, ... denote arbitrary scalar expressions and ME1, ME2, ... denote arbitrary matrix expressions. 1. Matrix combination operators are: (a) MESH(ME1,ME2) (b) CROSS(ME1,ME2) 2. Matrix interpolation is done by: (a) INTERPOLATE(ME1,ME2) 221 The general forms of the discrete Fourier transform operators are: DFT(ME1) IDFT(ME1) REALDFT(ME1) DFT(ME1) takes the rows of ME1 to specify n =NROWS(ME1) equallyspaced sample values of a complex-valued function, F. The first column of ME1 is taken as the real parts of values of F and the (optional) second column is taken as the imaginary part of values of F. The Fourier transform of the periodic extension of F as specified by ME1 is returned. DFT(ME1) has three columns: the first is the frequency values and the second and third are the associated complex coefficients. If DFT(ME1) = Q, then f (t) = bh=1 (Qh,2 + iQh,3 ) exp(2πiQh,1 t) where b = 2⌊log2 n⌋ for n =NROWS(ME1). A power-of-2 fast Fourier transform algorithm is used. If n is not a power of 2 then interpolation is used and thus the equalities listed here are only approximate. P IDFT(ME1) takes a matrix identical to that of DFT but returns the inverse discrete Fourier transform, so IDFT(DFT(ME1) = ME1. REALDFT(ME1) takes a matrix holding values of a real-valued function F and computes the amplitude and phase spectrum of F, according to the formula given at the beginning of this section. Table 6.9: Discrete Fourier transform operators. 3. Matrix smoothing is: (a) SMOOTH(ME1) 4. A step function of a matrix is: (a) HISTO(ME1) 5. The fill lines to shade a matrix are: (a) FILL(ME1,SE1,SE2) 6. A contour map of a surface matrix is: (a) CONTOUR(ME1,ME2) 7. Eigenvalues and eigenvectors operator: 222 (a) EIGEN(ME1) 8. Complex number arithmetic is: (a) CPROD(ME1,ME2) (b) CDIV(ME1,ME2) (c) CPOW(ME1,ME2) 9. Singular value decomposition of a matrix is: (a) SVD(ME1) 10. Discrete Fourier transforms are: (a) DFT(ME1) (b) IDFT(ME1) (c) REALDFT(ME1) 6.10 EXERCISES 1. How well can interpolation and smoothing imitate curve fitting? Find the answer to this question by drawing the data from Section 1.1 along with a smoothed, interpolated curve. Try this twice, the first time by interpolating and then smoothing, and the second time by smoothing and then interpolating. 2. Integral calculus teaches the concept of an integral by approximating the area under a curve using Riemann sums. How close does a step-function drawn with the HISTO operator approximate integration? Using a sine wave ranging from 0 to π, calculate the area under this curve with the INTEGRAL operator and approximate it using the HISTO operator along with either a FOR loop or a SUM expression function. 3. Draw a circle of radius 1.5, centered at the origin, with a letter ”A” at the point (1, 0). Shade this with the FILL operator, as shown in Figure 6.16, leaving space around the letter. 4. Given the function defined by f (x, y) = x · cos(x2 + y 2 ) suppose that you wanted to find the roots of this function for x between -1 and 1 and y between 0 and 5. How would you use the contour operator to do this? (Hint: draw a contour map with only one level.) Are you getting an exact answer? 223 Figure 6.16: Shading around text. 224 Chapter 7 CURVE-FITTING IN MLAB There are several motives for fitting curves to data. The investigator may want to: 1. compare data with the values predicted by an appropriate mathematical model; 2. test a mathematical model relating variables (for example, a growth curve that has been proposed from previous research or a growth curve that has been derived from mathematical analysis of a mechanism by which the variables are connected); or 3. estimate parameters of a model that have physical meaning (for example, the dissociation rate constants for enzymatic reactions). The formulas describing the mathematical model will often contain parameters having uncertain values. The curve-fitting facility of MLAB can be used to search for parameter values that may improve upon user-supplied initial estimates. That is, the curve-fitting command invokes systematic search methods to seek new parameter values that give better agreement between the data and the values predicted by the ”least-squares” criterion discussed below. In Chapter 1 the mathematical model was an exponential relationship between the age X and the dry weight Y of chick embyos. This was expressed by the exponential function defined by the MLAB command: * FUNCTION Y(X) = A*EXP(B*X) with two parameters, A and B. The curve-fitting operation: * FIT (A,B), Y TO DAY 225 changed the parameters A and B systematically until the exponential model was in close agreement with the experimental data of the matrix DAY. The equation of the exponential function with parameters A and B is an example of a functional form. Curve-fitting to various other functional forms will be considered next. 7.1 SUM-OF-SQUARED-ERROR CRITERION FOR CURVEFITTING Usually, the experimental data contains random measurement errors which make it impossible for every data point to agree exactly with the value predicted by a model. It is convenient to have a computable quantity for measuring the agreement between the data and the predicted model values. Because of an extensive mathematical and statistical theory for the method of least-squares, the sum-of-squared-error is the most frequently used measure. As an example, suppose that an experimental value y has been measured at various values of an independent variable x, giving the following paired data: (x1 , y1 ) = (.8, 3.2) (x2 , y2 ) = (1.4, 1.85) (x3 , y3 ) = (2.1, 1.8) (x4 , y4 ) = (3.3, 1.1) (x5 , y5 ) = (4.1, .7) Assume that the quadratic polynomial: f (x) = 3.7 − 1.5 · x + .2 · x2 models this data. The sum, S, of the terms: [yi − f (xi )]2 is the sum-of-squared-errors for the agreement between the model and the data, where yi is the data value at xi , and f (xi ) is the predicted value at xi : 226 S = 5 X i=1 [yi − f (xi )]2 = (3.2 − 2.628)2 + (1.85 − 1.992)2 + (1.8 − 1.432)2 + (1.1 − .928)2 + (.7 − .912)2 = 0.5573 If a vertical line segment is drawn from a data point to the function graph of y = f (x), then the length of the segment is the absolute value of the difference between the data value and the value predicted by the model. The squared error equals the area of a square with this segment as a side. That is, the vertical segment has endpoints (xi , yi ) and (xi , f (xi )) with length |yi − f (xi )|, for each i = 1, 2, 3, 4, 5. In Figure 7.1 is plotted part of the function y = f (x) showing the five data points as small triangles. For each data point, the vertical line segment between the point and the function graph, and the square which has this segment as its left side are shown. Thus, the sum-of-squared-error, S, equals the sum of the areas of the five squares shown in Figure 7.1. This picture shows some elementary properties of sum-of-squared-error estimates. Clearly, the sum-of-squared-error is never a negative number, and it is not zero unless there is perfect agreement between the data and the model. Moreover, it increases to arbitrarily large values if any data point is moved a sufficient vertical distance away from the function graph. Note also that it is the vertical line segment to the function graph that is important, not the line segment from the data point to the nearest point on the function graph. In Figure 7.1 for example, the line segment from the point A on the function graph to the leftmost data point B is shorter than the vertical line segment from B to the function graph, but this does not affect the sum-of-squared-error criterion. If the experimental measurements can not be made with equal precision for all data points, then the sum-of-squared-error criterion may be unsatisfactory for curve-fitting. For example, suppose an experiment involves: (1) injecting experimental animals with a drug containing a radioactive label and (2) then doing radioactive counts of blood samples taken at periodic intervals after injection. Such an experiment may show several orders-of-magnitude decreases in radioactive count readings over the time period the animal is monitored. Because of the way that radioactive samples are prepared, the expected error of the experimental measurement might be roughly proportional to the number of radioactive counts obtained. So, the large early measurements may have errors which are several orders of magnitude larger than the later measurements. Then the later measurements would have negligible effect on the sum-of-squared-error criterion. For example, a model with 2% error at t = 1 and 5% error at t = 10 might have a larger sum-of-squared-error than a model with 1% error at t = 1 and 100% error at t = 10. This undesirable effect can sometimes be avoided by making a mathematical transformation of the measured values to transform the expected errors to approximately equal size. For example, suppose a user wanted to fit an exponential washout model to the radioactive count data, using the formula: 227 Figure 7.1: Example of sum-of-squared-error terms. 228 y = a · e−b·t where y is the predicted radioactive count at time t, for certain constants a and b. One commonly used method is to take logarithms of the model and data, using the formula: log(y) = log(a · e−b·t ) = log(a) − b · t So, the user can fit the transformed data points: (ti , log(yi )) for i = 1, 2, ..., n to a straight line on a graph of t versus log(y). (The slope will equal −b, and the y-intercept will equal log(a).) If the error of each original data point is roughly proportional to the size of that data point, then the errors of the transformed data will be roughly equal in magnitude. For example, suppose the measured values at times t = 1 and t = 2 are both 10% larger than the predicted values. Then the vertical distances on the log plot are as follows: log(1.1 · a · e−b ) − log(a · e−b ) = log(1.1) log(1.1 · a · e−2·b ) − log(a · e−2·b ) = log(1.1) That is, the same 10% relative error for the original data yields a constant error log(1.1) after the logarithmic transformation. Now, the simple unweighted sum-of-squared-error criterion is appropriate only when the measurement errors are expected to be about the same for all data points. The logarithmic transformation will usually give more satisfactory results for curve-fitting data with experimental error proportional to the magnitude of the measurement. Mathematical transformations of data should be used with care. If the errors are uniform or come from a Poisson process, for example, then taking logarithms will usually give worse results than would be obtained from curve-fitting the original data. 7.2 WEIGHTED-SUM-OF-SQUARED-ERROR CRITERION A second, more flexible method is available in MLAB for analysis of data obtained with measurements of unequal precision. In this method, the agreement between the model and the experimental 229 data is measured by a weighted-sum-of-squared-error criterion. Each data point has an associated weight that is a non-negative number assigned by the data analyst. These assignments are made so that data points measured with high precision are given greater weights than those measured with less precision. For example, reconsider the data of Figure 7.1. Suppose that the measurements outside the interval [1, 4] on the x-axis are known to be less precise. It is decided to assign weights wi (i = 1, 2, 3, 4) as shown below: w1 = .6 for ((x1 , y1 ) = (.8, 3.2)) w2 = 1 for ((x2 , y2 ) = (1.4, 1.85)) w3 = 1 for ((x3 , y3 ) = (2.1, 1.8)) w4 = 1 for ((x4 , y4 ) = (3.3, 1.1)) w5 = .75 for ((x5 , y5 ) = (4.1, .7)) Then the weighted-sum-of-squared-error, S, is given by: S = 5 X i=1 wi · [yi − f (xi )]2 = .6 · (3.2 − 2.628)2 + 1 · (1.85 − 1.992)2 + 1 · (1.8 − 1.432)2 + 1 · (1.1 − .928)2 + .75 · (.7 − .912)2 = 0.4152 Figure 7.2 shows the change obtained in the analysis of Figure 7.1. Shaded areas have been added to the five squares which geometrically represent the weighted-squared-error terms. Each shaded area represents the fraction of the entire square’s area given by the weight for the corresponding data point. The weighted-sum-of-squared-error is the sum of the shaded areas. A data point may have a weight greater than 1. It is also possible to assign zero weight to a data point, which then has no effect on the weighted-sum-of-squared-error criterion. Negative weights should not be used. Note that multiplying each weight by a positive constant C is the same as multiplying the weighted-sum-of-squared-error criterion by C. So, only the relative sizes of the weights are important for selecting best-fitting models. However, the reciprocal-of-variance weights described next have some desirable statistical properties. In statistics, if data are obtained with measurements of unequal precision, the variances (standard deviations squared) of the measurements are not all equal. When measurements are independent 230 Figure 7.2: Example of weighted-sum-of-squared-error terms. 231 but have different variances, the reciprocals of the variances are used as weights for corresponding data points. Thus, the expected values of the weighted-squared-error terms: wi · [yi − f (xi )]2 are all equal to one. Some examples of the reciprocal-of-variance method for assigning weights follow. Suppose k independent measurements y1 , y2 , ..., yk are made of a dependent variable y at a particular value of an independent variable x. The mean value: m= k 1 X · yi k i=1 is usually taken as the data value for y. It is well known that: V (m) = σ 2 /k is the variance of the mean m, where σ is the standard deviation of the individual measurements. Thus, the weight associated with the data point (x, m) should be chosen as: w= 1 k = 2 V (m) σ If σ is unknown, w = k may be taken as the weight associated with the data point (x, m) since σ is a constant. (In this case, however, the expected value of the squared error term is unknown.) For example, if: 11.21, 10.98, 11.06, 11.25, 11.18 are k = 5 repeated measurements for the value of a dependent variable y at the value x = 2 of an independent variable, the mean value m, given here by: m = (11.21 + 10.98 + 11.06 + 11.25 + 11.18)/5 = 11.136 is taken as the data value for the repeated measurements. Since σ is unknown, the value 5 is taken as the weight associated with the data point: 232 (x, m) = (2, 11.136) The process shown above can be independently applied to n data points, each obtained by repeated measurements. The result is an n by 2 array of averaged data points and an n-vector of corresponding weights estimating measurement precision. If the variance σi2 of the dependent variable yi is proportional to the size of the corresponding independent variable xi (σi2 = c · xi ) for i = 1, 2, ..., n, the weight associated with the data point (xi , yi ) should be chosen as: wi = 1 , for i = 1, 2, ..., n (c · xi ) On the other hand, if the variance σi2 of the dependent variable yi is inversely proportional to the size of the corresponding independent variable xi (σi2 = c/xi ) for i = 1, 2, ..., n, the weight associated with the data point (xi , yi ) should be chosen as: wi = cxi , for i = 1, 2, ..., n The reciprocal-of-variance method above is only one of the possible ways for choosing data point weights. In MLAB, one can select any weighted-sum-of-squared-error criterion that is appropriate for the data and model. That is, each data point can be given any fixed positive weight chosen by the user. Of course, the sum-of-squared-error criterion is a special case, obtained by setting all weights equal to one. 7.3 EWT OPERATOR MLAB has an operator called EWT (for estimated weights) and shown in Table 7.1, which takes a data matrix, M, as input and produces an associated vector of weight values as output. These weight values are computed subject to certain assumptions and are sometimes inappropriate, although they are often quite suitable. The input data matrix, M, must be a 2- or 3-column matrix with column 1 in ascending order. The standard deviation of each data point is estimated by the difference of the data from a smoothed form of the data. Thus, the error is assumed to be similar to white noise. The reciprocal of the squares of these standard deviations estimates form the resulting weight vector. The use of EWT-generated weights is sometimes not appropriate where the data points are too few in number, or where wide gaps appear in a low frequency disturbance. Nevertheless, EWT-generated 233 The general form of the EWT operator is given by: EWT(ME1) If ME1 is an n by 2 or an n by 3 matrix [aij ] with the elements of the first column in ascending order, the result is an n by 1 column vector [wi ] such that wi are estimated weights associated with data points (ai1 , ai2 ) or (ai1 , ai2 , ai3 ) for i = 1, 2, ..., n. If NCOLS(ME1) > 3, an error message appears. Table 7.1: EWT operator. weights are often useful. In particular, the problem of unit differences when fitting several curves simultaneously described in Section 7.9 can be overcome by using EWT-generated weights since the weight vector entries are computed based on the actual units of data. For example, consider the simulated data matrix, M, computed as shown in the following MLAB commands: * * * * * * * * * * * * * * * FUNCTION F(X) = 10*EXP(-X)+SIN(X) M = POINTS(F,0:10:.2) G = M N = 0^^NROWS(M) E = (RAN ON N) + (RAN ON N) M COL 2 = (M COL 2) + E/4 DRAW G DRAW M, LINETYPE NONE, POINTTYPE "." FUNCTION R(X) = SQRT(1/X) N = R ON EWT(M) G COL 2 = (G COL 2) + N DRAW G, LINETYPE DASHED G COL 2 = (G COL 2) -N - N DRAW G, LINETYPE DASHED VIEW The operator RAN in the above command sequence generates a uniform pseudo-random number strictly between zero and one. The simulated data (dots), the function F (solid line), and the function F plus and minus standard deviations obtained from EWT-generated weights (dashed lines) are plotted in Figure 7.3. A look at this figure suggests that the EWT-generated weights are quite reasonable. 234 Figure 7.3: Illustration of EWT-generated weights 235 7.4 FUNCTIONAL FORMS OF SEVERAL VARIABLES The examples given above use functions of one variable to model data consisting of two variables, one independent and the other dependent. It is also possible to model data consisting of n + 1 variables (n independent and 1 dependent) by a function of n variables. For example, suppose three variables x, y, and v have been measured in each repetition of an experiment. It is predicted that v should equal the average (x + y)/2 of the independent variables x and y. The model is then: v = f (x, y) = (x + y)/2. Suppose the data (xi , yi , vi ) and assigned weights wi (i = 1, 2, 3, 4) are w1 = 4, for ((x1 , y1 , v1 ) = (1.0, 2.0, 2.3)) w2 = 8, for ((x2 , y2 , v2 ) = (1.1, 1.8, 1.4)) w3 = 25, for ((x3 , y3 , v3 ) = (1.2, 1.6, 1.3)) w4 = 400, for ((x4 , y4 , v4 ) = (1.3, 1.4, 1.2)) The weighted-sum-of-squared-error, S, is given by: S = 4 · [2.3 − (1.0 + 2.0)/2]2 + 8 · [1.4 − (1.1 + 1.8)/2]2 + 25 · [1.3 − (1.2 + 1.6)/2]2 + 400 · [1.2 − (1.3 + 1.4)/2]2 = 11.83 In effect, weighted areas of squares formed from line segments parallel to the v-axis in threedimensional (x, y, v) space are summed. Each line segment goes from [xi , yi , vi ] to [xi , yi , f (xi , yi )] for i = 1, 2, 3, 4. A vertical line segment was dropped from the data point to the graph of v = f (x, y), a surface in three-dimensional space. The weighted-sum-of-squared-error criterion is described in Table 7.2. 7.5 JOINT MODELS OF SEVERAL FUNCTIONAL FORMS In certain experiments, the user may have two or more sets of data to be modeled to several functional forms that contain some common parameters. For example, the models: 236 In the general case, suppose that a dependent variable y is a function f (x1 , x2 , ..., xn ) of n independent variables x1 , x2 , ..., xn . For data points (xi1 , xi2 , ..., xin , yi ) and assigned weights wi (i = 1, 2, ..., m), the weighted-sum-of-squared-error criterion: 2 S= m i=1 wi [yi − f (xi1 , xi2 , . . . , xin )] is used as a measure of the agreement between model and data. If n = 1 and wi = 1 for i = 1, 2, ..., m, S is the sum-of-squared-error criterion discussed in Section 7.1. P Table 7.2: Weighted-sum-of-squared-error criterion. X(t) = [A0 · k1 /(k1 − k2 )] · [e(−k1 ·t) − e(−k2 ·t) ] B(t) = A0 · [1 − e(−k1 ·t) ] − X(t) derived from the consecutive kinetic reaction: A k1 → X k2 → B contain the common parameter k1 . Suppose data measurements x1 , x2 , ..., xn of the function X(t) with associated weights v1 , v2 , ..., vn and data measurements b1 , b2 , ..., bm of the function B(t) with associated weights w1 , w2 , ..., wm are obtained. Although it is possible to model data measurements x1 , x2 , ..., xn by the function X(t) and to model data measurements b1 , b2 , ..., bm by the function B(t) separately, it is usually preferable to model these data to X(t) and B(t) simultaneously. There is a weighted-sum-of-squared-error criterion: S1 = n X i=1 vi · [xi − X(ti )]2 associated with the model X(t), and another weighted-sum-of-squared-error criterion: S2 = m X i=1 wi · [bi − B(ti )]2 237 associated with the model B(t). The weighted-sum-of-squared-error criterion for the joint models is then given as: S = S1 + S2 = n X i=1 vi · [xi − X(ti )]2 + m X i=1 wi · [bi − B(ti )]2 Table 7.3 shows the joint models weighted-sum-of-squared-error criterion. In the general case, suppose that the dependent variables y1 , y2 , ..., ym are functions f1 (x1 , x2 , ..., xp ), f2 (x1 , x2 , ..., xp ), ..., fm (x1 , x2 , ..., xp ), respectively, of p independent variables x1 , x2 , ..., xp . For data points (xij1 , xij2 , ..., xijp , yij ) and assigned weights wij (i = 1, 2, ..., nj ; j = 1, 2, ..., m), the weighted-sum-of-squared-error criterion: 1 wi1 · [yi1 − f (xi11 , xi12 , . . . , xi1p )]2 S = ni=1 Pn 2 + i=1 wi2 · [yi2 − f (xi21 , xi22 , . . . , xi2p )]2 +... P m wim · [yim − f (xim1 , xim2 , . . . , ximp )]2 + ni=1 P is used as a measure of the agreement between the m models and corresponding data. Table 7.3: Joint models weighted-sum-of-squared-error criterion. 7.6 THE CONSTRAINTS COMMAND Suppose that a weight has been selected for each data point obtained from an experiment. For a completely specified model, the weighted-sum-of-squared-error is just a number. However, the mathematical model will often contain parameters with unknown values. If so, then different values assigned to the parameters may yield different values for the sum-of-squared-error criterion. That is, the weighted-sum-of-squared-error becomes a function of the parameters with unknown values. For example, consider the best straight-line fit of the four data points (xi , yi ) with assigned weigths wi (i = 1, 2, 3, 4) shown below: w1 = 6, for ((x1 , y1 ) = (0.4, 1.2)) w2 = 8, for ((x2 , y2 ) = (0.7, 1.4)) 238 w3 = 9, for ((x3 , y3 ) = (0.9, 1.7)) w4 = 8, for ((x4 , y4 ) = (1.1, 2.0)) The model is the functional form of the straight line: y =a+b·x with unknown y-intercept a and slope b. Hence, the weighted sum of squared error is: S(a, b) = 6 · [1.2 − (a + b(.4))]2 + 8 · [1.4 − (a + b(.7))]2 + 9 · [1.7 − (a + b(.9))]2 + 8 · [2.0 − (a + b(1.1))]2 That is, the sum-of-squared-error criterion S(a, b) is an explicit function of a and b, depending upon the data and the functional form for the straight line. In this case, it can be shown that there are uniquely determined values for a and b such that S(a, b) is a minimum. These values for the y-intercept a and slope b determine the regression line of y on x for this data. In many cases, a mathematical model will not be appropriate for all possible assignments of values to the unknown parameters. For example, it may be known that a certain parameter is positive or lies between certain known values. Alternatively, it may be known that one given parameter is larger than another or that one parameter is a constant multiple of another or that the sum of certain parameters is a known constant. In MLAB, any number of these conditions can be described by a system of linear constraints. Given a list b1 , b2 , ... , bn of parameters to be fitted, each linear constraint for these parameters has one of the three forms: r1 · b1 + r2 · b2 + ... + rp · bp < r0 r1 · b1 + r2 · b2 + ... + rp · bp = r0 r1 · b1 + r2 · b2 + ... + rp · bp > r0 where r0 , r1 , ... , rp are specified scalar constants. Note that ≤ and ≥ can be used but are replaced by < and >, respectively, when displaying the constraint set. Theoretically equal quantities will often have slightly different computed values due to numerical error, so this difference is usually unimportant when applying linear constraints during a numerical computation. Some examples of linear constraints on parameters b1 , b2 , and b3 are given in Table 7.4, both in a simplifed form that MLAB will accept and in an equivalent combination of the forms described above. 239 b1 ≥ 0 1.3 ≤ b2 ≤ 1.4 b1 ≥ b3 b2 = 2 · b3 2 · b1 ≥ b3 − 1 b1 + b 2 + b 3 = 1 (b1 + b3 )/2 = (b2 − b1 )/4 + 3 1 · b1 + 0 · b 2 + 0 · b3 > 0 0 · b1 + 1 · b2 + 0 · b3 > 1.3 0 · b1 + 1 · b2 + 0 · b3 < 1.4 1 · b1 + 0 · b2 + (−1) · b3 > 0 0 · b1 + 1 · b2 + (−2) · b3 = 0 2 · b1 + 0 · b2 + (−1) · b3 > −1 1 · b1 + 1 · b 2 + 1 · b3 = 1 .75 · b1 − .25 · b2 + .5 · b3 = 3 Table 7.4: Examples of linear constraint forms. The curve-fitting process in MLAB may be restricted by specifying a system of linear constraints on the parameters to be fitted. If a system of linear constraints is given, then the search for a minimum of S will observe these constraints. The curve-fitting method is designed to avoid violating constraints, and beyond that, to converge to a constrained minimum of S. If a model involves linear constraints on the parameters, then an MLAB constraint set must be created to specify them. MLAB conventions for describing linear constraints are less restricted than the aforesaid forms. The general form of the CONSTRAINTS command is shown in Table 7.5. For example, it is permitted to write K/4 to describe the term .25*K and to write A-2*B to describe the expression 1*A+(-2)*B. Any inequality or equation of such expressions will be arranged into a linear constraint by collecting terms. The following dialog shows an example of this rearrangement process: * CONSTRAINTS PRC = {-A/2 - B + 1 >= 2*B - A + .6} * TYPE PRC constraints PRC = { A-2*B > -0.4 } Coefficients of A and B and the constant term were computed by collecting the appropriate terms. Note that it is permitted to use a scalar variable other than a parameter in a linear constraint, but not as a coefficient of a parameter. For example, in curve-fitting the parameters A and B: A - 2*B > K is a valid constraint, and K may be assigned any value before the FIT command using this constraint is executed. However, the forms: K*A < B and A/K = B 240 The general form of the MLAB CONSTRAINTS command is: CONSTRAINTS csi = .... Here, csi is either an unknown MLAB identifier or the identifier of an existing MLAB constraint set which is to be replaced. If csi is an existing constraint set, then all its previous contents are deleted. The quantity in braces represents a set of linear constraints entered as algebraic inequalities involving sums of terms of the form: sc, si, sc*si, or si/sc for any scalar constant sc and any scalar identifier si. If there is more than one constraint, constraints must be separated by commas. MLAB will rearrange each constraint expression into a standard linear constraint form by collecting on the left side all terms which involve scalar identifiers and by computing one scalar constant (possibly zero) to follow the relational symbol. Linear constraints cannot contain matrix element parameters. However, a linear constraint can contain any MLAB scalar with a fixed value, which need not be a parameter of the functional form. Table 7.5: CONSTRAINTS command. for example, are not permitted. (An MLAB linear constraint can not contain a product or a quotient of two scalar variables.) 7.7 GENERAL PROBLEM OF CURVE-FITTING A FUNCTIONAL FORM The problem of curve-fitting a functional form model to data may be summarized as shown in Table 7.6. Although a global minimum for S was used in this discussion, there are some situations in which an isolated local minimum for S is a satisfactory curve-fitting solution. 7.8 PREPARING DATA FOR CURVE-FITTING OPERATIONS To curve-fit with MLAB, the user must specify a mathematical model. Also, the data and weights must be put into two MLAB matrices: a matrix of data points and an (optional) column vector of weights. Any convenient matrix technique can be used to create them. For example, the data 241 Assume m models of the functional forms: y1 = f1 (x1 , x2 , ..., xn ; b1 , b2 , ..., bp ) y2 = f2 (x1 , x2 , ..., xn ; b1 , b2 , ..., bp ) ... ym = fm (x1 , x2 , ..., xn ; b1 , b2 , ..., bp ) involving m dependent variables y1 , y2 , ..., ym ; n independent variables x1 , x2 , ..., xn ; and p parameters b1 , b2 , ..., bp having unknown values. (There may also be other parameters in f which are assigned fixed values.) For data points (xi11 , xi12 , ..., xi1n , yij ) with associated weights wij (i = 1, 2, ..., nj ; j = 1, 2, ..., m), the weighted-sum-of- squared-error criterion is given by: S(b1 , b2 , . . . , bp ) = P n1 2 i=1 wi1 · [yi1 − f (xi11 , xi12 , . . . , xi1n ; b1 , b2 , . . . , bp )] P n2 + i=1 wi2 · [yi2 − f (xi21 , xi22 , . . . , xi2n ; b1 , b2 , . . . , bp )]2 +... P m wim · [yim − f (xim1 , xim2 , . . . , ximn ; b1 , b2 , . . . , bp )]2 + ni=1 Note that S(b1 , b2 , ..., bp ) is a function of the parameters only because numerical data values are substituted for y1 , y2 ..., ym and x1 , x2 , ..., xn when evaluating the expression for S. The model may include linear constraints on the parameters b1 , b2 , ..., bp of the form described in Section 7.6. The curve-fitting problem for this model and data is to find numerical values for the parameters b1 , b2 , ..., bn which satisfy all the given linear constraints and minimize the weighted-sum-of-squared-error criterion S(b1 , b2 , ..., bn ) with respect to the permitted assignments. It is possible that no such assignment exists. Also, multiple solutions may occur; that is, two or more different assignments of numerical values to the fitted parameters may yield the same (minimum) value for S. Table 7.6: Curve-fitting a functional form. matrix D and column vector V corresponding to the data of Figure 7.2 can be created as shown in the following MLAB dialog: * TMP = LIST(.8,3.2,.6,1.4,1.85,1,2.1,1.8,1,3.3,1.1,1,4.1,.7,.75) 242 * * * * TMP = SHAPE(5,3,TMP) D = TMP COL 1:2 V = TMP COL 3 TYPE D,V D: a 1: 2: 3: 4: 5: 5 by 2 matrix 0.8 1.4 2.1 3.3 4.1 V: a 1: 2: 3: 4: 5: 3.2 1.85 1.8 1.1 0.7 5 by 1 matrix 0.6 1 1 1 0.75 Table 7.7 describes preparation of data for curve-fitting operations. In general, suppose that m weighted data points (xi1 , xi2 , ..., xin , yi ) of (n + 1) coordinates, each with associated weight wi , i = 1, 2, ..., m, are to be curve-fitted to a functional form: y = f (xi1 , xi2 , ..., xin ; b1 , b2 , ..., bp ) The m by (n + 1) data matrix and m by 1 column vector of weights are set up as MLAB matrices with ith rows, respectively: [xi1 , xi2 , ..., xin , yi ] and [wi ] for i = 1, 2, ..., m. That is, the ith data matrix row contains in the first n columns the ith data point with the n independent variables in some fixed order and in the (n + 1)st column the dependent variable. As shown, the ith coordinate of the weight vector is the weight for the ith data point. Table 7.7: Data preparation for curve-fitting operations. 243 7.9 THE FIT COMMAND Suppose the parameters a, b, and c of the functional form: f (x) = a + b · x + c · x2 are to be fit to the data of Figure 7.2. Furthermore, assume the following linear constraints: f (0) ≥ 1 and f ′ (1) ≤ 1 It is relatively easy to define functional forms in MLAB using FUNCTION statements. To set up a quadratic polynomial model for the data of Figure 7.1 and Figure 7.1, for example, the following MLAB commands can be used: * FUNCTION F(X) = A + B*X + C*X*X * A = 3.7; B = -1.5; C = .2 Thus, the quadratic polynomial: f (x) = 3.7 − 1.5 · x + .2 · x2 graphed in Figure 7.1 and Figure 7.2 is now defined as F in MLAB. Notice, however, that parameters A, B, and C are used for the coefficients of F, rather than simply defining F with constant coefficients. So, F can now be regarded as defining the functional form of the quadratic polynomial f . Then the functional form is the main definition for the model, and the scalar values assigned to A, B, and C may now be regarded as initial estimates for the coefficients. Since f (0) = a and f ′ (1) = b + 2c, the following MLAB dialog can be used to set up these conditions as linear constraints in a constraint set named Z1: * CONSTRAINTS Z1 = {A >= 1,B + 2*C <= -1} * TYPE Z1 constraints Z1 = { A > 1, B+2*C < -1 } The MLAB definition of the desired model has now been completed. To initiate the curve-fitting process, using the data prepared in Section 7.8, the FIT command of MLAB is used as shown in the following dialog: 244 * FIT (A,B,C), F TO D WITH WEIGHT V CONSTRAINTS Z1 final parameter values value error dependency 3.8935241474 0.9319706332 0.9655163403 -1.4034884111 0.8666083211 0.9942652507 0.1583819796 0.1711160115 0.9874324868 2 iterations CONVERGED best weighted sum of squares = 2.605776e-01 weighted root mean square error = 3.609554e-01 weighted deviation fraction = 1.256144e-01 R squared = 9.158419e-01 no active constraints parameter A B C Observe that the above FIT command specifies: 1. a list of parameters (A,B,C) for curve-fitting, 2. a functional form, given by the MLAB function F, 3. the data matrix D, 4. the associated weight vector V, and 5. the constraint set Z1. The MLAB FIT command for curve-fitting a functional form requires these operands, except that the phrase WITH WEIGHT V can be omitted if all weights are equal to one, and the phrase CONSTRAINTS Z1 can be omitted if there are no constraints. The following MLAB dialog shows the changes that occur as a result of the previous FIT command: * TYPE A,B,C A = 3.89352415 B = -1.40348841 C = 0.15838198 * TYPE FUNCTIONS currently defined FUNCTIONS F’A F’C F F’B * TYPE SOSQ 245 SOSQ = .260577588 * TYPE STDEST STDEST: a 3 by 1 matrix 1: .931970633 2: .866608321 3: .171116012 * TYPE DEPVALS DEPVALS: a 3 by 1 matrix 1: 0.96551634 2: .994265251 3: .987432487 * TYPE COVP COVP: a 3 by 3 matrix 1: .868569261 2: -.772576329 3: 0.14386197 -.772576329 .751009982 -.145976277 0.14386197 -.145976277 2.92806894E-2 As a result of the FIT command, 1. the values of the parameters A,B,and C changed, 2. three new functions were defined which correspond to the derivatives of F with respect to each of the curve-fitting parameters, 3. the scalar SOSQ was assigned the value of the best weighted-sum-of- squared-error, 4. the 3-element column vector STDEST was assigned the errors for each of the curve-fitting parameters, 5. the 3-element column vector DEPVALS was assigned the dependencies for each of the curvefitting parameters, and 6. the 3 by 3 matrix COVP was assigned the covariance matrix. There is a pre-defined scalar in MLAB called LSQRPT that controls what information is to be reported during and at the conclusion of the processing of a FIT command. The default value 246 of LSQRPT is 8, which means that the MLAB curve-fitting process is “quiet”; final parameter values, lagrange multipliers, and a statistical summary are printed at the conclusion of the FIT process. If LSQRPT is 0, the MLAB curve-fitting process is “silent”; nothing will be printed to the screen during or at the completion of the curve-fitting process. For a more complete description of LSQRPT, see The MLAB Reference Manual. If the FIT command is used, some output regarding the progress MLAB is making in reducing the weighted-least-sum-of squares error can be obtained by typing the letter “R” (without carriage return) during execution of the FIT command. (“R” stands for “Report”.) This will toggle an MLAB switch which, when ON, will print out information about the fitting process. Typing “Q” (without carriage return) terminates any FIT command at the end of the iteration currently being computed. (“Q” stands for “Quit”.) In MLAB, multiple clauses can be used in a FIT command to compute overall estimates of the common parameters in joint models of functional forms. For example, recall the equations: X(t) = [A0 · k1 /(k1 − k2 )][e(−k1 ·t) − e(−k2 ·t) ] B(t) = A0 · [1 − e(−k1 ·t) ] − X(t) used in the example of Section 7.5. Suppose that the data measurements of the function X(t) are entered in the MLAB matrix DX and the data measurements of the function B(t) are entered in the MLAB matrix DB as shown in the following dialog: * * * * DX DX DB DB COL COL COL COL 1 2 1 2 = = = = 10:100:10 LIST(66.4,141,150.8,174.6,207.1,155.7,207.2,215.6,220.3,188.6) 10:100:10 LIST(.02,.23,.24,.42,.59,.67,1.04,1.22,1.47,1.68) Then the following dialog curve-fits the functions X(T) and B(T) simultaneously, and displays Figure 7.4: * FUNCTION X(T) = (A0*K1/(K2-K1))*(EXP(-K1*T)-EXP(-K2*T)) * FUNCTION B(T) = A0*(1-EXP(-K1*T))-X(T) * A0 = 200; K1 = .05; K2 = .0001 * FIT (K1,K2), X TO DX, B TO DB final parameter values value error dependency 0.0511870446 0.00511935 0.0898001789 -0.000161445 0.0003352155 0.0898001789 247 parameter K1 K2 2 iterations CONVERGED best weighted sum of squares = 3.213720e+03 weighted root mean square error = 1.336189e+01 weighted deviation fraction = 8.383730e-02 R squared = 9.808347e-01 * DRAW XFIT1 = POINTS(X,0:100) * DRAW DX POINTTYPE CROSSPT LINETYPE NONE * LEFT TITLE "X(T)" * BOTTOM TITLE "T" * FRAME 0 TO .5, 0 TO 1 * W1 = W * DRAW BFIT1 = POINTS(B,0:100) * DRAW DB POINTTYPE CROSSPT LINETYPE NONE * LEFT TITLE "B(T)" * BOTTOM TITLE "T" * FRAME .5 TO 1, 0 TO 1 * VIEW In the FIT command above, the clause X TO DX tells MLAB to find the sum-of-squared-error, S1 , associated with X; the clause B TO DB tells MLAB to find the sum-of-squared-error, S2 , associated with B; and the sum of the two criteria S1 + S2 is used to find the agreement between the predicted and observed values of both X and B. Because the values of X(T) are much greater than the values of B(T), the sum S1 +S2 is dominated by the term S1 . Consequently, the function B(T) shown in Figure 7.4 is a poor fit to the observed data. The weighted-sum-of-squared-error criterion is appropriate in this case. Observe the following dialog that uses the MLAB operator EWT in the clauses of the FIT command to estimate weight vectors corresponding to the matrices DX and DB, and displays Figure 7.5. * UNVIEW * BLANK XFIT1, BFIT1 * K1 = .05; K2 = .0001 * FIT(K1,K2), X TO DX WITH WEIGHT EWT(DX), B TO DB WITH WEIGHT EWT(DB) final parameter values value error dependency parameter 0.0445653323 0.0059939972 0.8353122888 K1 0.0001048492 5.260479277e-06 0.8353122888 K2 3 iterations CONVERGED best weighted sum of squares = 3.199382e+01 weighted root mean square error = 1.333205e+00 weighted deviation fraction = 5.176151e-02 248 Figure 7.4: Fit of X(t) and B(t) using unit weights. 249 Figure 7.5: Fit of X(t) and B(t) using the EWT operator. R * * * squared = 9.768205e-01 DRAW XFIT2 = POINTS(X,0:100) IN W1 DRAW BFIT2 = POINTS(B,0:100) IN W VIEW There is now considerable improvement in the fit of B(T) to the observed data as shown in Figure 7.5. Table 7.8 presents the general form of the MLAB FIT command. Criteria other than the sum-of-squared-error or weighted-sum-of- squared-error criteria are available in MLAB for curve-fitting. The MLAB commands: * FITNORM = k * FIT(B1, B2, ... , BP), F TO D WITH WEIGHT W for k > 0 will minimize the quantity: 250 S=[ m X i=1 wi · |yi − f (xi1 , xi2 , . . . , xin ; b1 , b2 , . . . , bp )|k ]1/k with respect to parameters b1 , b2 , ... , bp of the function f . When k = 1, S is the weighted sum of the absolute values of the errors. When k = 2, S is the weighted-sum-of-squared-error criterion discussed in Section 7.7. 7.10 THE FIT COMMAND CONTROL VARIABLES When an MLAB FIT command is used to curve-fit a functional form, a collection of predefined MLAB scalars control the curve-fitting process. The previous section described two of these control variables: LSQRPT and FITNORM; there are others. These scalars have default values that may be changed by the user prior to the FIT command. Another control variable is MAXITER. MAXITER determines the maximum number of iterations to be performed. That is, the curve-fitting process will terminate either because it converges or because the specified maximum number of iterations has been executed. The default value of MAXITER is 20. Zero iterations may be specified, in which case a summary for the user-defined initial parameter values is typed, with no change in the values of the fitted parameters. TOLSOS is another control variable that determines convergence of the fitting process. It should always be a small positive number. If unspecified, its value is .001. This value indicates that convergence occurs at the ith iteration if the parameters obtained in the ith iteration give less than a .1% improvement in the weighted-sum-of-squared-errors over the best previous value. More precisely, suppose the curve-fitting process did not converge in the first i − 1 iterations. Then the curve-fitting process will converge at the ith iteration if and only if: Si−1 − Si < (convergence factor) · Si−1 where Si denotes the smallest weighted-sum-of-squared-error found in the ith iteration, and Si−1 is the weighted-sum-of-squared-error at the end of iteration i − 1. Here, S0 is the initial weightedsum-of-squared-error. In all cases, Si ≤ Si−1 . The MLAB response to the FIT command (when LSQRPT has its default value of 8) is a final summary of the curve-fitting process after completion of the last iteration. The final summary contains the final values assigned to the fitted parameters, the final Lagrange multipliers, an 251 indication whether the curve-fitting process converged or not (CONVERGED or NOT CONVERGED), the final weighted-sum-of-squared-error (hopefully the minimum), and the number of iterations executed. There are three other types of quantities in the final summary: error and dependency values for each fitted parameter (to be discussed in Section 7.13), and the weighted p root mean square error. The weighted root mean square error is computed by the formula S/(m − ρ), where S is the final weighted-sum-of-squared-error, m is the number of data points, and ρ is the number of fitted parameters (assuming m > ρ). If the sum-of-squared-error criterion is used, this quantity is a root-mean-square estimate for the length of the vertical line segment between measured and predicted values for this fitted model and data. If the weights are the reciprocal of variances of each data point, then the weighted root mean square error is a root-mean-square estimate of the length of the vertical line segment between measured and predicted values for this fitted model and data, where each segment length is measured in units of the standard deviation of the data points. It is possible to distinguish between active and inactive constraints during the curve-fitting process. If b1 , b2 , ... , bp are curve-fitting parameters and the linear constraint: r1 · b1 + r2 · b2 + ... + rp · bp [<, =, or >]r0 is active, then r1 · b01 + r2 · b02 + ... + rp · b0p is nearly equal to r0 , where b01 , b02 , ... , b0p are the current values for the fitted parameters. That is, a linear constraint determines a part of the boundary of the region of permissible assignments of numerical values to the fitted parameters, and a constraint is active if the currently assigned values are located near this part of the boundary. In particular, constraint equations are always active, but constraint inequalities may be active or not during different iterations. The Lagrange multiplier of a constraint is zero if a constraint is inactive, and will usually be nonzero when the constraint is active. If a set of linear constraints has been specified for a FIT command, then the output for each iteration and for the final summary will contain a Lagrange multiplier for each constraint (given in the same order as in the constraint set list). If the Lagrange multiplier is x for a constraint equation: r1 · b1 + r2 · b2 + ... + rp · bp = r0 then the sign of x indicates the direction in which the search process would move if the equation were deleted from the model. Specifically: x > 0 if the search process would require increased r0 x < 0 if the search process would require decreased r0 252 Because the Lagrange multiplier is not dimensionless, the magnitude of this quantity is not a simple estimate of the influence of the corresponding constraint on the search process. If a FIT command terminates with the final result NOT CONVERGED, then the parameter values after the final iteration can be used as the initial values for another FIT command. That is, issuing a FIT command just like the previous one will continue the curve-fitting process through additional iterations. 7.11 FORMULATING FUNCTIONAL FORM MODELS To formulate functional form models in MLAB, 1. MLAB functions which represent the functional forms must be created, 2. numerical values to all parameters in the functional forms (including both the parameters to be fitted and any other parameters) must be assigned, and 3. an MLAB constraint set must be created if the model involves linear constraints. For simple models, the first step is usually a straightforward translation of the mathematical formula describing the functional form into a suitable FUNCTION command. For example, the formula: f (x) = c1 · ea·x + c2 · eb·x expressing the function f as a linear combination of two exponential functions, could be transcribed into the MLAB command: * FUNCTION F(X) = C1*EXP(A*X) + C2*EXP(B*X) which sets up a functional form with argument X and parameters A, B, C1, and C2. The Lp norm in Euclidean three-space: Lp (x, y, z) = (xp + y p + z p )1/p could be set up as a model by the MLAB command: 253 * FUNCTION LP(X,Y,Z) = (X^P+Y^P+Z^P)^(1/P) with arguments X, Y, Z and the single parameter P. In these examples, parameters in the functional form are represented by MLAB identifiers. When the FUNCTION command is executed, these MLAB identifiers may be unknown or correspond to any MLAB data. However, all the parameter identifiers must be made into MLAB scalars before curve-fitting. For example, the commands: * C1 = 1; C2 = -1; A = -.07; B = -2.16 would accomplish the second step of the model setup for the functional form F above by assigning numerical values to all the parameters of F. Similarly, P must be made an MLAB scalar before curve-fitting the LP model above. Failure to assign numerical values to parameters in a functional form is a common error. Some guesses must be made no matter how ill-prepared one is to do so. For formulating models having several functional forms to be fit simultaneously, the first step is accomplished by transcribing each functional form into an MLAB FUNCTION command. For example, the model in Section 7.5 is set up as shown in the commands: * FUNCTION X(T) = (A0*K1/(K2-K1))*(EXP(-K1*T)-EXP(-K2*T)) * FUNCTION B(T) = A0*(1.0-EXP(-K1*T)) - X(T) with the argument symbol T, unknown parameters K1 and K2, and the fixed parameter A0. The second step is accomplished by assigning appropriate numerical values to A0, K1, and K2. For example: * A0 = 200; K1 = .05; K2 = .0001 The third step is accomplished, if necessary, by creating a constraint set. For example: * CONSTRAINTS CS = {K1 > 0,K2 > 0} Using the correct strategy in defining complex functional forms is very important. Take, for example, the equation: B(t) = [S(R − B0 ) − R(S − B0 ) · e−d·K1 ·t ]/[R − B0 − (S − B0 ) · e−d·K1 ·t ] where R = (A + d)/2, S = (A − d)/2, d = (A2 − 4 · F0 · G0 )1/2 , and A = F0 + G0 + K2 /K1 . 254 In this model, B0 , F0 , and G0 are constants. The easiest, and worst, way to enter this model in MLAB is to enter it as it is written above, with empty argument list functions for R, S, A, and d. This method is very inefficient because it requires that the functions for R, S, A, and d be evaluated several times for a single computation of B(t). A far better way is to define a hierarchy of functions used cooperatively to evaluate B. Each level must perform some of the calculation required for B. For example, we could notice that in the definitions of B above, the terms involving (R-B0) and (S-B0) appear in the same fashion in both the numerator and the denominator. We could start, therefore, with: * FCT F1(A,B,S,R) = (S*A-R*B)/(A-B) Then F1 must be called with values for A and B. To simplify this slightly more we define: * FCT F2(R,S,X) = F1(R-B0,(S-B0)*X,S,R) The next step then is to specify values for S and R, which are given above, and to specify a value for X. This can be done with the definition: * FCT F3(A,D,T) = F2((A+D)/2,(A-D)/2,EXP(-D*K1*T)) This leaves A and D the only intermediate values to be evaluated. Since D is defined in terms of A, this can be done with the definition: * FCT F4(A,T) = F3(A,SQRT(A*A-4*F0*G0),T) Thus, through these four definitions, we can now define B(t) as: * FCT B(T) = F4(F0+G0+K2/K1,T) Each of these four functions need be evaluated once during the evaluation of B(t), so this is highly efficient. In general, creating a hierarchical system of functions is more efficient than most other methods of defining a model. Matrix elements can be used for MLAB function parameters. This can be convenient when indexed sums appear in the functional forms, as for power series, Fourier series, and so on. For example, a generalized polynomial model (approximating a power series) can be set up by the MLAB command: 255 * FUNCTION Q(X) = C(1)+SUM(J,1,N,C(J+1)*X^J) to represent the polynomial: q(x) = c0 + c1 · x + c2 · x2 + ... + cn · xn of degree n. Here, C is a column vector of length n + 1. To curve-fit a polynomial to a known data matrix D and weight vector V, an integer value is first assigned to the MLAB scalar N to determine the polynomial degree. The FUNCTION command above then defines the model. Numerical values are next assigned to the parameters by creating an (n + 1) by 1 MLAB column vector C. The MLAB command: * FIT (C), Q TO D WITH WEIGHT V now initiates the curve-fitting process. Each element of the matrix C is treated as an individual parameter for curve-fitting, just as if each were a separate MLAB scalar. Both MLAB scalar and matrix names can be used in the list of parameters of the same model. For example: h(t) = c11 · sin(a · t) + c12 · cos(a · t) + c21 · sin(b · t) + c22 · cos(b · t) could be set up by the command: * FUNCTION H(T) = C(1,1)*SIN(A*T)+C(1,2)*COS(A*T)+C(2,1)*SIN(B*T)+ \ : C(2,2)*COS(B*T) so that H has argument T, scalar parameters A and B, and four parameters in a 2 by 2 matrix C. If matrix names are used in the parameter list of an MLAB model, two restrictions must be observed. First, linear constraints in which any matrix element parameter occurs are not permitted. Second, all the matrix element parameters will be curve-fitted; individual matrix element parameters are not permitted in the parameter list of a FIT command. For example, note the MLAB error obtained by trying to fit the matrix element parameter in the function H above: * A = 1; B = 1; C = SHAPE(2,2,1:4); D = SHAPE(10,2,1:20) * FIT (A,B,C(1,1)), H TO D ##Error: fitop: an expression is of the wrong type The general problem of curve-fitting a functional form is shown in Table 7.9. 256 7.12 LINEAR MODELS There is a certain special class of mathematical models, called linear models, for which the curvefitting problem can be solved by a general formula. The MLAB user should know when the model is linear and when it is not, because nonlinear models require more careful treatment in many cases. Furthermore, some of the output of the MLAB FIT command pertains only to linear models. These output values are also computed for nonlinear models, but should be regarded as only rough guides in that case. Consider the functional form: f (x) = a · ex − b · e−x + sinh(x) with independent variable x and parameters a and b. When numerical values are substituted for the argument x of f , the pattern: f (−1) = .3679a + 2.718b − 1.175 f (0) = a + b, f (.5) = 1.649a + .6065b + .5211 f (1) = 2.718a + .3679b + 1.175 and so on is established. In each case, the value of f is a sum of terms, as follows: f (x1 ) = r1 · a + r2 · b + r3 for certain numbers r1 , r2 , and r3 depending upon x1 . Now, the expression: r1 · a + r2 · b + r3 for numbers r1 , r2 , and r3 is called a linear function of the parameters a and b. This indicates a sum of one or more terms, each summand being either a number or the product of a number and a parameter. Since the functional form f above has this property, it is said to be a linear model with respect to the parameters a and b. Note that a linear model can involve nonlinear functions such 257 as sinh(x) and exponential functions. So long as such functions do not involve fitted parameters, they will reduce to numbers when numbers are substituted for the arguments. Consider the trigonometric model: h(x, y) = s · sin(a · x) + t · cos(b · y) of two independent variables x and y and four parameters s, t, a, and b. Then: h(1, 1) = s · sin(a) + t · cos(b) is not a linear function of s, t, a, and b because there are no numbers: r1 , r2 , r3 , r4 , r5 such that for all s, t, a, and b: h(1, 1) = r1 · s + r2 · t + r3 · a + r4 · b + r5 Therefore, h is a nonlinear model for the parameters s, t, a, and b. However, a and b might be given fixed values, say a = .2 and b = .15, derived from scientific theory or data. Then, h(x, y) would be linear in s and t, because: h(1, 1) = .1987 · s + .9888 · t h(.4, 1.1) = .0799 · s + .9864 · t and so on. So, parameters that remain at fixed values may appear inside nonlinear functions used in linear models. Again, substitution of a fixed value reduces the nonlinear expression to a number. For curve-fitting in MLAB, a functional form defines a linear model if it acts linearly with respect to the parameter list specified in the FIT command. The model h above is nonlinear if s, t, a, and b are fitted, but is linear if s and t alone are fitted. Note that curve-fitting to a polynomial, to a truncated Fourier series, or to certain other forms of truncated series leads to a linear model. If the functional form f appears as: 258 f0 (x1 , x2 , ..., xn ) + b1 · f1 (x1 , x2 , ..., xn ) + b2 · f2 (x1 , x2 , ..., xn ) + ... + bp · fp (x1 , x2 , ..., xn ) where the functions: f0 , f1 , f2 , ..., fp do not involve any of the fitted parameters b1 , b2 , ..., bp , then the model associated with f and b1 , b2 , ..., bp is linear. The general linear model functional form is shown in Table 7.10. 7.13 STATISTICAL CONSIDERATIONS FOR CURVE-FITTING If parameters in a functional form are curve-fit to data, it is natural to hope that they will be experimentally reproducible. That is, it is desirable that repeating the experiment and the curvefitting would lead to stable statistical results. Good agreement between the functional form and the data, as well as approximately the same values for the fitted parameters, should be obtainable with high confidence. However, this will not occur for all models. There are models where small changes in the pattern of noise in the data can make large changes in the values of the fitted parameters. The degree of instability of the fitted parameter values is measured by the dependency values given in the final-summary section of the FIT command output. Each parameter has an associated dependency value, which is a number between 0 and 1. Dependency values close to 1 (say .98 or more) indicate instability in the fitted value for this parameter. That is, a high dependency implies that almost as good a curve-fit could be obtained even if the dependent parameter were constrained to be somewhat different from its optimum value. In effect, changes in the dependent parameter can be compensated by appropriate changes in the other fitted parameters, without much increase in the weighted-sum-of-squared-error. The error column included in the FIT command’s final-summary section may also help to estimate the statistical stability of the fitted parameter values. If the model is linear, and the data errors are normally and independently distributed with a common variance, and if there are no active linear constraints at the final optimal set of parameter values, then: 1. the fitted parameters are maximum-likelihood estimates in the statistical sense, and 2. the error values are unbiased estimated standard deviations of these parameter value estimates. 259 If these assumptions are not satisfied, then the error values are no more than rough guides. If the reciprocal-of-variances method of assigning weights is used and the errors between the model and the data are samples from normal distributions with zero means, then the weighted sum-ofsquared-error will have a chi-square distribution. The degrees of freedom will be equal to the number of data points minus the number of fitted parameters. In particular, the expectation of the weighted-sum-of-squared-error will be equal to the number of degrees of freedom. Because of the limited scope of this Beginner’s Guide, only brief mention can be made of the statistical problems associated with curve-fitting. The discussion and references in the MLAB Reference Manual and MLAB Applications Manual give more detailed information about these concerns. 7.14 CURVE-FITTING SEARCH STRATEGIES The curve-fitting search process in MLAB has been designed to work for most linear models and a wide variety of nonlinear models. However, the search methods will fail in some cases. For linear models, failure will be a result of numerical computation difficulties, such as arithmetic overflow, division by zero, or unacceptable buildup of numerical error during computation. The problems may be inherent in the model and data. However, they can be avoided in some cases by mathematical transformations of the model and data (rescaling, taking logarithms, etc.). Similarly, curve-fitting non-linear models may lead to problems of numerical computation, which may or may not be avoidable. In addition, theoretical difficulties can arise in curve-fitting nonlinear models. In this section, the search strategies and some situations in which the curve-fitting process converges inappropriately for nonlinear models will be considered. To explain the methods used, consider an analogy of a curve-fitting process involving two parameters with a problem involving the latitude and longitude of a certain region of the earth’s surface. Suppose that the altitude above sea level at any latitude and longitude equals the weighted-sum-ofsquared-error for a model and data at that point. (Recall that the weighted-sum-of-squared-error is a function of the fitted parameters.) Imagine standing at some point within the region, which corresponds to the initial values chosen for the latitude and longitude parameters. An altimeter is available and the problem is to find the point of minimum altitude in the region, that is, the point nearest to sea level (no point is below sea level). The terrain near the current location can be examined, but the entire region can not be seen. There is one obvious strategy: go downhill. If the current location is on a hillside, move in the direction that would lead to the most rapid loss of altitude in the immediate vicinity. After moving a distance in this direction, stop to assess the new lower altitude and new terrain. Obviously, the point of minimum altitude had not been found if the new location remains on the hillside. That is, the minimum point must be at least as low as its surrounding terrain (a local minimum). 260 If a relief map of the region were available, the search process would be less crude and more likely of success. For nonlinear models this might require evaluation point by point, but for linear models a short cut is available. It can be shown that the relief map for a linear model with two fitted parameters is a paraboloid bowl. (The vertical cross-sections of the surface are parabolas.) This bowl has a unique point of lowest altitude. Furthermore, the location of the bottom of the bowl can be computed by analyzing the slope of the terrain near the current location. So, a second strategy is available: assume the model is linear (or nearly so), and look at the latitude and longitude that the current terrain predicts is the bottom of the bowl. (Similar analysis is available for all linear models, regardless of the number of fitted parameters.) The curve-fitting routines in MLAB use a strategy that combines both of these approaches. In each iteration, one or more trial points are examined. Some of these may be near the current location, others near the predicted solution for a linear model, and others may be intermediate between the two. The first trial point encountered that has significantly lower altitude than the current location is chosen as the current location for the next iteration. At least one trial point in the direction of steepest descent will be examined. If there is no such point, which depends upon the convergence factor chosen, then the search process converges at the current location. Note that any constraints that have been imposed will determine boundaries for the region to be searched. In fact, such linear constraints determine convex polygonal regions (possibly infinite) in the latitude-longitude plane. When curve-fitting ρ parameters, the linear constraints determine a convex polygonal region in the Euclidean ρ-space of the fitted parameters (like a gem with facets). The MLAB strategy for generating trial points will prevent choosing parameter values outside the region determined by the constraints. If the current location is near the boundary of the region determined by the constraints, then the direction of steepest descent is projected onto the region boundary if necessary. The initial estimates of the parameters can have a critical effect upon the success of the search. Clearly, the bottom of the valley is more likely to be found if the search process is started from a side of the valley rather than from a distant point. Obtaining initial estimates of the unknown parameters, based upon scientific understanding of the experiment, is very desirable for curvefitting nonlinear models. This is less important for linear models, because of the linear-model analysis built into the curve-fitting strategy. Usually, linear models will converge to the unique answer in one or two iterations, starting from almost any initial values for the fitted parameters. Although the following nonlinear curve-fitting problem is somewhat artificial, it serves to show many of the difficulties that can arise in curve-fitting nonlinear models. Consider a functional form f (x) with one parameter c, based on a particular function h(x) as shown: f (x) = h(x − c) h(x) = [1/cosh(x) + 6/(x · x − 8 · x + 18) − x/5]/cosh(2 · x/5) 261 Figure 7.6: Graph of f (x) and h(x) for c = 12. Part of the graph of the function h is shown as a solid line in Figure 7.6. The x-axis is a horizontal asymptote to the graph of h in both directions: h approaches 0 from below as x goes to plus infinity, and h approaches 0 from above as x goes to minus infinity. For particular values of c, the graph of f is obtained by shifting the graph of h left or right. For example, at c = 12, f (x) = h(x − 12), so f (12) = h(0), and so on. Then the graph of f is obtained by shifting the graph of h twelve x-axis units to the right. This is shown as the dashed line in Figure 7.6. Similarly, for c = −1.4, the graph of f is obtained by displacing the graph of h 1.4 x-axis units to the left. The data for this example is assumed to be entered into an MLAB matrix M as shown in the following dialog: * M COL 1 = -1:1:.1 * M COL 2 = LIST(.69,.77,.80,.80,.83,.89,.9,1.03,1.05,1.04,1.15,1.18,\ : 1,2,1.26,1.34,1.41,1.38,1.33,1.33,1.29,1.36) The sum-of-squared-error criterion (all weights equal to one) will be used, and no linear constraints 262 Figure 7.7: Sum-of-squared-error vs the parameter c. on c will be assumed. The curve-fitting problem here is to slide the graph of h(x) to the left or right, by appropriately choosing c, until the portion of the graph between -1 and 1 best approximates the data, minimizing the sum-of-squared-error. Since there is only one parameter to be fit here, the sum-of-squarederror, S, versus the parameter c can be graphed. Part of this graph is shown in Figure 7.7. It is clear from the figure that c = 1 is close to the correct value for minimizing S. So, this initial estimate can be used in the curve-fit. The MLAB commands and responses appear in the dialog below: * FUNCTION H(X) * FUNCTION F(X) * C = 1 * FIT (C), F TO final parameter value 0.5443525223 = (1/COSH(X)+6/(X*X-8*X+18)-X/5)/COSH(2*X/5) = H(X-C) M values error 0.0706875861 dependency 0 263 parameter C Figure 7.8: Graph of f (x) for c = .709. 3 iterations CONVERGED best weighted sum of squares = 3.119495e-01 weighted root mean square error = 1.248899e-01 weighted deviation fraction = 4.697038e-02 R squared = 7.373404e-01 So, the procedure converged quickly to a value for c, which is reasonable from examination of Figure 7.8. In Figure 7.8 the graph of f (x) for c = .709 and the plotted data (points clustered near the function graph for −1 ≤ x ≤ 1) are shown. If S versus c had not been graphed to allow a good initial estimate for c to be chosen, the desired result would not necessarily have been obtained. Next are the curve-fitting responses that would be obtained from several other initial estimates for c. Observe the MLAB dialog: 264 * C = 500 * FIT (C), F TO M matherr: overflow error in cosh arg = 9.399497e+84 return value: 1.797693e+308 matherr: overflow error in cosh arg = 3.759799e+84 return value: 1.797693e+308 matherr: overflow error in cosh arg = 9.399497e+84 return value: 1.797693e+308 matherr: overflow error in cosh arg = 3.759799e+84 return value: 1.797693e+308 matherr: overflow error in cosh arg = 9.399497e+84 return value: 1.797693e+308 matherr: overflow error in cosh arg = 3.759799e+84 return value: 1.797693e+308 final parameter values value error dependency 500 2.142282373e+84 0 1 iterations CONVERGED best weighted sum of squares = 2.620320e+01 weighted root mean square error = 1.144622e+00 weighted deviation fraction = 1.000000e+00 parameter C For c = 500, the function graph of f (x) from -1 to 1 is very near the x-axis, and the computed values are identically zero because of exponent underflow. Hence, the curve-fitting process can not compute a direction of steepest descent, because all values for c near 500 have the same sum-of-squared-error S = 26.20320, as seen in Figure 7.9. In terms of the latitude and longitude analogy at the beginning of this section, there is no direction of steepest descent from a location in a level plateau. A similar phenomenon might occur at a local maximum of the sum-of-squared-error function, but this is not very likely to happen. The initial value c = −30 also produces an inappropriate result, as shown in the following dialog: * C = -30 * FIT (C), F TO M matherr: overflow error in cosh arg = 3.641769e+04 return value: 1.797693e+308 matherr: overflow error in cosh 265 Figure 7.9: Graph of f (x) for large |c|. 266 arg = 1.456707e+04 return value: 1.797693e+308 matherr: overflow error in cosh arg = 3.641779e+04 return value: 1.797693e+308 matherr: overflow error in cosh arg = 1.456711e+04 return value: 1.797693e+308 matherr: overflow error in cosh arg = 3.641789e+04 return value: 1.797693e+308 matherr: overflow error in cosh arg = 1.456715e+04 return value: 1.797693e+308 final parameter values value error dependency parameter -36418.6856061939 8829.7637665699 -2.220446049e-16 C 1 iterations CONVERGED best weighted sum of squares = 2.620320e+01 weighted root mean square error = 1.144622e+00 weighted deviation fraction = 1.000000e+00 Since the initial value is to the left of the maximum for S versus c, the curve-fitting process tries to improve the sum-of-squared-error by trying negative values for c such that |c| is large. The values of f (x) are negative between -1 and 1 at c = −30, and so taking a negative value for c with |c| large makes the computed graph for f (x) identically zero between -1 and 1, again as shown in Figure 7.9. The next initial estimate does give a correct answer: * C = 25 * FIT (C), F TO M matherr: overflow error in cosh arg = 6.495189e+03 return value: 1.797693e+308 matherr: overflow error in cosh arg = 2.598076e+03 return value: 1.797693e+308 matherr: overflow error in cosh arg = 6.495289e+03 return value: 1.797693e+308 matherr: overflow error in cosh arg = 2.598116e+03 return value: 1.797693e+308 matherr: overflow error in cosh 267 arg = 6.495389e+03 return value: 1.797693e+308 matherr: overflow error in cosh arg = 2.598156e+03 return value: 1.797693e+308 final parameter values value error dependency 0.7094633599 0.0224051432 0 7 iterations CONVERGED best weighted sum of squares = 2.979701e-02 weighted root mean square error = 3.859858e-02 weighted deviation fraction = 2.585658e-02 R squared = 9.731768e-01 parameter C Note, however, that 7 iterations were required for convergence for this case. The next initial estimate leads to a common difficulty: * C = -2 * FIT (C), F TO M final parameter values value error dependency -3.0892392386 0.2894782089 0 7 iterations CONVERGED best weighted sum of squares = 2.035792e+00 weighted root mean square error = 3.190448e-01 weighted deviation fraction = 2.695622e-01 parameter C Here, the process converged to the incorrect value c = −3.089239. Examination of Figure 7.7 shows that this value corresponds to a local minimum of the sum-of-squared-error, S. In terms of the latitude and longitude analogy, the bottom of the valley that contained the starting point was found, but another deeper valley elsewhere was not detected. Thus, as shown in Figure 7.10, the right peak of h was fit to the data, without detecting that the left peak of h gives a better fit. The next initial estimate again finds this local minimum: * C = 10 * FIT (C), F TO M final parameter values value error dependency -3.0887892741 0.2897531343 0 10 iterations CONVERGED best weighted sum of squares = 2.035827e+00 weighted root mean square error = 3.190476e-01 weighted deviation fraction = 2.695820e-01 268 parameter C Figure 7.10: Graph of f (x) for c = −3.09. 269 In the above case, the search process overshot the correct solution. That is, the algorithm at c = 10 happened to generate a trial near the local minimum at c = −3.09 before it generated trials sufficiently close to the true minimum at c = .709. The search process then went astray, converging to the local minimum at c = −3.09. The last example shows that linear constraints can sometimes prevent this overshoot phenomenon. Observe the dialog: * CONSTRAINTS Z = {C>0} * C = 10 * FIT (C), F TO M CONSTRAINTS Z final parameter values value error dependency 0.7094748974 0.022404762 0 5 iterations CONVERGED best weighted sum of squares = 2.979701e-02 weighted root mean square error = 3.859858e-02 weighted deviation fraction = 2.585643e-02 R squared = 9.731768e-01 no active constraints parameter C Because the search process was prevented from using negative values for c by the linear constraint c > 0, it eventually converged to the correct value. For nonlinear curve-fitting, it is usually desirable to use MLAB to make pictures showing the agreement between the data and the fitted model. Also, the residuals: yi − f (xi1 , xi2 , ..., xin ; b1 , b2 , ..., bp ), for i = 1, 2, ..., m can be computed for the m data points. These residuals should be positive or negative randomly, each about half the time. If the residuals are almost all of the same sign in certain regions, a poor curve-fit or an inappropriate functional form should be suspected. For example, the residuals are positive and negative for the curve-fit of Figure 7.8 apparently randomly. (Note that the data points fall above and below the function graph with no obvious pattern.) However, the residuals are all positive for the curve-fits of Figures 7.9 and 7.10, agreeing with the observation that they are poor curve-fits. The magnitude of the root-mean-square error can also give helpful information about the correctness of the curve-fit; it should not be much larger than the ”noise” in the data, adjusted by the weights that were used. 270 7.15 INITIAL PARAMETER ESTIMATES FOR NONLINEAR MODELS As noted, the unknown parameters for nonlinear curve-fitting problems should be estimated as accurately as possible. If such estimates can not be obtained, curve-fits starting from several different initial estimates for the fitted parameters can be tried. Also, producing a graphical display of the weighted-sum-of-squared-error versus various selections of values for the parameters, as in Figure 7.7, (if possible) may help to find the best curve-fit. It also may help to compute the weighted-sum-of-squared-error at certain points throughout the region of interest. As an example, suppose that parameters A, B, and C in an MLAB functional form: * FUNCTION F(T) = A*EXP(B*T) + SIN(C*T) are to be fit to an m by 2 data matrix D with an m-vector of weights V. Assume that high and low estimates for A, B, and C are known, say: 6 ≤ A ≤ 9; −1.06 ≤ B ≤ −1.02; 0 ≤ C ≤ .1 The weighted-sum-of-squared-error S(A,B,C) is to be evaluated for various triples of values satisfying these constraints. The triple that minimizes S is then used as initial estimates for curve-fitting the parameters A, B, and C. It is decided to search uniformly, evaluating S for 120 triples corresponding to the 4 values 6:9 for A, the 5 values (-1.06):(-1.02):.01 for B, and the 6 values 0:.1:.02 for C. MLAB dialog for this process follows: * * * * * : : * FUNCTION F(T) = A*EXP(B*T)+SIN(C*T) FUNCTION G(T,A,B,C) = A*EXP(B*T)+SIN(C*T) FUNCTION S(A,B,C) = SUM(J,1,NROWS(D),V(J)*(D(J,2)-G(D(J,1),A,B,C))^2) N = 0 FOR I = 6:9 DO { \ FOR J = (-1.06):(-1.02):.01 DO { \ FOR K = 0:.1:.02 DO {N = N+1; M ROW N = I&’J&’K;}}} TYPE M ROW (1,2,7,120) : a 1: 2: 3: 4: 6 6 6 9 4 by 3 matrix -1.06 -1.06 -1.05 -1.02 0 0.02 0 0.1 271 * M = POINTS(S,M) * M = SORT(M,4) * TYPE M ROW 1 : a 1: 8 1 by 4 matrix -1.02 0.1 .846954933 * A = 8; B = -1.02; C = .1 * FIT (A,B,C), F TO D WITH WEIGHT V final parameter values value error dependency 4.6795085893 1.5539811937 0.9144956732 -0.5947033424 0.3363179636 0.9631001287 0.1087617401 0.1816061286 0.8749637384 4 iterations CONVERGED best weighted sum of squares = 2.153034e-01 weighted root mean square error = 3.281032e-01 weighted deviation fraction = 1.117593e-01 R squared = 9.348442e-01 parameter A B C Note that the asterisks (*) and colons (:) appearing at the beginning of command lines are printed by MLAB and should not be typed by the user. The second and third function definitions above express the weighted-sum-of-squared-error S(A,B,C) as an MLAB function. After setting N to 0, the next FOR command generates a 120 by 3 MLAB matrix M, which lists all triples such that the first column contains test values for A in 6:9, the second column contains test values for B in (-1.06):(-1.02):.01, and the third column contains test values for C in 0:.1:.02. The first TYPE command shows the first, second, seventh, and last rows of M. The evaluation of the POINTS expression adds a fourth column to M, which equals the weighted-sum-of-squared-error S(A,B,C) corresponding to the A, B, and C values in columns 1, 2, and 3. The rows of M are then sorted so that the fourth column is in ascending order. Since the first row of the sorted matrix is a minimum for S among these trials, it is typed. The values in columns 1, 2, and 3 of the first row are then used as initial estimates for A, B, and C. Note that the MLAB statement: * M = POINTS(S,CROSS(6:9,CROSS(-1.06:-1.02:.01,0:.1:.02))) which uses the MLAB CROSS operator creates the matrix M above more easily and efficiently than using nested FOR statements. The CROSS operator column-concatenates each row of the first matrix 272 with every row of the second matrix. If the columns of both matrices are in increasing order, the rows of the resulting matrix appear in lexicographic order. The Table 7.16 SUMMARY Assume the following: 1. Data points: n + 1 coordinates (xi1 , xi2 , ..., xin , yi ) with weight wi , for i = 1, 2, ..., m 2. Functional form: yj = fj (x1 , x2 , ..., xn ; b1 , b2 , ..., bp ; c1 , c2 , ..., cq ) for j = 1, 2, ..., m; where the arguments x1 , x2 , ..., xn are the independent variables; b1 , b2 , ..., bp are parameters to be fit; and c1 , c2 , ..., cq are fixed parameters. 3. Initial estimates for fitted parameters: b01 , b02 , ..., b0p 4. Fixed parameter values: c01 , c02 , ..., c0q 5. Constraint set, each constraint is one of the forms: r1 · b1 + r2 · b2 + ... + rp · bp < r0 r1 · b1 + r2 · b2 + ... + rp · bp = r0 r1 · b1 + r2 · b2 + ... + rp · bp > r0 6. Weighted-sum-of-squared-error: S(b1 , b2 , . . . , bp ) = m X i=1 wi · [yi − f (xi1 , . . . , xin )]2 A standard MLAB curve-fitting procedure for functional forms follows, with optional steps indicated by an asterisk. 1. Create MLAB matrices (via USE, DO, or matrix assignment commands) as follows: (a) An m by (n + 1) data matrix (b) An m-vector of data point weights 273 2. Create an MLAB function (via a USE, DO, or FUNCTION command) that represents the functional form f . Parameters may be represented by scalars or matrix identifiers. 3. Create an MLAB constraint set (via a USE, DO, or CONSTRAINTS command) containing all the linear constraints for the model. Matrix element parameters can not appear in MLAB linear constraints. 4. Create MLAB scalars or matrices (via USE, DO, or scalar or matrix assignment commands) corresponding to all initial estimates for fitted parameters and the known values for all fixed parameters of f . For nonlinear models, the initial estimates should be generated as carefully as possible. It is often desirable to evaluate the weighted-sum-of-squared-error for a variety of initial assignments to the fitted parameters before choosing the initial estimates. 5. Set MLAB FIT control variables LSQRPT, MAXITER, TOLSOS, and FITNORM, as necessary. 6. Execute an MLAB FIT command (directly or via DO command) which specifies the list of fitted parameters, functional form, data matrix, and weight vector. The list of fitted parameters may contain matrix names, in which case all elements of listed matrices are fitted parameters. Multiple clauses, each specifying a functional form and weighted data, may be used in the FIT command. 7. After examining the FIT command output, modify the model, continue curve-fitting, or prepare graphical displays, as needed. Using the above framework as a guide, the MLAB user can often construct DO files and SAVE data items that will substantially speed up data analysis involving curve-fitting of functional forms. In the following let CR denote a carriage return, F denote a function identifier; csi denote a constraint set name; sc1 and sc2 denote positive scalar constants; si denote a scalar identifier; SE1 denote a scalar expression; ME1 and ME2 denote matrix expressions; B1,B2,...,Bp denote scalar or matrix identifiers; and clause1,clause2,...,clausek denote functional form clauses. 1. MLAB Commands for Curve-fitting: (a) Constraint Set Command: • CONSTRAINTS csi = expressions Constraint terms sc, si, sc*si, and si/sc are separated by + or - to make expressions. Two expressions are separated by <, <=, =, >, or >= to make a constraint, e.g. A/4-2*B+C>1. (b) Functional Form Curve-fitting Commands: • FIT (B1,B2,...,Bp), F TO ME1 WITH WEIGHT ME2 This command fits a parameter list B1,B2,...,Bp of scalar or matrix identifiers of 274 a functional form F of n arguments to an m by (n + 1) data matrix ME1 with an m-vector of weights ME2. • FIT (B1,B2,...,Bp), clause1,clause2,...,clausek This command does multiple-clause curve-fitting. All clauses must be of the form F TO ME1 WITH WEIGHT ME2. If the clause WITH WEIGHT ME2 is omitted, all elements of the m-vector of weights will be set equal to 1. Typing “R” with no CR during any FIT overrides the current LSQRPT setting and toggles verbose printout about the fitting process; typing “Q” with no CR during any FIT terminates command at the end of the current iteration. (c) TYPE Command for Constraint Sets: • TYPE csi This command displays the constraint set. (d) Functional form linear models: • For any numerical values x01 , x02 , ..., x0n there exist numbers r0 , r1 , r2 , ..., rp such that for all b1 , b2 , ..., bp : f (x01 , x02 , ..., x0n ; b1 , b2 , ..., bp ) = r0 + r1 · b1 + r2 · b2 + ... + rp · bp 7.17 EXERCISES 1. Suppose that the functional form model: f (t) = sin(a · t)e−k·t is to be modelled to an m by 2 data matrix M. Assume that the variance of the dependent variable is proportional to the size of the independent variable, and that: .7 ≤ a ≤ 1.2 and .01 ≤ k ≤ .04 Design MLAB commands to: (a) set up the model, with linear constraints. (b) evaluate a weighted-sum-of-squared-error 24 times, for all pairs such that a is among .7, .8, .9, 1.0, 1.1 ,1.2, and k is among .01, .02, .03, .04, and use the pair producing the minimum weighted-sum-of-squared-error as initial estimates for a and k. (c) curve-fit the model to the data using these initial estimates. 275 2. Design a DO file that inputs a two-column matrix D and curve-fits polynomials of orders 0 (constant), 1 (straight line), 2 (quadratic), 3 (cubic), and 4 (quartic) to D successively, using weights all equal to 1. Use a 5 by 1 column vector as the list of polynomial coefficients, which are the fitted parameters. Also, a 5 by 1 column vector is to be created, containing the root-mean-square error for each curve-fit. 3. Suppose D is an arbitrary m by n matrix, where the first column contains measurements of an independent variable, and the last (n − 1) columns contain corresponding repeated measurements of a dependent variable. Construct a DO file which: (a) computes an m by 2 matrix M, where the first column contains the values of the independent variable, and the second column contains the means of the repeated measurements of the dependent variable. (b) computes an m by 1 column vector W of weights by the reciprocal-of-variances method. (c) curve-fits an exponential curve: y = K · ea·x with fitted parameters K and a, using initial estimates K = 1 and a = −.1, to this data. (d) draws a graph of the exponential curve and the computed data. The m data points are to be represented by horizontal bars of POINTTYPE STAR intersecting with vertical bars which extend one standard deviation above and one standard deviation below the horizontal bar. The unbiased sample standard deviation of each data point is computed from the (n − 1) repeated measurements for the dependent variable of the point; n > 2 is assumed. 4. Suppose that one has two data matrices MA and MB to curve-fit to the functional form: h(t) = sin(c · t + k) with respect to parameters c and k. Furthermore, suppose that c represents a physical constant which is the same for both experiments, but k represents a calibration constant that is different for the two different data matrices. How could MLAB be used to curve-fit for the best overall fit to c? 5. Which of the following define linear models? (a) The functional form: h(s, t) = a · e−b cot(t) + c · sin(t) with respect to a, b, and c. (b) The functional form: f (t) = (t2 + 3 · t − 5)−1 − b · sin(k · t2 ) with respect to b. 276 (c) The functional form in part (b) with respect to b and k. (d) The functional form: g(x, y) = sin2 (u3 · x) + cos2 (u3 · x) + y · elog(u) with respect to u. (Caution: the expression for g(x, y) can be simplified.) 6. Log into MLAB, and test your answers to exercises 1-4 by first assigning numerical values to scalars and matrices that were not specified. 277 The basic form of the MLAB FIT command, for curve-fitting to functional forms, are given by: FIT (X1,X2,...,Xn), clause1, clause2,..., clausek CONSTRAINTS csi where clausej has the form: Fj TO ME2(j-1) WITH WEIGHT ME2(j) for j = 1, 2, ... , k. Here, Fj describes a functional form used for curve-fitting, which is an MLAB function. The list (X1,X2,...,Xn) contains MLAB scalar or matrix identifiers. Each scalar identifier is a parameter to be fitted, and all elements of each matrix identifier are also parameters to be fitted. The values of these scalars and matrix elements when the FIT command is executed are the initial estimates for these parameters. New values will be given to these scalars and matrix elements in each iteration of the curve-fitting process. The matrices ME2(j-1) and ME2(j) are the data matrices and associated weight vectors respectively for the curve-fitting process. If a clause WITH WEIGHT ME2(j) is omitted, then weights equal to one are used. The word WEIGHT may be abbreviated by WT. csi is an optional MLAB constraint set for linear constraints on the fitted parameters. If there are no constraints, the CONSTRAINTS csi clause may be omitted. In the FIT command, each fit-clause has an associated weighted-sum-of-squared-error criterion. For the given functional forms and data, the iterative search process modifies the listed parameters (scalars and matrix elements) to seek the minimum sum of the k weighted-sum-of-squared-error criteria associated with all the clauses. If “Q” is typed during execution of a FIT command, the operation terminates at the completion of the current iteration. Setting the MLAB scalar LSQRPT equal to 8 (its default value) before giving the FIT command, causes MLAB output to be suppressed during execution of the command except for the final summary. Setting LSQRPT equal to 0 before giving the FIT command, causes all typed output to be suppressed. Typing “R” during execution of a FIT command causes a line or two of the iteration output to be typed. Table 7.8: FIT commands, for a functional form. 278 Consider the general problem of curve-fitting a functional form: y = f (x1 , x2 , ..., xn ; b1 , b2 , ..., bp ; c1 , c2 , ..., cq ) where x1 , x2 , ..., xn are the arguments of f ; b1 , b2 , ..., bp are the parameters of f to be fitted; and c1 , c2 , ..., cq are other parameters of f which are assigned fixed values. To set up the functional form in MLAB, the FUNCTION command FUNCTION F(X1,X2,...,Xn) = SE1 is used. Here, F denotes the MLAB identifier corresponding to the function f , and (X1,X2,...,Xn) is a list of MLAB identifiers naming the function arguments, denoted by x1 , x2 , ..., xn above. The scalar expression SE1 describes the function f , and involves the arguments x1 , x2 , ..., xn ; the fitted parameters b1 , b2 , ..., bp ; and the fixed parameters c1 , c2 , ..., cq as required. The MLAB user chooses either an MLAB scalar or a matrix element to correspond to each fitted and each fixed parameter. The fitted parameters must be assigned initial estimates b01 , b02 , ..., b0p , and the fixed parameters must be assigned numerical values c01 , c02 , ..., c0q by appropriate scalar or matrix assignment or input statements. Table 7.9: The general problem of curve-fitting a functional form. In general, let: y = f (x1 , x2 , ..., xn ; b1 , b2 , ..., bp ) be a functional form for a dependent variable y; independent variables x1 , x2 , ..., xn ; parameters b1 , b2 , ..., bp with unknown values; and possibly other parameters with fixed values. Then f determines a linear model with respect to b1 , b2 , ..., bp if and only if: For any numbers x01 , x02 , ..., x0n assigned to the arguments of f , there exist numbers r1 , r2 , ..., rp (depending upon x01 , x02 , ..., x0n and any fixed parameters) such that: f (x01 , x02 , ..., x0n ; b1 , b2 , ..., bp ) = r0 + r1 b1 + r2 b2 + ... + rp bp for all numerical values assigned to b1 , b2 , ..., bp . Table 7.10: Linear model functional form. 279 Chapter 8 SYSTEMS OF DIFFERENTIAL EQUATIONS IN MLAB MLAB has a built-in differential equation solver, which permits computation of numerical solutions for systems of differential equations. This chapter discusses: (1) conventions for setting up differential equation systems in MLAB, (2) the matrix-valued operator INTEGRATE which generates numerical solutions, (3) the variables METHOD, ERRFAC, ODERPT, MANDSW, JACSW, and DISASTERSW which are used to control the computation process, and (4) curve-fitting with models specified by systems of differential equations. 8.1 A FIRST ORDER DIFFERENTIAL EQUATION SOLVED IN MLAB Consider the linear differential equation: y ′ (x) = dy(x) x = −y + dx (x + 1)2 This is a first order differential equation because only the first derivative of the unknown function y appears. There are infinitely many functions y = y(x) that satisfy this equation, but an initial condition, e.g., y(0) = 5, can be specified to select a unique solution from the set of all solutions of the differential equation. In effect, that solution of the differential equation whose graph passes through the particular point (0, 5) in the plane is specified by the initial condition y(0) = 5. To set up the above differential equation and initial condition in MLAB, use the following commands: 280 * FUNCTION Y’X(X) = -Y+X/(X+1)^2 * INITIAL Y(0) = 5 The differential equation is represented by the FUNCTION command, which defines Y’X as a function with argument X and the appropriate defining scalar expression. That is, the differential equation is treated as a function definition for the derivative y ′ (x), in terms of the unknown function y(x) and other expressions involving x. Observe that y is written as if it were a scalar in the expression -Y+X/(X+1) ^2 defining Y’X. One could also use the more explicit expression -Y(X)+X/(X+1) ^2, but Y(X) is implied when Y alone is written, so Y alone is sufficient. The MLAB INITIAL command is used to specify the initial condition y(0) = 5, in the obvious way shown. The function Y is now implicitly known to MLAB by means of the differential equation for Y’X and the initial condition for Y. As usual, the TYPE command will describe the associated data items as shown in the dialog: * TYPE Y,Y’X INITIAL Y(0) = 5 FUNCTION Y’X(X) = (-Y)+X/(X+1)^2 The response is essentially a repeat of the INITIAL and FUNCTION commands. Note that Y is an MLAB data item of data type initial; it is by this means that MLAB “knows” the corresponding function Y is defined by a system of one or more differential equations. Only the MLAB INITIAL command can be used to create or modify data items of initial type, and these data items are used only to specify initial conditions for systems of differential equations. The implicitly-defined function Y can be evaluated numerically by any one of several methods. The first method is to simply evaluate Y as if it were an explicitly defined function. For example, * M = Y ON 1:5 * TYPE M : a 1: 2: 3: 4: 5: 6: 6 by 1 matrix 5 1.97155402 .874696273 .449159263 .273267675 .193620648 The second method uses the POINTS operator and returns a two column matrix with the independent variable in column 1 and the solution to the differential equation in column 2. For example, observe the following: 281 * M = POINTS(Y,0:5) * TYPE M M: a 1: 2: 3: 4: 5: 6: 0 1 2 3 4 5 6 by 2 matrix 5 1.97155402 .874696273 .449159263 .273267675 .193620648 A third method uses the INTEGRATE operator to invoke the differential equation solver to produce a numerical solution. (Note that INTEGRATE should not be confused with the scalar operator INTEGRAL described in Section 2.6). The use of INTEGRATE is shown in the following dialog: * M = INTEGRATE(Y’X,0:5) * TYPE M M: a 1: 2: 3: 4: 5: 6: 0 1 2 3 4 5 6 by 3 matrix 5 1.97155402 .874696273 .449159263 .273267675 .193620648 -5 -1.72155777 -.652474248 -.261659281 -.113267675 -5.47317594E-2 The first argument(s) to INTEGRATE is(are) the name(s) of the differential equation(s) in the system. (In this example, the single name Y’X specifies the single corresponding differential equation.) The last argument is a column vector of values for the independent variable X. Column 1 of the matrix M obtained from the INTEGRATE operator contains this column vector (which, here, is 0:5). Of course, one would usually solve for more than the six values in this example, in order to obtain an acceptable graph of the function y(x). Column 2 of the matrix obtained from the INTEGRATE operator above contains the corresponding values for Y, and column 3 contains the corresponding values for Y’X. That is, M COL 2 is like Y ON 0:5, and M COL 3 is like Y’X ON 0:5. More precisely, M(I,2) is the value of Y(M(I,1)), and M(I,3) is the value of Y’X (M(I,1)) for I=1,2,...,NROWS(M). So, the INTEGRATE operator allows numerical computation of both the function Y and its derivative Y’X, which were implicitly defined by the differential equation and initial condition above. The differential equation and initial condition given above have a precise analytical solution, as follows: 282 y(x) = 1 + 4 · e−x (1 + x) This function and its derivative in MLAB are evaluated as follows: * FUNCTION F(X) = 1/(1+X)+4*EXP(-X) * TYPE (0:5) &’ (F ON 0:5) &’ (F’X ON 0:5) : a 1: 2: 3: 4: 5: 6: 0 1 2 3 4 5 6 by 3 matrix 5 1.97151776 .874674466 .449148273 .273262556 .193618455 -5 -1.72151776 -.652452244 -.261648273 -.113262556 -5.47295658E-2 Note that the matrix M above generated by the differential equation solver is in close, but not exact, agreement with the theoretical result. (The maximum error is less than .0002.) The accuracy of the INTEGRATE command’s numerical solution may be controlled by setting the control variable ERRFAC, which will be discussed later. 8.2 COUPLED FIRST-ORDER DIFFERENTIAL EQUATIONS SOLVED IN MLAB Frequently, a mathematical model will involve a system of several interrelated first-order differential equations and initial conditions for the corresponding unknown functions. The MLAB user can also generate numerical solutions for such systems with the INTEGRATE operator. Consider a simple example from idealized enzyme kinetics. Suppose one molecule of an enzyme E combines reversibly with one molecule of a substrate S to form an intermediate enzyme-substrate complex C which reacts irreversibly to release a product material P and the original unmodified enzyme. This process may be represented by the reaction: E+S k1 ⇀ ↽ k2 C 283 k3 → P +E where k1 , k2 , and k3 are the rate constants of the reaction. Let S(t), E(t), C(t), and P (t) be the concentrations of S, E, C, and P respectively at time t. E0 is the total concentration of enzyme, whether free or coupled, and S0 is the total concentration of substrate, whether free, enzyme-bound, or converted to the product. Then E0 = E(t) + C(t) S0 = S(t) + C(t) + P (t) Assume the initial concentrations at time zero of the enzyme-substrate complex C and the product material P are zero. Thus C(0) = 0; P (0) = 0; E(0) = E0 ; S(0) = S0 The law of mass-action states that the reaction rates are proportional to the product of the reactants, where the rate constants k1 , k2 and k3 are the proportionality constants. Thus, the rate at which S will be converted to C is k1 · S(t) · E(t), and the rate at which S will be formed from C is k2 · C(t). Hence, the differential equation: S ′ (t) = dS = −k1 · S(t) · E(t) + k2 · C(t) = −k1 · S(t) · [E0 − C(t)] + k2 · C(t) dt describes how the concentration of S will change with time. Similarly, the rate at which C will be formed from E and S is k1 · S(t) · E(t), the rate at which C will be converted back to E and S is k2 cdotC(t), and the rate at which C will be converted to P and E is k3 · C(t). Hence, the differential equation: C ′ (t) = dC = k1 · S(t) · E(t) − (k2 + k3 ) · C(t) = k1 · S(t) · [E0 − C(t)] − (k2 + k3 ) · C(t) dt describes how the concentration of C will change with time. Since the rate at which P will be formed from C is k3 · C(t), the differential equation: P ′ (t) = dP = k3 · C(t) dt 284 describes how the concentration of P will change with time. In addition to the three differential equations giving S ′ (t), C ′ (t), and P ′ (t) by expressions involving the unknown functions S(t), C(t), and P (t) and known constants, there are initial conditions previously given for time t = 0 as follows: S(0) = S0 ; C(0) = 0; and P (0) = 0 In MLAB the FUNCTION and INITIAL commands are used to set up the system of differential equations as shown in the command sequence: * * * * * * FUNCTION S’T(T) = -K1*S*(E0-C) + K2*C FUNCTION C’T(T) = K1*S*(E0-C) - (K2+K3)*C FUNCTION P’T(T) = K3*C INITIAL S(0) = S0 INITIAL C(0) = 0 INITIAL P(0) = 0 Again, differential equations are treated as MLAB function definitions for the derivatives S’T, C’T, and P’T of the unknown functions S, C, and P. The INITIAL command of MLAB sets up initial conditions for S, C, and P, as required to complete the differential equation system. n first-order differential equations will require n initial conditions. To numerically evaluate S, C, and P, appropriate values are first assigned to all scalar constants, and then the INTEGRATE operator is applied. One sample calculation is given in the following MLAB dialog: * * * * K1 = .0001; K2 = .01; K3 = .01 E0 = 1000; S0 = 10000 U = INTEGRATE(S’T,C’T,P’T, 0:10) TYPE ODESTR ODESTR = T S S’T C C’T P P’T * TYPE U COL 1:3, U COL(1, 4, 5), U COL(1, 6, 7) : a 1: 2: 3: 4: 5: 6: 7: 8: 0 1 2 3 4 5 6 7 11 by 3 matrix 10000 9383.1931 9152.31555 9057.62222 9014.5455 8991.60794 8976.61348 8964.77087 -1000 -356.827294 -141.128528 -60.98051 -29.9686069 -17.776736 -12.9478844 -11.0293782 285 9: 8 10: 9 11: 10 : a 1: 2: 3: 4: 5: 6: 7: 8: 9: 10: 11: 0 1 2 3 4 5 6 7 8 9 10 : a 1: 2: 3: 4: 5: 6: 7: 8: 9: 10: 11: 0 1 2 3 4 5 6 7 8 9 10 8954.18148 8944.09154 8934.20095 -10.2653884 -9.96067162 -9.83889007 11 by 3 matrix 0 613.211049 836.66009 922.490854 956.148559 969.447956 974.717571 976.800983 977.617647 977.9296 978.040238 1000 350.695183 132.761927 51.7556015 20.4071213 8.08225647 3.20070866 1.26136837 .489211958 .181375622 5.84876871E-2 11 by 3 matrix 0 3.59584832 11.0243578 19.8869249 29.3059407 38.9440997 48.6689501 58.4281439 68.200874 77.9788642 87.7588146 0 6.13211049 8.3666009 9.22490854 9.56148559 9.69447956 9.74717571 9.76800983 9.77617647 9.779296 9.78040238 The string ODESTR is set whenever INTEGRATE is executed; it contains the labels of the columns of the output matrix. In this case, the first column of the matrix U holds the values of the independent variable T, the second column of U holds values of the function S, the third column of U holds values of the function S’T, the fourth column of U holds values of the function C, the fifth column of U holds values of the function C’T, the sixth column of U holds values of the function P, and the seventh column of U holds values of the function P’T. Plots of S, C, and P versus T shown in Figure 8.1 may be produced as shown in the following set of MLAB commands: * U = INTEGRATE(S’T,C’T,P’T,0:10:.1) * WINDOW 0 TO 10, 8000 TO 10000 286 Figure 8.1: Plots of S(t), C(t), and P(t). * * * * * * * * * * * * * * * * * DRAW U COL (1,2) LEFT TITLE "SUBSTRATE (S)" BOTTOM TITLE "TIME (T)" FRAME 0 TO .5, .5 TO 1 W1 = W DRAW U COL (1,4) WINDOW 0 TO 10, 0 TO 1000 LEFT TITLE "ENZYME-SUBSTRATE COMPLEX (C)" BOTTOM TITLE "TIME (T)" FRAME .5 TO 1, .5 TO 1 W2 = W DRAW U COL (1,6) WINDOW 0 TO 10, 0 TO 100 LEFT TITLE "PRODUCT MATERIAL (P)" BOTTOM TITLE "TIME (T)" FRAME .25 TO .75, 0 TO .5 VIEW Of course, new values could be assigned to the scalars K1, K2, K3, E0, and S0, and the INTEGRATE 287 operator could be used to obtain new numerical solutions, as often as required. Observe that the INTEGRATE operator again has the differential equation specification (here, S’T, C’T, and P’T) as its first three arguments, and a column vector of values for the independent variable (here, the times 0:10) as its fourth argument. The resulting matrix U again has the specified vector as its first column. Also, columns 2, 3, 4, 5, 6, and 7 give the corresponding values for S(U(I,1)), S’T(U(I,1)), C(U(I,1)), C’T(U(I,1)), P(U(I,1)), and P’T(U(I,1)), respectively, for I = 1, 2, ..., NROWS(U). That is, each unknown function and its derivative are given successively in the columns of U following the first. The order of the columns is the same as the order of the function derivatives specified in the INTEGRATE operator. Although it has not been illustrated, the column vector of independent variable values given as the last argument to the INTEGRATE operator need not be a sequence of equally-spaced, or even unidirectional values. Any desired sequence of values may be specified. Differential equations often arise in situations in which the rate of change at any time is a function of a value at a previous time. Such a differential equation is said to have a delay term. An example of this is a model of the population of an isolated colony of animals. This model will take into account the diminishing of the growth rate as the population increases due to overcrowding and shortage of food. This diminishing effect will take place after a certain amount of time, r, called the lag time. The population will grow according to a proportionality constant, k; and the growth rate will diminish as the population approaches another constant, p. This model is defined as n′ (t) = k · (1 − n(t − r) ) · n(t) p and is defined in MLAB by the statements: * FUNCTION N’T(T) = K*(1-N(T-R)/P)*N(T) * INITIAL N(0) = N0 This is a perfectly legitimate MLAB ordinary differential equation model definition. It may be integrated as shown by the following dialog: * * * * * N0 = 1 P = 50 K = .5 R = 2 TYPE INTEGRATE(N’T,1:10) : a 1: 1 10 by 3 matrix 1.63231881 .799836218 288 2: 3: 4: 5: 6: 7: 8: 9: 10: 2 3 4 5 6 7 8 9 10 2.66436437 4.33528933 6.99557018 11.1366652 17.3491089 26.1231128 37.3497516 49.5466991 59.4770903 1.304811 2.09612954 3.30946766 5.08077898 7.44985736 10.1292169 12.1545347 11.7793934 7.52399967 In this model MLAB uses N0 as the value for N for any time before T = 1. Next, consider the two differential equations: dx dt dy dt dy dt dx = x+t· dt = 2·t−t· in the two unknown functions x(t) and y(t), with initial conditions: x(0) = 0; y(0) = 0 The following MLAB dialog produces an error message because of the circularity of X’T: * FUNCTION X’T(T) = 2*T -T*Y DIFF T(T) * FUNCTION Y’T(T) = X + T*X DIFF T(T) * INITIAL X(0) = 0 * INITIAL Y(0) = 0 * M = INTEGRATE(X’T,Y’T, 0:5) ##Error: stack space too low; probable infinite recursion To avoid this circularity, eliminate dy/dt from the two differential equations above by multiplying the second equation by −t and adding the result to the first. The resulting equation and the second differential equation above yield the equivalent system: dx dt dy dt 2·t−t·x 1 + t2 dx = x+t· dt = 289 Then x(t) and y(t) can be numerically evaluated as shown in the following MLAB dialog: * * * * * * FUNCTION X’T(T) = (2*T - T*X)/(1 + T*T) FUNCTION Y’T(T) = X + T*X DIFF T INITIAL X(0) = 0 INITIAL Y(0) = 0 M = INTEGRATE(X’T,Y’T,0:5) TYPE M COL 1:3, M COL (1,4,5) : a 1: 2: 3: 4: 5: 6: 0 1 2 3 4 5 : a 1: 2: 3: 4: 5: 6: 0 1 2 3 4 5 6 by 3 matrix 0 .585834027 1.10558751 1.36755442 1.51493649 1.60777408 0 .707041658 .357763487 .189733946 .114132694 7.54280607E-2 6 by 3 matrix 0 .585815653 2.21117613 4.10266227 6.05974405 8.03886791 0 1.29295578 1.82111252 1.93675472 1.97146672 1.98491439 The general techniques in MLAB for setting up a system of first-order differential equations and obtaining numerical solutions of such systems by the INTEGRATE operator are given in Table 8.1 and Table 8.2. 8.3 HIGHER ORDER DIFFERENTIAL EQUATION SOLVING IN MLAB Consider the third-order differential equation: d3 y dy + − sec(x) = 0 3 dx dx or 290 y ′′′ (x) + y ′ (x) − sec(x) = 0 with three initial conditions: y(0) = 0; y ′ (0) = 0; y ′′ (0) = 2. This is a third-order differential equation because the third derivative of the unknown function, y(x), is the highest order derivative appearing in the equation. It can be solved numerically in MLAB with the following commands: * * * * * * FUNCTION Y’’’X(X) = -Y’X+SEC(X) INITIAL Y’’X(0) = 2 INITIAL Y’X(0) = 0 INITIAL Y(0) = 0 M = INTEGRATE(Y’’’X,0:1:.25) TYPE M M: a 5 by 7 matrix 1: 0 2: 3: 4: 5: 2 0 0.25 2.18786625 6.47793736E-2 0.5 2.25656185 .265676269 0.75 2.22508839 .607080371 1 2.13893893 1.08725238 1 0 .506025425 .526059631 5.55285646E-2 1.08396538 -.279225662 1.64592704 -.340972748 2.19178847 0 2 .526059631 2.18786625 1.08396538 2.25656185 1.64592704 2.22508839 2.19178847 2.13893893 The resultant matrix M has 7 columns. The values held in each column can be determined by typing: * TYPE ODESTR to which MLAB responds: ODESTR = X Y’X’X Y’X’X’X Y’X Y’X’X 291 Y Y’X As before, ODESTR is a string variable that holds the names of the columns in the matrix returned by the INTEGRATE operator. In this case, column 1 of matrix M contains values of the independent variable X; column 6 contains the corresponding values of the function Y; columns 4 and 7 contain values of the first derivative of the function Y; columns 2 and 5 contain values of the second derivative of the function Y; and column 3 contains values of the third derivative of the function Y. If only values of the unknown function Y are required, the ON operator can be used instead of the INTEGRATE operator; if only values of the independent variable and the corresponding values of the unknown function Y are required, the POINTS operator can be used instead of the INTEGRATE operator. The INTEGRATE operator returned a 7 column matrix because MLAB solves the third-order differential equation by transforming it into three first-order differential equations. It introduces new unknown functions for the lower order derivatives of y, say z(x) = y ′ (x) and w(x) = y ′′ (x). Then, the above differential equation is equivalent to the system: dy dx dz z ′ (x) = dx dw w′ (x) = dx y ′ (x) = = z(x) = w(x) = −z(x) + sec(x) with initial conditions: y(0) = 0 z(0) = 0 w(0) = 2 The same resultant matrix M would have been obtained if the following MLAB commands were given: * * * * * * * FUNCTION Y’X(X) = Z FUNCTION Z’X(X) = W FUNCTION W’X(X) = -Z+SEC(X) INITIAL Y(0) = 0 INITIAL Z(0) = 0 INITIAL W(0) = 2 M = INTEGRATE(W’X,Z’X,Y’X, 0:1:.2) 292 It is always possible to transform a given system of differential equations in canonical form, i.e. with the highest order derivative appearing linearly, into a first-order system. 8.4 CONTROLLING THE DIFFERENTIAL EQUATION SOLVER The special scalar quantities METHOD, ERRFAC, ODERPT, MANDSW, JACSW, and DISASTERSW are used to control the MLAB procedure for the numerical solution of systems of differential equations. These parameters control the options for the solution method, the tolerance level, the reporting of intermediate output, interpolation or no interpolation, Jacobian matrix calculation method, and the error handling method. To explain these options, it is helpful to first describe briefly the operation of the differential equation solver. Suppose that a system of n differential equations is to be solved: yj′ (x) = hj (x, y1 , y2 , ..., yn ), yj (u) = zj , j = 1, 2, ..., n for a sequence of values, a1 , a2 , ..., ak , specified in an INTEGRATE matrix expression, for the independent variable x. Call the matrix produced by applying the INTEGRATE operator the result matrix. The differential equation solver generates a potentially very large matrix called the solution matrix, which is similar to the result matrix. Like the result matrix, the solution matrix has 2n+1 columns corresponding to the independent variable and n pairs consisting of values for an unknown function and its derivative. The solution matrix is generated one row at a time, and generation of a row is called a step. The first column of the solution matrix corresponds to a sequence of values, b1 , b2 , ... , bt , for the independent variable x beginning at x = u. The interval length: |bj − bj−1 | is called the step-size for the j th step, 1 < j ≤ t. It is important to note that the vector of independent variable values specified in an INTEGRATE matrix expression generally has little to do with the step sizes used in solving the differential equation system. These are determined automatically by the characteristics of the system being solved and the optional control settings on the differential equation solver. In particular, the stepsizes are often different for different steps. Typically, there are many more rows in the solution matrix than in the result matrix, since it is necessary to keep the step sizes small in order to control the error in each step of the computation. The solution matrix is complete when the last specified value for x in the INTEGRATE matrix expression is passed, that is, when ak ≤ bt for increasing values b1 , b2 , ... , bt or ak ≤ bt for decreasing values b1 , b2 , ... , bt . 293 The result matrix is then computed using the solution matrix and is returned as the value of the INTEGRATE operator. The MLAB user has no access to the solution matrix; it is discarded when the differential equation solver completes a numerical solution. The control variable MANDSW determines how the result matrix is computed from the solution matrix. If MANDSW is FALSE (= 0), larger step-sizes will be used and each row of the result matrix is obtained by a cubic polynomial interpolation formula applied to the solution matrix. That is, for any i ≤ k, there may exist j such that: bj < ai < bj+1 or bj > ai > bj+1 and so the result matrix row is not in the solution matrix. If MANDSW is TRUE (6= 0), then no interpolation is specified and each result matrix row is forced to belong to the solution matrix. That is, the step-size is reduced, where necessary, so that for each i ≤ k, there exists j ≥ 1 such that: bj = ai because bypassing the next specified value of the independent variable is not permitted. More accurate results can be obtained with no interpolation for certain sensitive differential equations, although the user suffers a penalty of increased computer memory requirements and usually also an increase in computation time. MANDSW is FALSE (0) unless specified otherwise by the user. No known method for solving systems of differential equations will work well for all problems. In MLAB, there are four available methods, which provide state-of-the-art performance with respect to a wide variety of problems encountered in applications: • Adams Method • Gear Method • Gear-Shrager Method • mixed Adams/Gear Combination Method The value of the control variable METHOD determines which method is to be used. The Adams method, which is selected by setting METHOD equal to ADAMS (ADAMS is the value 1), performs well for a wide variety of problems, but poorly for systems of stiff differential equations. (Stiff systems tend to involve widely varying magnitudes for the system derivatives. For example, in a situation where a toxin is being released very slowly from fat into the bloodstream in a period of weeks while 294 electrolyte balances in the blood are changing from minute to minute, the model is very likely to lead to a stiff system.) The Gear method is an algorithm appropriate for the situation of stiff differential equations. MLAB has two variants of the Gear method implemented in the differential equation solver. In the first variant, which is selected by setting METHOD equal to GEAR (3), at each step, a cubic polynomial approximation to the solution is used. In the second variant, which is selected by setting METHOD equal to GEAR2 (2), a quadratic approximation to the solution is used at each step. MLAB also can combine the Adams and the Gear methods. It makes internal tests of the stiffness of the differential equations system during the numerical computations, alternating between the two methods, according to which method is indicated as most favorable. This method is used if METHOD is set equal to MIXED (0). This is the default method that MLAB uses if the user does not specify another method. When solving systems of differential equations, Gear’s method and its variants require estimates of a Jacobian matrix; these are partial derivatives of one unknown function with respect to the independent variable and the other unknown functions. The MLAB variable JACSW is used to determine how the Jacobian matrix is to be computed. It may take the following values: • 0: means that numerical partial derivatives are to be used. • 1: means that symbolic partial derivatives are to be used. • 2: means that the partial derivatives are to be computed only once, numerically. The default value of JACSW is 1 so that symbolic partial derivatives are computed unless the user specifies otherwise. It is usually more accurate and faster to use symbolic partial derivatives in computing the Jacobian matrix used with Gear’s method. However, for large and complicated differential equation systems, computing the symbolic partial derivatives may exhaust the available space for holding functions. In this event, it may still be possible to proceed using a numerical Jacobian. The scalar ERRFAC is the tolerance level. It specifies the error that will be acceptable in a single step (computation of one row of the solution matrix) of the solver operation. It is a small positive number such as .001 or .0001. For example, the tolerance level .0001 specifies that a .01% error or less in computing the next row of the solution matrix is acceptable, assuming that the preceding rows are correct. Note that this does not prevent the possibility of buildup of substantial errors over many steps due to round-off and truncation. Decreasing the value of ERRFAC usually increases the accuracy of the computation up to a certain point. Decreasing the tolerance level, however, tends to decrease the step-size, and so increases the amount of numerical computation and hence numerical error. So, there are limits to the improvement obtainable by decreasing the tolerance level. If the step-size becomes too small, the procedure may multiply the tolerance level by 10 295 in order to prevent the solution matrix from growing too large and to avoid the use of too much computer time. When this occurs, a typical error message will be: t = 199.995597, errfac = 0.001, eqn #:7, truncation error = 2.853873 The scalar control variable DISASTERSW determines how error tolerance violations are handled. The alternatives for DISASTERSW are: • -2: do not report errors, and increase tolerance indefinitely, as required. • -1: do not report errors, and increase tolerance as required. If the internal value of ERRFAC becomes greater than 1.2, then terminate the integration. • 0: report errors and increase tolerance as required. If the internal value of ERRFAC becomes greater than 1.2, then terminate the integration. • 1: report errors and increase tolerance five times. If it would be necessary to increase the tolerance again, then terminate the integration. • 2: report errors and increase tolerance five times. If it would be necessary to increase the tolerance again, then continue the solution with fixed step-size. • 3: report errors and increase tolerance as required. If the internal value of ERRFAC becomes greater than 1.2, then continue the solution with fixed step-size. • 4: force the solution from the beginning with a large fixed step-size of 1/80 of the total integration interval. • 5: force the solution for one step. Do not increase the tolerance. Do not report any error. • 6: force the solution for one step. Do not increase the tolerance. Type out an error report. The default value of DISASTERSW is 6. Errors of the sort regulated by DISASTERSW are associated with the presence of singularities in the derivative functions or with steep changes in the solution of the differential equation system, i.e. Lipschitz condition violations. The numerical algorithm becomes less accurate near these points and the requested per-step tolerance may be unobtainable. When derivative functions with singularities are known to be present, as for example when a stepfunction appears, then DISASTERSW = -1 is often the best option. ODERPT is a scalar which controls intermediate screen output from the differential equation solver. It may take the following values: • the value 0 means no itermediate reporting. 296 • the value 1 means report independent variable value, step size, and method at each step. • the value 2 means report the independent variable value, step size, method, and derivative values at each step. • the value 3 means report only the summary information after solving is complete. This includes the number of steps taken and the number of derivative function evaluations and Jacobian evaluations. This reporting is useful to identify regions of stiffness in a differential equation system. The default value of ODERPT is zero. During the INTEGRATE command execution, the user may request information about the progress of the solution process by striking the “R” key (for “Report”). In such reports, the independent variable is referred to as T and the solution of the differential equation is referred to as Y. A second “R” will toggle reporting off again. The user may also quit the INTEGRATE process by typing “Q” (for “Quit”). It is beyond the scope of this Beginner’s Guide to describe the methodology and mathematical theory associated with the differential equation solver. Further discussion and references may be found in the bibliography. As previously noted, the tolerance level only controls the error of individual steps, and it is possible that much larger errors may accumulate over many steps. Unfortunately, the analysis of numerical and algorithmic error in solving a system of differential equations involves difficult mathematical problems of the stability or instability of such systems. The MLAB algorithms have no provision for computing overall estimates of error occurring during the numerical solution of differential equation systems. Perhaps the user will have available an error analysis for the system under consideration. If not, varying the tolerance level (perhaps dividing by 10) and recomputing one or more times can be tried. If there are large discrepancies between the numerical solutions at different tolerance levels, one should conclude that there is too much instability to rely upon any numerical solution. Other obvious warnings are given by MLAB messages for inability to maintain the tolerance level, singularities, arithmetic overflow, division by zero, exponentiation underflow or overflow, and so on, during the numerical solution of the system as illustrated in the MLAB dialog: * FUNCTION Y’T(T) = 1/(IF T<1 THEN .5 ELSE IF T<2 THEN -.5 ELSE 0) * INITIAL Y(0) = 1 * M = INTEGRATE(Y’T, 0:3:.5) 297 8.5 AN EXAMPLE OF CURVE-FITTING A DIFFERENTIAL EQUATION Like other mathematical models, systems of differential equations may contain scalar parameters with unknown values. The MLAB FIT command can then be used to search for parameter values that minimize the weighted-sum-of-squared-error between functions defined by the differential equation model and the experimental data. Models defined by systems of differential equations should be treated like nonlinear functional form models. The problems given in Section 7.14 of Chapter 7 may also arise for differential equation models. As an example of the FIT command applied to a differential equation system, consider Legendre’s equation: 2·x· d2 y = dx2 dy dx − c · (c + 1) · y 1 − x2 Assume an MLAB matrix YD exists that represents experimental measurements of a function y(x) approximately equal to a solution of Legendre’s equation. The initial condition y(0) = 0 is known, but only rough estimates of y ′ (0) and the parameter c are available. The following MLAB dialog adjusts the parameters c and y ′ (0) so that the corresponding Legendre’s equation solution is close to the experimental measurements: * YD COL 1 = 0:.5:.05 * YD COL 2 = LIST(0,.02179195,.04390796,.06505254,.08783066,.1095252,.1308729,\ : .1501906,.1703068,.1905134,.2105629) * FUNCTION Y’’X(X) = (2*X*(Y’X)-C*(C+1)*Y)/(1-X*X) * INITIAL Y(0) = 0 * INITIAL Y’X(0) = K * C = 1; K = 1 * FIT (C,K), Y TO YD final parameter values value error dependency parameter 1.2915176399 0.0283143124 0.818706264 C 0.4399303423 0.0015101591 0.818706264 K 4 iterations CONVERGED best weighted sum of squares = 3.377390e-06 weighted root mean square error = 6.125892e-04 weighted deviation fraction = 3.940699e-03 R squared = 9.999310e-01 The Legendre’s equation model was set up for an MLAB FIT command just as it would be set up for numerical evaluation using an INTEGRATE operator. The parameters C and K in the differential 298 equation system represent the unknown values of c and y ′ (0), respectively; and C and K were set equal to 1 as initial guesses. The FIT command is used for a differential equation model similarly to its previously defined use for functional forms. As shown in the example, a differential equations system FIT command can adjust parameters appearing in differential equation FUNCTION commands, in INITIAL commands, or in both. (If one of the system conditions has the form INITIAL Y(A) = B, then B can be fit but not A.) As usual, the FIT command above changes the values of the fitted parameters C and K to new values (hopefully, optimum) found by the search process. As usual, the fitted system can be numerically solved by the INTEGRATE expression. Appropriate MLAB dialog for continuing the above example is shown below: * TYPE C,K C = 1.29151764 K = .439930342 * YC = POINTS(Y,0:.5:.05) * TYPE YC, YD YC: a 1: 2: 3: 4: 5: 6: 7: 8: 9: 10: 11: 0 0.05 0.1 0.15 0.2 0.25 0.3 0.35 0.4 0.45 0.5 YD: a 1: 2: 3: 4: 5: 6: 7: 8: 9: 10: 11: 0 0.05 0.1 0.15 0.2 0.25 0.3 0.35 0.4 0.45 0.5 11 by 2 matrix 0 .021987713 4.39223598E-2 6.57496541E-2 8.74127844E-2 .108850927 .129997448 .150777641 .171105703 .190880623 .209980237 11 by 2 matrix 0 0.02179195 0.04390796 0.06505254 0.08783066 0.1095252 0.1308729 0.1501906 0.1703068 0.1905134 0.2105629 299 Figure 8.2: Experimental and fitted values of Legendre’s equation. * * * * * DRAW YC DRAW YD LT NONE PT CIRCLE BOTTOM TITLE "X" LEFT TITLE "Y" VIEW Figure 8.2 and a comparison of the second columns of YD with YC show that there is close agreement between the data and the fitted model. 8.6 AN EXAMPLE OF A BOUNDARY VALUE DIFFERENTIAL EQUATION Numerical solutions of boundary value problems can be generated by curve-fitting parameters in the INITIAL commands. This is often called the shooting method. For example, consider the differential equation problem: 300 d2 y dy = e−y · −x+1 dx2 dx with the boundary conditions y(0) = 3 and y(1) = 4. One initial condition is y(0) = 3; but the other initial condition, y ′ (0), is not available. However, there is a condition for y(1). To solve numerically, a parametric initial condition can be set up, say y ′ (0) = k, and then k can be fit so that y passes through the point (1, 4). The MLAB dialog is shown below: * FUNCTION Y’’X(X) = (Y’X)*EXP(-Y)-X+1 * INITIAL Y(0) = 3 * INITIAL Y’X(0) = K * K = 1 * FIT (K), Y TO LIST(1,4)’ final parameter values value error dependency 0.6498070118 0 0 5 iterations CONVERGED best weighted sum of squares = 0.000000e+00 weighted root mean square error = 0.000000e+00 weighted deviation fraction = 0.000000e+00 R squared = 1.000000e+00 parameter K If the INTEGRATE operator is used to numerically evaluate the above system with y ′ x(0) = .649804, the boundary value condition y(1) = 4 is satisfied. 8.7 THE FIT COMMAND FOR DIFFERENTIAL EQUATIONS The FIT command can be used for curve-fitting systems of differential equations. Since the differential equation solver is invoked by such FIT commands, the values of METHOD, JACSW, DISASTERSW, MANDSW, ODERPT, and ERRFAC control the operation of the differential equation solver while executing within the FIT command. Furthermore, the characters “Q” and “R” can be used here just as they are used during the evaluation of an INTEGRATE operator. A differential equations FIT command may have several clauses, referring to a system of differential equations in some clauses and to functional forms in others. It is convenient, but not required, that the data matrices in the different clauses all have the same first column. For example, consider a particle that moves on the curve: 301 y 2 (t) = 4 · [ k · t2 + k · t + (4 − 1.5 · k)] 2 with a velocity such that: dx =k·t+k dt at all times, and passes through the point (4, 4) at time t = 1 with positive y-component. Suppose the constant k is to be curve-fit using measurements for x(t) and y(t) that were obtained at certain times during an experiment and were entered in data matrices DX and DY, respectively. Then the following MLAB dialog shows the process of fitting to estimate the shared parameter k: * DX COL 1 = 1:10 * DX COL 2 = LIST(4.56,13.14,20.23,29.07,35.53,52.32,63.43,82.37,99.78,118.23) * DY COL 1 = 1:10 * DY COL 2 = LIST(5,.36,10.89,9.33,11.68,12.28,18.63,18.89,15.23,18.5) * FUNCTION X’T(T) = K*T + K * INITIAL X(1) = 4 * FUNCTION Y(T) = 2*SQRT(K*T*T/2 + K*T + (4-1.5*K)) * K = 4 * FIT(K), X TO DX, Y TO DY final parameter values value error dependency parameter 1.99700586 0.0304029348 0 K 2 iterations CONVERGED best weighted sum of squares = 1.603790e+02 weighted root mean square error = 2.905340e+00 weighted deviation fraction = 2.844207e-02 R squared = 9.925548e-01 Table 8.3 and Table 8.4 show the form of the FIT command when differential equations are involved. 8.8 SUMMARY Assume the following: • Data points: coordinates (xi , vi ) with weights wi , for i = 1, 2, ..., m 302 • Differential equation system: yj′ (x) = hj (x, y1 (x), y2 (x), ..., yn (x)); b1 , b2 , ... , bp ; c1 , c2 , ... , cq with initial conditions yj (u) = zj for j = 1, 2, ..., n. The functions h1 , h2 , ... , hn may involve an independent variable x; unknown functions; derivatives of unknown functions; delay terms; fitted parameters b1 , b2 , ... , bp ; and fixed parameters c1 , c2 , ... , cq . The value u must be a common value of x. • Initial estimates for fitted parameters: b01 , b02 , ... , b0p • Fixed parameter values: c01 , c02 , ... , c0q • Constraint set, each constraint being one of the forms: r1 · b1 + r2 · b2 + ... + rp · bp < r0 r1 · b1 + r2 · b2 + ... + rp · bp = r0 r1 · b1 + r2 · b2 + ... + rp · bp > r0 • Fitted functions: yk (x) or yk′ (x) for a given k, k ≤ n • Weighted sum of squared error: S(b1 , b2 , ..., bp ) = m X i=1 wi · [vi − yk (xi ; b1 , b2 , ..., bp )]2 S(b1 , b2 , ..., bp ) = m X wi · [vi − yk′ (xi ; b1 , b2 , ..., bp )]2 i=1 The standard MLAB curve-fitting procedure for differential equations systems follows, with optional steps indicated by an asterisk (*). 1. Create MLAB matrices (via USE, DO, or matrix assignment commands) as follows: (a) An m by 2 data matrix (b) * An m-vector of data point weights 2. Create an MLAB system of differential equations (via a USE, DO, or FUNCTION and INITIAL commands) corresponding to the given system. Parameters may be represented by scalars or matrix identifiers. 3. * Create an MLAB constraint set (via a USE, DO, or CONSTRAINTS command) containing all the linear constraints for the model. Matrix element parameters can not appear in MLAB linear constraints. 303 4. Create MLAB scalars or matrices (via USE, DO, or scalar or matrix assignment commands) corresponding to all initial estimates for fitted parameters and known values for all fixed parameters of the system. Initial estimates should be generated as carefully as possible. If close estimates of the fitted parameters can not be obtained, then it may be useful to search for good initial estimates by evaluating the weighted-sum-of-squared-error for appropriate trial selections. 5. Execute an MLAB FIT command (directly or via a DO command) which specifies the list of fitted parameters, unknown function or derivative, data matrix, and weight vector. The list of fitted parameters may contain matrix names, in which case all elements of listed matrices are fitted parameters. Multiple clauses, each specifying an MLAB defined functional form or an unknown function or a derivative of an unknown function of the system with its weighted data, may be used in the differential equation FIT command if all the data matrices have the same first column. 6. * After examining the FIT command output, modify the model, continue curve-fitting, or prepare graphical displays, as needed. In order to prepare graphical displays, solve the differential equation system by using the INTEGRATE operator. In the following let F denote a function identifier in MLAB defined functions; Z, and Y1, Y2, ... , Yn denote unknown functions of the differential equations system; csi denote a constraint set name; N1 and N2 denote positive scalar constants; S denote a scalar identifier; SE0, SE1, and SE2 denote scalar expressions; ME1 and ME2 denote matrix expressions; T denote a scalar identifier; P1, P2, ... , Pp denote scalar or matrix identifiers; and clause1, clause2, ... , clausek denote clauses that refer to MLAB defined functional forms or unknown functions or derivatives of unknown functions in one differential equations system. 1. MLAB Commands for Systems of Differential Equations are: (a) FUNCTION Z’T(T) = SE1 (b) INITIAL Z(SE0) = SE2 (c) INTEGRATE(Y1’T,Y2’T,... ,Yn’T,ME1) Typing “R” (with no RETURN) during a numerical solution of a system of differential equations causes a report on the current status of the computation to be typed; typing “Q” (with no RETURN) causes the computation to be stopped and zeros used for values not computed. (d) CONSTRAINTS csi Constraint terms N1, S, N1*S, and S/N1 are separated by + or - to make expressions; two expressions are separated by <, =, or > to make a constraint, e.g. A/4-2*B+C>1. 304 (e) FIT (P1, P2, ... , Pp), Z TO ME1 WITH WEIGHT ME2 Fits a parameter list P1, P2, ... , Pp of scalar or matrix identifiers of an unknown function Z in a differential equation system to an m by 2 data matrix ME1 with an m-vector of weights ME2. (f) FIT (P1, P2, ... , Pp), Z’T TO ME1 WITH WEIGHT ME2 Fits a parameter list P1, P2, ... , Pp of scalar or matrix identifiers of a derivative Z’T in a differential equation system to an m by 2 data matrix ME1 with an m-vector of weights ME2. (g) FIT (P1, P2, ... , Pp), clause1, clause2, ... , clausek Multiple-clause curve-fitting, all clauses must be of the form Z TO ME1 WITH WEIGHT ME2, Z’T TO ME1 WITH WEIGHT ME2, or F TO ME1 WITH WEIGHT ME2; all data matrices must have the same first column. If the clause WITH WEIGHT ME2 is omitted, all elements of the m-vector of weights will be set equal to one. Typing “R” (with no RETURN) during FIT overrides LSQRPT setting; typing “Q” (with no RETURN) during any FIT terminates command at the end of the current iteration. (h) TYPE commands: • TYPE csi • TYPE Z (initial condition) • TYPE Z’T (differential equation) (i) Control variables: These may be typed before a differential equation solution command. • METHOD = SE1 Specifies the integration algorithm. – MIXED = 0 means mixed. – ADAMS = 1 means Adams method. – GEAR2 = 2 means Gear-Shrager method. – GEAR = 3 means Gear method. Default method is MIXED (0). • ERRFAC = SE2 Error tolerance used for stepsize control. Default error tolerance is .001. • ODERPT = SE3 Specifies the contents of intermediate reports. 305 – the value 0 means no intermediate reporting. – the value 1 means report independent variable value, step size, and method at each step. – the value 2 means report independent variable value, step size, method, and the derivative values at each step. – the value 3 means report only the summary information after solving is complete. This includes the number of steps taken and the number of derivative function evaluations and Jacobian evaluations. The default value is 0. • MANDSW = SE4 Specifies how result matrix is obtained from solution matrix. – the value 0: means interpolate to get result matrix from solution matrix. – a value 6= 0: means adjust step-size so that requested values of independent variable are included in the solution matrix. The default value is 0. • JACSW = SE5 Specifies how partial derivatives for the Jacobian matrix are to be computed. – NUMERICAL = 0 means that numerical partial derivatives are used. – SYMBOLIC = 1 means that symbolic partial derivatives are used. – CONSTJAC = 2 means that partial derivatives are computed numerically only once. The default value is 0. • DISASTERSW = SE6 Specifies how the integrator should continue if truncation or round-off errors are too large. – the value -2 means do not report errors, and increase tolerance indefinitely, as required. – the value -1 means do not report errors, and increase tolerance as required. If the internal value of ERRFAC becomes greater than 1.2, then terminate the integration. – the value 0 means report errors and increase tolerance as required. If the internal value of ERRFAC becomes greater than 1.2, then terminate the integration. – the value 1 means report errors and increase tolerance five times. If it would be necessary to increase the tolerance again, then terminate the integration. 306 – the value 2 means report errors and increase tolerance five times. If it would be necessary to increase the tolerance again, then continue the solution with fixed step-size. – the value 3 means report errors and increase tolerance as required. If the internal value of ERRFAC becomes greater than 1.2, then continue the solution with fixed step-size. – the value 4 means force the solution from the beginning with a large fixed step-size of 1/80 of the total integration interval. – the value 5 means force the solution for one step. Do not increase the tolerance. Do not report any error. – the value 6 means force the solution for one step. Do not increase the tolerance. Type out an error report. The default value is 6. 8.9 EXERCISES 1. Numerically solve the following differential equations and graph the solutions: (a) (b) dy dx y ′′ = −2·x·y 2 with y(0) = 1. Compare the results with the analytic solution y = 1 . (1+x2 ) = 2 · y 3 with y(1) = 1, y ′ (1) = −1 for x =1:2:.1 using a tolerance level of .002. Compare the result with the analytic solution y = 1/x. 2. Numerically solve the following systems of differential equations and graph the solutions: dx = 1000 and dy dt = 0.5 · dt − 16 · t with x(0) = 500, y(0) = 0 for t = 0:2:.1. Compare the results with the analytic solutions: x(t) = 1000 · t + 500 and y(t) = 500 · t − 8 · t2 . dy2 1 (b) dy dt = 2 · y1 · (1 − y2 ) and dt = y2 · (y1 − 1) with y1 (0) = 1 and y2 (0) = 3 for t = 1:10 using the Adams method, the Gear method, the Gear-Shrager method, and the combined Adams/Gear method. Compare the results. (a) dx dt 3. Recall the fundamental theorem of the calculus: dH = f (x) if H(x) = dx Z x f (t)dt a for any continuous function f . So, the definite integral as a function of the upper limit is the unique solution of the differential equation system: dH = f (x) dx H(a) = 0 307 Evaluate the definite integral 1x (1/t)dt numerically by using the INTEGRATE operator and the INTEGRAL operator described in Chapter 2 and compare the results. R 4. Given the system of differential equations in two unknown functions f (t) and g(t): df dg + t · f (t) − 2 · t2 = 0 dt dt d2 g dg − f (t) · +4·t = 0 dt2 dt with initial conditions f (1) = 3.1, g(1) = −2, dg dt (1) = −.1, (a) Numerically solve this system for t = 1:2:.1. (b) Numerically solve the above system with boundary conditions: f (1) = 3.1, g(1) = −2, g(2) = −6 for t =1:2:.1. 5. A dose of a radioactive labelled drug is injected in the blood stream of a rat and enters the bile. The amounts of the drug are measured in both the blood and the bile over a period of ten minutes. Because a delay of d minutes is needed for the bile to pass through a catheter, the amount of the drug measured in the bile at time t is actually the amount at time t − k. If all measurements are given in terms of percent of the initial dose, a simple model for the incorporation of the drug in the bile is: dy1 dt dy2 dt = −k · y1 = k · y1 · (t − d) with initial conditions: y1 (0) = 100 and y2 (0) = 0 where y1 (t) is the amount of the drug in the blood at time t, and y2 (t) is the amount of the drug in the bile at time t. (a) Curve-fit d and k to the unknown functions y1 and y2 using the following measurements: Time 3 4 5 6 7 8 9 10 308 Blood 23.3 15.1 7.9 4.3 2.5 2.2 2.1 0.6 Bile 21.8 52.1 71.8 84.3 90.9 96.0 97.3 98.4 Use d = 2.5 and k = .5 as initial estimates of the parameters. Use the Gear method with symbolic derivatives, no interpolation, and tolerance level of .003. (b) Draw graphs of the fitted curves and the experimental data. 309 MLAB can solve a first-order system of n differential equations, n ≤ 1, with n initial conditions having the same argument; that is, the system is an implicit definition of n unknown functions y1 (x), y2 (x), . . . , yn (x), in an independent variable x, given by means of n differential equations of the form: dy1 dx dy2 dx = h1 (x, y1 (x), y2 (x), ..., yn (x)) = h2 (x, y1 (x), y2 (x), ..., yn (x)) .. . dyn dx = hn (x, y1 (x), y2 (x), ..., yn (x)) together with n initial conditions, one for each unknown function, at a common value x = u for the independent variable, as follows: y1 (u) = z1 y2 (u) = z2 .. . yn (u) = zn The functions h1 , h2 , ... , hn are to be given by expressions which may involve the independent variable x, the unknown functions yj (x), the derivatives yj′ (x) of the unknown functions, and delay terms yj (x − c), for j = 1, 2, ..., n. (Caution: If the derivatives of unknown functions are involved, circular definitions must be avoided.) Suppose T denotes the MLAB identifier used for the independent variable and Y1, Y2, ... ,YN denote the function identifiers for the unknown functions y1 , y2 , ... , yn ; the corresponding system of differential equations is specified by the MLAB commands: FUNCTION Y1’T(T) = SE1 FUNCTION Y2’T(T) = SE2 .. . FUNCTION YN’T(T) = SEn INITIAL Y1(SE0) = SEn+1 INITIAL Y2(SE0) = SEn+2 .. . INITIAL YN(SE0) = SE2n Table 8.1: Solving first-order differential equations systems. 310 Here, scalar expression SEj denotes the expression hj (x, y1 (x), y2 (x), ..., yn (x)), with T substituted for x, YJ for yj (x), YJ’T for yj′ (x), YJ(T-C) for yj (x − c), j = 1, 2, ..., n. In particular, note that YJ is treated just like the scalar expression YJ(T), and YJ’T is treated just like the scalar expression YJ’T(T). The expression SE0 should be the common argument u for the independent variable in the initial conditions. It is usually a scalar constant or a scalar variable, and we recommend that exactly the same scalar expression be used in all of the initial conditions for a system. The scalar expressions SEn+1, SEn+2, ... , SE2n specify the values z1 , z2 , ...,zn of the unknown functions at the argument u; the expressions occurring in the initial conditions should not contain any of the identifiers Y1, Y2, ... , YN referring to the unknown functions. A differential equation system has been defined as described above; the INTEGRATE expression to solve it numerically is: INTEGRATE(Y1’T,Y2’T,...,Yn’T,ME1) Of course, the list of n derivatives Yj’T for j = 1,2,...,n specifies the system of differential equations and initial conditions. The matrix expression ME1 specifies a column vector of values for the independent variable T. Much greater accuracy will be achieved if the successive values in ME1 move continually away from SE0; that is, if: SE0 <= a1 < a2 < ... < am SE0 >= a1 > a2 > ... > am or where ME1 = LIST(a1,a2,...,am). The result of the INTEGRATE operator is an m by (2n + 1) matrix. Column 1 is the given vector ME1. The remaining 2n columns are the numerical values for the functions and derivatives corresponding to the independent variable values in column 1. In each row, the values of Yj and Yj’T for the argument in column 1 are entered in columns 2j and 2j + 1, respectively, for j = 1, 2, ..., n. Table 8.2: Solving first-order differential equations systems (continued). 311 Before issuing a FIT command for a differential equation system, the appropriate system must be defined in MLAB. This is done (as for an INTEGRATE operator) by means of the FUNCTION and INITIAL commands: FUNCTION Yj’T(T) = SEj INITIAL Yj (SE0) = SEn+j for j = 1,2,...,n. Differential equation FIT commands are distinguished from other FIT commands in MLAB by the function identifiers F appearing in the command. Hence, the general form of the FIT command for this system is the same as for the FIT command for a defined function in MLAB. That is, the basic form is: FIT (P1, P2, ... , Pn), F TO ME1 WITH WEIGHT ME2 The function identifier F refers to an identifier among the list of Y1, Y2, ..., Yn Y1’T, Y2’T...,Yn’T Identifiers P1,P2, ... , Pn to be fit may be either scalars or matrices in MLAB. The parameters then include the scalars listed and the elements of any matrix listed; these parameters may appear in any differential equation expression SEj or initial condition value SEn+j for j = 1,2,..., n. However, no fitted parameter is permitted in SE0, the common value of the independent variable T specified in the INITIAL commands. The multiple-clause form below is also permitted: FIT (P1, P2, ... , Pn), clause1, clause2, ... , clauset Table 8.3: FIT command, differential equations systems. 312 Each clause is of the form: F TO ME1 WITH WEIGHT ME2 where F is an MLAB defined functional form or one of the unknown functions or derivatives for the differential equations system listed in the previous paragraph. For FIT commands involving systems of differential equations, there should be 2-column matrices ME1 specified in each clause F TO ME1 WITH WEIGHT ME2, since F must be a function of one variable T. As before, each weight matrix ME2 in clause F TO ME1 WITH WEIGHT ME2 should be a column vector with the same number of rows as ME1. The clauses may be abbreviated by omitting the weight specification WITH WEIGHT ME2; the default weight vector is a column of ones. The word WEIGHT may be abbreviated to WT, as usual. The FIT command for a system of differential equations causes an iterative search for the values of the fitted parameters that minimizes the weighted-sum-of-squared-error, just as for FIT commands using functional forms. The typed response to a FIT command for a system of differential equations is the same as for a FIT command for curvefitting a functional form. Table 8.4: FIT command, differential equations systems (continued). 313 Appendix A FONT TABLES The tables on the following pages show all of the printable characters in each of the thirty four Hershey fonts (specified by font numbers equal to postitive integers 1, 2, ..., 34) and in each of the thirteen TrueType fonts (specified by font numbers equal to the negative integers −2, −3, ..., −14). Note, TrueType fonts are supported by MSWindows and Macintosh displays and PSL, PSP, PSCL, and PSCP PostScript printer devices. However, they are not supported by Linux with X-Windows displays or LJ2L and LJ2P Hewlett Packard printer devices. 314 Figure A.1: ASCII character numbers 0 to 15 in Hershey fonts 1 to 5. 315 Figure A.2: ASCII characters 16 to 31 in Hershey fonts 1 to 5. 316 Figure A.3: ASCII characters 32 to 47 in Hershey fonts 1 to 34. 317 Figure A.4: ASCII characters 48 to 63 in Hershey fonts 1 to 34. 318 Figure A.5: ASCII characters 64 to 79 in Hershey fonts 1 to 34. 319 Figure A.6: ASCII characters 80 to 95 in Hershey fonts 1 to 34. 320 Figure A.7: ASCII characters 96 to 111 in Hershey fonts 1 to 34. 321 Figure A.8: ASCII characters 112 to 127 in Hershey fonts 1 to 34. 322 0 0 0 0 0 0 0 0 0 0 0 0 0 ! ! ! ! ! ! ! ! ! ! ! ! ! " " " " " " " " " " " " ∀ # # # # # # # # # # # # # $ $ $ $ $ $ $ $ $ $ $ $ ∃ % % % % % % % % % % % % % & & & & & & & & & & & & & ’ ’ ’ ’ ’ ’ ’ ’ ’ ’ ’ ’ ∋ ( ( ( ( ( ( ( ( ( ( ( ( ( ) ) ) ) ) ) ) ) ) ) ) ) ) * * * * * * * * * * * * ∗ + + + + + + + + + + + + + , , , , , , , , , , , , , − . . . . . . . . . . . . . / / / / / / / / / / / / / 1 1 1 1 1 1 1 1 1 1 1 1 1 2 2 2 2 2 2 2 2 2 2 2 2 2 3 3 3 3 3 3 3 3 3 3 3 3 3 4 4 4 4 4 4 4 4 4 4 4 4 4 5 5 5 5 5 5 5 5 5 5 5 5 5 6 6 6 6 6 6 6 6 6 6 6 6 6 7 7 7 7 7 7 7 7 7 7 7 7 7 8 8 8 8 8 8 8 8 8 8 8 8 8 9 9 9 9 9 9 9 9 9 9 9 9 9 : : : : : : : : : : : : : ; ; ; ; ; ; ; ; ; ; ; ; ; < < < < < < < < < < < < < = = = = = = = = = = = = = > > > > > > > > > > > > > ? ? ? ? ? ? ? ? ? ? ? ? ? Figure A.9: ASCII characters 32 to 63 in TrueType fonts -2 to -14. 323 @ @ @ @ @ @ @ @ @ @ @ @ ≅ A A A A A A A A A A A A Α B B B B B B B B B B B B Β C C C C C C C C C C C C Χ D D D D D D D D D D D D ∆ E E E E E E E E E E E E Ε F F F F F F F F F F F F Φ G G G G G G G G G G G G Γ H H H H H H H H H H H H Η I I I I I I I I I I I I Ι J J J J J J J J J J J J ϑ K K K K K K K K K K K K Κ L L L L L L L L L L L L Λ M M M M M M M M M M M M Μ N N N N N N N N N N N N Ν O O O O O O O O O O O O Ο P P P P P P P P P P P P Π Q Q Q Q Q Q Q Q Q Q Q Q Θ R R R R R R R R R R R R Ρ S S S S S S S S S S S S Σ T T T T T T T T T T T T Τ U U U U U U U U U U U U Υ V V V V V V V V V V V V ς W W W W W W W W W W W W Ω X X X X X X X X X X X X Ξ Y Y Y Y Y Y Y Y Y Y Y Y Ψ Z Z Z Z Z Z Z Z Z Z Z Z Ζ [ [ [ [ [ [ [ [ [ [ [ [ [ \ \ \ \ \ \ \ \ \ \ \ \ ∴ ] ] ] ] ] ] ] ] ] ] ] ] ] ^ ^ ^ ^ ^ ^ ^ ^ ^ ^ ^ ^ ⊥ _ _ _ _ _ _ _ _ _ _ _ _ _ Figure A.10: ASCII characters 64 to 95 in TrueType fonts -2 to -14. 324 ‘ ‘ ‘ ‘ ‘ ‘ ‘ ‘ ‘ ‘ ‘ ‘ a a a a a a a a a a a a α b b b b b b b b b b b b β c c c c c c c c c c c c χ d d d d d d d d d d d d δ e e e e e e e e e e e e ε f f f f f f f f f f f f φ g g g g g g g g g g g g γ h h h h h h h h h h h h η i i i i i i i i i i i i ι j j j j j j j j j j j j ϕ k k k k k k k k k k k k κ l l l l l l l l l l l l λ m m m m m m m m m m m m µ n n n n n n n n n n n n ν p p p p p p p p p p p p π q q q q q q q q q q q q θ r r r r r r r r r r r r ρ s s s s s s s s s s s s σ t t t t t t t t t t t t τ u u u u u u u u u u u u υ v v v v v v v v v v v v ϖ w w w w w w w w w w w w ω x x x x x x x x x x x x ξ y y y y y y y y y y y y ψ z z z z z z z z z z z z ζ { { { { { { { { { { { { { | | | | | | | | | | | | | } } } } } } } } } } } } } ~ ~ ~ ~ ~ ~ ~ ~ ~ ~ ~ ~ ∼ Figure A.11: ASCII characters 96 to 127 in TrueType fonts -2 to -14. 325 o o o o o o o o o o o o ο Appendix B LIST OF TABLES List of Tables 1.1 Simulated chick embryo weight data. . . . . . . . . . . . . . . . . . . . . . . . . . . 4 2.1 Scalar assignment command. . . . . . . . . . . . . . . . . . . . . . . . . . . . . . . 16 2.2 Scalar arithmetic notational rules. . . . . . . . . . . . . . . . . . . . . . . . . . . . 19 2.3 Trigonometric functions. . . . . . . . . . . . . . . . . . . . . . . . . . . . . . . . . . 19 2.4 Inverse trigonometric functions. . . . . . . . . . . . . . . . . . . . . . . . . . . . . . 20 2.5 Logarithmic, exponential, and hyperbolic trigonometric functions. . . . . . . . . . . 20 2.6 Commonly-used special functions. . . . . . . . . . . . . . . . . . . . . . . . . . . . 21 2.7 Random number operator. . . . . . . . . . . . . . . . . . . . . . . . . . . . . . . . . 22 2.8 Normal random number operator. . . . . . . . . . . . . . . . . . . . . . . . . . . . 22 2.9 Construction of matrix entries. . . . . . . . . . . . . . . . . . . . . . . . . . . . . . 23 326 2.10 FUNCTION command. . . . . . . . . . . . . . . . . . . . . . . . . . . . . . . . . . . . 25 2.11 Comparison, logical, conditional expressions. . . . . . . . . . . . . . . . . . . . . . 31 2.12 TYPEOUT scalar operator. . . . . . . . . . . . . . . . . . . . . . . . . . . . . . . . . . 33 2.13 SUM, PRODUCT, and INTEGRAL operators. . . . . . . . . . . . . . . . . . . . . . . . . 35 2.14 ROOT and EVAL operators. . . . . . . . . . . . . . . . . . . . . . . . . . . . . . . . . 37 2.15 Special cases of differentiation. . . . . . . . . . . . . . . . . . . . . . . . . . . . . . 38 2.16 Defining MLAB derivatives. . . . . . . . . . . . . . . . . . . . . . . . . . . . . . . . 41 2.17 TYPE command. . . . . . . . . . . . . . . . . . . . . . . . . . . . . . . . . . . . . . . 42 3.1 General forms of matrix assignment command. . . . . . . . . . . . . . . . . . . . . 48 3.2 Matrix dimension operators. . . . . . . . . . . . . . . . . . . . . . . . . . . . . . . . 49 3.3 LIST expression, simple form. . . . . . . . . . . . . . . . . . . . . . . . . . . . . . . 49 3.4 KREAD expression, simple form. . . . . . . . . . . . . . . . . . . . . . . . . . . . . . 50 3.5 READ expression, console form. . . . . . . . . . . . . . . . . . . . . . . . . . . . . . . 52 3.6 READ expression, vector form. . . . . . . . . . . . . . . . . . . . . . . . . . . . . . . 52 3.7 Matrix entry assignment command. . . . . . . . . . . . . . . . . . . . . . . . . . . . 55 3.8 Arithmetic sequence matrix expression. . . . . . . . . . . . . . . . . . . . . . . . . 56 3.9 Fixed-number-of-members arithmetic sequence matrix expression. . . . . . . . . . . 57 3.10 Matrix transpose notation. . . . . . . . . . . . . . . . . . . . . . . . . . . . . . . . 59 3.11 LIST expression, general form. . . . . . . . . . . . . . . . . . . . . . . . . . . . . . . 59 3.12 SHAPE expression, general form. . . . . . . . . . . . . . . . . . . . . . . . . . . . . . 61 3.13 ROW matrix operators. . . . . . . . . . . . . . . . . . . . . . . . . . . . . . . . . . . 62 3.14 COL matrix operators. . . . . . . . . . . . . . . . . . . . . . . . . . . . . . . . . . . 63 3.15 ROW matrix assignment command. . . . . . . . . . . . . . . . . . . . . . . . . . . . . 65 3.16 COL matrix assignment command. . . . . . . . . . . . . . . . . . . . . . . . . . . . . 66 327 3.17 Matrix joining operators. . . . . . . . . . . . . . . . . . . . . . . . . . . . . . . . . 68 3.18 Matrix row replication operator. . . . . . . . . . . . . . . . . . . . . . . . . . . . . 68 3.19 Matrix column replication operator. . . . . . . . . . . . . . . . . . . . . . . . . . . 68 3.20 Matrix joining and repeating operator evaluation. . . . . . . . . . . . . . . . . . . . 69 3.21 SORT matrix operator. . . . . . . . . . . . . . . . . . . . . . . . . . . . . . . . . . . 71 3.22 Some useful matrix editing operators. . . . . . . . . . . . . . . . . . . . . . . . . . 72 3.23 Matrix expressions with scalar/matrix arguments. . . . . . . . . . . . . . . . . . . 75 3.24 Matrix expressions with matrix arguments. . . . . . . . . . . . . . . . . . . . . . . 76 3.25 Vector LENGTH operator. . . . . . . . . . . . . . . . . . . . . . . . . . . . . . . . . . 77 3.26 Matrix product operation. . . . . . . . . . . . . . . . . . . . . . . . . . . . . . . . . 78 3.27 Matrix power operation. . . . . . . . . . . . . . . . . . . . . . . . . . . . . . . . . . 80 3.28 Element-by-element matrix product operation. . . . . . . . . . . . . . . . . . . . . 81 3.29 The CDF and RANKORDER operators, general forms. . . . . . . . . . . . . . . . . . . . 83 3.30 ON, POINTS, and MAPPLY matrix operators. . . . . . . . . . . . . . . . . . . . . . . . 86 3.31 LOOKUP matrix operator . . . . . . . . . . . . . . . . . . . . . . . . . . . . . . . . . 88 3.32 FOR command, simple form. . . . . . . . . . . . . . . . . . . . . . . . . . . . . . . . 89 3.33 FOR command, compound form. . . . . . . . . . . . . . . . . . . . . . . . . . . . . . 90 4.1 The VIEW and UNVIEW commands. . . . . . . . . . . . . . . . . . . . . . . . . . . . . 97 4.2 WINDOW, FRAME, and IMAGE commands. . . . . . . . . . . . . . . . . . . . . . . . . . 101 4.3 Point-types. . . . . . . . . . . . . . . . . . . . . . . . . . . . . . . . . . . . . . . . . 108 4.4 Solid-filled point-types. . . . . . . . . . . . . . . . . . . . . . . . . . . . . . . . . . . 109 4.5 Line-types. . . . . . . . . . . . . . . . . . . . . . . . . . . . . . . . . . . . . . . . . 109 4.6 DRAW command, short form. . . . . . . . . . . . . . . . . . . . . . . . . . . . . . . . 111 4.7 DRAW command, complete form. . . . . . . . . . . . . . . . . . . . . . . . . . . . . . 117 328 4.8 Color names and numbers. . . . . . . . . . . . . . . . . . . . . . . . . . . . . . . . . 125 4.9 AXIS command, complete form. . . . . . . . . . . . . . . . . . . . . . . . . . . . . . 128 4.10 TITLE command. . . . . . . . . . . . . . . . . . . . . . . . . . . . . . . . . . . . . . 133 4.11 String modification command codes. . . . . . . . . . . . . . . . . . . . . . . . . . . 138 4.12 BLANK and UNBLANK commands. . . . . . . . . . . . . . . . . . . . . . . . . . . . . . 139 4.13 CURVEM and LABELM operators. . . . . . . . . . . . . . . . . . . . . . . . . . . . . . . 142 4.14 Window renaming assignment commands. . . . . . . . . . . . . . . . . . . . . . . . 142 4.15 The WINDOW statement with ADJUST-clause. . . . . . . . . . . . . . . . . . . . . . . 143 5.1 SAVE command. . . . . . . . . . . . . . . . . . . . . . . . . . . . . . . . . . . . . . . 161 5.2 USE command. . . . . . . . . . . . . . . . . . . . . . . . . . . . . . . . . . . . . . . 161 5.3 READ matrix expression, general form. . . . . . . . . . . . . . . . . . . . . . . . . . 164 5.4 PRINT command. . . . . . . . . . . . . . . . . . . . . . . . . . . . . . . . . . . . . . 167 5.5 PLOT command. . . . . . . . . . . . . . . . . . . . . . . . . . . . . . . . . . . . . . . 169 5.6 DO command. . . . . . . . . . . . . . . . . . . . . . . . . . . . . . . . . . . . . . . . 170 5.7 Conditional command. . . . . . . . . . . . . . . . . . . . . . . . . . . . . . . . . . . 172 5.8 General form of MENUCHOICE. . . . . . . . . . . . . . . . . . . . . . . . . . . . . . . 179 5.9 General form of GETSTRINGS. . . . . . . . . . . . . . . . . . . . . . . . . . . . . . . 187 5.10 The WREAD command. . . . . . . . . . . . . . . . . . . . . . . . . . . . . . . . . . . 188 6.1 Matrix Combination Operators. . . . . . . . . . . . . . . . . . . . . . . . . . . . . . 194 6.2 INTERPOLATE, SMOOTH, BARGRAPH, and HISTO matrix operators. . . . . . . . . . . . 200 6.3 FILL matrix operator. . . . . . . . . . . . . . . . . . . . . . . . . . . . . . . . . . . 203 6.4 CONTOUR matrix operator. . . . . . . . . . . . . . . . . . . . . . . . . . . . . . . . . 208 6.5 EIGEN matrix operator. . . . . . . . . . . . . . . . . . . . . . . . . . . . . . . . . . . 213 329 6.6 Complex number operators. . . . . . . . . . . . . . . . . . . . . . . . . . . . . . . . 214 6.7 SVD matrix operator. . . . . . . . . . . . . . . . . . . . . . . . . . . . . . . . . . . . 215 6.8 Covariance and correlation matrix operators. . . . . . . . . . . . . . . . . . . . . . 217 6.9 Discrete Fourier transform operators. . . . . . . . . . . . . . . . . . . . . . . . . . . 222 7.1 EWT operator. . . . . . . . . . . . . . . . . . . . . . . . . . . . . . . . . . . . . . . . 234 7.2 Weighted-sum-of-squared-error criterion. . . . . . . . . . . . . . . . . . . . . . . . . 237 7.3 Joint models weighted-sum-of-squared-error criterion. 7.4 Examples of linear constraint forms. . . . . . . . . . . . . . . . . . . . . . . . . . . 240 7.5 CONSTRAINTS command. . . . . . . . . . . . . . . . . . . . . . . . . . . . . . . . . . 241 7.6 Curve-fitting a functional form. . . . . . . . . . . . . . . . . . . . . . . . . . . . . . 242 7.7 Data preparation for curve-fitting operations. . . . . . . . . . . . . . . . . . . . . . 243 7.8 FIT commands, for a functional form. . . . . . . . . . . . . . . . . . . . . . . . . . 278 7.9 The general problem of curve-fitting a functional form. . . . . . . . . . . . . . . . . 279 . . . . . . . . . . . . . . . . 238 7.10 Linear model functional form. . . . . . . . . . . . . . . . . . . . . . . . . . . . . . . 279 8.1 Solving first-order differential equations systems. . . . . . . . . . . . . . . . . . . . 310 8.2 Solving first-order differential equations systems (continued). . . . . . . . . . . . . 311 8.3 FIT command, differential equations systems. . . . . . . . . . . . . . . . . . . . . . 312 8.4 FIT command, differential equations systems (continued). . . . . . . . . . . . . . . 313 330 Appendix C LIST OF FIGURES List of Figures 1.1 Plot of dry weights vs age. . . . . . . . . . . . . . . . . . . . . . . . . . . . . . . . . 6 1.2 Data points and best-fitting exponential curve. . . . . . . . . . . . . . . . . . . . . 9 1.3 Best-fitting exponential curve, suited for publication. . . . . . . . . . . . . . . . . . 10 2.1 Graph of y = f (x). . . . . . . . . . . . . . . . . . . . . . . . . . . . . . . . . . . . . 27 2.2 Graph of y = g(t). . . . . . . . . . . . . . . . . . . . . . . . . . . . . . . . . . . . . 28 2.3 Graph of y = h(x). . . . . . . . . . . . . . . . . . . . . . . . . . . . . . . . . . . . . 29 4.1 The aligned rectangle with x in [−.4, .8] and y in [10, 40]. . . . . . . . . . . . . . . 98 4.2 Plot of a curve matrix. . . . . . . . . . . . . . . . . . . . . . . . . . . . . . . . . . . 102 4.3 Illustration of MLAB user rectangle, frame, and image rectangles. 331 . . . . . . . . . 104 4.4 Samples of point-types and line-types. . . . . . . . . . . . . . . . . . . . . . . . . . 107 4.5 Examples of smooth-curve drawing. . . . . . . . . . . . . . . . . . . . . . . . . . . . 113 4.6 Examples of stick-figure drawing . . . . . . . . . . . . . . . . . . . . . . . . . . . . 116 4.7 Example of 7-parameter LINETYPE with values (.1,.1,.1,-.1,0,.05,0). . . . . . 120 4.8 Examples of point labeling. . . . . . . . . . . . . . . . . . . . . . . . . . . . . . . . 124 4.9 Figure 4.2 after the user rectangle is redefined. . . . . . . . . . . . . . . . . . . . . 127 4.10 Shifting text strings. . . . . . . . . . . . . . . . . . . . . . . . . . . . . . . . . . . . 130 4.11 Examples of a multiple-line text. . . . . . . . . . . . . . . . . . . . . . . . . . . . . 132 4.12 Changing character size and position. . . . . . . . . . . . . . . . . . . . . . . . . . 135 4.13 Changing character font tables. . . . . . . . . . . . . . . . . . . . . . . . . . . . . . 136 4.14 Changing character height, width, and angle. . . . . . . . . . . . . . . . . . . . . . 137 4.15 Part of a parabola drawn in the default window. . . . . . . . . . . . . . . . . . . . 144 4.16 Additional parts of parabolas drawn in the default window. . . . . . . . . . . . . . 145 4.17 Five practice drawings. . . . . . . . . . . . . . . . . . . . . . . . . . . . . . . . . . . 150 4.18 Practice drawing using squares and triangles. . . . . . . . . . . . . . . . . . . . . . 151 4.19 Practice drawing using font tables. . . . . . . . . . . . . . . . . . . . . . . . . . . . 152 6.1 Shading a graph using MESH. . . . . . . . . . . . . . . . . . . . . . . . . . . . . . . . 190 6.2 Graphing in polar coordinates. . . . . . . . . . . . . . . . . . . . . . . . . . . . . . 191 6.3 CDF step function graph. . . . . . . . . . . . . . . . . . . . . . . . . . . . . . . . . . 193 6.4 Interpolating data. . . . . . . . . . . . . . . . . . . . . . . . . . . . . . . . . . . . . 195 6.5 Smoothing data. . . . . . . . . . . . . . . . . . . . . . . . . . . . . . . . . . . . . . 197 6.6 Step function graph of a curve. . . . . . . . . . . . . . . . . . . . . . . . . . . . . . 198 6.7 Histogram of random data. . . . . . . . . . . . . . . . . . . . . . . . . . . . . . . . 199 6.8 Shading in a circle. . . . . . . . . . . . . . . . . . . . . . . . . . . . . . . . . . . . . 201 332 6.9 Shading several polygons. . . . . . . . . . . . . . . . . . . . . . . . . . . . . . . . . 202 6.10 A contour map of f (x, y). . . . . . . . . . . . . . . . . . . . . . . . . . . . . . . . . 205 6.11 A contour map of interpolated data. . . . . . . . . . . . . . . . . . . . . . . . . . . 206 6.12 A contour map of interpolated, smoothed data. . . . . . . . . . . . . . . . . . . . . 207 6.13 A contour map of interpolated data with spline curve contours. . . . . . . . . . . . 209 6.14 A solution to the van der Pol equation. . . . . . . . . . . . . . . . . . . . . . . . . . 212 6.15 Average monthly sunspot number (top) and its Fourier transform amplitude (bottom).219 6.16 Shading around text. . . . . . . . . . . . . . . . . . . . . . . . . . . . . . . . . . . . 224 7.1 Example of sum-of-squared-error terms. . . . . . . . . . . . . . . . . . . . . . . . . 228 7.2 Example of weighted-sum-of-squared-error terms. . . . . . . . . . . . . . . . . . . . 231 7.3 Illustration of EWT-generated weights . . . . . . . . . . . . . . . . . . . . . . . . . . 235 7.4 Fit of X(t) and B(t) using unit weights. . . . . . . . . . . . . . . . . . . . . . . . . 249 7.5 Fit of X(t) and B(t) using the EWT operator. . . . . . . . . . . . . . . . . . . . . . 250 7.6 Graph of f (x) and h(x) for c = 12. . . . . . . . . . . . . . . . . . . . . . . . . . . . 262 7.7 Sum-of-squared-error vs the parameter c. . . . . . . . . . . . . . . . . . . . . . . . 263 7.8 Graph of f (x) for c = .709. . . . . . . . . . . . . . . . . . . . . . . . . . . . . . . . 264 7.9 Graph of f (x) for large |c|. . . . . . . . . . . . . . . . . . . . . . . . . . . . . . . . 266 7.10 Graph of f (x) for c = −3.09. . . . . . . . . . . . . . . . . . . . . . . . . . . . . . . 269 8.1 Plots of S(t), C(t), and P(t). . . . . . . . . . . . . . . . . . . . . . . . . . . . . . . 287 8.2 Experimental and fitted values of Legendre’s equation. . . . . . . . . . . . . . . . . 300 A.1 ASCII character numbers 0 to 15 in Hershey fonts 1 to 5. . . . . . . . . . . . . . . 315 A.2 ASCII characters 16 to 31 in Hershey fonts 1 to 5. . . . . . . . . . . . . . . . . . . 316 A.3 ASCII characters 32 to 47 in Hershey fonts 1 to 34. . . . . . . . . . . . . . . . . . . 317 333 A.4 ASCII characters 48 to 63 in Hershey fonts 1 to 34. . . . . . . . . . . . . . . . . . . 318 A.5 ASCII characters 64 to 79 in Hershey fonts 1 to 34. . . . . . . . . . . . . . . . . . . 319 A.6 ASCII characters 80 to 95 in Hershey fonts 1 to 34. . . . . . . . . . . . . . . . . . . 320 A.7 ASCII characters 96 to 111 in Hershey fonts 1 to 34. . . . . . . . . . . . . . . . . . 321 A.8 ASCII characters 112 to 127 in Hershey fonts 1 to 34. . . . . . . . . . . . . . . . . 322 A.9 ASCII characters 32 to 63 in TrueType fonts -2 to -14. . . . . . . . . . . . . . . . . 323 A.10 ASCII characters 64 to 95 in TrueType fonts -2 to -14. . . . . . . . . . . . . . . . . 324 A.11 ASCII characters 96 to 127 in TrueType fonts -2 to -14. . . . . . . . . . . . . . . . 325 334 Appendix D BIBLIOGRAPHY [1] l’Ecuyer, Pierre, Efficient And Portable Combined Random Number Generators, Communications of the ACM 31 (1988) 742-749. [2] Kerner, Daniel, MLAB Graphics Examples (Civilized Software: Silver Spring, MD, 2014). [3] Knott, Gary D. and Kerner, Daniel, MLAB Reference Manual (Civilized Software: Silver Spring, MD, 2002). [4] Knott, Gary, MLAB Applications Manual (Civilized Software: Silver Spring, MD, 1998). [5] Marple, S. Lawrence, Digital Spectral Analysis with Applications (Prentice-Hall, Inc.: Englewood Cliffs, NJ, 1987). [6] Nordsieck, Arnold, On numerical integration of ordinary differential equations, Math. of Comp., 16 (1962) 22-49. [7] Shrager, Richard I., Numerical integration of ordinary differential equations: some methods with variable stepsize and order, unpublished, 1973. [8] Tu, Kai-Wen, Stability and convergence of general multi-step and multi-value methods with variable stepsize (Dept. of Computer Science, Report No. uiucds-r-72-526, Univ. of Illinois: Urbana-Champaign, 1974). 335 Appendix E INDEX The index begins on the next page. Words and symbols used in MLAB commands appear in BOLD TYPEWRITER FONT. 336 Index & , 64 & ’, 64 ’, 37, 58, 133, 281 (), 22, 48 *, 2, 18 *’, 79 **, 18 +, 18, 131 -, 18 /, 18 /* */, 174 :, 3, 54 ::, 32 ;, 3 <, 30 <=, 30 =, 16, 30 >, 30 >=, 30 [], 22 ^^, 67 ^, 18 ^^, 94 ^^’, 67 _, 16 {}, 89 ampersand, 64 ampersand-apostrophe, 64 AND, 29, 30 ANGLE, 117, 123, 127, 129, 133 apostrophe, 37, 58, 133, 281 AQUA, 125 arithmetic sequence, 84 ARROW, 106 arrow point-type, 106 ARROWTIP, 106 ASCII, 131 aspect ratio, 103, 143, 203 assignment statement, 7, 16, 47 asterisk-apostrophe, 79 AT, 129, 133 automatic scaling of axes, 127 AXES, 141 axes, 138 AXIS, 126–128, 148 axis, 98, 126 axis color, 127 axis identifiers, 128 axis label angle, 127 axis label font, 127 axis label format, 127 axis label matrix, 141 axis label offset, 127 axis label place, 127 axis label size, 127 axis labels, 127 axis matrix, 126, 141 axis names, 128 active constraints, 252 ADAMS, 295 Adams Method, 294 addition, 18 ADJUST, 142, 203 aligned rectangle, 98, 146 ALTERNATE, 106, 114, 190, 200 alternating long and short dash line-type, 106 bar graph, 199 BARGRAPH, 196, 199 337 binomial coefficients, 94 BLACK, 125 BLANK, 138, 139, 148 BLUE, 125 Boolean AND, 29 Boolean NOT, 29 Boolean OR, 29 BOTTOM, 122, 133, 134, 143 boundary value differential equation, 300 bracket, 22 BROWN, 125 complex exponentiation, 213 complex multiplication, 213 complex number operators, 213 complex numbers, 208 COMPRESS, 72 computation with matrices, 47 conditional command, 172 conditional expressions, 30, 38 connect every other point line-type, 106, 114, 190, 200 constant matrix, 69 constraint set, 15 CONSTRAINTS, 7, 238, 240, 245, 250 constraints, 239, 252 constraints on curve-fitting parameters, 238 construction of matrix entries, 22 CONTOUR, 204, 208 contour graphs, 203 contour maps, 204, 208 contour splines, 208 control variables for curve-fitting, 251 control-file, 159 controlling the differential equation solver, 293 CONVERGED, 252 convolution, 220 coordinate axes, 126 CORR, 215, 217 correlation, 215, 217 cosine, 19 COV, 215, 217 covariance, 215, 217 COVP, 246 CPOW, 213 CPROD, 213 CROSS, 189, 192 cross point-type, 106 crosshatching, 203 CROSSPT, 106 cubic polynomial, 112 cubic spline interpolation, 87 cubic splines, 194, 208 cumulative distribution, 81, 83, 192 canonical form of a system of differential equations, 210 canonical form of differential equations, 293 carriage returns in titles, 131 case, 2 CASESW, 2 CDF, 83, 192 CDIV, 213, 221 CENTER, 122, 133 chain rule, 39 CHARTREUSE, 125 chemical kinetics, 237, 247, 254, 283 chemical reaction kinetics, 237, 247, 254 chemical reaction rates, 283 choosing data point weights, 233 CIRCLE, 106 clipping, 129 COL matrix assignment command, 64 COL matrix operator, 62 colon, 54 COLOR, 117, 125, 127, 129, 133, 134 color designation by R,G,B-triples, 125 COLORN, 125 colors, 125 COLORX, 125 column concatenation, 64 column replication operator, 67 command prompt, 2 comments in do-files, 174 comparison expressions, 30, 38 complex division, 213, 221 338 curly braces, 89 current directory, 155 curve, 15, 98, 138 curve color, 117, 125 curve identifiers, 110 curve label angle, 117, 123 curve label font, 117, 121 curve label format, 117, 122 curve label matrix, 141 curve label offset, 117, 121 curve label place, 117, 122 curve label size, 117, 121 curve labels, 117, 119 curve matrix, 101, 103, 141 curve names, 110 curve-fit with EWT-estimated weights, 250 curve-fit with unit weights, 248 curve-fitting, 7, 225, 244 curve-fitting a differential equation, 298 curve-fitting a functional form, 241 curve-fitting control variables, 251, 274 curve-fitting data preparation, 241 curve-fitting differential equation models, 301 curve-fitting differential equations, 298, 301, 302 curve-fitting functions of more than 1 variable, 236 curve-fitting joint models of several functional forms, 236 curve-fitting matrix elements, 255 curve-fitting models, 253 curve-fitting parameter constraints, 238 curve-fitting reports, 247 curve-fitting sum-of-squared-error criterion, 226 CURVEM, 141 CURVES, 141 cyclic extension of matrices, 61, 63, 64, 75, 81 DASHED, 106 dashed line with marker skipping line-type, 106 DASHMARK, 106 data types, 15, 41 339 DBAND, 106 DDASH, 106 DDBAND, 106 DECONV, 221 deconvolution, 220, 221 default axes, 146 default frame rectangle, 100 default image rectangle, 100 default user clipping rectangle, 100 default window, 144, 146 defining functions, 24, 255 definite integral, 33 delay term, 288 DELETE, 5 density function, 81 DEPVALS, 246 derivative, 281 derivatives of functions, 37, 40, 85 descending sort of matrix, 71 DFT, 221 DIAG, 89 diagonals of a matrix, 213 DIAMOND, 106 diamond symbol point-type, 106 DIFF, 38 differential equation error handling, 296 differential equation models, 298 differential equation solver controls, 293 differential equation solver reports, 296, 297 differential equation solver’s error tolerance, 296 differential equations, 280 differential equations with a delay term, 288 directories, 154 DISASTERSW, 280, 296, 301 discrete convolution, 220 discrete Fourier transform operators, 221 discrete Fourier transforms, 217 display a form and return user responses, 177, 179 display a menu and return user choice, 177 division, 18 division by zero, 30 DLBAND, 106 DO, 168, 169, 174 do-file, 4, 154, 159, 168, 169, 174 DOFILEDIR, 159 dot point-type, 106 DOTMARK, 106 DOTPT, 106 DOTTED, 106 dotted line extending to the bottom image border, 106 dotted line extending to the left image border, 106 dotted line extending to the right image border, 106 dotted line extending to the top image border, 106 dotted line with marker skipping line-type, 106 dotted line-type, 106 downward tick mark, 106 DRAW, 5, 11, 101, 105, 147 DRAW command, complete form, 117 DRAW command, short form, 110 drawing functions of 1 variable, 112 DRBAND, 106 DTICK, 106, 128 DUBAND, 106 DW.SAV, 146 dynamical systems, 210 ERRFAC, 280, 283, 296, 301 error function, 19 error tolerance level in solving differential equations, 296 estimated weights, 233 Euclidean length of a vector, 76 EVAL, 36 evaluating functions, 85, 86 EWT, 233 exclamation point, 57 EXIT, 13 exponential functions, 19 exponential model, 4, 7, 225, 227, 253 exponentiation, 18 extracting diagonals of a matrix, 72 extracting matrix diagonals, 213 factorial, 31 fast Fourier transfors, 217 FCT, 24, 281 FFRACT, 117, 121, 129, 133 Fibonacci series, 32 FILEDIR, 157, 159 filenames, 157 files, 154 FILL, 200, 203 filling polygons, 190, 200, 203 finding roots of functions, 36 first order differential equation, 280 FIT, 7, 226, 244, 245, 250, 257, 298, 301, 302 FITNORM, 250, 251 fixed-number-of-members sequences, 57 FLATNESS, 208 floating-point exceptions, 18, 30 folders, 154 FONT, 129, 133 font for titles, 133 font size, 133 font tables, 134, 314 FOR, 88, 89, 94, 125, 169 FOR command, compound form, 90 FORMAT, 117, 122, 127 format of axis label, 127 editing matrix elements, 53 efficient function definitions, 255 EIGEN, 208, 211 eigenvalues, 208, 211 eigenvectors, 208, 211 element-by-element matrix product, 79, 81 ellipse, 112 embedded string control characters, 131, 134 entering numbers in a column vector, 49 entering numbers into a matrix, 49 enzyme kinetics, 283 enzyme-substrate complex, 284 340 format of curve label, 117 Fourier transforms, 217 FRAME, 100, 101, 147 frame fraction units, 99, 117, 121 frame rectangle, 98, 99, 103, 146 FRAMEBOX, 105, 147 FUNCTION, 7, 24, 112, 255, 281 function, 15 function arguments, 24 function definitions, 23, 255 function identifiers, 26 function parameters, 23 FUNCTIONS, 26 functions, 26 functions, defined piece-wise, 26 horizontal logarithmically-spaced tick marks, 106 hyperbolic trigonometric functions, 19 identifier, 15 IDFT, 221 IF-THEN-ELSE, 26, 30, 38, 171, 172 IFRACT, 117, 121, 133 IMAGE, 100, 101, 147 image fraction units, 117, 121 image rectangle, 98, 99, 103, 146 IMAGEBOX, 105, 147 IN, 100, 101, 110, 128, 129, 133, 143, 146 inactive constraints, 252 indexed product, 33 indexed sum, 33 infinite recursion in systems of differential equations, 289 INITIAL, 281, 300 initial condition, 15, 280, 300 installing MLAB, 154 installing MLAB, 1 INTEGRAL, 33, 34, 95 INTEGRATE, 280, 282 INTERPOLATE, 87, 194, 199, 204 interpolation, 199 interrupting MLAB execution, 4, 176 inverse Fourier transform, 221 inverse of a matrix, 79 inverse trigonometric functions, 19 gamma function, 19 GAUSSF, 19 GEAR, 295 Gear Method, 294 Gear-Shrager Method, 294 GEAR2, 295 generalized polynomial models, 256 generating arithmetic sequences, 54 GETDIAG, 72, 213 GETSTRINGS, 177, 179, 181 graphical display control commands, 96 graphics shortcuts, 142 graphing data, 5 graphs, 96 GREEN, 125 GREY, 125 Jacobian matrix, 210, 295 JACSW, 280, 295, 301 joint models, 238, 247, 254 joint models weighted-sum-of-squared-error criterion, 238 HBAR, 106 HELP, 12 Henderson-Hasselbach titration functions, 215 Hershey fonts, 314 HISTO, 199 histogram, 81, 199 home directory, 155 horizontal bar point-type, 106 horizontal error bar point-type, 106 kinetics, 237, 247, 254 KREAD, 49, 50, 53, 163, 164, 171 KSREAD, 163, 165 LABEL, 117, 119, 127 label, 101 label matrix, 141 341 LABELFONT, 117, 121, 127 labeling points on curves, 123 LABELM, 141 LABELSIZE, 117, 121, 127 Lagrange multiplier, 252 law of mass-action, 284 LBAND, 106 LDASH, 106 LEFT, 122, 133, 134, 143 leftward tick mark, 106 Legendre’s equation, 298 LENGTH, 77 line feeds in titles, 131 line-type, 101, 106, 118 linear constraints, 239 linear differential equation, 280 linear interpolation, 86, 87 linear models, 239, 257, 259 LINETYPE, 5, 106, 118 Lissajous figures, 114 LIST, 5, 49, 53, 59 LJ2L, 168 LJ2P, 168 log-file, 13, 158 logarithm-transformed data, 229 logarithmic functions, 19 logical expressions, 30, 38 long commands, 3 long dash line-type, 106 LOOKUP, 86, 87, 95 LSQRPT, 247, 250–252 LT, 106, 118 LTICK, 106, 128 matrix matrix matrix matrix matrix matrix matrix matrix assignment statement, 47 column replication operator, 67, 94 combination operators, 192 compression, 72 diagonals, 213 element assignment, 53 elements, 22, 26 elements as curve-fitting parameters, 255 matrix entry assignment command, 54 matrix expansion by cyclic extension, 61 matrix expansion by zeroes, 54, 63 matrix exponentiation, 78 matrix expressions with both scalar and matrix arguments, 74 matrix expressions with matrix arguments, 76 matrix inverse, 79, 94 matrix joining operators, 67, 69 matrix operators, 189 matrix power operation, 79 matrix product, 77–79 matrix repeating expression, 67 matrix repeating operators, 69 matrix row replication operator, 67 matrix transpose, 58 matrix-scalar arithmetic, 73 MAXITER, 251 MAXPOS, 164, 201 MAXROW, 72 MENUCHOICE, 177, 178 MESH, 189, 192, 200 METHOD, 280, 295, 301 MINROW, 72 MIXED, 295 mixed Adams/Gear Combination Method, 294 MLAB directory, 154, 155 MLAB picture, 103 MLAB scripts, 169 MLABEX.DO, 2 models, 253 modifying titles, 134 Moore-Penrose generalized inverse, 79, 213 magnitude of numbers, 16 making pictures, 96 MANDSW, 280, 294, 301 MAPPLY, 85, 86, 202 MARKER, 106, 117, 204 marker skipping, 202 mathematical models, 225 matrix, 15, 47 matrix arithmetic operations, 73 342 multiple-line titles, 133 multiplication, 18 particle motion on a parabola, 301 path, 154 PI, 11 pictures, 96 piece-wise defined functions, 26 PINK, 125 PLACE, 117, 122, 127, 133, 134 PLOT, 11, 166, 168 plot-file, 11, 159, 166 PLOTDEV, 168 point-type, 101, 106 point-type font, 117, 118, 127 point-type size, 117, 127 POINTS, 8, 11, 48, 84, 86, 191, 281, 292 POINTTYPE, 5, 106 polar graphs, 190 positioning titles, 131 power spectrum, 217 precedence of arithmetic operations, 18 precision, 16 preparing data for curve-fitting, 241 PRINT, 165, 166 print-file, 154, 159, 165 PRODUCT, 33, 34 prompt, 2 PSCL, 168 PSCP, 168 PSL, 168 PSP, 168 PT, 106 PTFONT, 117, 118, 127 PTSIZE, 117, 127 PURPLE, 125 NAMESW, 166 NBAR, 106 NCOLS, 49 nested FOR commands, 89 NO FRAMEBOX, 105 NO IMAGEBOX, 105 noise, 196 non-linear models, 258 NONE, 106 norm of weighted sum of errors, 250 normal bar point-type, 106 normal distribution, 19 normal random numbers, 21 NORMRAN, 21 NOT, 29, 30 NOT CONVERGED, 252, 253 NOT=, 30 NROWS, 49 number of columns in a matrix, 49 number of rows in a matrix, 49 numerical precision, 16 OCTAGON, 106 octagon point-type, 106 ODERPT, 280, 296, 301 ODESTR, 286, 292 OFFSET, 117, 121, 127, 133 ON, 84, 86 on-line help, 12 optical spectra, 214 OR, 29, 30 ORANGE, 125 overflow, 18 quadratic equation, 173 quadratic model, 226, 244 quadratic polynomial, 226 quit curve-fitting, 247 quit differential equation solving, 297 quitting MLAB, 13 quotation marks, 129, 131, 174 parabola, 143, 144 parameter, 23 parametric curves, 114 parentheses, 22, 48 parenthesis rule, 19 partial derivatives, 39, 85, 210 radioactive count data, 227 343 RAN, 234 random numbers, 20 ranking data, 82, 83 RANKORDER, 82, 83 rate equations, 237, 247, 254 RBAND, 106 READ, 49, 51–53, 163 read mouse-clicks specifying coordinates, 177 read-file, 159, 163 READON, 163, 164 real discrete Fourier transform, 218 REALDFT, 218, 221 reciprocal-of-variance method, 232 rectangle, 98 recursive functions, 31 RED, 125 redimensioning matrices, 60 relational operators, 38 renaming windows, 142 reports on curve-fitting process, 247 reports while solving differential equations, 296 RIGHT, 122, 133, 134, 143 rightward tick mark, 106 ROOT, 36 roots of a function, 36 ROSE, 125 ROTATE, 72, 192 rotating columns of a matrix, 72 rotating rows of a matrix, 72 row concatenation, 64 ROW matrix assignment command, 64 ROW matrix operator, 62 row number of matrix containing maximum element, 72 row number of matrix containing minimum element, 72 row replication operator, 67 RTICK, 106, 128 running DOS MLAB, 156 running Linux/Unix MLAB, 156 running Macintosh MLAB, 155 running MSWindows MLAB, 155 running NeXTStep MLAB, 156 running Unix MLAB, 156 SAVE, 12, 160, 168 save-file, 12, 154, 158, 160 scalar, 15 scalar arithmetic, 18 scalar assignment, 16 scalar expressions, 16 scalar identifiers, 22 scalar-matrix arithmetic, 73 SCALARS, 22 scalars, 22 scientific notation, 16 screen fraction units, 99 scrolling, 12 searching through a matrix, 86 setting diagonal elements of a matrix, 89 shaded circle, 201 shading polygons, 190, 200 SHAPE, 60, 61 SHIFT, 129, 133 shifting text, 134 shifting titles, 129, 133 shooting method, 300 short dash line-type, 106 simplifying graphics, 142 sine, 19 singular value decomposition of a matrix, 213, 215 SIZE, 129, 133 SMARKER, 106 SMOOTH, 194, 199, 204 smooth curves, 112 smoothing functions, 194 SOLID, 106 solid line extending to the bottom image border, 106 solid line extending to the left image border, 106 solid line extending to the right image border tick mark, 106 344 solid line extending to the top image border, 106 solid line with marker skipping line-type, 106, 117, 204 solid line with marker skipping using spline curves line-type, 106 solid line-type, 106 solving a third-order differential equation, 290 solving boundary value differential equation, 300 solving differential equations, 280, 281 solving first-order differential equations systems, 290 solving linear equations, 93 solving systems of first-order differential equations, 283 SORT, 70, 87 SORT matrix operator, 71 sorting matrices, 70 SOSQ, 246 special cases of differentiation, 38 special functions, 19 square point-type, 106, 110 square root, 19 SQUARES, 106, 110 stability of differential equation systems, 210 STAR, 106 star point-type, 106 starting MLAB, 1 startup-do-file, 158 STARTUP.DAT, 2 STARTUP.DO, 2 STDEST, 246 step function, 192, 196 step functions, 26 step-size, 293 step-specified sequences, 54 STEPGRAPH, 192 stick-figure drawing, 115 stiff systems of differential equations, 295 stopping MLAB, 176 string, 15 string addition, 131 string array, 15 string modification command codes, 136 submatrices, 62 subtraction, 18 SUM, 33, 34 sum-of-squared-error criterion for curve-fitting, 226 sunspot cycle periodicities, 219 surface, 15 surface contours, 203 SVD, 213, 215 SVMARKER, 106, 204, 208 systems of first-order differential equations, 283 tabulating function values, 83 tangent, 19 tangent bar point-type, 106 TBAR, 106 terminating an MLAB session, 13 third-order differential equation, 290 tick marks, 106, 126, 128 TITLE, 11, 128, 133, 143, 148 title, 15, 98 title angle, 129, 133 title color, 129, 133, 134 title font, 129, 133 title identifiers, 131 title modifications, 134 title names, 131 title offset, 133 title place, 133, 134 title position, 129, 133 title size, 129, 133 TITLES, 141 titles, 128, 138 titles for graphs, 128 TO, 99, 100 TOLSOS, 251 TOP, 122, 133, 134, 143 TPOLAR, 191 transfer function calculation, 220 345 transforming a system of differential equations to canonical form, 293 TRIANGLE, 106 triangle point-type, 106 trigonometric functions, 19 trigonometric model, 258 TrueType fonts, 326 TURQUOISE, 125 tutorial, 1 TYPE, 5, 22, 24, 26, 40, 72, 141, 148, 166, 170, 281 TYPEOUT, 31, 32 typing out matrices, 59, 73 WEIGHT, 245 weighted root mean square error, 252 weighted sum of absolute values of errors, 250 weighted-sum-of-squared-error criterion, 229, 236, 238, 248 WEIGHTS, 233, 250 weights, 230, 232 WEXPAND, 143 WFIX, 143 WFLOAT, 143 WHITE, 125 WINDOW, 11, 100, 101, 142, 143, 147, 203 window, 15, 98 window names, 101 window-3D, 15 WINDOWS, 139 windows, 138 WITH, 245 WMATCH, 143, 203 WNICE, 143 WORLD, 117, 121, 133 world units, 117, 121 WREAD, 177, 181, 183 WSHRINK, 143 WSLACK, 143 UBAND, 106 UNBLANK, 138, 139, 148 underflow, 18 uniform (0, 1) random numbers, 20 unit aspect ratio, 143, 203 unknown identifier, 15 UNVIEW, 7, 96, 138, 147 upward tick mark, 106 USE, 13, 160, 168 user clipping rectangle, 98, 103, 129, 143, 146 user rectangle, 98, 103, 129, 143, 146 UTICK, 106, 128 X point-type, 106 XAXIS, 126–128 XERRBAR, 106 XLOGTICK, 106 XPT, 106 van der Pol oscillator, 210 variable dashed line with marker skipping linetype, 106, 110, 204 variable dashed line with marker skipping using splines line-type, 106, 204, 208 variable resolution circle point-type, 106 VBAR, 106, 192 vector field arrow point-type, 106 vector length operator, 77 vertical bar point-type, 106, 192 vertical error bar point-type, 106 vertical logarithmically-spaced tick marks, 106 VIEW, 5, 96, 138, 147 VIOLET, 125 VMARKER, 106, 110, 204 YAXIS, 126–128 YELLOW, 125 YERRBAR, 106 YLOGTICK, 106 zeroes of a function, 36 W, 144, 146 346