1
Participant
2
3
4
5
6
7
8
10
11
12
13
14
15
16
17
18
19
20
Average
Correspondence [%]
22
67
11
78
78
100
0
100
56
56
11
0
78
67
78
100
78
22
56
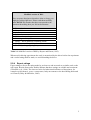
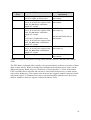
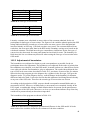
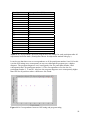
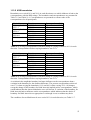
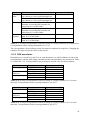
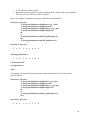
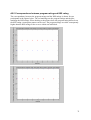
Table 11.4: Correspondence between program and OSS ratings for each participant after all
adjustments had been made. (Participants chosen for adjustment marked with grey.)
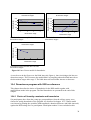
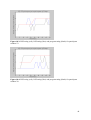
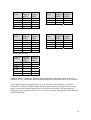
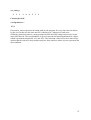
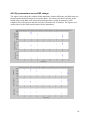
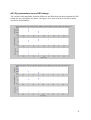
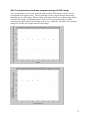
It can be seen that there was no correspondence at all for participant number 8 and 14. In this
case the OSS ratings were consequently at step zero although the program gave a higher
diagnose. The program diagnoses were consequently four for participant number 8 and
consequently three for participant number 14. The correspondence was also low for
participant number 2, 13 and 20. Also here the program diagnoses were consequently higher
than OSS for all positions where a difference was found.
.
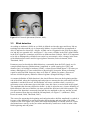
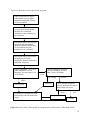
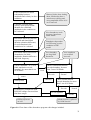
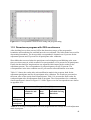
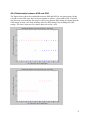
Figure 11.2: Correspondence between OSS rating and program rating
50